3.1. Microstructure
The microstructures obtained by STEM from samples 10-50-NA, 10-80-NA, SST-80-NA, 23-80-NA, 43-80-NA and 93-80-NA are shown in
Figure 1,
Figure 2 and
Figure 3.
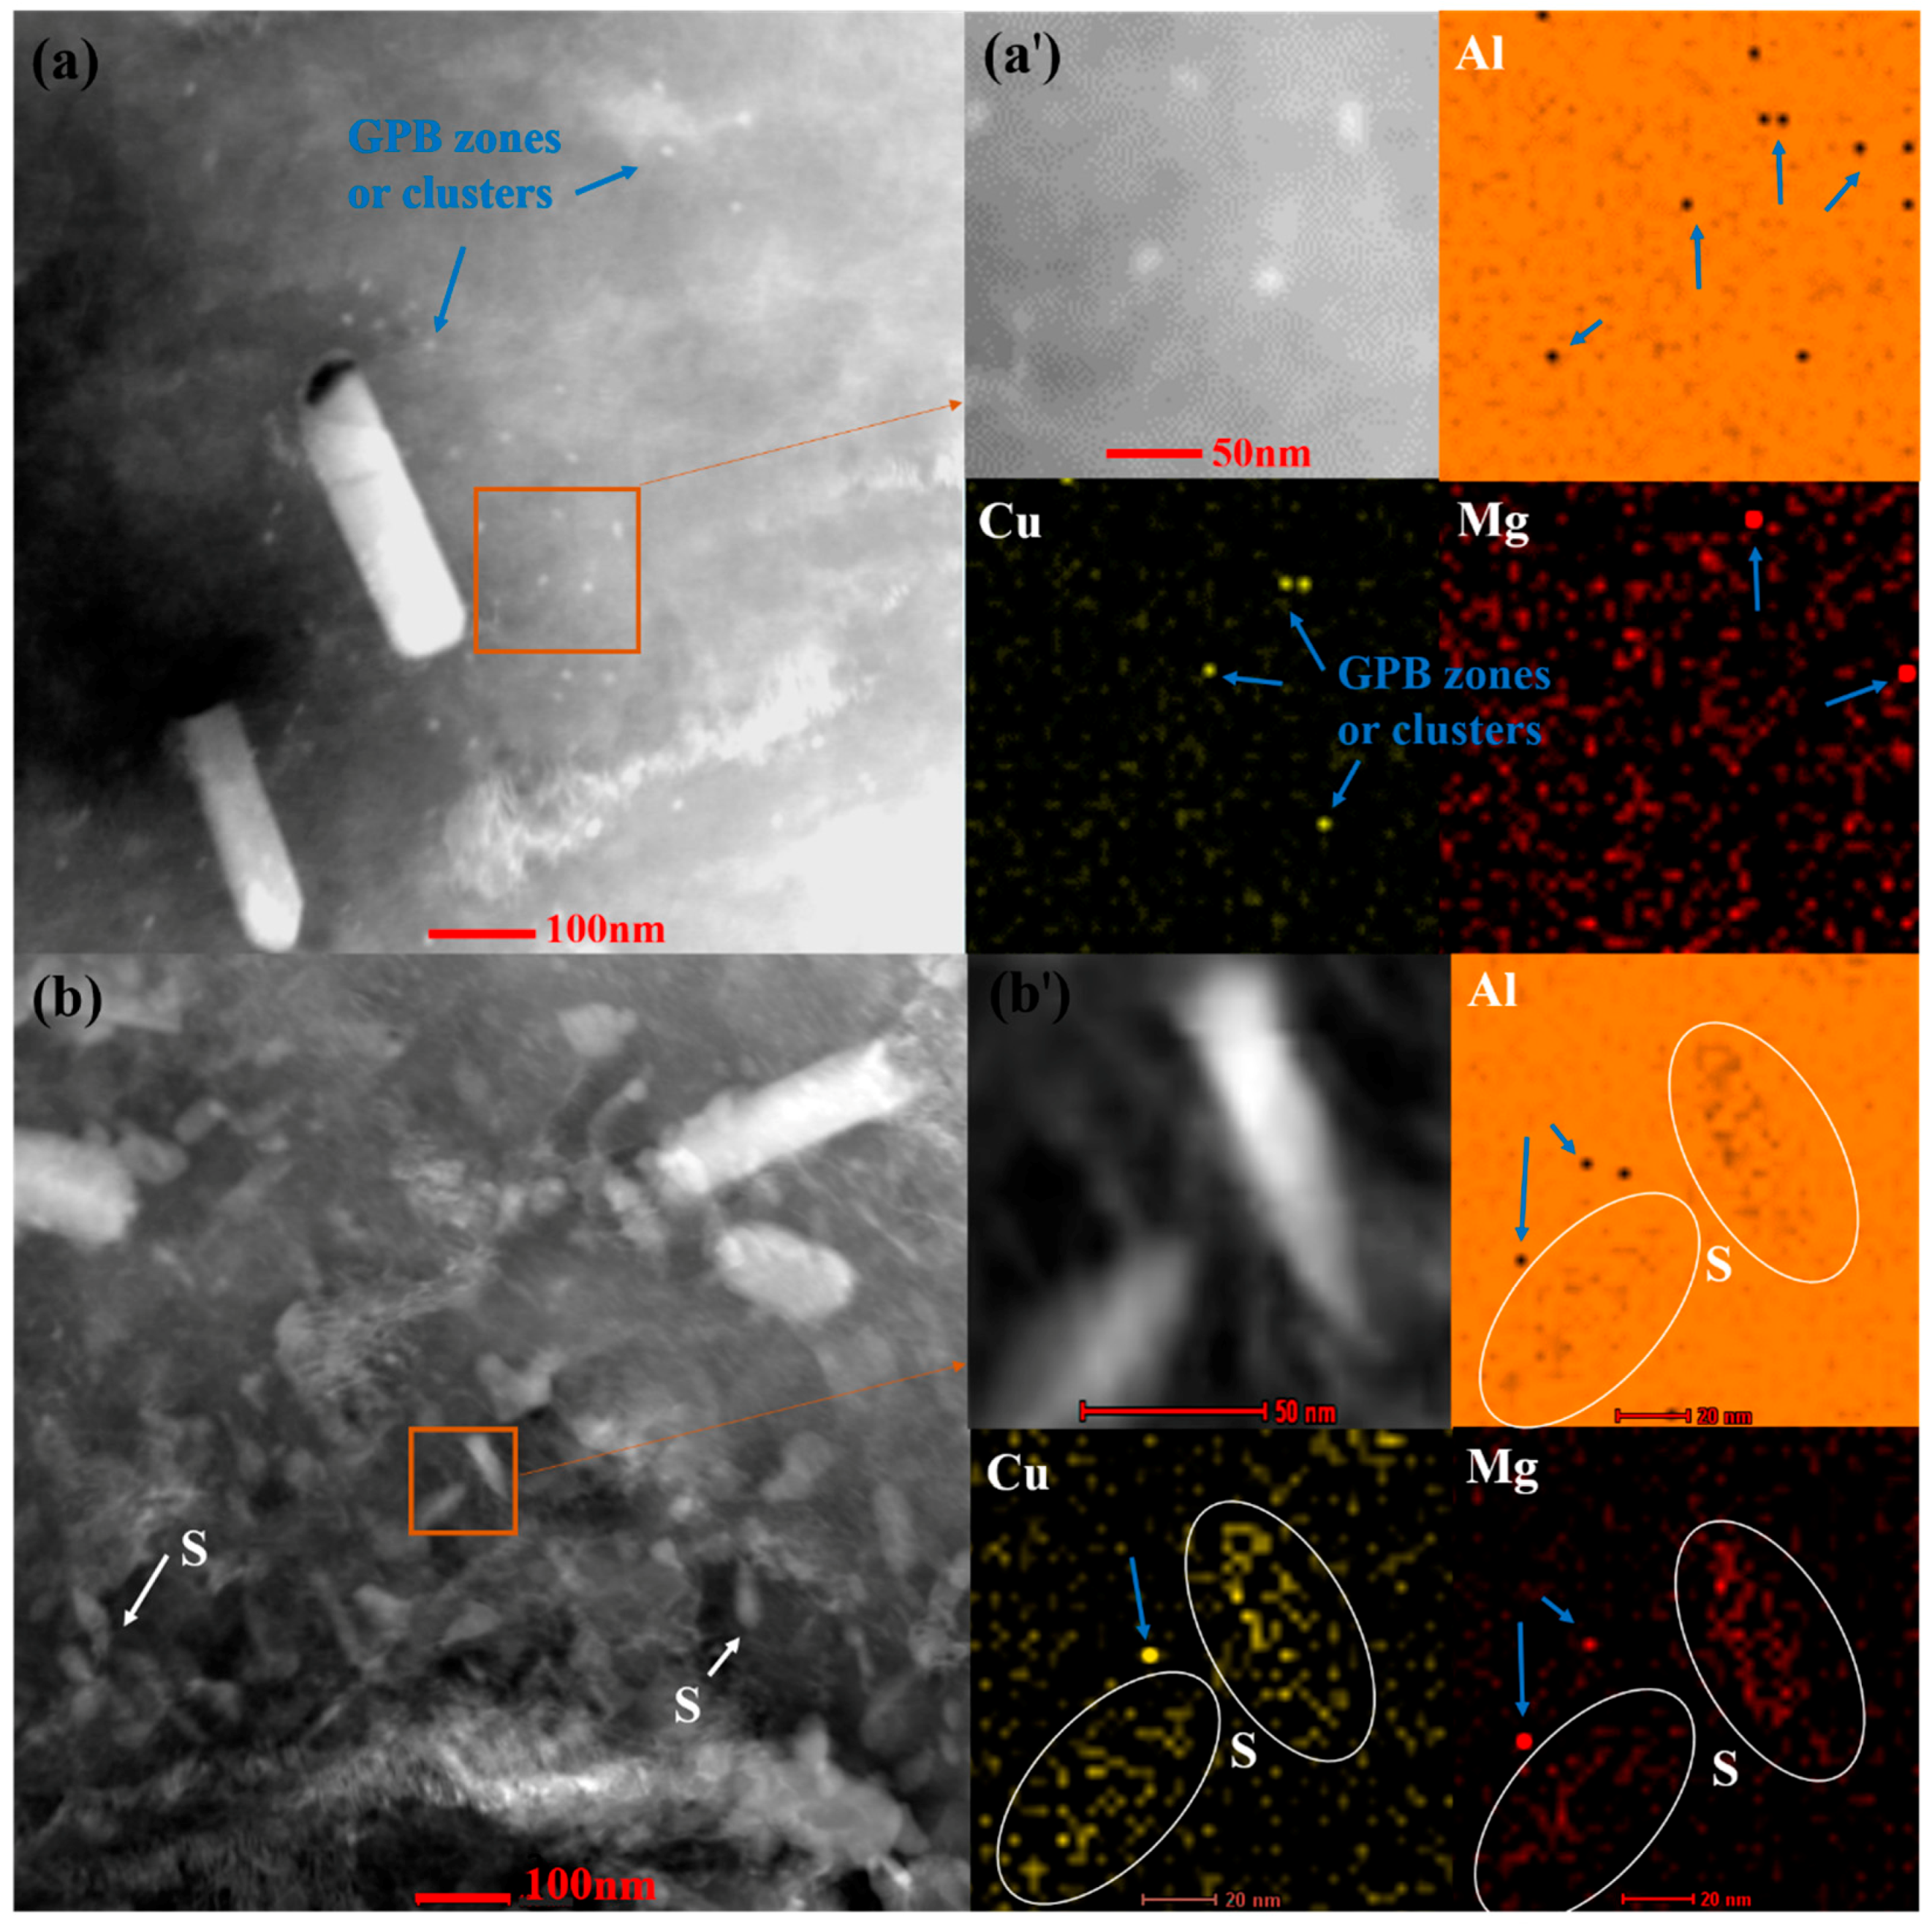
For sample SST-80-NA, the microstructural feature is very evident: some sporadic scattered Cu and Mg “atomic clusters” or GPB zones with relatively small volume fraction (
Figure 1a). The darker points detected on the elemental map tend to enrich only one element of Cu or Mg (
Figure 1a′), indicating that they are still in the early stage of nucleation. After aging for 23 h, a large number of nano-sized S precipitates and some clusters or GPB zones appear, as shown in
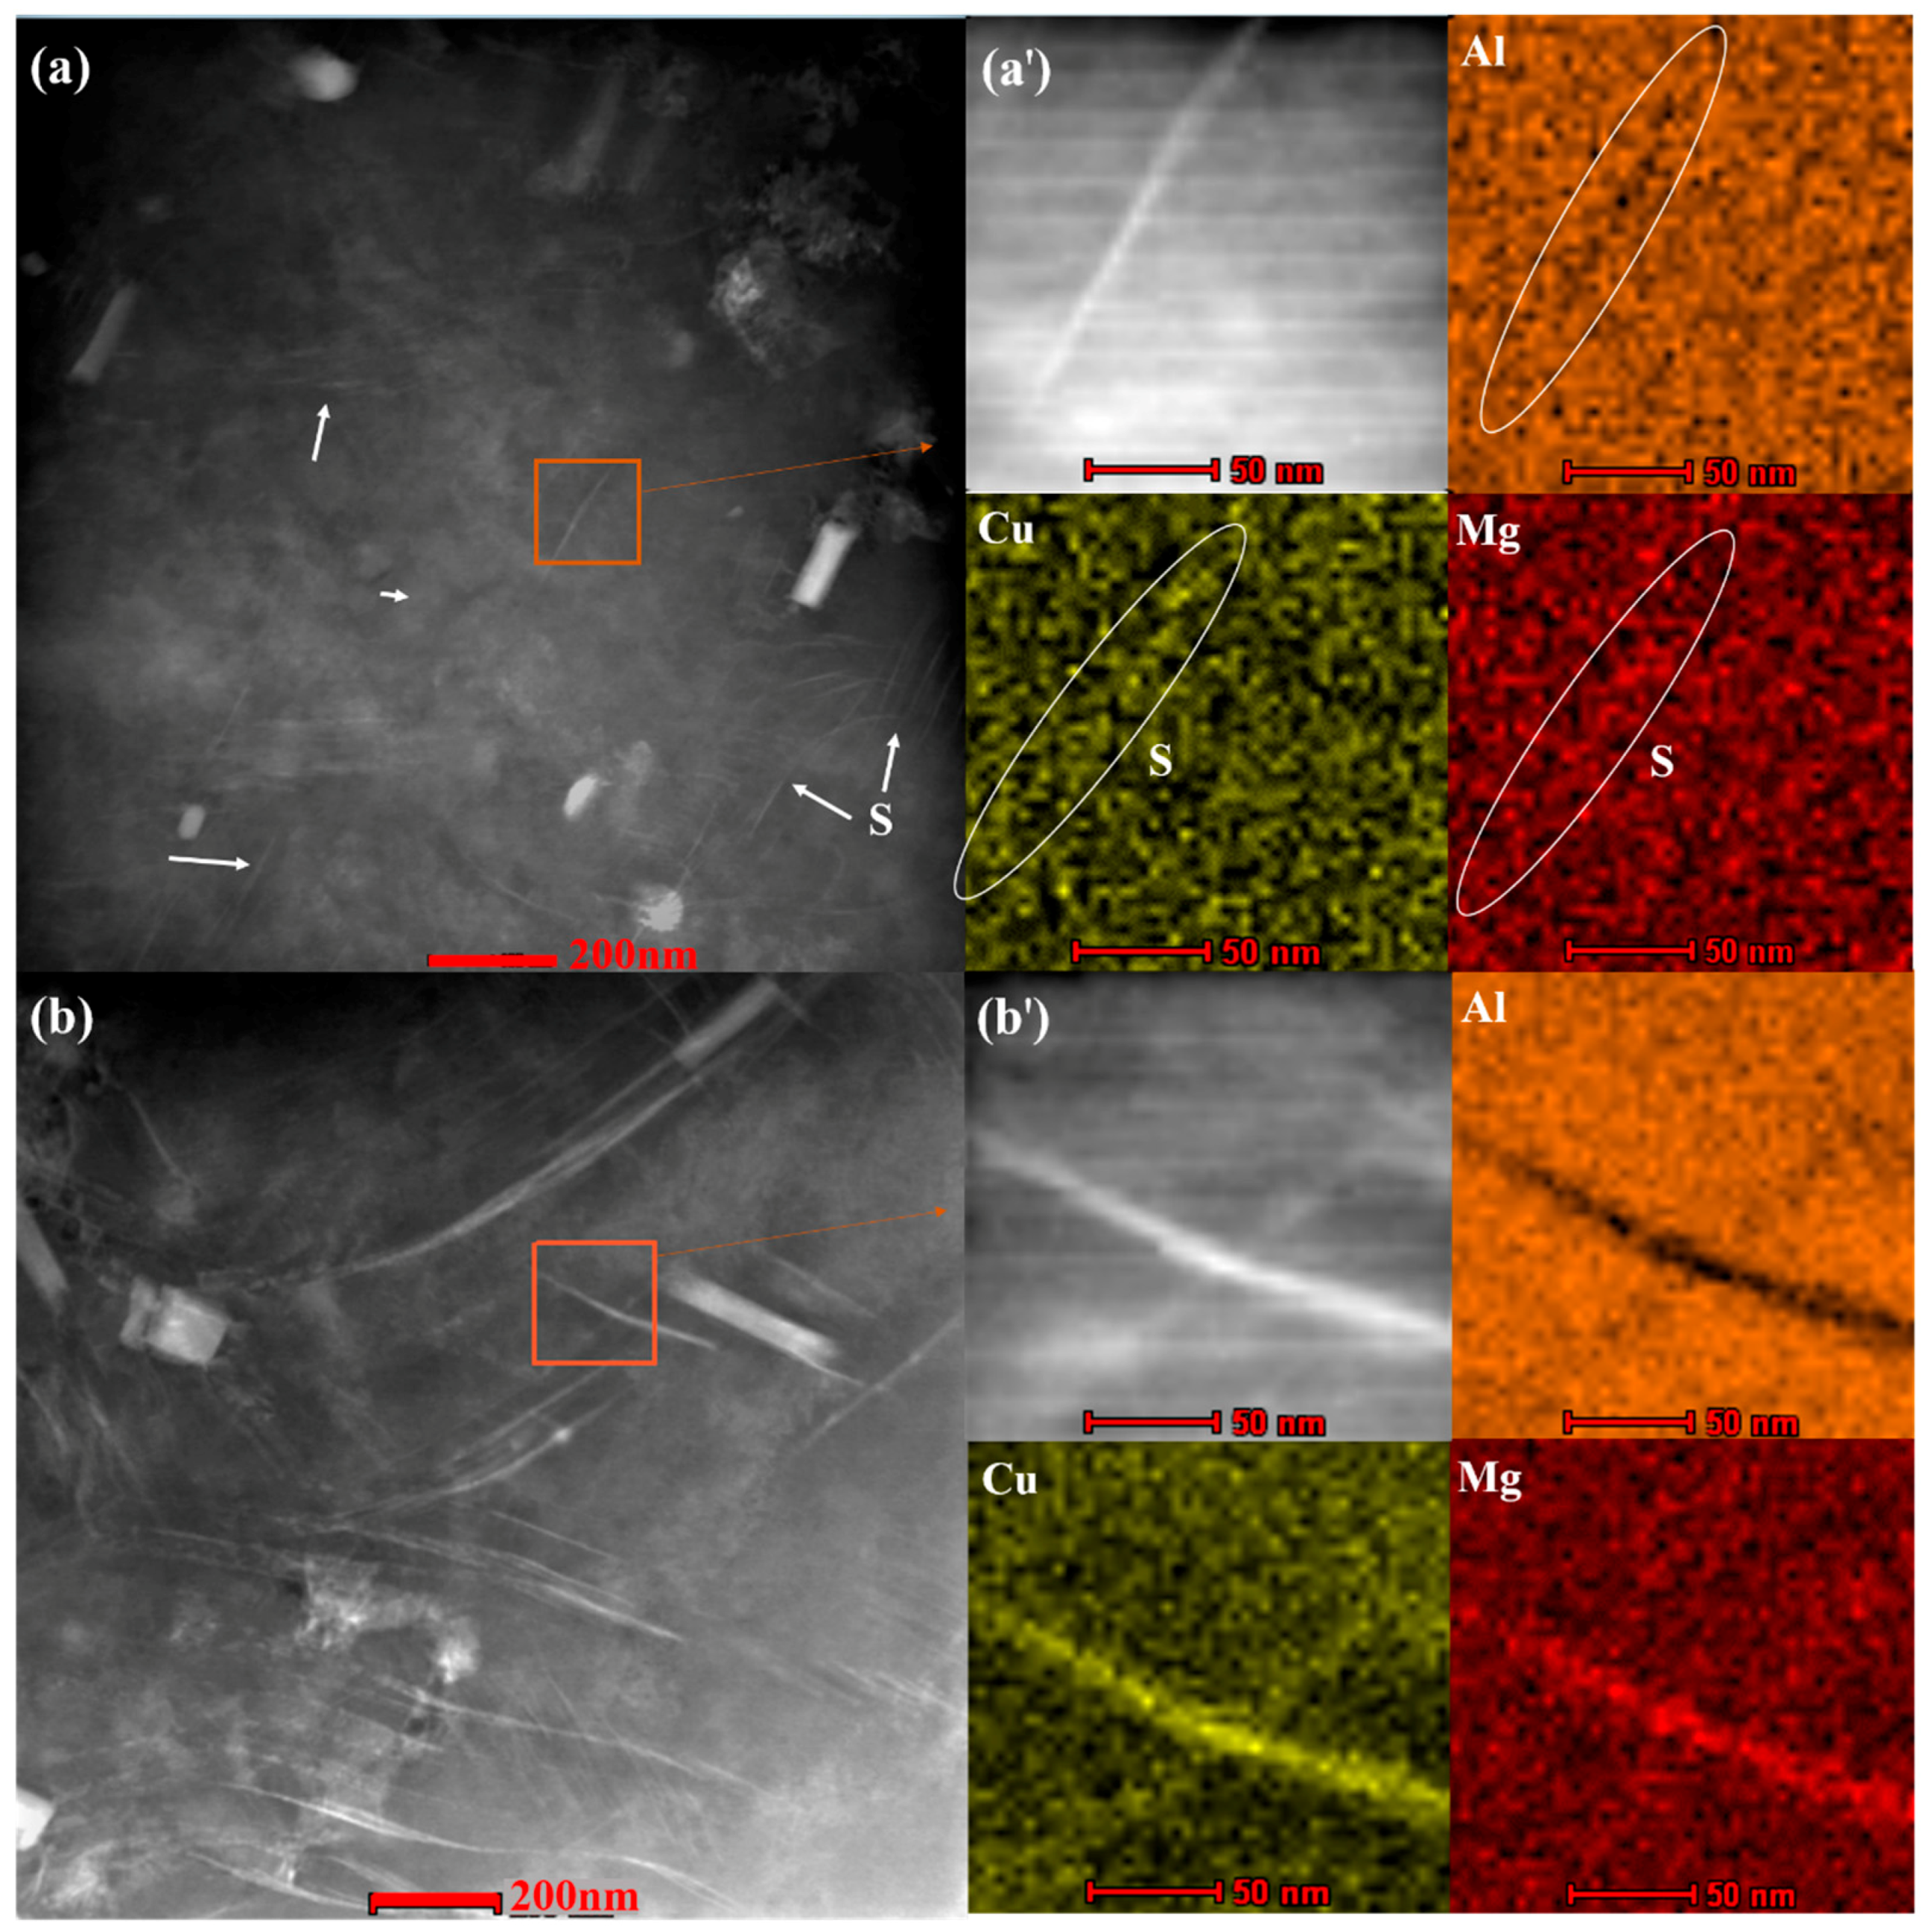
Figure 1b. The amount of S precipitate is slightly increased in 43-80-NA, compared with the corresponding case of 23 h aging (
Figure 2a). An extensive network of large S-phase laths is present at 93 h of aging (
Figure 2b), and the length of the S phase reached hundreds of nanometers in 93-80-NA (
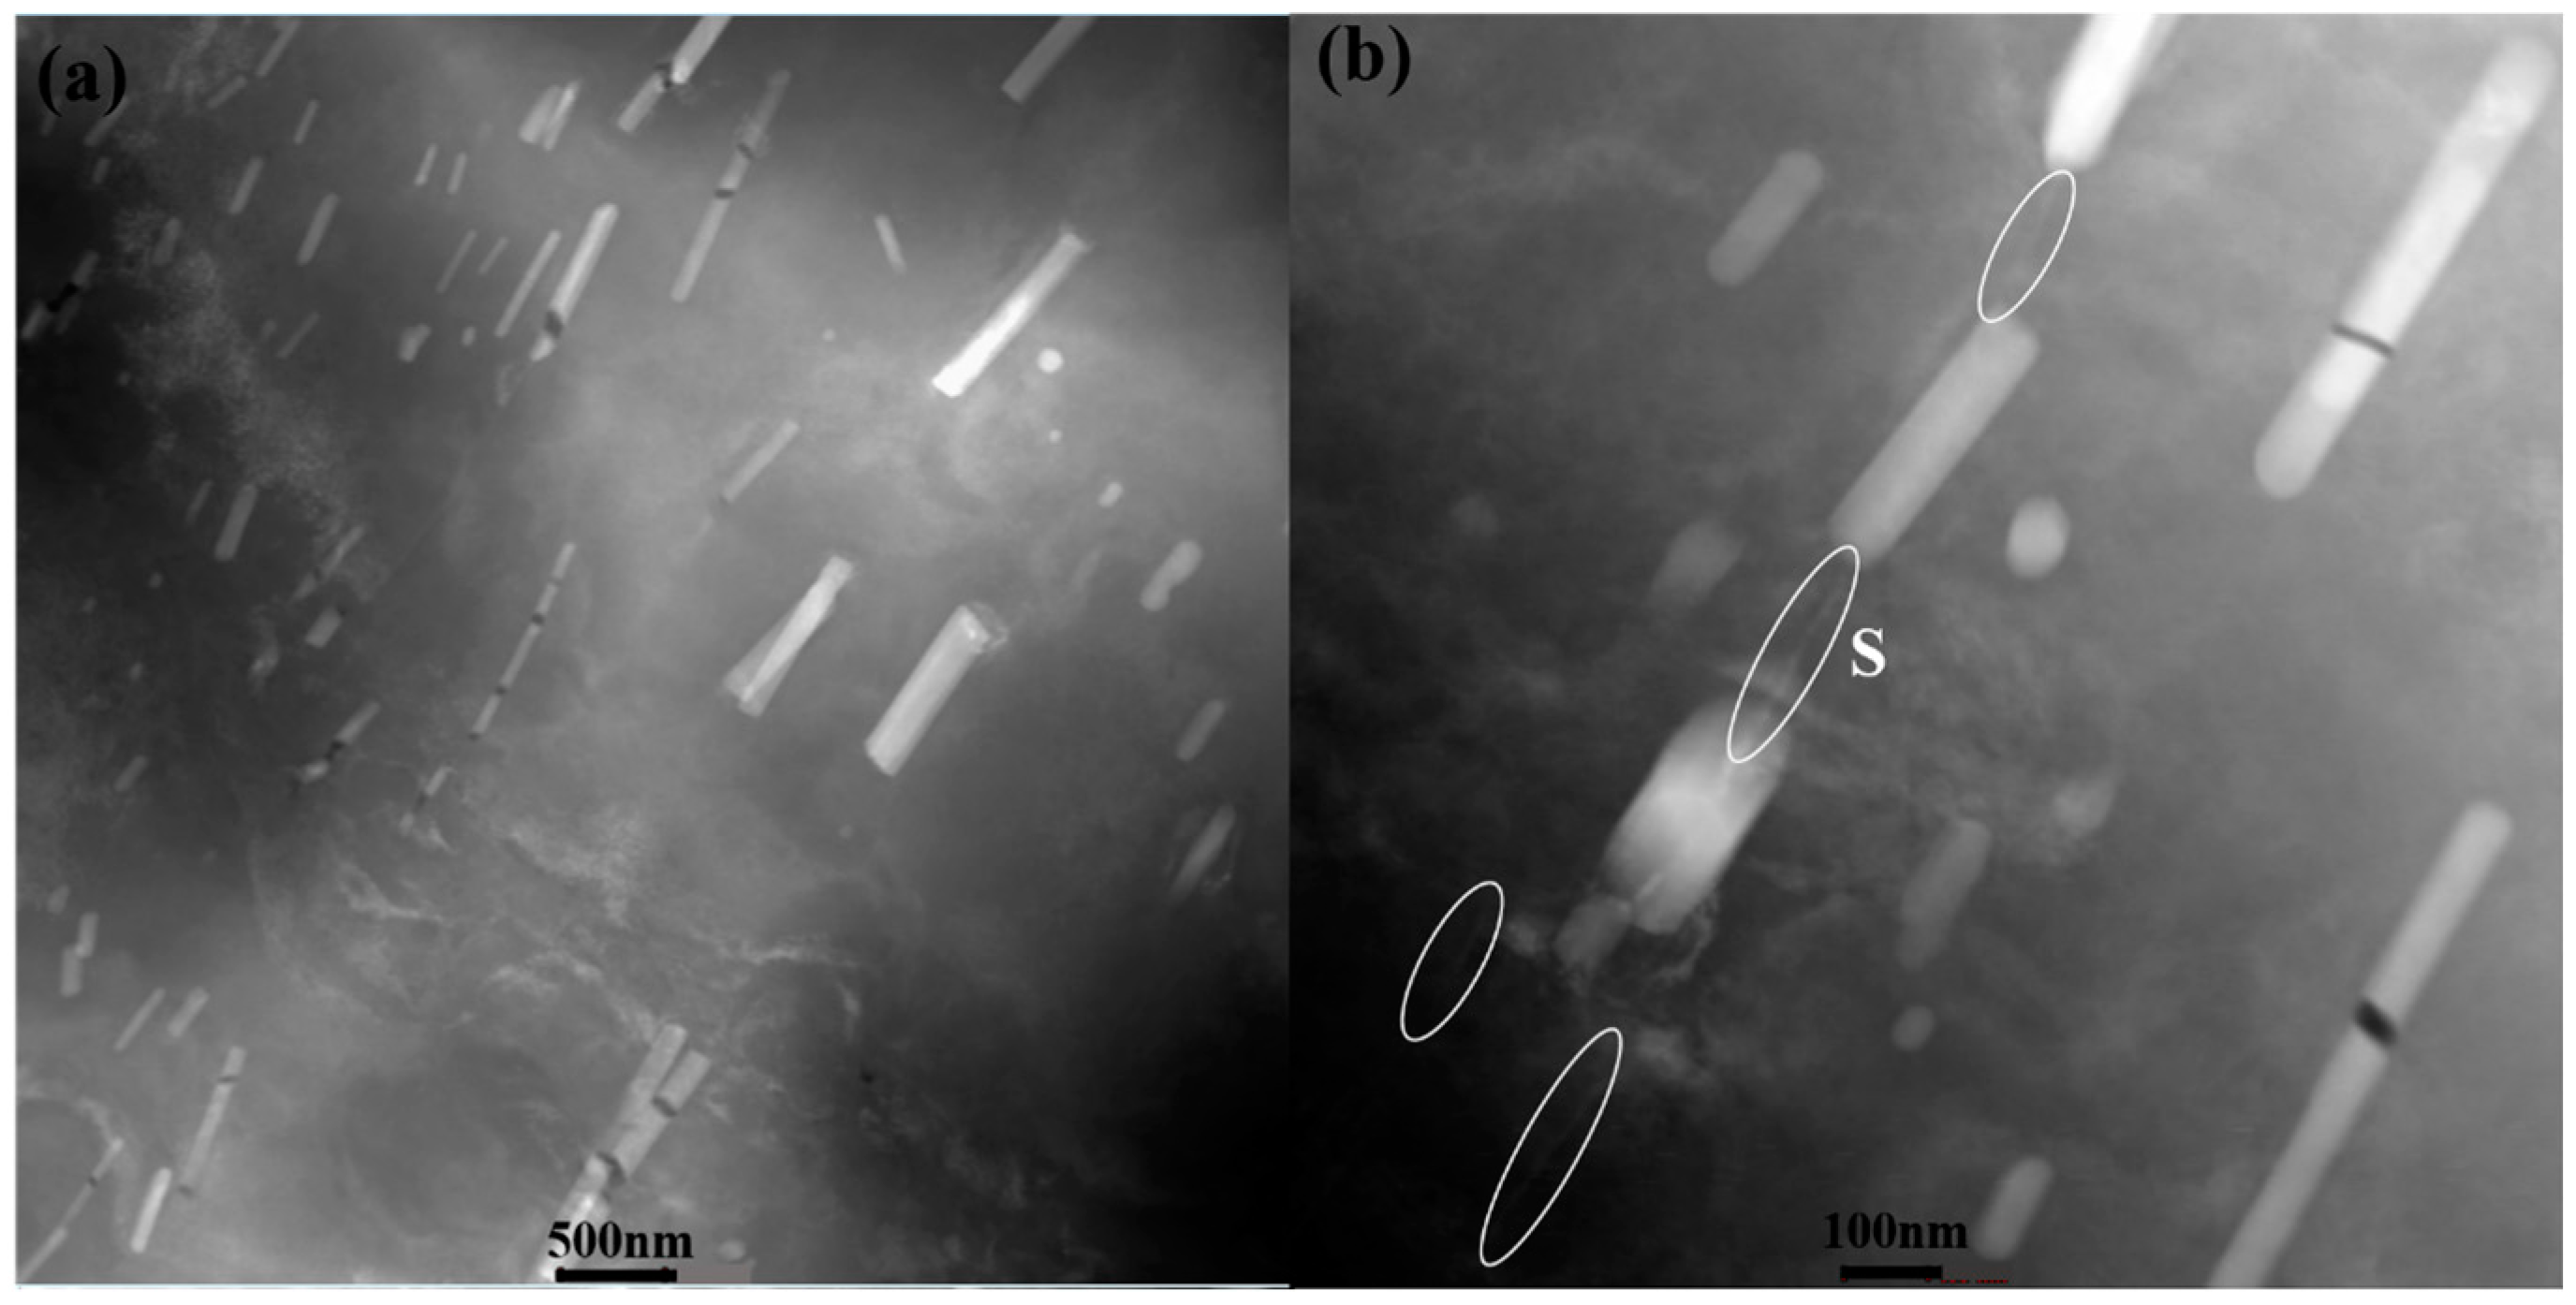
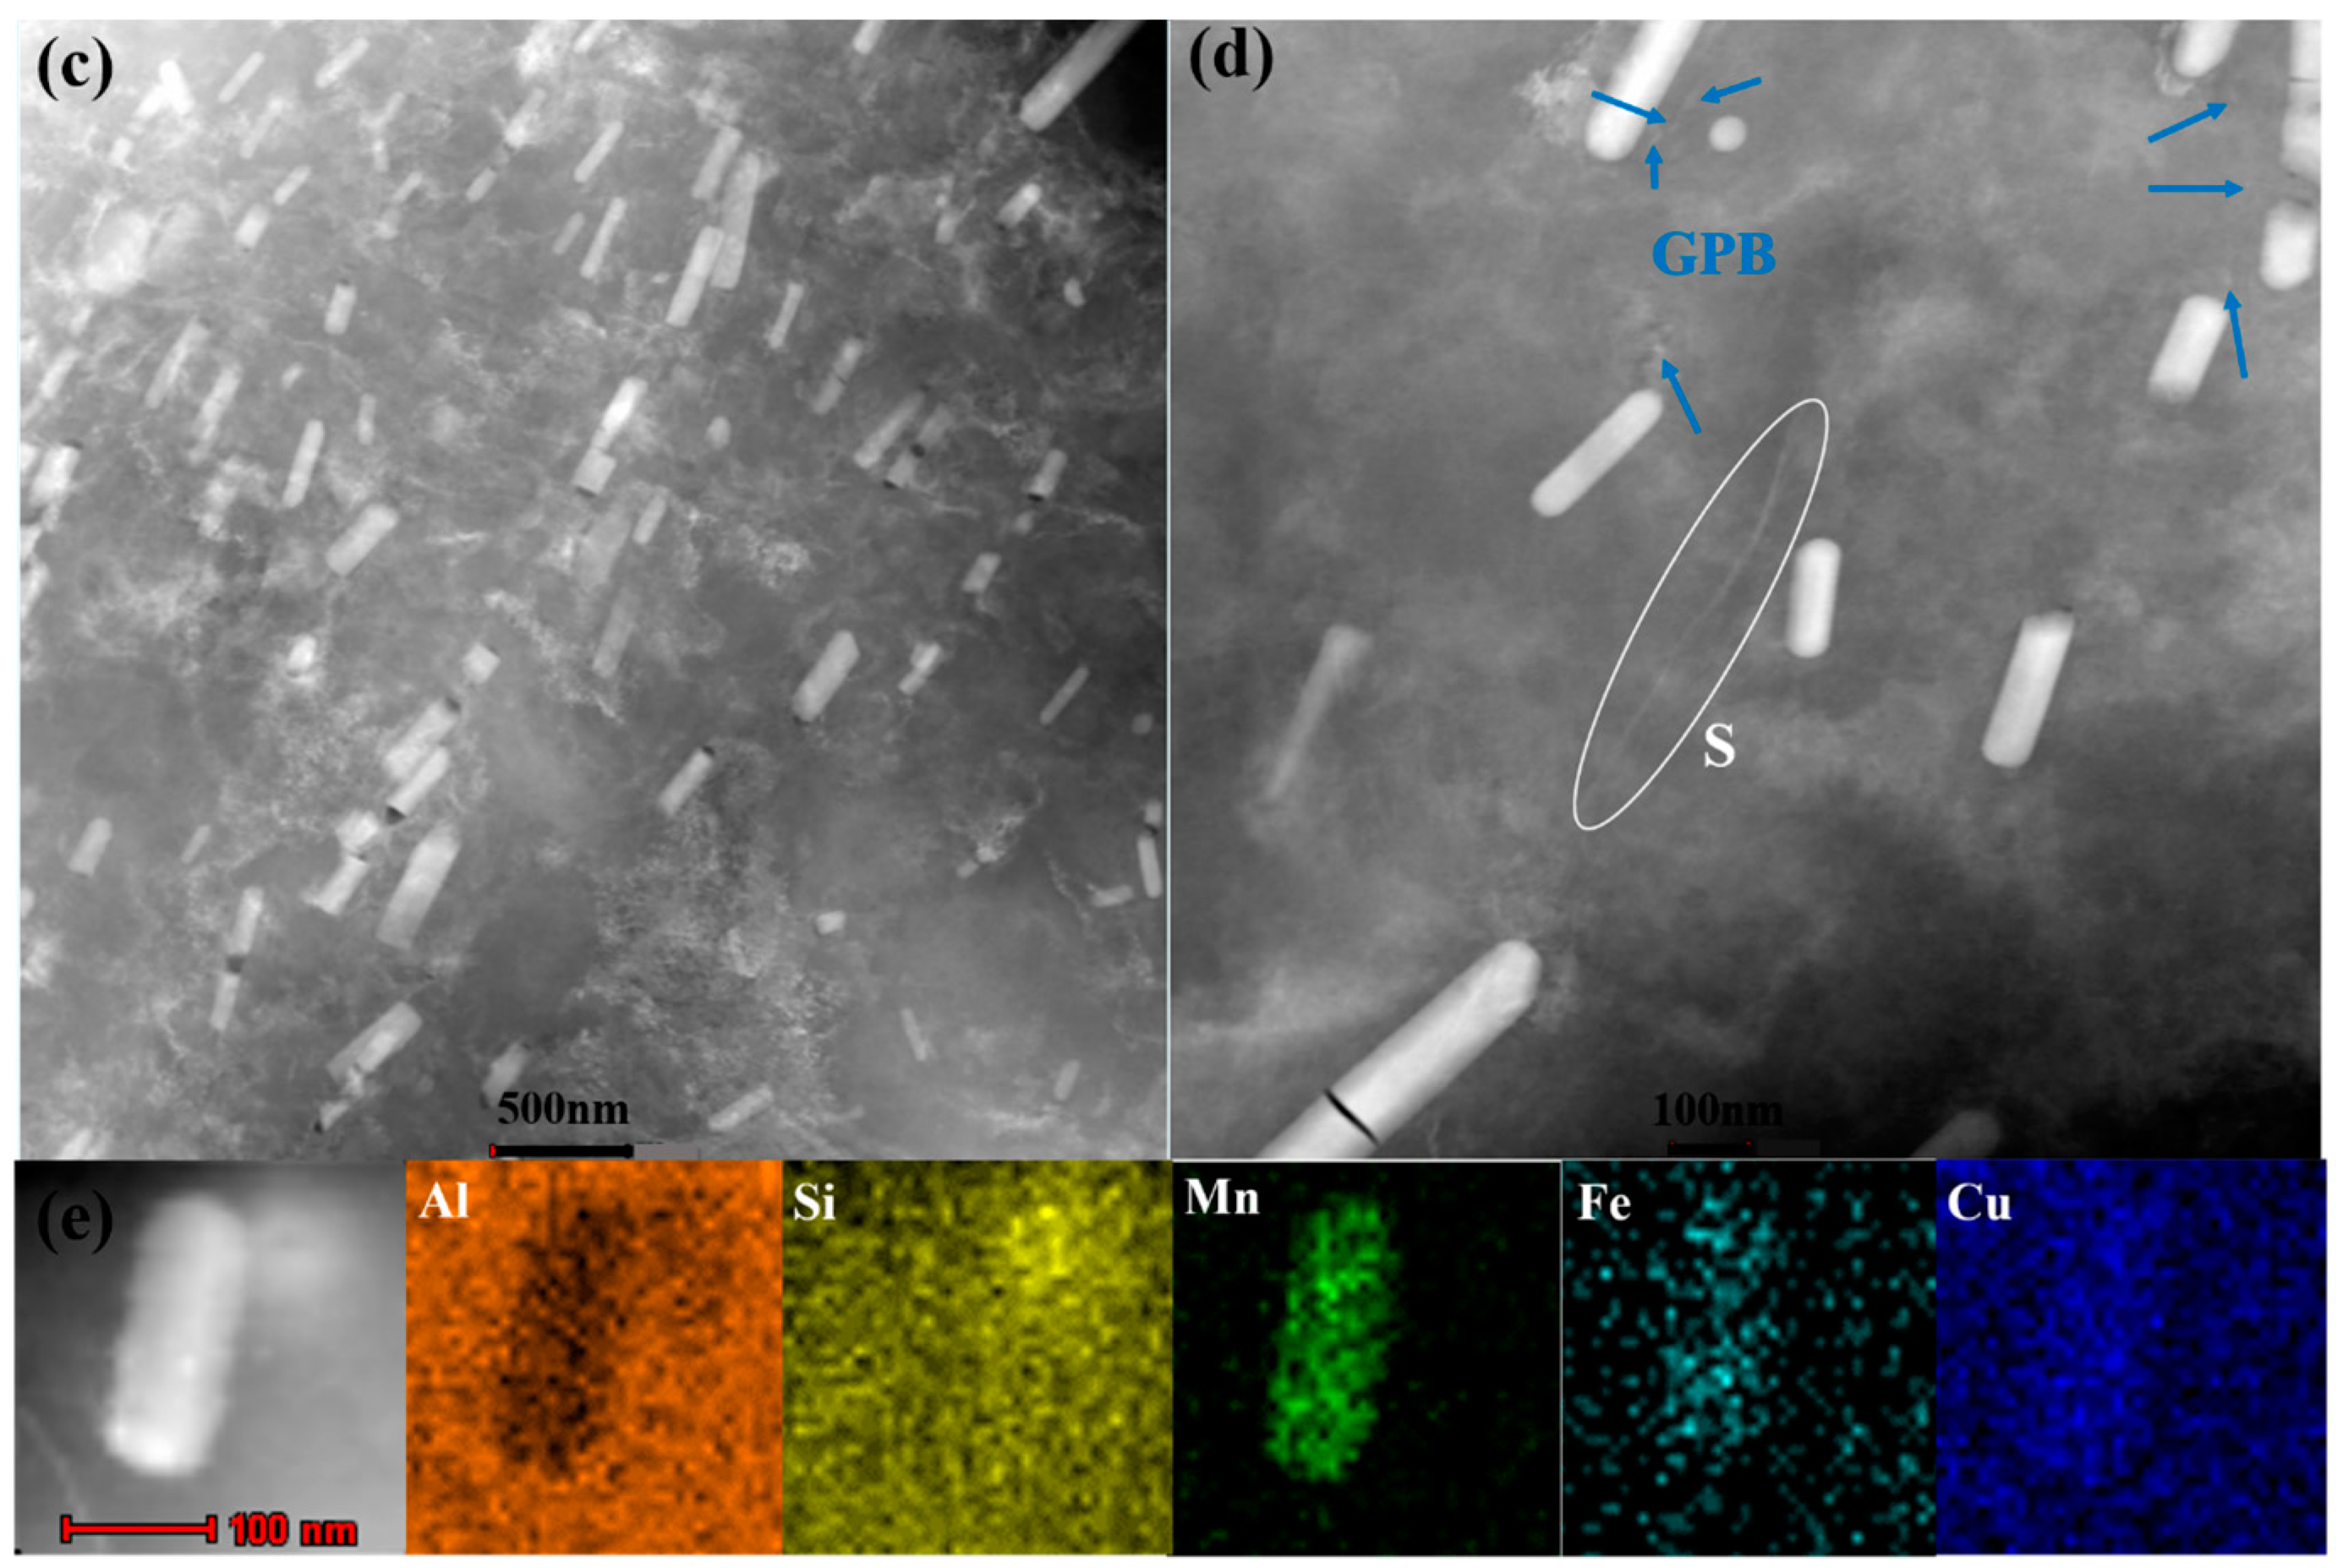
Figure 2b), which is approximately several times of the laths present after 23 or 43 h of aging. High density of dislocations are tangled inside all the deformed samples, which are beneficial for the formation of precipitate embryos. As the strain increases, the dislocation density increases significantly (
Figure 3a,c). S phase particles were observed in 10-50-NA (
Figure 3b), while some GPB zones were detected in 10-80-NA (
Figure 3d). Rod-shaped T-phase dispersoids are randomly distributed in the matrix and the elemental maps show that the T phase is enriched in Fe, Mg, Si and Cu (
Figure 3e). The variation in size and number of particles could be of significant importance in terms of pitting susceptibility, and will be discussed later.
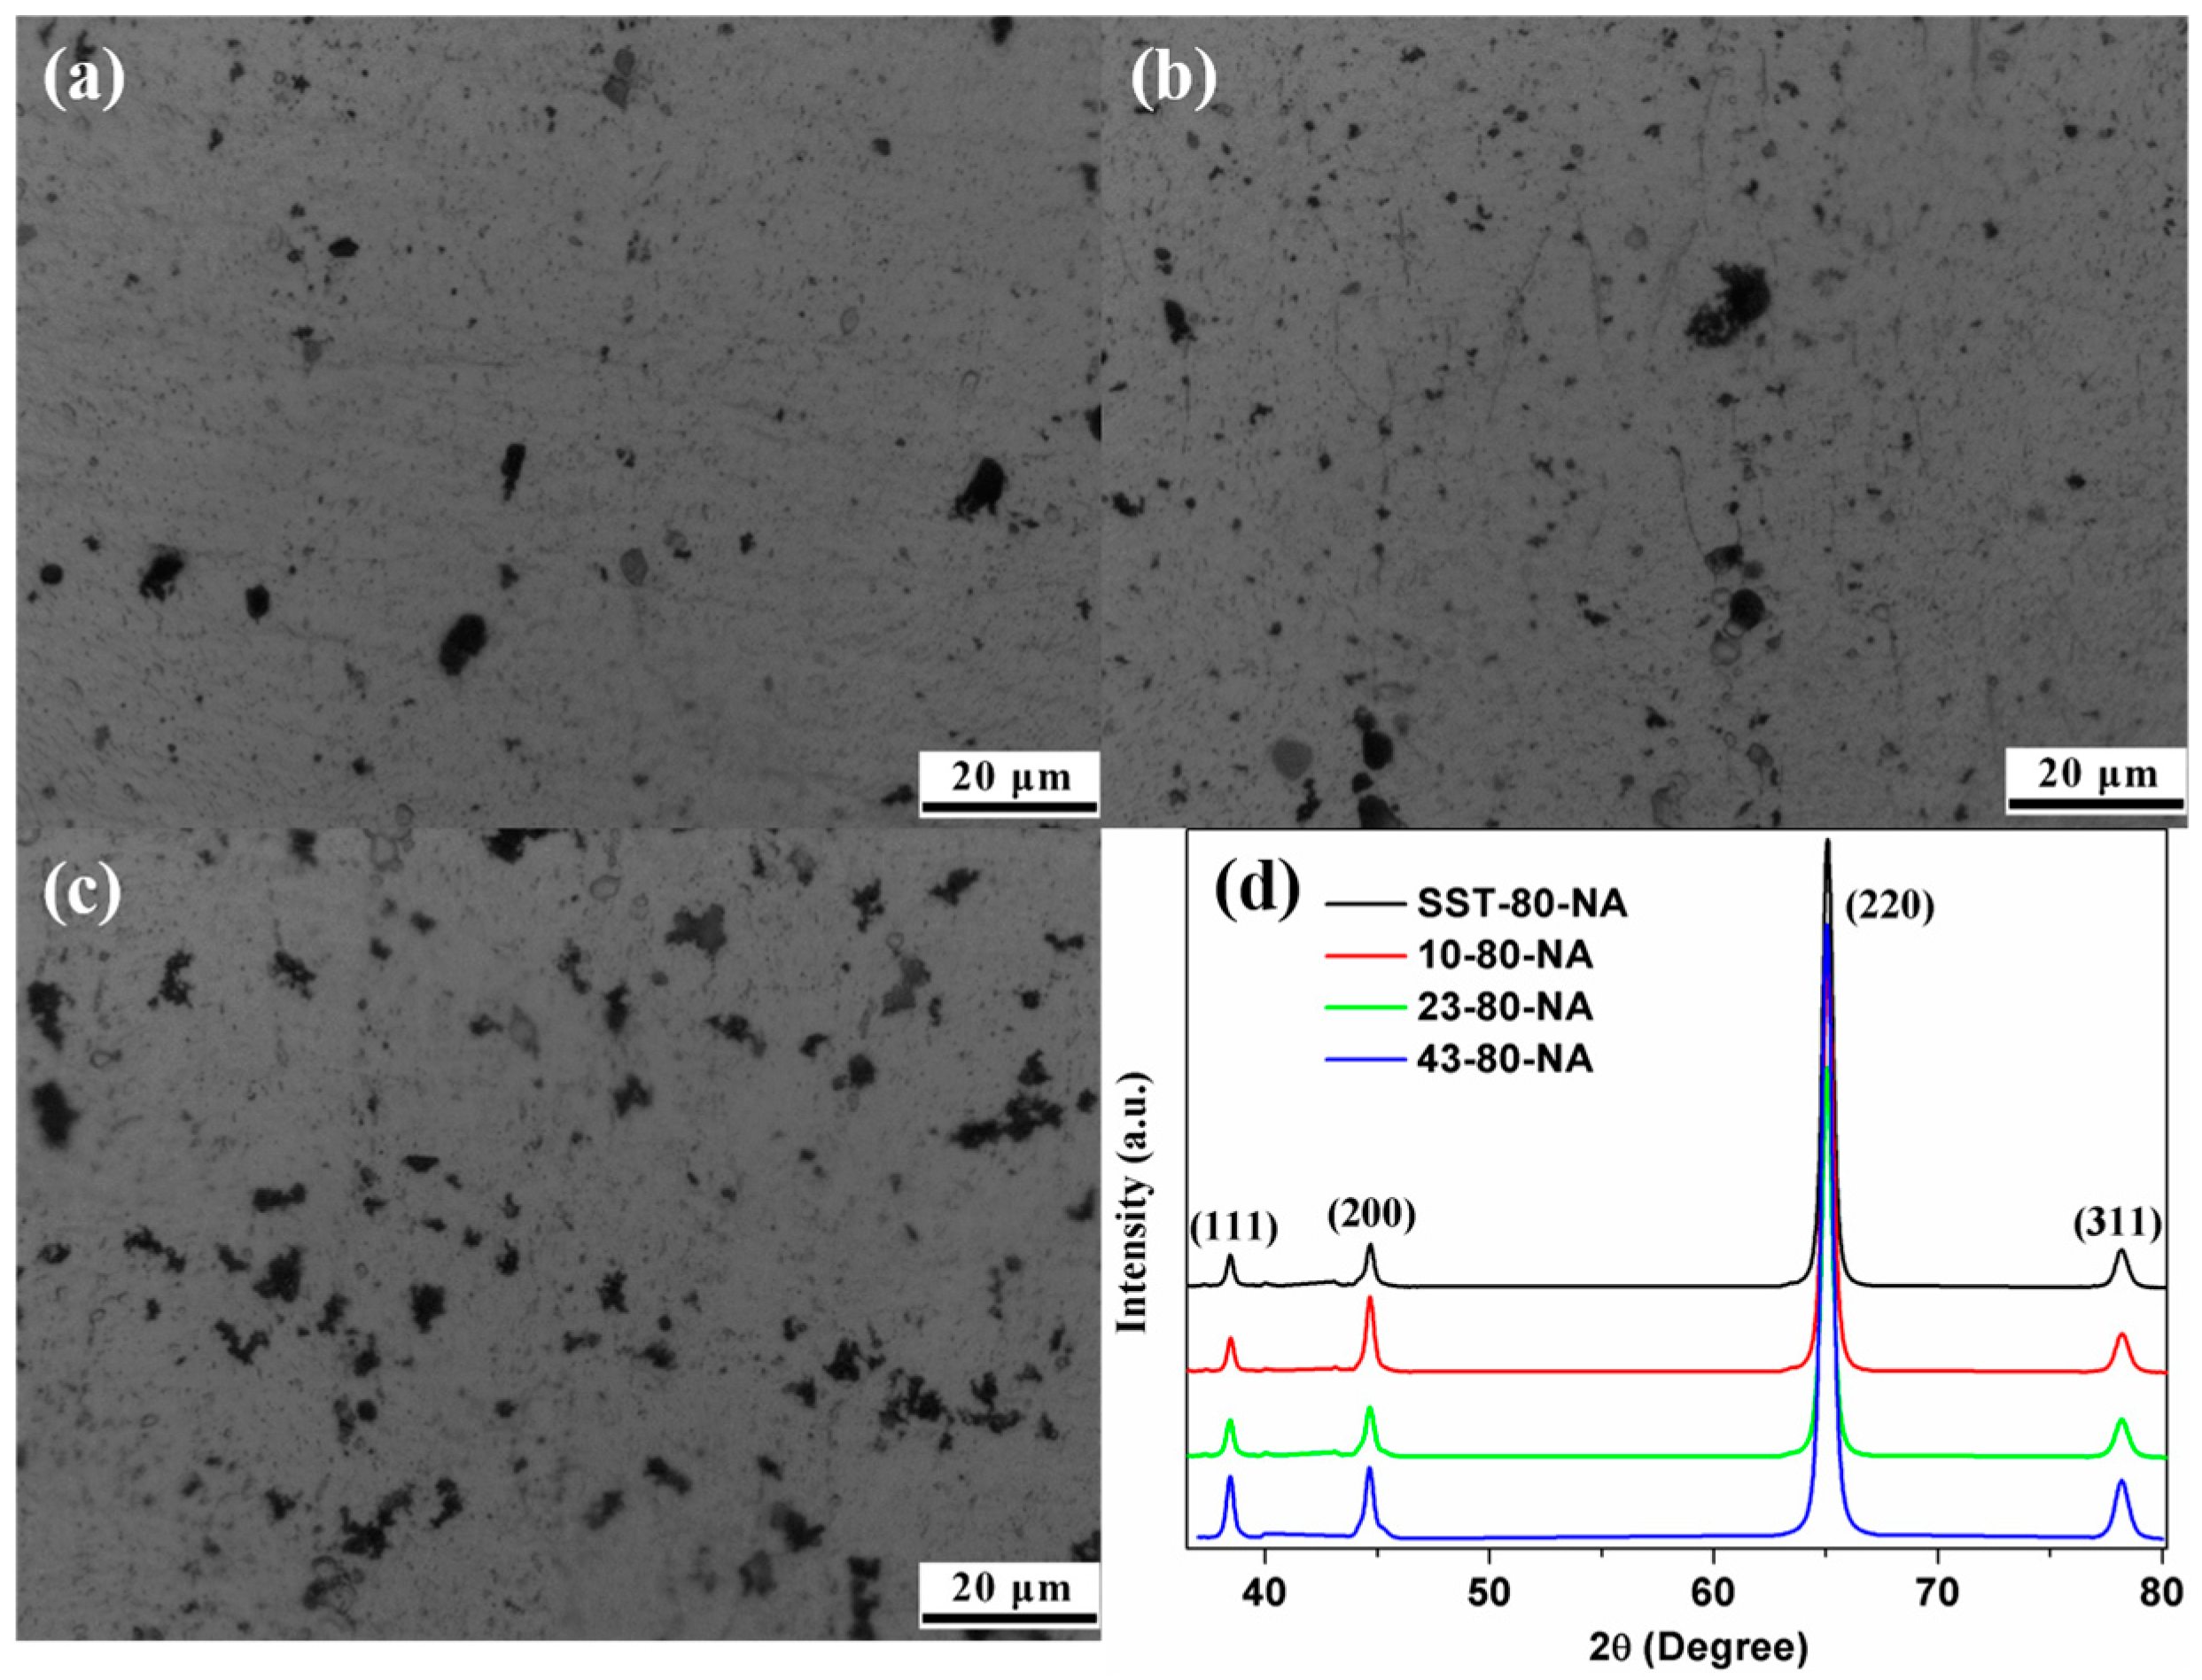
Figure 4a–c depicts the optical microscopy micrograph of the natural aging AA 2024. The surfaces of the samples are very smooth overall with relatively low roughness. As the pre-aging time was extended, black spots increased slightly. Larger black spots may be inclusions or intermetallic compounds (such as undissolved θ (Al
2Cu) or Fe-rich phases [
13])), and small ones maybe the pits caused by the corrosion of the keller reagent (
Figure 4a–c). The XRD patterns of different pre-aging time samples are very similar (
Figure 4d) with (220) preferred orientation, and they are basically remain unchanged after rolling [
1]. The crystallite (sub-grain) sizes calculated from the XRD result [
3,
13] of samples with 80% strain is about 200 nm, almost the same as the rolling state [
1]. While the he sub-grain size of the 40% strain and 27% strain samples reached about 800 nm~1 μm. The grain boundary of the original equiaxed grain is damaged in the rolling process to form sub-grain, and it is slow to recover at room temperature.
3.2. Corrosion Behavior Measurements
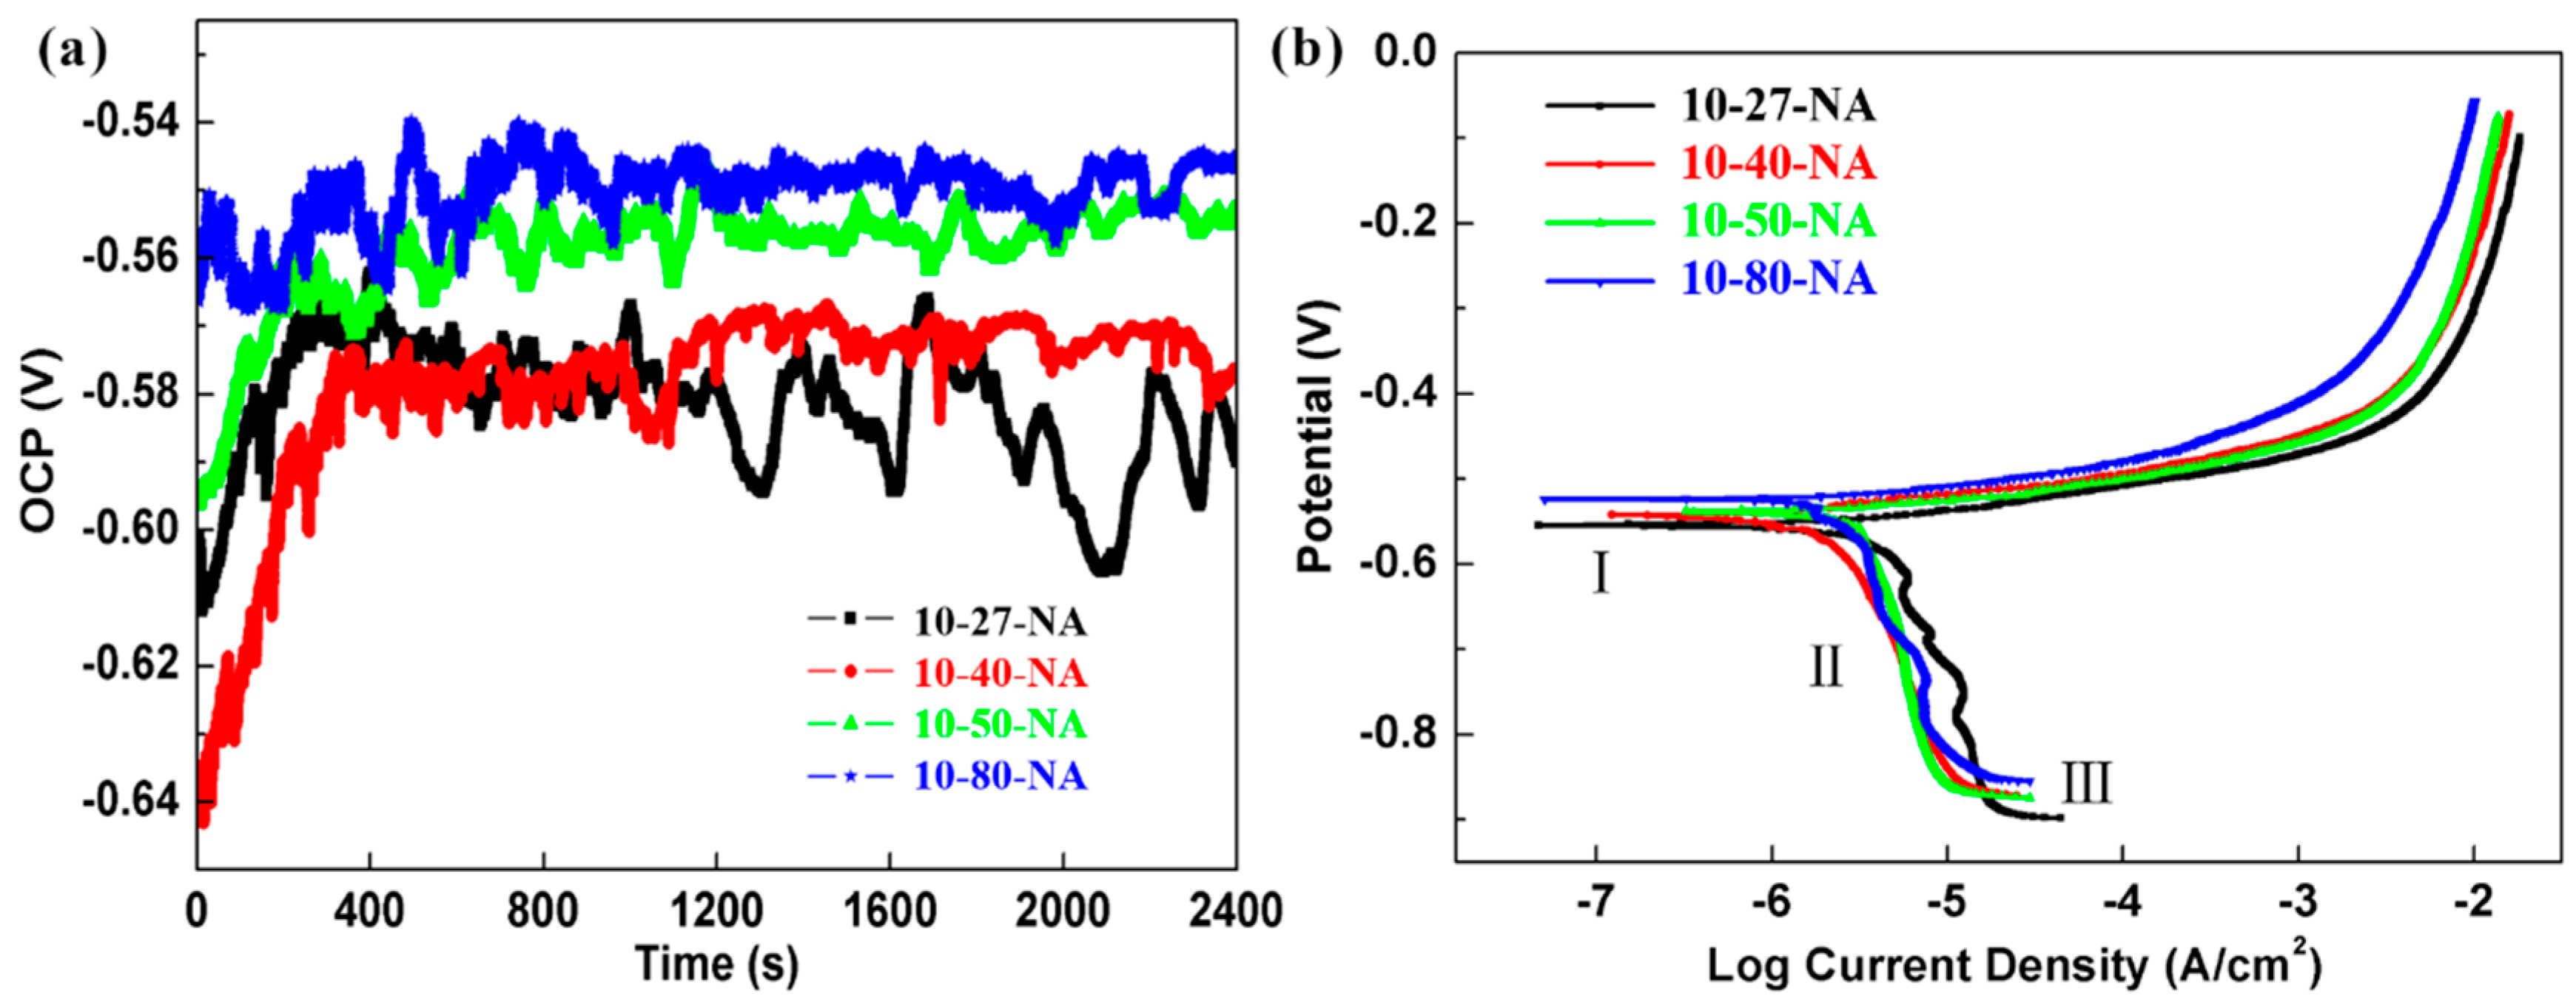
Representative plots of the OCP of samples with different strain in 0.1 M NaCl solution are shown in
Figure 5a. The reproducibility of experimental curves for per case of study is very good, and for the convenience of observation, one of them is used for display (the same applies hereinafter). It took about 350 s before 10-27-NA and 10-40-NA to reach a relatively steady-state, although the transient currents of 10-27-NA still remain very large in the later stage, which is indicative of pitting event. The OCP shifts to noble values with the increasing of strain. The sample with 80% thickness reduction possesses the highest OCP and spends a minimum time to reach stable state, indicating the minimum corrosion tendency. The results show that the corrosion resistance is improved with strain increasing, and the PDP plots and EIS tests were carried out to further investigate the electrochemical characteristics of all the samples.
The PDP curves in 0.1 M NaCl solution are presented in
Figure 5b. The pitting formation potential (
Epit) is very close to and even lower than the corrosion potential (
Ecorr). Therefore, no obvious passivation behavior was observed, which is consistent with the results in other’s work [
25]. The anodic dissolution zone is wide, and the anodic current increases fast. The cathodic branch can be divided into three stages [
26]. Stage I is the weak polarization region just below the OCP. Stage II with high cathodic overpotential represents the diffusion controlling region of oxygen reduction zone. Oxygen reduction reaction mainly occurred in the stage I and II:
Thus, Al(OH)
3 can be formed on the electrode:
which could prevent oxygen reduction on the electrode surface as a kind of colloidal precipitate. Therefore, the current density rise slowly in stage II. The current density increases rapidly in stage III due to the hydrogen evolution reaction. The
Ecorr and corrosion current (
Icorr) were obtained by Tafel extrapolation method as shown in
Table 3 (The fitting error analysis of duplicate samples were also annotated). The
Ecorr of these four samples is between −0.53 V and −0.56 V. Compared with the 80% strain alloy (about 1.38 μA/cm
2), the
Icorr of 10-27-NA increased by 0.2 μA/cm
2, reaching 1.58 μA/cm
2. The cathodic current density of 10-27-NA fluctuates greatly in stage II, indicating that the chemical stability is slightly worse and there are many transient processes.
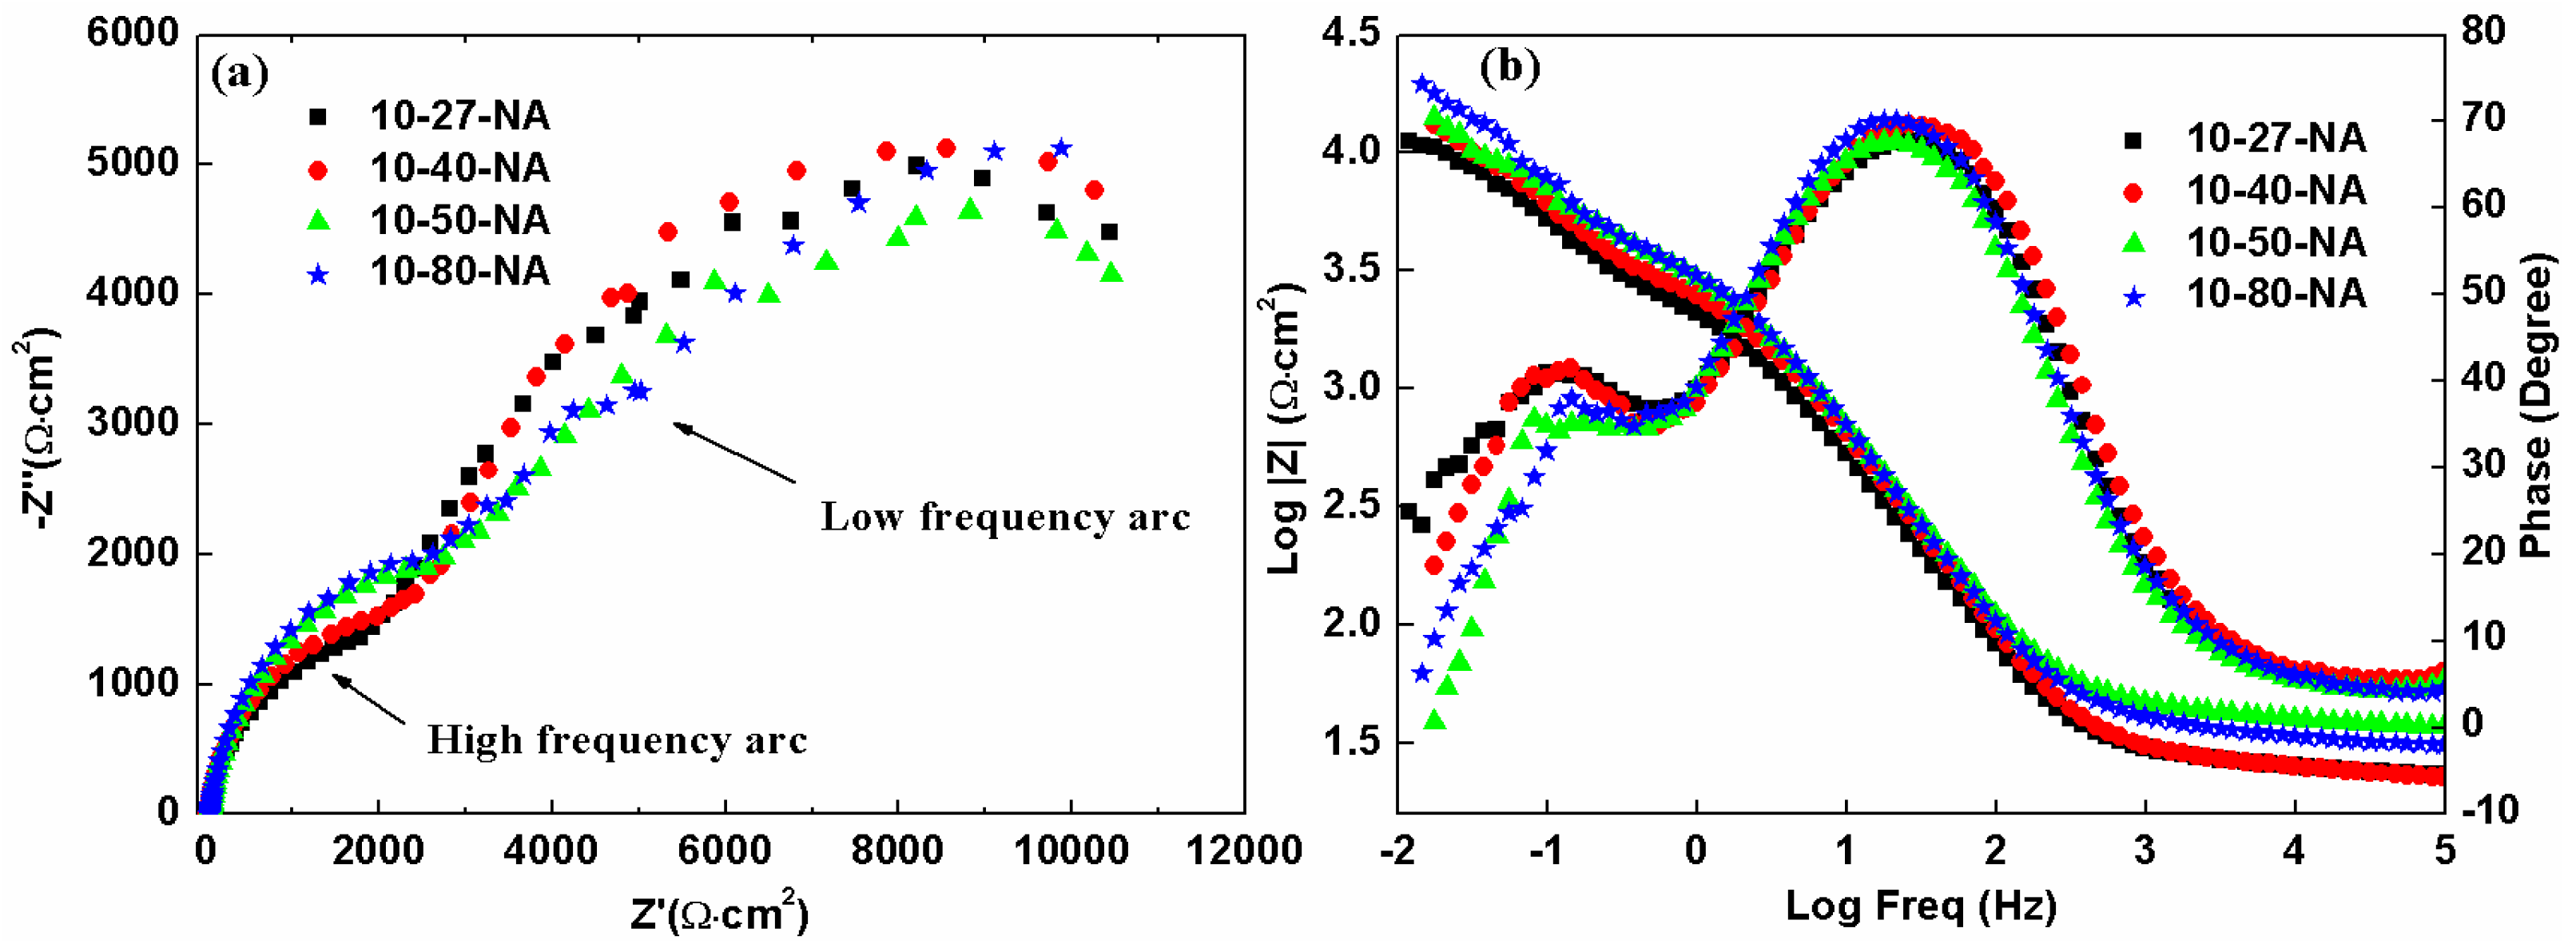
Figure 6 shows the EIS curves obtained in 0.1 M NaCl solution of samples with different strain. All Nyquist graphs share the same shape with two apparent depressed capacitive arcs, indicating that at least two different reaction processes are involved. The high frequency arcs of 10-80-NA and 10-50-NA samples is slightly larger (
Figure 5a). Two time constants are observed in the Bode plot, which is consistent with the Nyquist plot, indicating that the AA 2024 is sensitive to Cl
− and is susceptible to pitting corrosion [
7,
27].
To simulate the EIS data, the equivalent circuit with two time constants in
Figure 7a is applied. The equivalent circuit consists of the solution resistance (
Rs), charge transfer resistance (
Rct) and double layer capacitance (
Qdl).
Rl and
Ql are related to the impedance and capacitance of the oxide layer formed in the air of the AA 2024. In this system, pitting corrosion of the oxide film leads to the time constant at low frequency and is affected by precipitated particles.
Q is the constant phase element to compensate the surface heterogeneity and inhomogeneity. The capacitance of
Q can be calculated by the Equation [
28]:
where
Y0 and
n are the fitting parameters of
Q that are obtained by fitting EIS data with ZsimpWin software (version 3.10) and ω
max is the angular frequency at which the imaginary part of the impedance (
Z″) has the maximum value. The value of the capacitance is proportional to the
Y0 according to Equation (3). Fitting of the equivalent circuit was performed by means of professional computer program ZsimpWin and this equivalent circuit has been successfully used in our work and an example (sample 10-40-NA) of the fitted EIS plots are given in
Figure 7b,c. The value of fitting parameters are shown in
Table 4. The
Ydl of the double layer capacitance decreased with the increasing of strain. The
Rct of the four samples was 5150, 6209, 6750 and 8939 Ω·cm
2, respectively, and increased with strain, which is the result of the combined effect of grain size and precipitates and will be discussed in
Section 4. Due to the continuous filling-overflow-re-filling process of corrosion products in the corrosion pits,
Yl and
Rl, which represent corrosion reactions, changed irregularly.
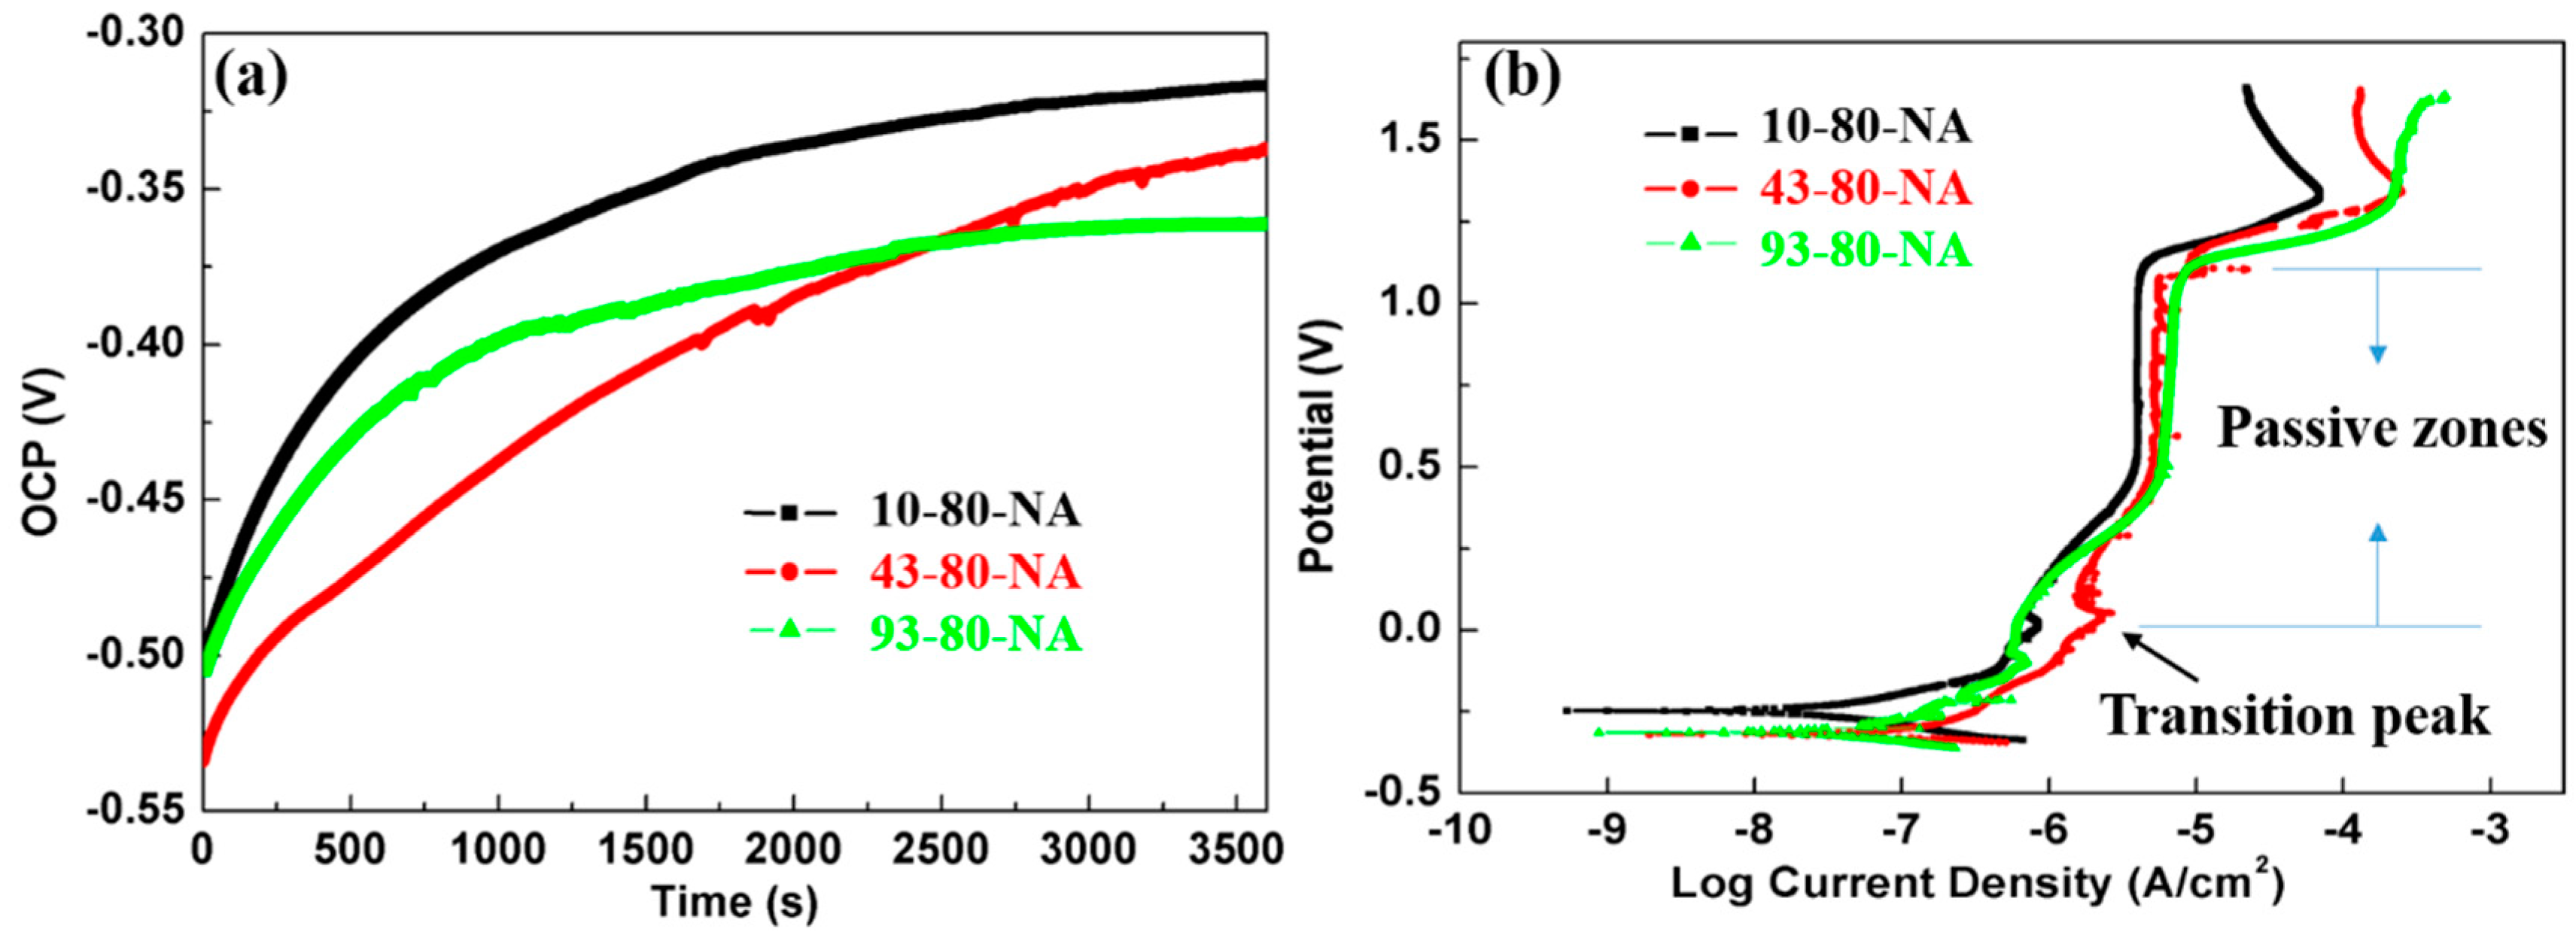
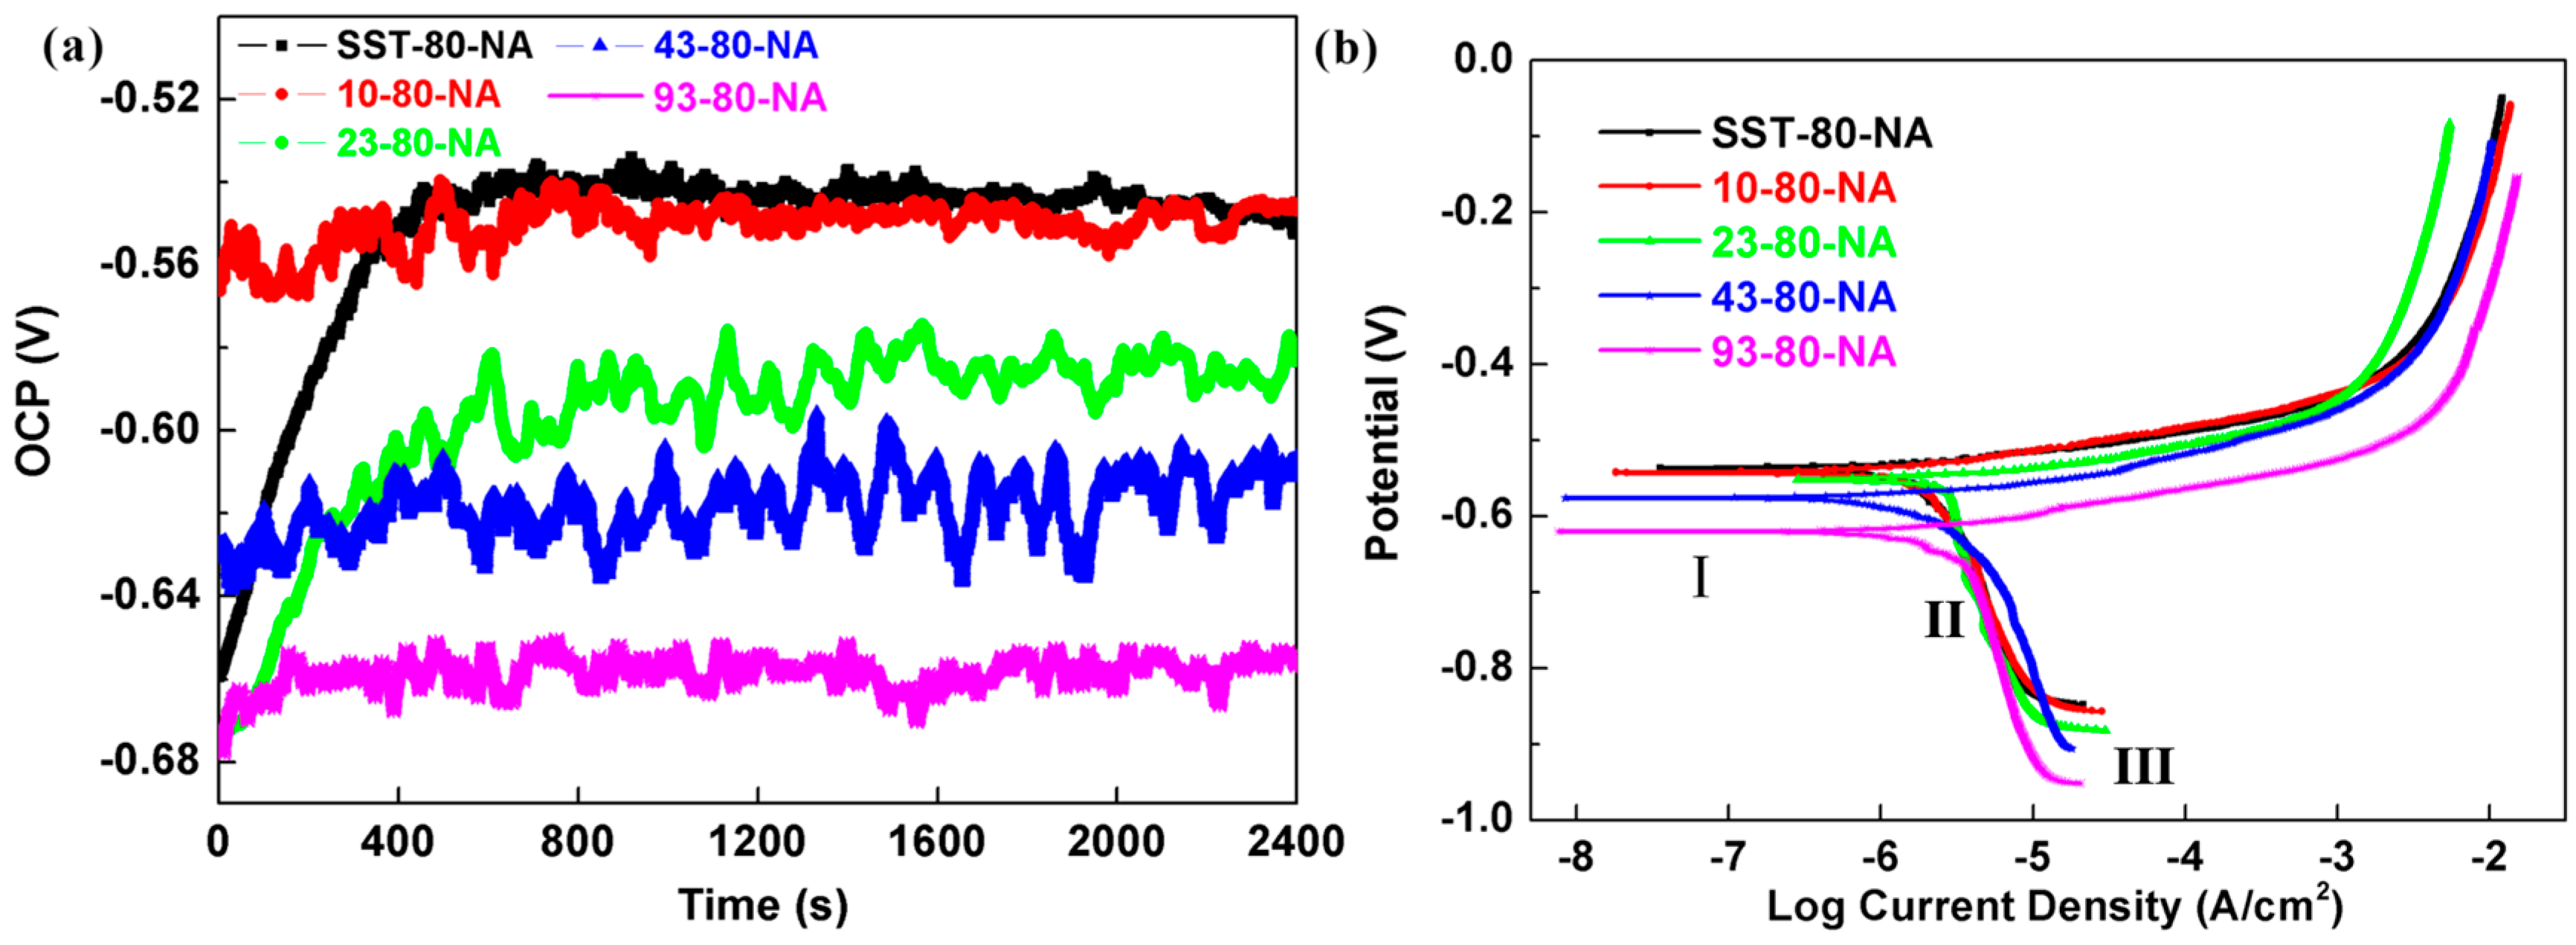
Figure 8a describes the measurement of the OCP of the AA 2024 with different pre-aging time (80% strain) in 0.1 M NaCl solution. The results show that the OCP shifts to more negative potential direction with the increase of pre-aging time. The OCP of the 43-80-NA and 93-80-NA samples remained at a low level, whereas the SST-80-NA took about 460 s to reach a steady state. The OCP of SST-80-NA and 10-80-NA are around −0.55 V, which is higher than that of 23-80-NA (−0.59 V), 43-80-NA (−0.61 V) and 93-80-NA (−0.66 V), showing lower corrosion tendencies.
Figure 8b shows the PDP plots and three stages were also observed in the cathodic branch. The
Ecorr and (
Icorr) are displayed in
Table 5, and the
Ecorr of 93-80-NA is about 0.1 V lower than that of SST-80-NA (larger than the difference of 0.03 V between samples with different strains,
Table 3). The
Ecorr of the other pre-aging time samples is located between these two samples (
Table 5), indicating that the corrosion tendency increases with the prolongation of pre-aging time. The
Icorr of samples are distributed between 1.23 to 1.82 μA/cm
2, indicating the faster corrosion rate increasing with pre-aging time. In the anodic branch, no passivation zone or obvious pitting potential was observed. The anodic current of all the samples increase rapidly and the anodic dissolution rate is large, which is associated with the microstructural features of the samples, especially the nature of the precipitates.
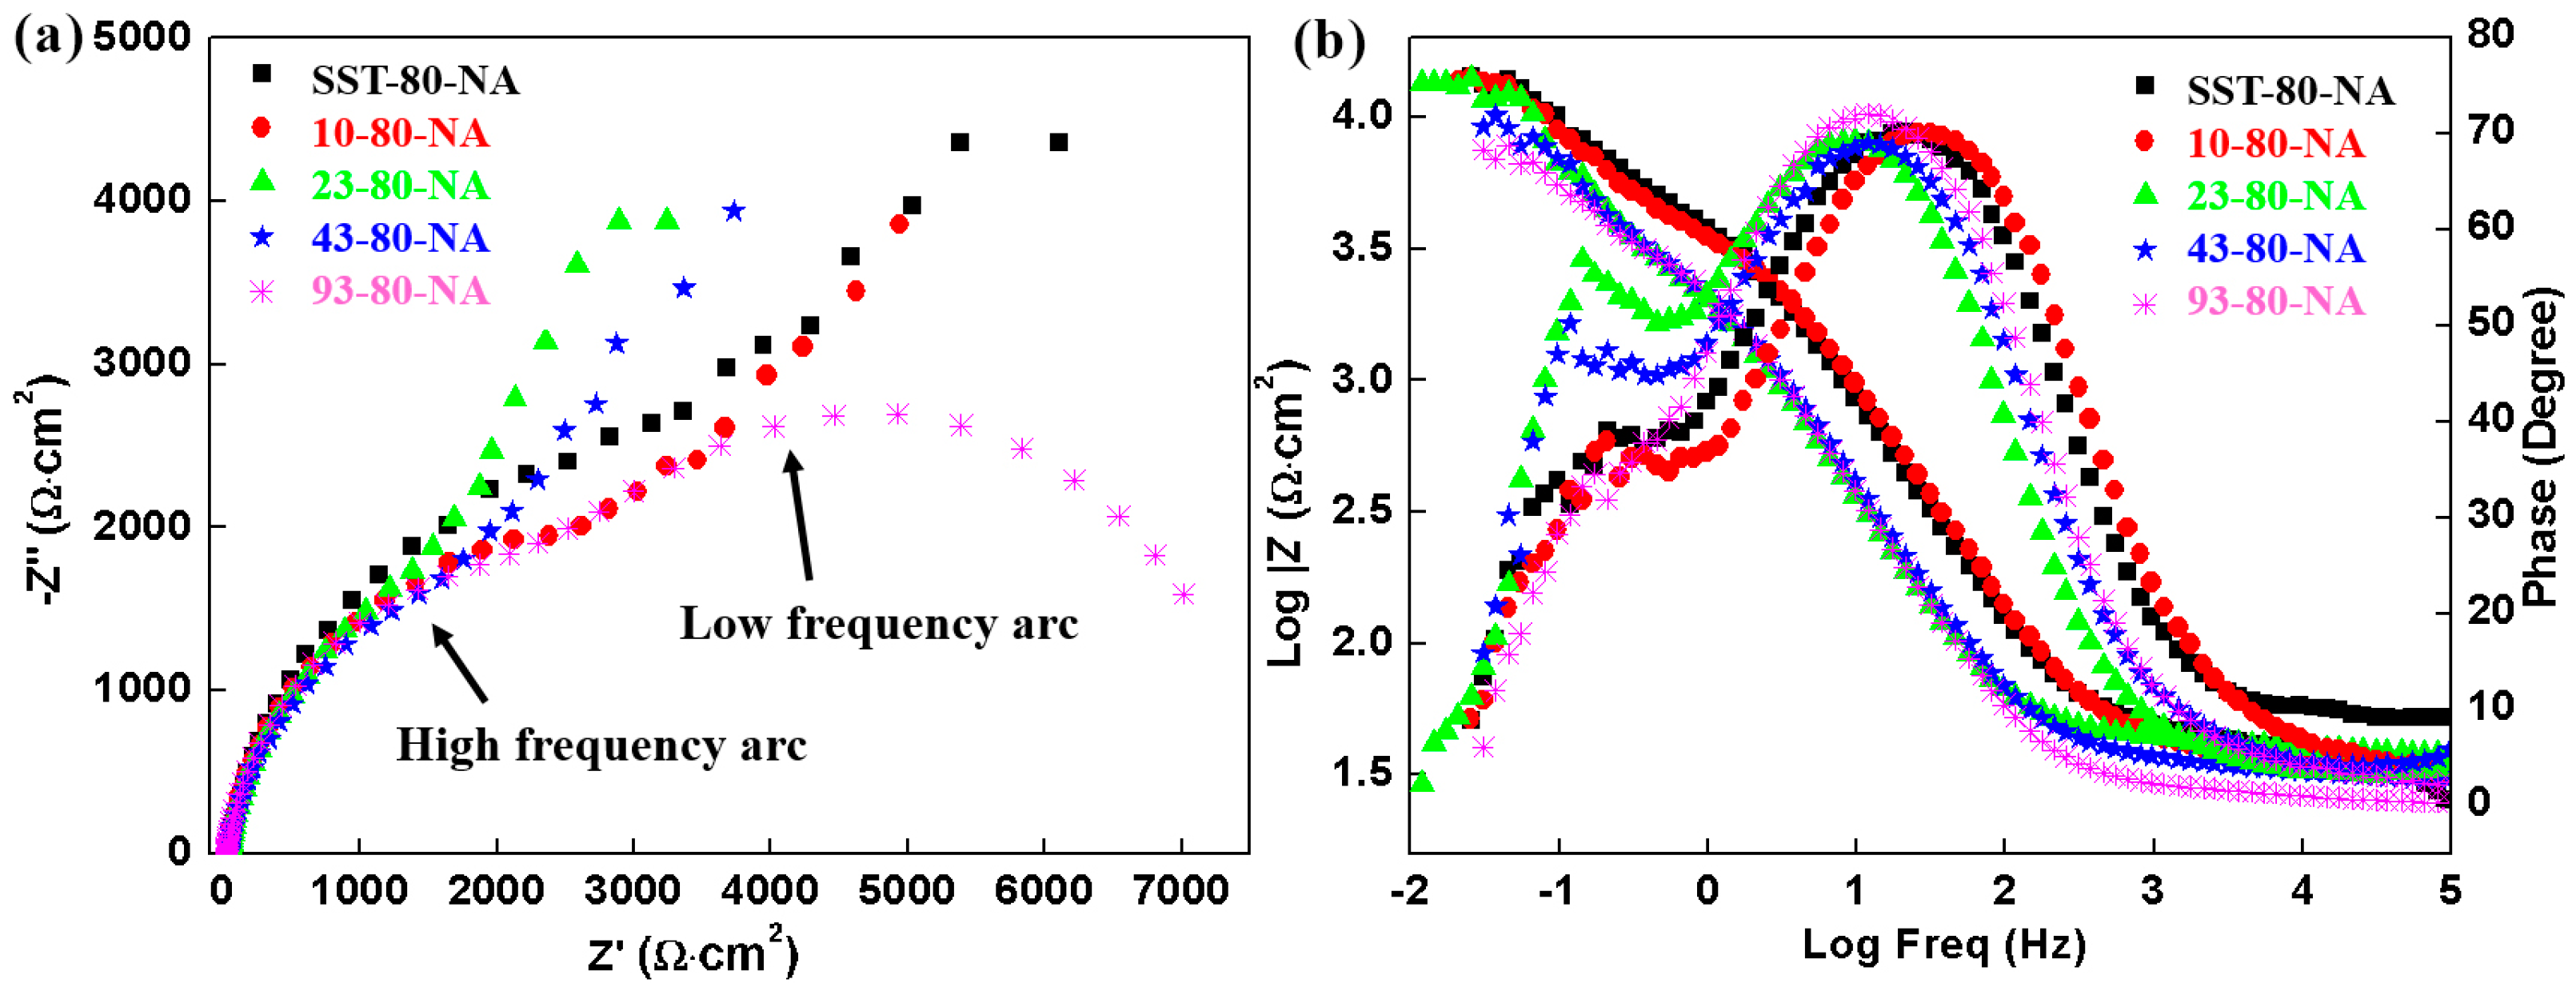
The EIS results of the samples in NaCl solution are displayed in
Figure 9.
Figure 9a shows two apparent semicircles in the Nyquist plot, indicating the response of two time constants. The arcs in low frequency in Nyquist plots varies greatly among samples, showing that there are great differences in pitting corrosion behavior of the samples with different pre-aging time due to the quite difference of precipitation characteristics as the STEM results show. Two time constants are observed in the Bode plots for the five samples (
Figure 9b). The impedance values of the SST-80-NA and 10- 80-NA sample in middle and low frequencies are higher than those of the other three samples in the Bode plots, although such superiority is tiny. As shown in
Table 6, the
Rct of the SST-80-NA (21,900 Ω·cm
2) is one order of magnitude larger than that of the other samples. The
Rct decreased with the extension of the pre-aging time, and the
Rct of 93-80-NA is as low as 3031 Ω·cm
2, which is consistent with the data of
Icorr. The
Ydl of the double layer capacitance increased with the pre-aging time, and this increasing trend, together with the declining trend of the
Rct, illustrates that the charge can easily transfer between Al alloy and solution. The
Yl and
Rl were also changed irregularly for reasons discussed above.
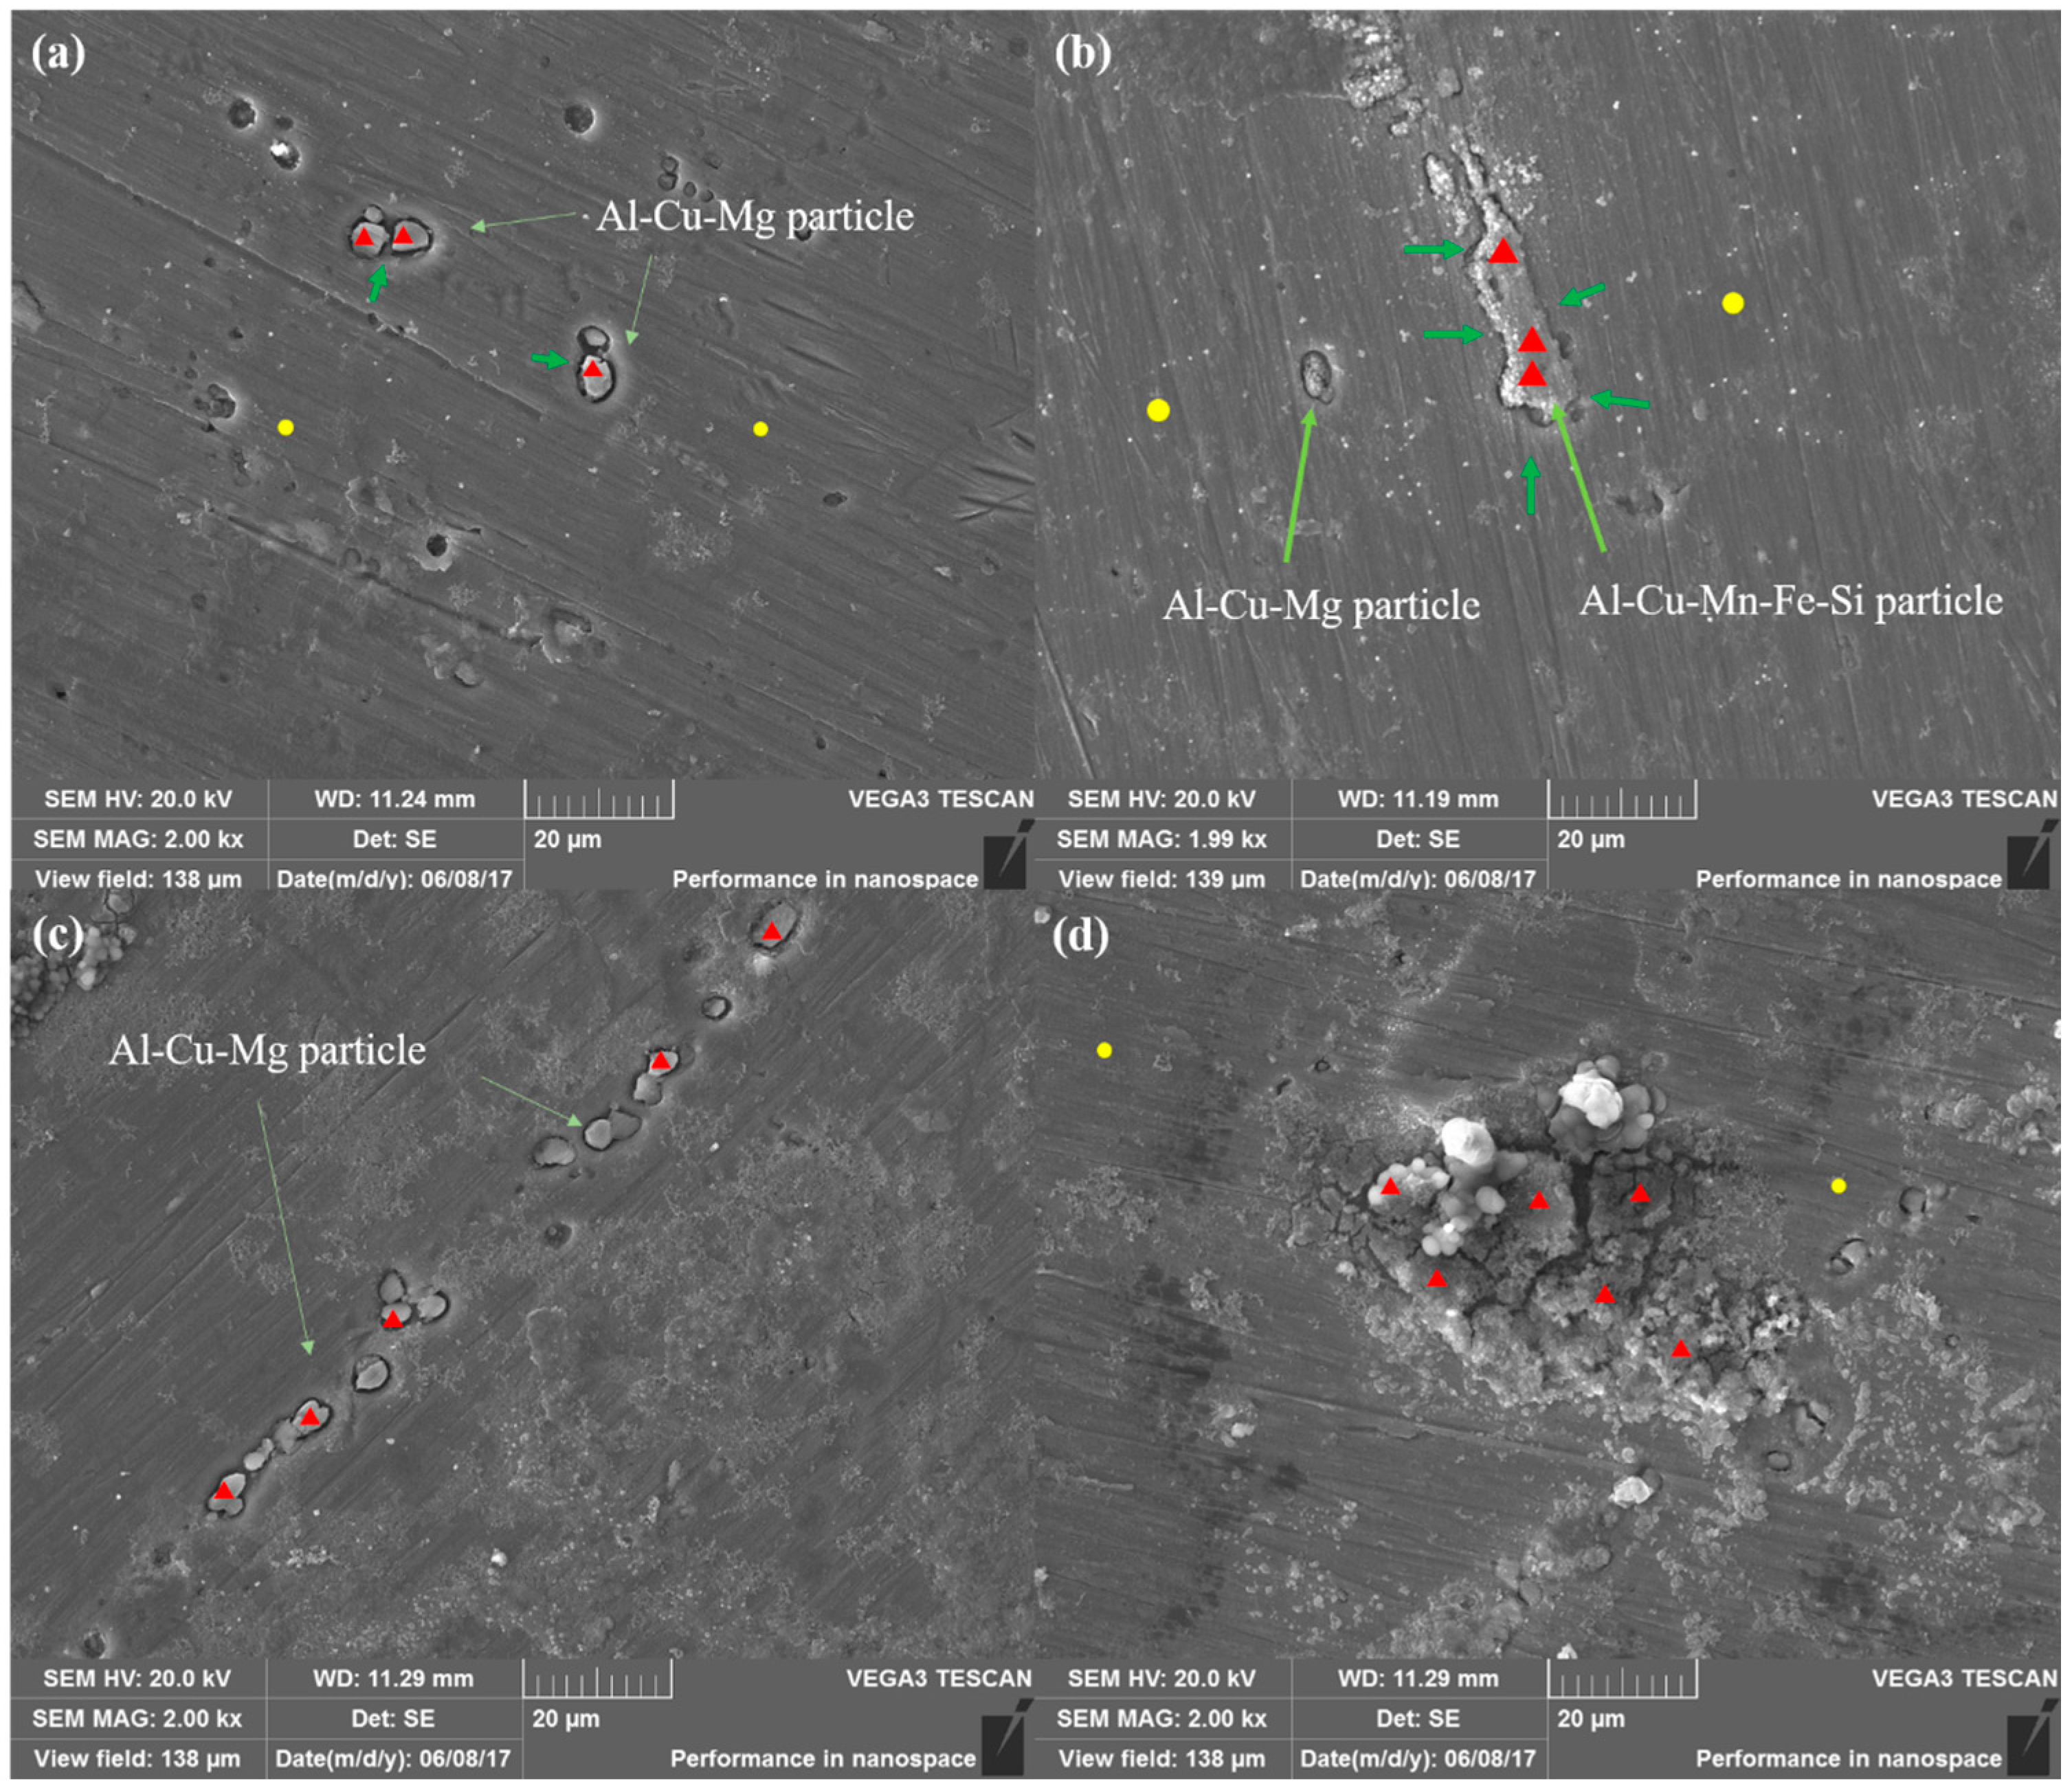
The AA 2024 with different pre-aging time were immersed in 0.1 M NaCl solution for 4 h and the corrosion morphologies are characterized by SEM as
Figure 10a–d. The roughness of the samples decreased significantly compared with that before immersion and the preferential dissolution near the intermetallic particles is clearly visible. Pitting pits can be observed for SST-80-NA (
Figure 10a), mainly around the second phase particles, but the matrix away from the second phase particles is basically not damaged.
Table 7 is derived from the composition test results of Energy dispersion system (EDS) analysis in the graph. It can be explored that the composition of the matrix is basically the same as the receiving state alloy in
Table 1, indicating the area affected by pitting is limited due to the relatively small volume fraction of fine GPB zones or clusters as shown in
Figure 1a. The remnant is mainly rich in Cu, poor in Mg and Al, and about a few μm in size. It is believed that the remnant is mainly Al–Cu–Mg particles. In the early stage of immersion, the dealloying of Mg occurred, followed by the dealloying of Al [
29]. In addition to the dissolution of Mg and Al and the enrichment of Cu, it is also noted that the substantial increase in O content, revealing that corrosion products (such as aluminum hydroxide and Al
2O
3) were accumulated in the remnant and its surroundings. Observations of these selective dissolutions are in agreement with local corrosion theory of the galvanic coupling between the precipitates and surrounding matrix [
7].
In addition to the Al–Cu–Mg remnant particles and typical precipitate pitting morphology, a larger size remnant particle is also observed for 10-80-NA (about 20 μm in length,
Figure 10b). According to the composition test of the matrix and the remnant in
Table 8, it is obvious that the contents of Si, Mn, Cu and Fe in the remnant are much higher than that of the matrix, which is consistent with the previous elemental map in
Figure 3e. Therefore, the large particle is confirmed to be T phase. T-phase particles, though corroded, do not significantly contribute to the dissolution of the surrounding matrix [
30,
31], so we will no longer pay too much attention to the T phase in subsequent discussions.
Figure 10c is the pitting morphology of the 23-80-NA with a string of consecutive pits which are located in the elongated dislocation walls formed during rolling. The constituents of the remnants are shown in
Table 9. The Cu content of remnant particles is up to 45.28%, and Mg and Al are poor, which is resulted from the selective dissolution of Al–Cu–Mg particles. The surface of the bare 93-80-NA after 4 h of immersion was heavily corroded (
Figure 10d), which is obviously different from that of other samples. Based on its composition (
Table 10), it can be revealed that the O content of the substrate is higher than the rest of the samples, indicating that the matrix is more oxidized. The corrosion products have high contents of O and Cl, and contain cracks. A large amount of white nanoparticles are scattered uniformly around the second phase particles, which are derived from the decomposition process of the second phase particles [
29]. The severe pitting corrosion observed also explains why the samples are hard to passivate as shown in electrochemical results.
3.3. The Analysis of Passive Film
The main aspects of the corrosion process in NaCl solution is discussed above, and the previous electrochemical measurements and corrosion morphology results imply the microstructural features responsible for the performance differences of samples. Oxide films are easily formed on the Al alloy surface in the air, which would also be influenced by the microstructure [
13,
23,
32]. However, no passivation behavior occurred in the NaCl solution as shown above, so we intended to apply the borate buffer solution to promote the formation of passive film. Electrochemical test results show that the corrosion behavior is greatly affected by the pre-aging time or the corresponding precipitation features, so we selected three typical samples with different pre-aging time (10 h, 43 h, 93 h) for the research of passivation behavior, as they have large differences in the corrosion behavior and precipitation characteristics.
Figure 11a depicts the evolution of the OCP of the samples with different pre-aging time. Within 1 h of testing, the OCP of all samples move toward the more noble values direction without potential transients as shown in
Figure 4a or
Figure 7a, indicating the formation of compact passive film. The stable OCP is about 0.2 V higher than that in NaCl solution. The borate buffer solution promoted the formation of passive films thus reduced the corrosion probability, which would be confirmed by the following anodic polarization curves and EIS. Representative anodic polarization tests after the OCP stabilization in borate buffer solution are shown in
Figure 10b. As expected, the polarization plots for the different pre-aging time samples are almost identical in shape and form, where the current varies linearly and steadily near the corrosion potential. This is consistent with the fact that the polarization response is largely depend on the composition of the sample and frequently is less sensitive to intermetallic or microstructure [
33]. The passive zones of the three types of samples are basically sharing the same. Compared with their counterparts in NaCl solution (
Table 5), the
Ecorr are increased by about 0.25 V and
Icorr are two orders of magnitude higher (
Table 11). It was observed that the value of
Icorr increased with increasing the pre-aging time. It is clear that increasing the pre-aging time makes poor conditions for passive film formation with slightly lower protection behavior on 2024 Al alloy samples. Active-passive transform peaks and a basically constant current density in the passive zones are observed for all the three samples.
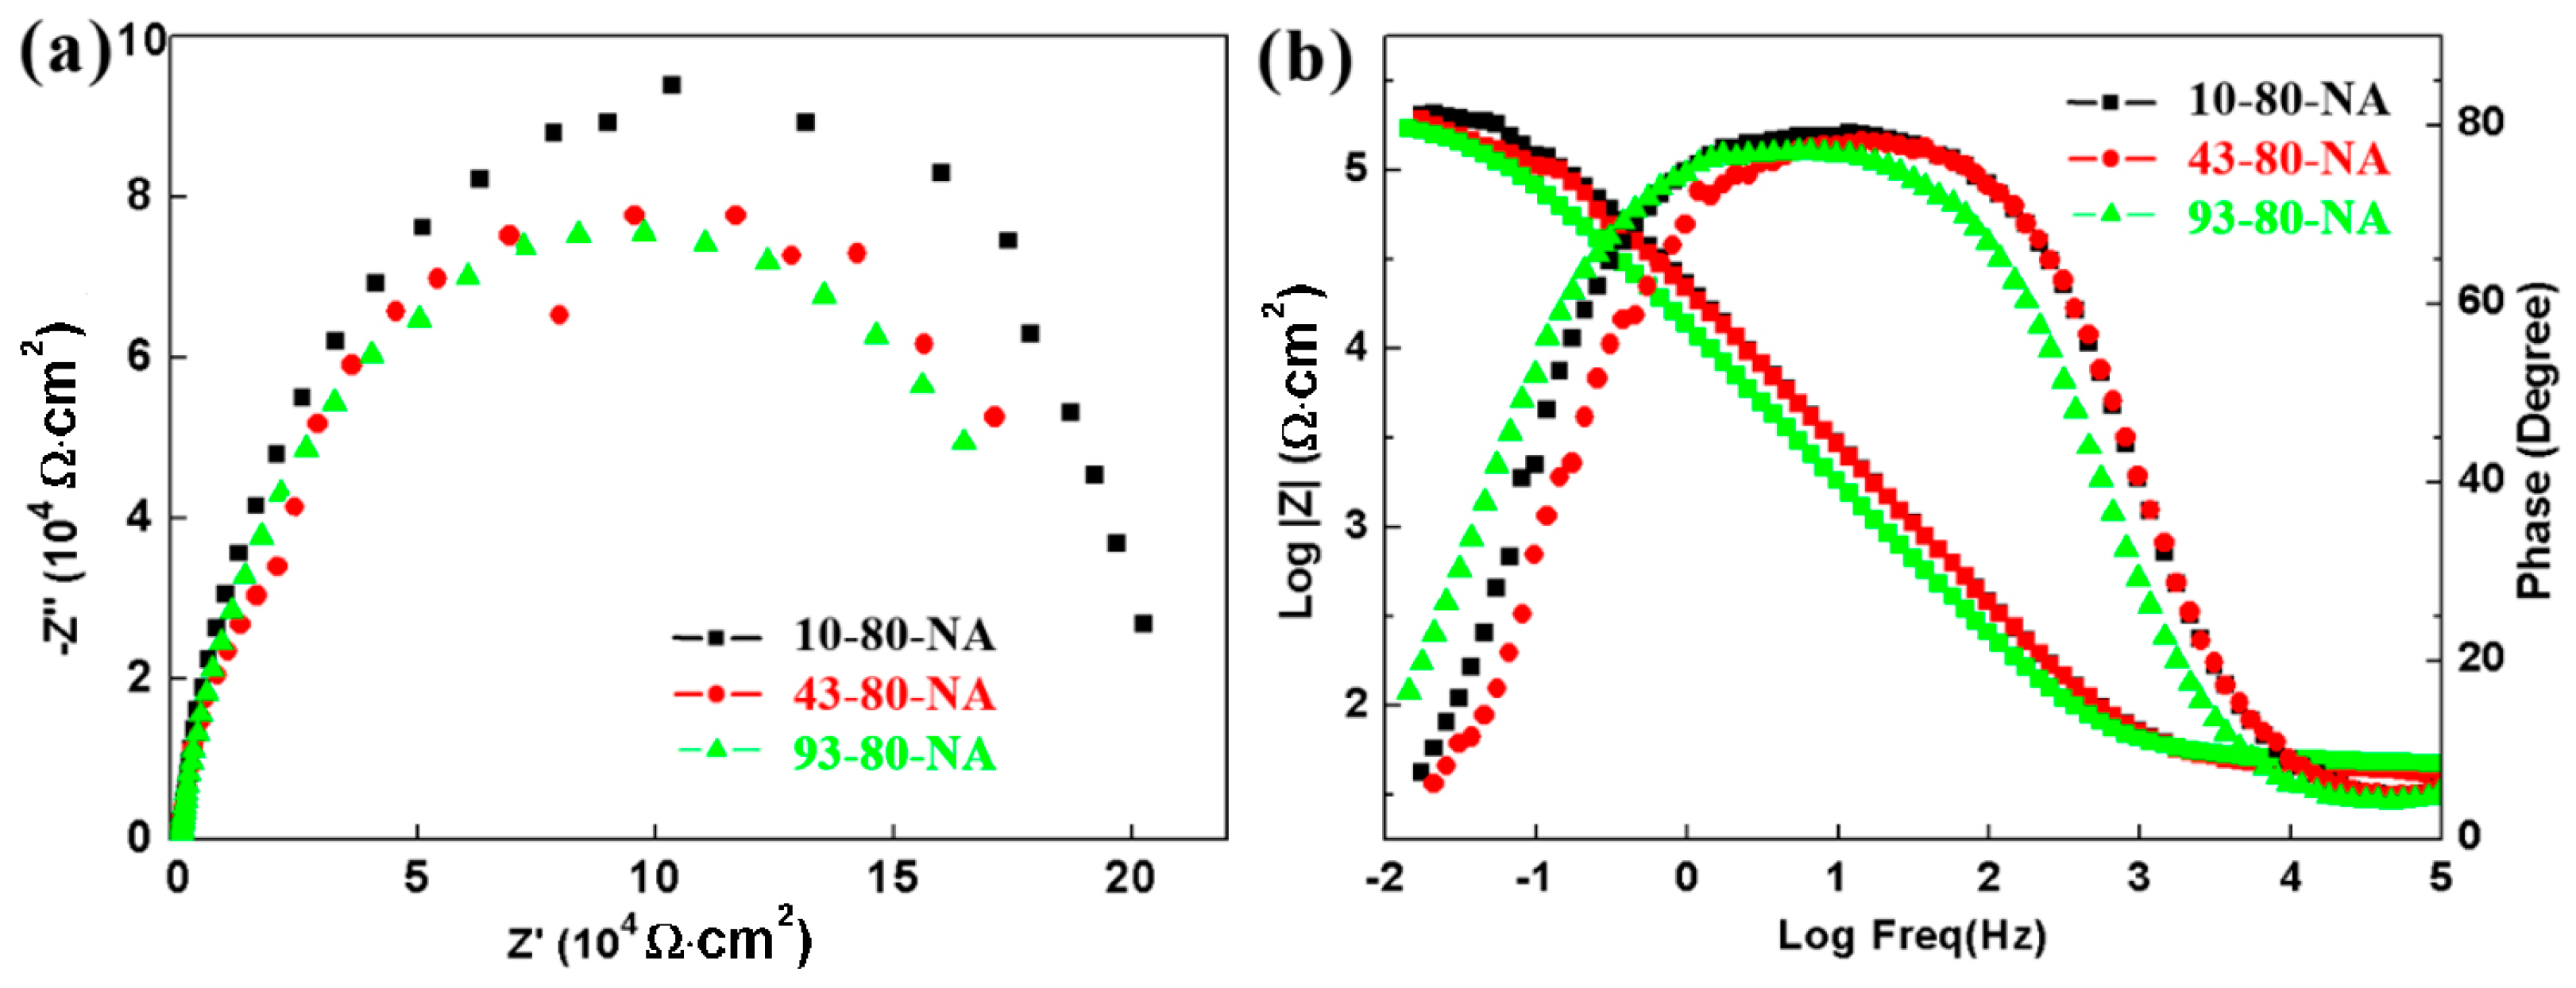
Figure 12b illustrate the EIS results, which is a typical spectrum of passivation process with the electrochemical reaction process controlled by activation. Nyquist plots involve depressed semicircles with only one time constant, different from the EIS plots with two time constants for the samples in NaCl solution (
Figure 5 and
Figure 8), as the typical low frequency/pitting corrosion time constant is absence. The Nyquist arc of the 10-80-NA sample is slightly larger than the other two samples, while the Bode diagram shows a smaller difference among them. Generally, the impedance modulus at low frequency (such as 0.1 Hz), can be regarded as a measure of corrosion resistance, and the modulus at 0.1 Hz in borate buffer solution (
Figure 12) is one order of magnitude higher than that in NaCl solution (
Figure 6 and
Figure 9), and the phase angle is also increased to close to 80°.
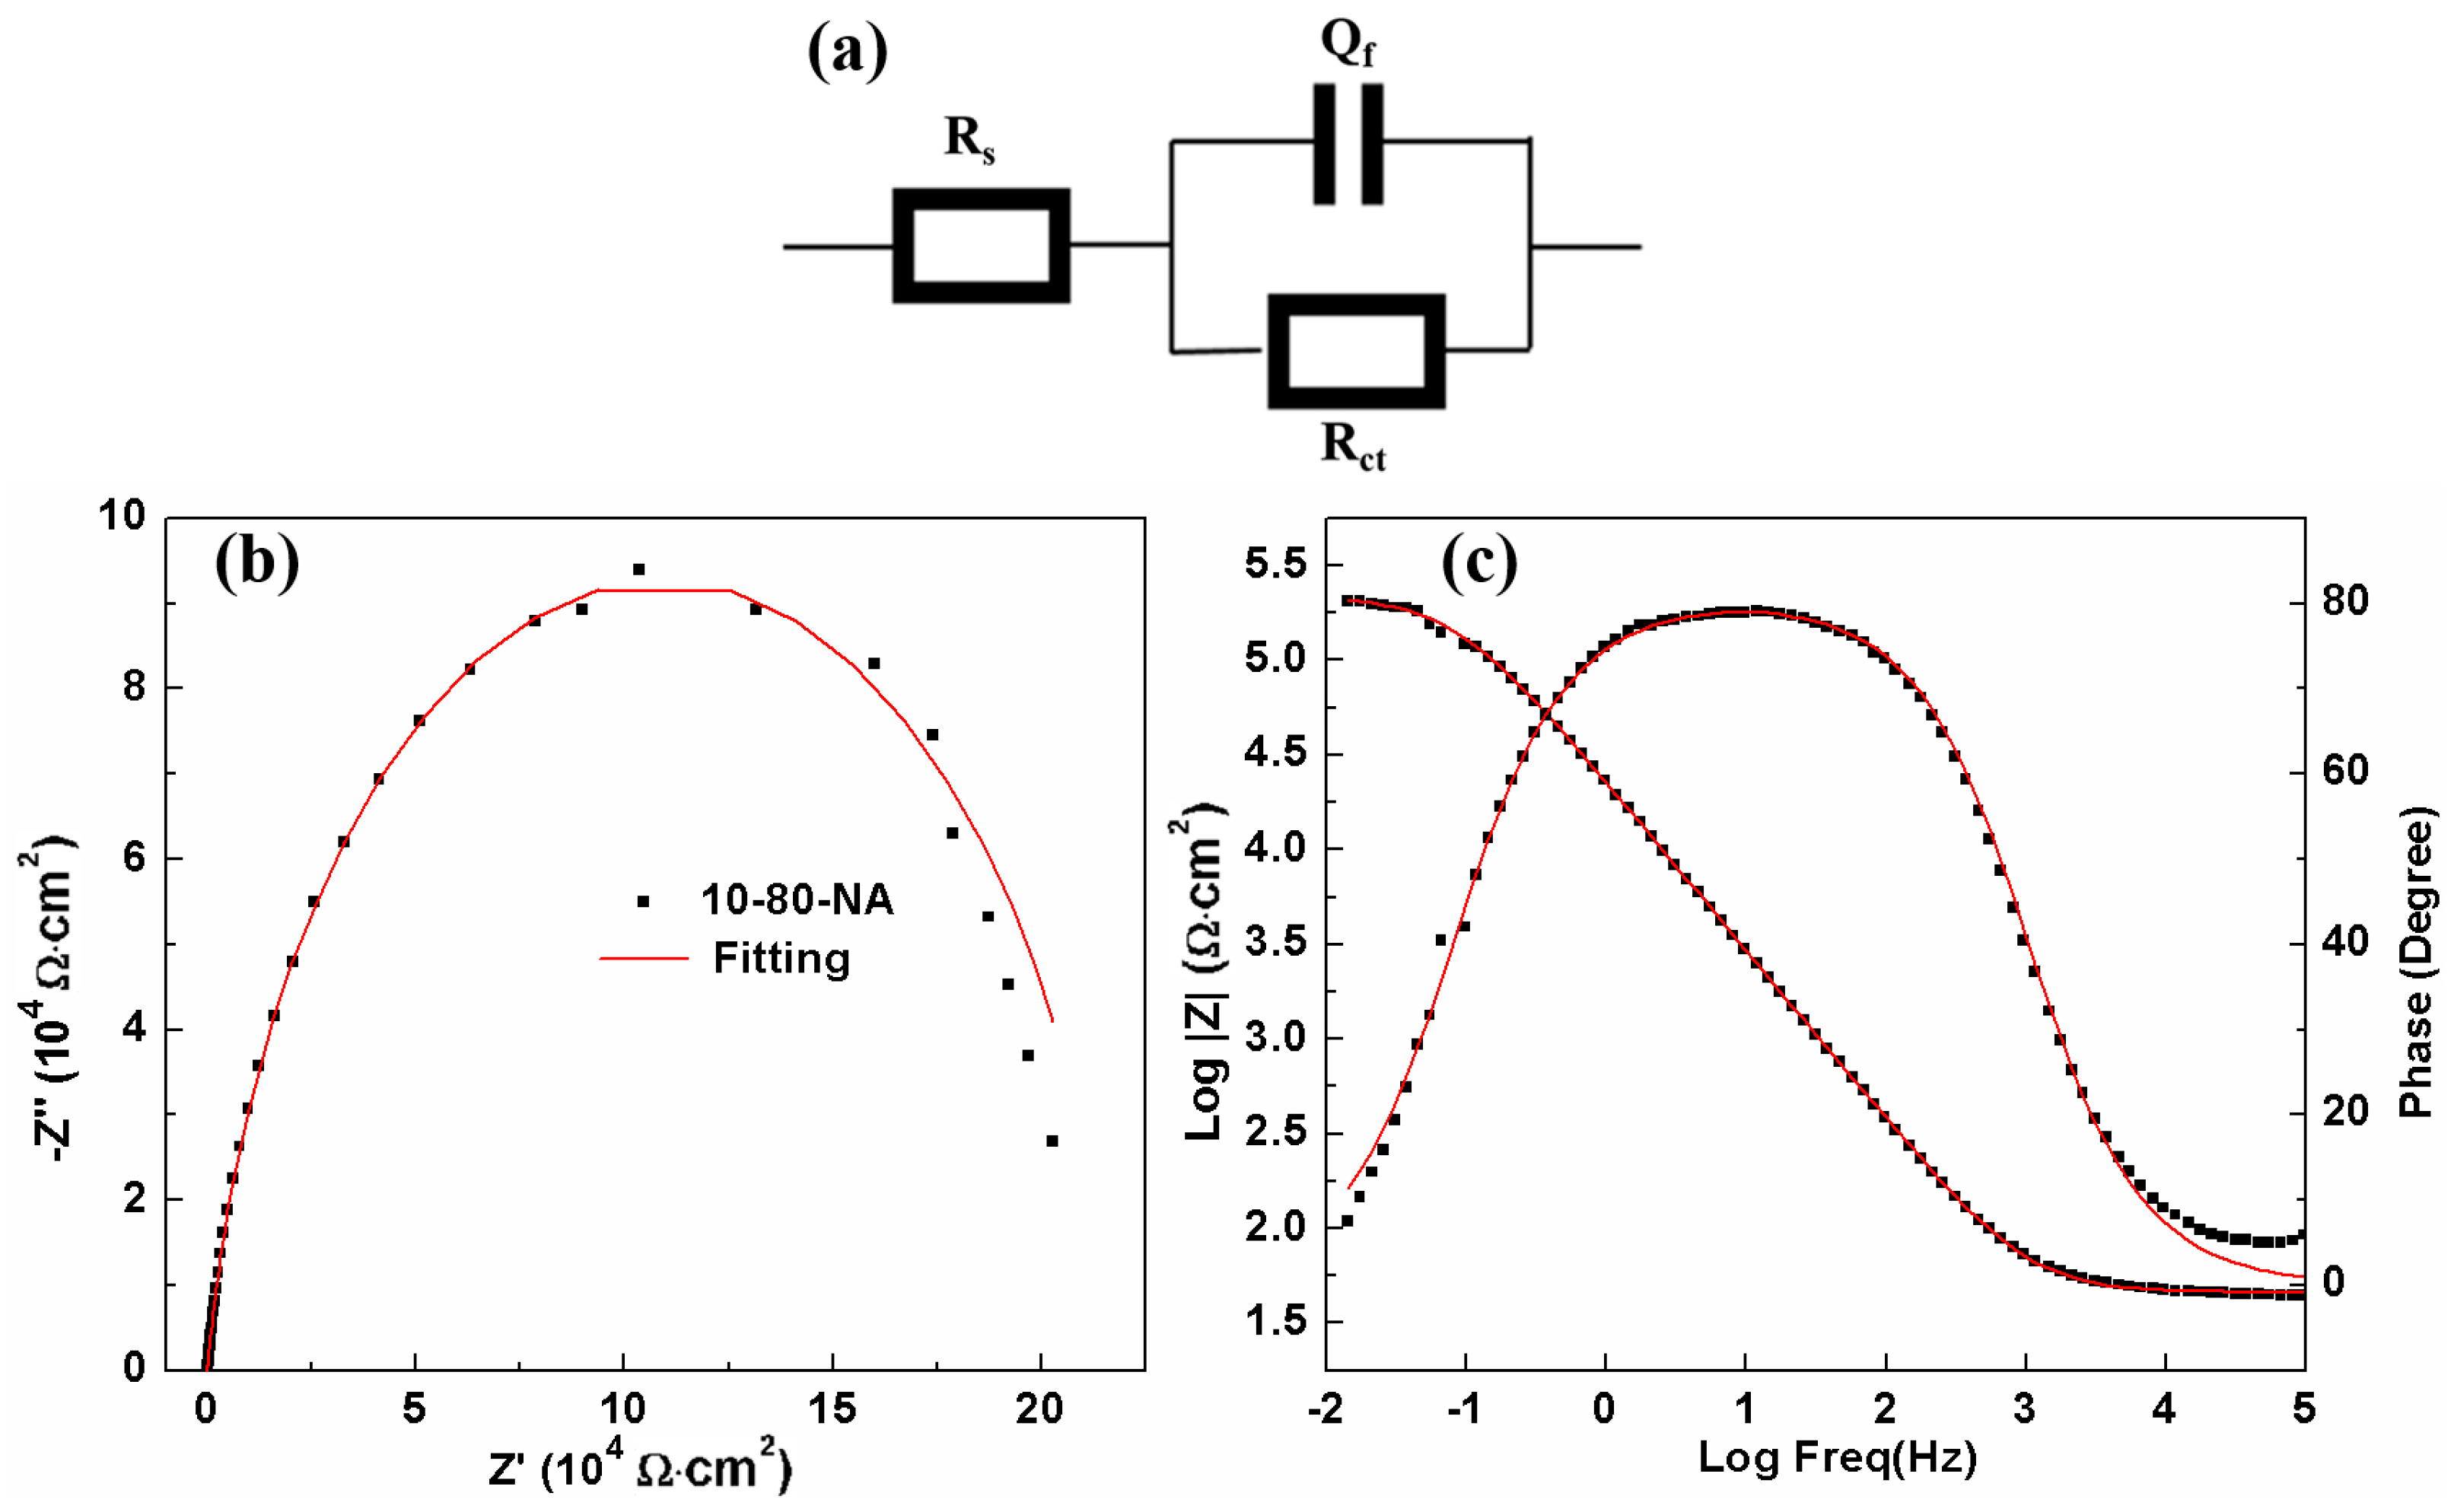
To characterize the property of the passive films, the equivalent circuit in
Figure 13a with the elements of solution resistance (
Rs), charge transfer resistance (
Rct) and constant phase element (
Qf) is applied.
Qf is related to the capacitance of the passive film. An example of fitting result (10-80-NA) is presented in
Figure 12b,c showing a fine match. The parameters of the EIS results in borate buffer solution are given in
Table 12. As shown in
Table 12, the
Rct results reaching the order of magnitude to 10
5 Ω·cm
2, which is two orders of magnitude higher than the same sample in NaCl solution, revealing the stability of passive film and correlating with compactness or thickening of the passive film. The
Cf was calculated from Equation (3) to be 6.93, 8.89 and 17.56 µF for 10-80-NA, 43-80-NA and 93-80-NA, respectively. The capacitance of double layer in smooth electrode is approximately 60 μF/cm
2 [
26], while the capacitance of the passive film in this work is varied between 8 and 18 μF/cm
2, and this is because the formation of passive film change the surface state including the exposure area, thickness and dielectric constant of the electrode. The passive film capacitive (
C) is determined by Equation (4) [
13]:
where ε reveals the dielectric constant of the passive film (usually 10 for Al alloys), ε
0 represents the vacuum permittivity,
d is the thickness of the passive film and
A is the effective exposure area (0.49 cm
2). Usually, the change of the passive film capacitance is regarded as an indicator of the variation of its thickness (
d). For the samples in
Figure 11,
d are 0.63, 0.49 and 0.25 nm, respectively (values calculated with Equation (4)). Therefore, the reciprocal passive film capacitance is proportional to the thickness, which decreases as pre-aging time increases. But generally speaking, according to the EIS spectra and the fitting results, it can be concluded that the passivation behavior of different samples is similar.
According to the Mott–Schottky theory [
34], the space charge capacitance of the
n-type and
p-type semiconductors can be expressed by Equations (5) and (6), respectively:
where ε is dielectric constant of the passive film (usually 10 for passive film formed on Al alloy [
34], the same as in Equation (4)), ε
0 is the vacuum Permittivity (8.854 × 10
−12 F·m
−1),
e is electron charge (1.602 × 10
−19 C),
A2 is the geometric surface area of the film.
ND and
NA are the acceptor concentration of
n-type semiconductor and donor concentration of
p-type semiconductor, respectively.
Efb is the flat band potential.
E is the applied potential,
K is the Boltzmann constant (1.38 × 10
−23 J/K),
T is the absolute temperature. By measuring the capacitance of the space charge layer at different potentials and the plot of 1/
C2 vs.
E, the slope of the plot can be used to determine the type of the semiconductor based on Formulas (5) and (6), and the concentration of the acceptor or donor could be obtained. The capacitance is calculated according to Equation (7):
where
Zim is the imaginary part of impedance, and
f is the measurement frequency (1000 Hz for the present work).
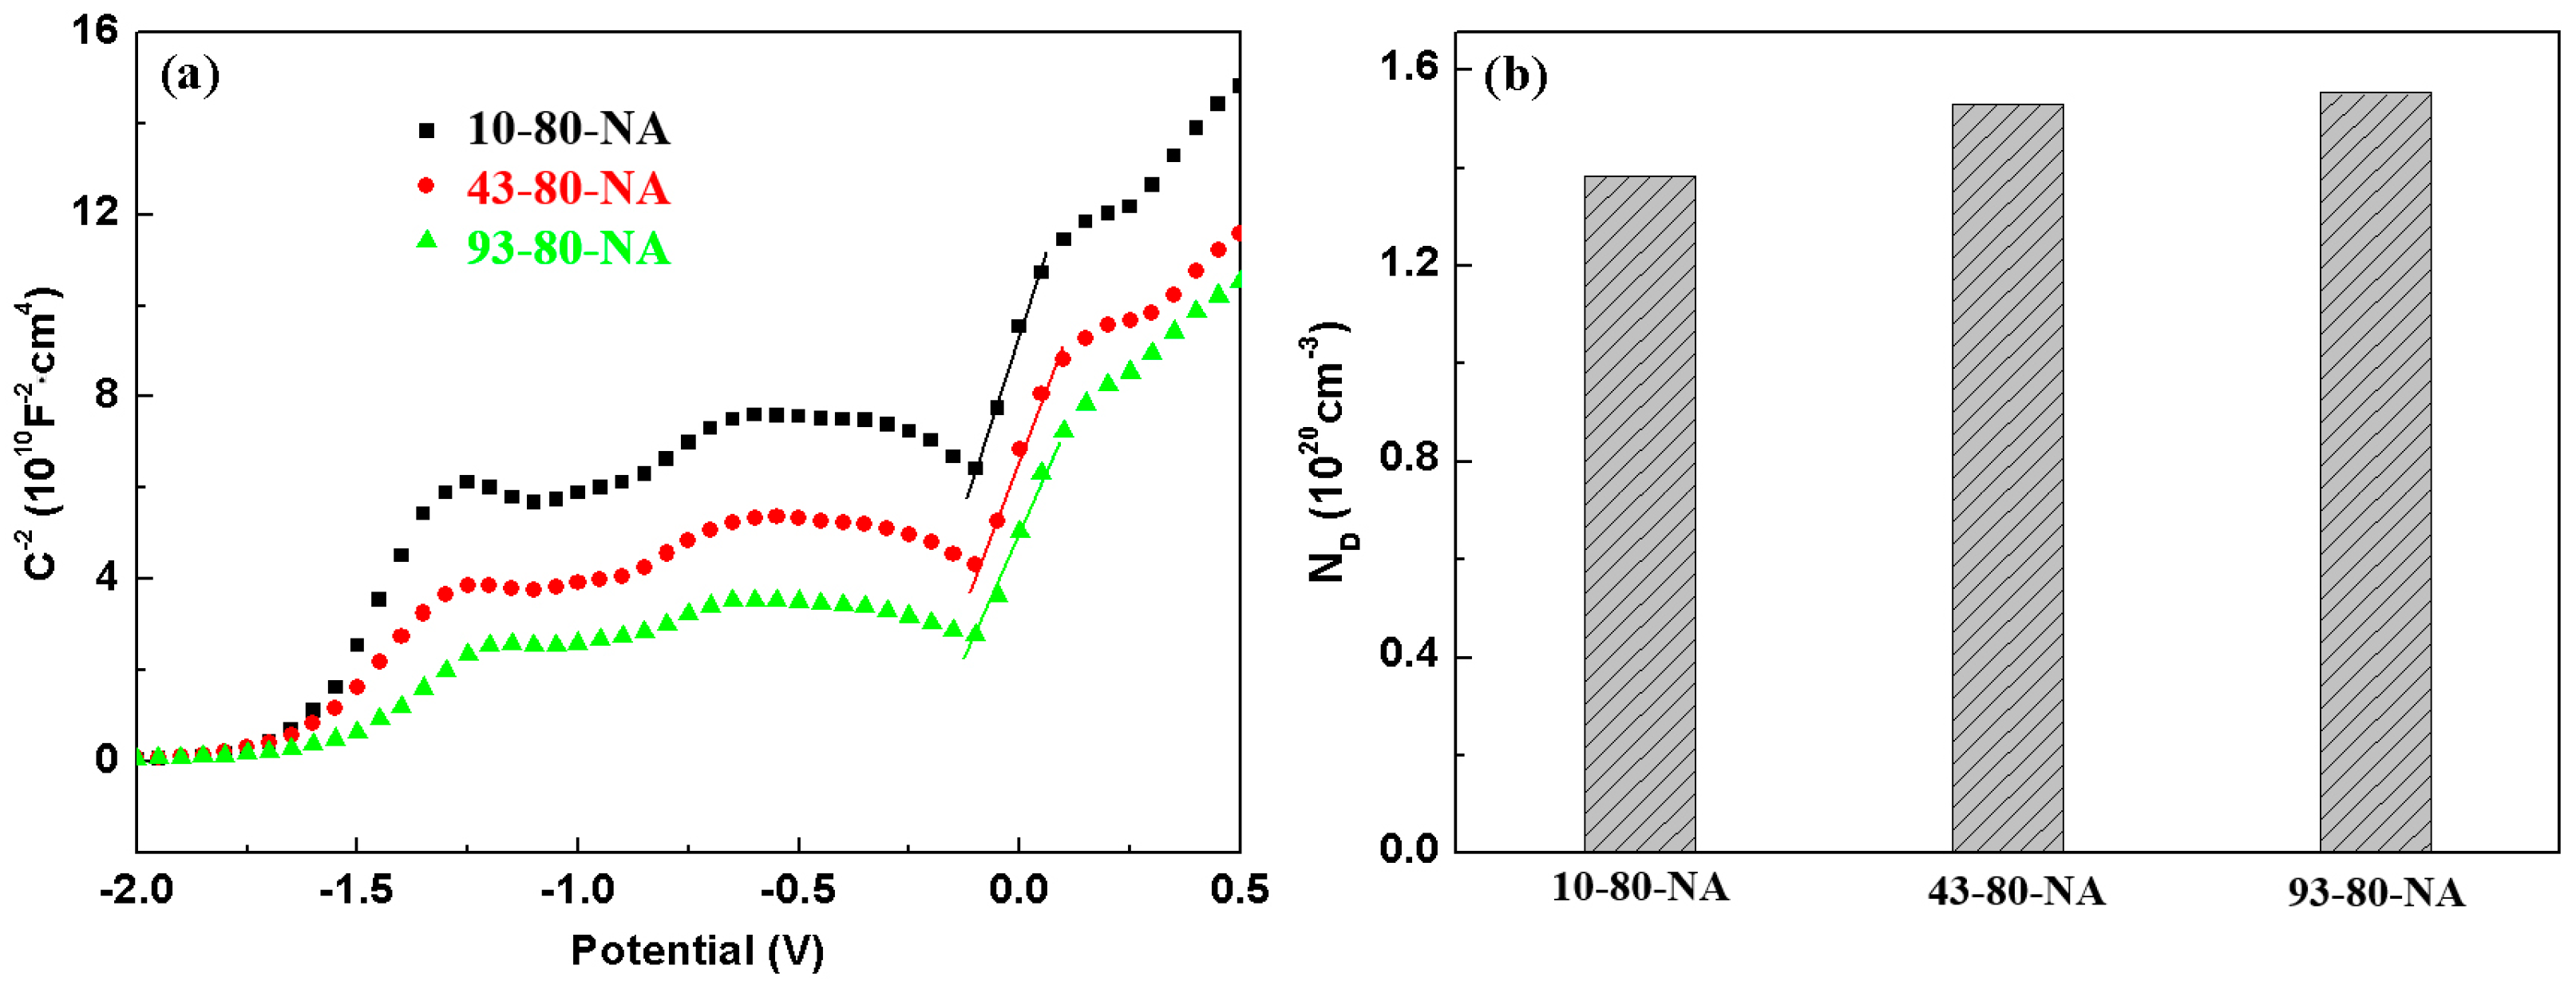
Figure 14a displays the Mott–Schottky plots of the AA 2024 in borate buffer solution, showing positive slope in the range of −0.1 V–0.1 V, which indicates
n-type semiconductor features of the passive films. It is noteworthy that the voltage range is just in the passive region based on
Figure 11b.
N-type semiconductor behavior demonstrates that the primary defects in the passive film are oxygen vacancies. The donor concentration (
ND) of the passive film calculated from the slopes is displayed in
Figure 14b. The sample with the shortest pre-aging time exhibits the minimum donor concentration, the lowest defect density and lower corrosion tendency. This phenomenon is in excellent agreement with the variation of the
Rct (
Table 12), demonstrating that the passive film performance is slightly deteriorated by increasing the pre-aging time. According to point defect model [
22], the passive film has a large number of point defects, such as oxygen vacancies (donors) and cations (donors). The motion of defects promotes the formation of the passive film. As a result, more oxygen vacancies can lead to loose passivation films and cation vacancies that may make metals more soluble. Nevertheless, the difference among the three samples is very small, all of which are the orders of magnitude 10
20 cm
−3.
The passive film morphology of 43-80-NA sample immersed in borate buffer solution are exhibited in
Figure 15 (basically the same for the rest samples, not shown here). The intermetallics remained intact under the passive film without visible corrosion after 4 h of immersion (
Figure 15a) rather than suffering pitting as in the sodium chloride solution (
Figure 10). The scratches left by sandpaper was gradually covered with the passive film in the first 4 h, and finally little trace of scratches was observed after 24 h. It is seen in the EDS maps that the passive film contains high amounts of O and some B, all of which are the characteristic elements in the borate buffer solution. Active element Mg was also detected, indicating that the substrate is effectively protected by the passive film. Denser and thicker passive films have been formed and some corrosion inhibitor crystals with high oxygen content (Oxygen map is brighter in color) are attached to the surface after 24 h. Some “black holes” in the map are observed for the Al alloy substrate element (Al, Mg and Cu), but this is due to the coverage of the second phases by corrosion inhibitor crystals rather than the depletion of elements (
Figure 15b′). The passive films fabricated by immersing in borate buffer solution exhibit excellent anticorrosive effect as the coating generated by steam [
35] or microarc oxidation [
27].


