Article

Surface Aging Effect on Tire/Pavement Noise Medium-Term Evolution in a Medium-Size City

by
Víctor F. Vázquez
*,
Fernando Terán
,
Pedro Huertas
and
Santiago Expósito Paje
Laboratory of Acoustics Applied to Civil Engineering (LA2IC), University of Castilla-La Mancha, Avda. Camilo José Cela s/n, 13071 Ciudad Real, Spain
*
Author to whom correspondence should be addressed.
Coatings 2018, 8(6), 206; https://doi.org/10.3390/coatings8060206
Submission received: 26 April 2018 / Revised: 14 May 2018 / Accepted: 28 May 2018 / Published: 30 May 2018

Abstract

:
This paper presents the geo-referenced acoustical results obtained throughout the close proximity noise (CPX) technique carried out on different urban sections included within the 2017 strategic noise mapping (Directive 2002/49/CE) in Ciudad Real, a Spanish medium-sized city. The employed methodology quantifies the tire/pavement noise generated in the contact between the tire and the surface of the studied sections. Measurements were carried out in different research campaigns between 2008 and 2015 (medium-term evolution). They give valuable information about the pavement-aging effect on its surface characteristics. Throughout these years, the acoustic situation of these sections has worsened mainly due to surface damage and higher mean profile depth (MPD) values, although the performance does not follow the same pattern in every section. The relationships between measured tire/pavement noise and theoretical environmental noise, just due to the geometric spreading of sound energy, is also studied in order to elaborate a simple rolling noise mapping and to assess the environmental noise evolution. Traffic noise plays the main role in the noise registered within the assessed sections, therefore, CPX assessment could be used by local authorities to take decisions regarding urban planning and traffic management, with the aim of reducing noise exposure from traffic.

1. Introduction

Smart cities should have not only technological applications but natural and friendly environments to improve citizens’ lives. One of the main problems that faces western societies is the continuous environmental degradation. The development, not always under control, has brought a remarkable increase of the environmental noise that affects urban landscapes. As a result, noise (especially traffic noise) has been of increasing concern to both public and governments over the years.
The acoustic comfort of the inhabitants depends considerably on the possibility of having access to quiet areas; moreover, urban form and traffic noise are related to each other [1,2]. There is a wide range between the high noise levels that could be tolerated in public spaces and the low levels that are needed in order to sleep adequately. Anyway, acoustic comfort depends on noise control. In this sense, urban design should be also based on the knowledge of the causes that generate environmental noise. This type of noise is strongly related to traffic; however, traffic cannot be easily removed in cities, and thus studying its causes and mechanisms is needed in order to mitigate its effects. It is known that noise pollution causes different health issues [3,4,5,6], and, on the other hand, for passenger cars, tire/pavement interaction plays the main role in traffic noise at speeds greater than 40 km/h [7], i.e., the majority of main streets in urban areas. Thus, preventive and corrective measures should be focused in noise generation mechanisms related to the tire/pavement interaction.
The procedures to assess and control environmental noise are complex due to the many sources presented and the temporal variability during measurements. These difficulties led the European Parliament and Council to promulgate the environmental noise directive (END, Directive 2002/49/CE) relating to the assessment and management of environmental noise, which is the main instrument in order to identify noise pollution levels and to plan measures to reduce them.
In Spain, the law of noise (ley 37/2003 del ruido) is the transposition of the END. This law, besides the R.D. 1367/2007 (Real Decreto), defines the methods and indicators (Ld, Le, Ln) of the environmental noise assessment, by means of Strategic Noise Maps (MER—Mapas Estratégicos de Ruido), in order to inform citizens about the noise levels and to design Action Plans against noise when needed.
The main scope of this paper is to study the medium-term evolution of tire/pavement noise in the urban areas of a medium-size city. With this purpose, the evolution of the surface characteristics of city pavements, such as tire/pavement noise and surface texture, have been studied in different measurement campaigns accomplished in several streets of Ciudad Real. Simple rolling noise mapping, due solely to the geometric spreading of sound energy, are elaborated from close proximity (CPX) data. These maps are compared with published Strategic Noise Maps (MER 2012). Some previous works have studied the effects of pavement aging on tire-pavement noise [8,9], however, this research work represents the first attempt at studying the tire/pavement noise evolution and macrotexture (mean profile depth (MPD)) as a function of surface aging and elaborating a simple rolling noise map from CPX field data in a medium-size city.
The studied surface characteristics were the tire/pavement noise by means of the CPX method and the macrotexture by the MPD. The monitoring technique employed is based on mobile devices, which can be a more cost-efficient technique than the conventional noise-monitoring system. Besides, rolling noise maps could be employed to identify the most polluted areas and define Action Plans against noise. Acoustic assessment from CPX could provide valuable information about urban areas with problems related to traffic noise. This information should be taken into account when rehabiliting urban projects are going to be accomplished.

2. Environmental Noise Levels from Close ProXimity (CPX) Noise Levels

There are different techniques to evaluate the noise generated by traffic; these techniques are widely employed in different applications from real noise assessments to innovative research works. The technique employed will depend on the characteristics of the study accomplished and the materials on which acoustic performance will be assessed. Some of these techniques are the SPB (statistical pass-by), the CPB (controlled pass-by) and the CPX (close proximity) [10]. The CPX method is considered a good method to characterize the noise emission of road surfaces. On the other hand, the SPB method (and CPB) are used to classify surfaces as a type according to their influence on traffic noise. Due to the importance of these techniques, some authors have studied the relation between them with the aim of predicting one index from the other.
According to Anfosso-Lédée, and the study carried out at Laboratoire Central des Ponts et Chaussées, it is possible to get the CPB index from the CPX index following Equation (1). The independent term of Equation (1), 22.5, could slightly vary depending on the pavement characteristics [11,12]. A similar relationship between coast by and CPX methods was recently establish by Cesbron and Klein at vehicle speeds ranging between 50 and 110 km/h [13].
LCPB = LCPX − 22.5 dB(A)
A similar relation between noise level from SPB and CPX indexes has been also studied within European projects such as SILVIA [14,15] and SILENCE [16] (see the Equation (2)). This relationship also agrees with the studies presented by Sandberg and Ejsmont (see Chapter 17: Relationships between the methods of the reference [10]). The LSPB noise levels of Equation (2) agree quite well with LCPB levels given by the Equation (1), when CPX noise levels are around those found in this research work.
LSPB = 1.22·LCPX − 40.89 dB(A)
Besides, Licitra et al. studied the relation between SPB and CPX noise levels within an Italian context. Licitra studies the relationship between indexes for every single 1/3 octave band, determining the corresponding A(f) transfer function presented in Equation (3) (from the HARMONOISE project) [17,18]. The A(f) transfer function depends on the frequency, but also on the specific road section studied. Finally, this work affirms that the SPB/CPX relation could be described by other curves rather than a linear regression [17]. The studied road sites and the measurement techniques of this research were carried out in compliance with the LEOPOLDO project [5].
LSPB = LCPX(f) − A(f) dB(A)
Recently, the SPB–CPX relationship has been also deeply studied by the ROSANNE project [19,20]. In this project, the relationship was studied for both passenger cars and heavy vehicles, at the same or different referent speeds. The average relation achieved in this project (for passenger cars, and at the same reference speed), was similar to that found in the previously cited research works (Equations (1) and (2)), and follows the next expression (Equation (4)):
LSPB = LCPX − 20.5 dB(A)
Finally, Gardziejczyk et al. have also studied the SPB/CPX relationship in some research works [21,22]. In these studies, the pavements are divided into 5 classes depending on their LCPX and LSPB noise levels. Therefore, each LCPX value is related to a single LSPB noise level.
The relationship between CPX and SPB (CPB) noise levels is useful in many case studies, as it has been shown in the previous cited works. Nevertheless, this relation has not been used in this research work due to some reasons that are given below:
SPB and CPB methods highly depend on the section where measurements are carried out. The microphones must be located in an acoustic free field (see for instance Tonin [23], Licitra [24] or Sandberg [10]), however, some of the sections studied in this work cannot be considered as free field.
SPB and CPB methods characterize the road surface, taking into account the traffic type, which is producing the noise; different vehicle type implies different wind turbulence noise and power unit noise. The work included in this manuscript is about the street surfaces, their aging and the evolution of the acoustic situation, thus, we consider that the CPX methodology may be the most suitable method in order to predict environmental noise levels from tire/pavement noise (Rolling noise mapping).
SPB and CPB methods give noise levels at 7.5 m horizontal distance from the lane (1.2 m height). Nevertheless, in this research work, we are not looking for the noise at that distance, but the noise depending on the distance (Rolling noise mapping). The maps presented at this stage allows us to define the theoretical acoustic situation of façades close to the noise source (traffic), since every façade is located at a different distance from the noise source. The methodology employed in this research work to achieve the theoretical environmental noise levels from CPX noise levels is described below.
Rolling noise mapping is based on the geometric spreading of sound energy due to the expansion of the noise wave fronts [25,26]. Considering that the traffic of the studied lanes behaves as a line source, the tire/pavement interaction is radiating sound equally in all directions (see Figure 1). According to these assumptions, cylindrical spreading of sound energy is produced.
In this case, the sound intensity is related to power by:
I = P2(r)/(ρ·c) = Power/Area = W/(2·π·r·H)
where I is the sound intensity (W/m2); P(r) is the sound pressure (N/m2) at radial distance r (m); ρ is the density of the medium (air) (kg/m3); c is the speed of sound in the medium (air); W is the power of the sound source (W); and H is the considering length (m) of the line source.
Besides, the sound pressure level (Lp(r)) in decibels (dB) is a logarithmic scale given by:
Lp(r) = 10·log (P2(r)/(P0)2)
where P0 is the sound pressure at the threshold of hearing (20 × 10−6 Pa).
From Equations (5) and (6), the sound pressure level Lp(r) could be written as:
Lp(r) = 10·log ((W·ρ·c)/(2·π·r·H·(P0)2))
Then, the relation between the sound pressure level Lp(d), registered at a distance d (distance between the CPX microphones and tire/pavement interaction) and the sound pressure level at a given distance r (Lp(r)), could be written as:
Lp(d) − Lp(r) = 10·log ((W·ρ·c)/(2·π·d·H·(P0)2)) − 10·log ((W·ρ·c)/(2·π·r·H·(P0)2))
Lp(d) − Lp(r) = 10·log (r/d)
According to Equation (8), the distance ri of every noise-contour, from the line source (Lp(r1) = 75 dB; Lp(r2) = 70 dB; Lp(r3) = 65 dB), can be now calculated using Equation (9):
ri = 10^(( Lp(d) − Lp(ri) + 10·log (d))/10)
Finally, the rolling noise map with the different noise-contours is calculated at 4 m high (the high where Strategic Noise Maps are depicted) according to Figure 2 and Equation (10):
r4m height = (ri2 – 42)^(1/2),
This method allows us to define the theoretical environmental noise levels (rolling noise mapping) based on a straightforward calculation procedure. However, it should be noted that this method does not consider the noise reflections produced by the ground under the line source; the model considers that every noise energy in these directions is absorbed by the ground. On the other hand, according to these assumptions, a busy lane (line source with continuous traffic noise), instead of a point source (lone vehicle travelling) is considered in the rolling noise mapping. These considerations will be discussed below.
In any case, this methodology is a worthy tool in order to assess the evolution of the environmental noise (evolution of the noise contours), especially at short distances from the street (line source) where the acoustic pollution generates the main problems for citizens.

3. Project Selection

Measurements included in this work were taken during a period of seven years, between 2008 and 2015, within three different measurement campaigns. The sections studied were chosen because of their inclusion in the Strategic Noise Maps produced by the Spanish Ministry of Development (DGC—Dirección General de Carreteras) in 2012. These areas have their noise maps because of the fact that they are crossed by a major road, i.e., a national road designated by the member state (Spain), which has more than three million vehicle passages a year. On the other hand, although Ciudad Real is an agglomeration with less than 100,000 inhabitants, the population of the closer towns usually develops its activity in Ciudad Real. Since these towns offer cheaper dwelling, their citizens use them as dormitory towns. These areas are connected with Ciudad Real by means of three highways (A-42, A-43 and CM-45). Considering these assumptions, the population of the area of influence of Ciudad Real is about 100,000 inhabitants, thus, a Strategic Noise Map could completely assess the acoustic situation of Ciudad Real. Figure 3 shows the urban areas and the highways that connect them.
The Strategic Noise Maps (MER 2012) of major roads within Ciudad Real include the Action Plan in order to avoid or reduce noise pollution; however, this Action Plan only includes punctual action in the studied area presented in this paper, that is, the speed reduction in Section 1 [27]. Other actions are considered as complex actions by the DGC. These actions could be traffic management or the use of noise-reducing surfaces [21,28,29].
Inside Ciudad Real, six sections are studied (Figure 4a). In this figure the location of two gauging stations (A and B), where data of the daily traffic are available, are also shown. Figure 4b shows the Strategic Noise Maps (2nd phase) [27] of the studied area, since the comparison between CPX measurements and the environmental noise (MER) is a scope of this research work. The characteristics of the studied sections are shown in Table 1.
The studied sections are the main roads that connect Ciudad Real to highways and other cities. Moreover, due to the lack of a ring road between N-401 and A-43, heavy traffic between these major roads must go across the urban areas of Ciudad Real, causing high noise levels and pollution. In 2002, a new ring road (A-41 and A-43) was built from the east to the south-west of the city (see Figure 3); nevertheless, nowadays there is not a solution for the large amount of traffic between the east and the north of the city which goes across the urban landscape of Ciudad Real.
Every section studied is a two-lane section with a high traffic density. Sections were highly deteriorated in 2015, however; Section 1 is the only one that has been rehabilitated between 2008 and 2015 (2012). Every section had been constructed with low air void content mixes (well-graded).

4. Experimental Study

The surface assessment has been carried out by means of the following measurement techniques: a semi-anechoic chamber and a laser profiler. The former allows us to measure the tire/pavement noise (LCPtr), and the latter provides the surface profile of the pavement. With this equipment, geo-referenced data are achieved on the same path of the studied street sections. The configuration of the equipment during urban tests is shown in Figure 5.

4.1. Tire/Pavement Sound Measurements

The equipment is composed by a semi-anechoic chamber where a reference tire (Pirelli P6000) [30,31] and two microphones are mounted at a specific distance (CPX method). The configuration allows us to measure exclusively the noise level produced at the tire/pavement interaction (LCPtr). During measurements, the speed of the vehicle was kept close to the reference speed (50 km/h). Besides, the noise levels (LCPtr, 50 km/h) have been corrected by speed (reference speed: 50 km/h) and temperature (reference temperature: 20 °C), considering a relation of 0.05 dB(A)/°C, similar to that employed in other research papers [31]. The semi-anechoic chamber isolates the tire/pavement sound from the external noise sources, such as engine noise or wind noise, between 300 Hz and 5 kHz. Besides, the reference tire was kept in the laboratory between measurement campaigns (controlled humidity and temperature conditions), in order to avoid its deterioration. Figure 6 shows the elements inside the semi-anechoic chamber.
Acoustical measurements were carried out by using microphones, BSWA MP201, meeting the requirements of IEC 61672 Class 1, and a portable NI CompactRIO Control and Acquisition System (four-channel dynamic signal acquisition module). A CRIO Mobile Module (global positioning system (GPS)) allowed global position determination and was used to store the location of georeferenced noise levels at regular intervals. The frequency analyses in third-octave bands and the sound pressure level measurements were carried out with frequency weighting A, in the range from 200 Hz to 5000 kHz. The sensitivity of the whole acoustic measurement setup was checked with an acoustic calibrator 4231 B&K, meeting the requirements of IEC 60942 Class 1, before and after the measurement over the tested road surfaces. In addition, a digital tachometer was used to continuously measure the vehicle speed. This system was equipped with an infrared ray optical detector situated near the rolling tire. More details of the equipment and the measurement technique are given elsewhere [30,31,32,33].

4.2. Surface Profile Measurements

The longitudinal profile measurements of the tested surfaces were performed by means of a laser profiler. This equipment is composed of a high-speed laser device, a GPS sensor and an encoder assembled on the left rear wheel (odometer) to achieved synchronized measurements of pavement profile, GPS coordinates and run distance (Figure 5) [30]. Fast fourier transform (FFT) and filtering techniques were used in order to obtain the MPD (ISO 13473-1) from the profile measurements. The commercial software Profilograph for windows (Greenwood Engineering) was used to compute the MPD as a function of the longitudinal distance. MPD is a parameter that characterizes the macrotexture amplitude of the surface pavement.
The laser profiler was located in the front part (Figure 5) of the powered vehicle, whereas the semi-anechoic chamber was located in its rear part. This measurement configuration allows us to measure tire/pavement noise and surface profile following the same path.

5. Analysis of Measurements and Discussion

Field measurements have been carried out in urban sections and on real conditions. Thus, measurements are subjected to some disadvantages such as those due to traffic lights and crosswalks. Nevertheless, tire/pavement noise and profile measurements have been conducted at an average speed of 50 km/h. This paper analyzes some pavement surface characteristics (tire/pavement noise, MPD) measured in recent tests, and compares them with those achieved in previous works [34].

5.1. Surface Assessment: Evolution of Tire/Pavement Noise Levels (CPX)

During the last measurement campaigns (2013 and 2015) the CPX noise levels (LCPtr, 50 km/h) and the MPD of the studied wearing courses were obtained. LCPtr, 50 km/h levels were evaluated in a representative length of each section. Detailed analysis of noise levels of the studied segments within test sections was accomplished in order to assess their homogeneity.
Figure 7 shows the noise level distribution over the length of Sections 2, 3, 4 and 5 (2013 and 2015). As shown in these figures, LCPtr, 50 km/h levels have increased in almost the entire length studied, with variations depending on the punctual deteriorations of their surface. Section 4 stands out for the irregular evolution of its surface. While part of the section has been considerably deteriorated, there are parts with similar LCPtr, 50 km/h values throughout the time; higher deterioration of some segments may be due to higher traffic tangential loads: i.e., braking and acceleration forces due to a traffic light within this section. In any case, the effect of pavement aging on tire/pavement noise is not in doubt.
On the other hand, from continuous CPX measurements (Figure 7), the spatial standard deviation has been evaluated in every section and measurement campaign. Figure 8 shows the mean values of LCPtr, 50 km/h noise levels (dB(A)) and MPD (mm), together with the spatial standard deviation of LCPtr, 50 km/h noise levels. The results depicted in this figure include those of the measurement campaigns accomplished in 2008, 2013 and 2015 [34,35].
MPD measurements could not be carried out in the first measurement campaign (2008), since by then the authors had not the experimental equipment needed in order to conduct these measurements. Moreover, other values in Figure 8 are omitted since the authors were not able to carry out the tests due to operational problems.
As shown in Figure 8, a noteworthy increment of tire/pavement noise levels has occurred over the years. Nowadays these levels exceed 90.0 dB(A) (except Section 1, where LCPtr, 50 km/h = 89.8 dB(A)). These values are higher than others achieved from conventional mixtures (at 50 km/h) such as AC16 surf S (asphalt concrete) [34] or BBTM 8 mixture (very thin asphalt concrete) and PAC8 (porous asphalt course) [36]. According to the authors, these conventional mixtures were laid, 10 (AC16) and 24 (BBTM and PAC) months before their measurement by means of the close proximity method.
Between 2008 and 2015, the LCPtr, 50 km/h levels increased between 0.7 and 3.0 dB(A), depending on the section studied. The highest increments were registered in Sections 4 and 5 (overall noise increase rates of 0.8 and 0.4 dB(A) per year, respectively). These rates were higher than the average rate measured on concrete pavements with the onboard sound intensity (OBSI) method (0.1 dB per year) [8]. Besides, Sections 4 and 5 stand out for their high tire/pavement noise levels. In fact, they were the noisiest sections in 2015, with LCPtr, 50 km/h levels of 94.2 and 92.9 dB(A) respectively. These sections were characterized by the highest MPD values measured (2015).
Lower increments in LCPtr, 50 km/h levels, between 2008 and 2013, were achieved in Sections 1, 2, 3 and 6 (below 1.8 dB(A)), with a maximum value of 90.7 dB(A) (Section 6). On the other hand, within Section 1, a reduction in tire/pavement noise levels took place between 2008 and 2013 (Figure 8), nevertheless, this attenuation was not due to the self-improvement of the mix over the time, but a superficial rehabilitation of its wearing course between both measurement campaigns. However, the maintenance operations were not enough to avoid the fast increase of its noise levels after the maintenance operations: 1.4 dB(A) between 2013 and 2015.
According to Figure 8, there is a relation between the evolution of LCPtr, 50 km/h noise levels and MPD values. Pavement aging may result in higher MPD values, which generate higher tire/pavement noise levels due to impact noise-generation mechanisms. In fact, higher noise increments were achieved in Section 5, where the higher MPD increase took place (18.5% between 2013 and 2015). This section was fabricated with asphalt concrete, and its aging has produced a progressive loss of aggregate from its surface (raveling) (see Figure 9); the surface evolution of Section 5 reflects its MPD evolution. Raveling is a pavement failure that is more likely to occur in asphalt concrete sections with higher aggregate sizes. Slurry seal surfaces (Sections 1 and 2) are homogenous mixtures with fine aggregates. Due to their characteristics, the MPD values of these sections are lower than those of asphalt concrete sections. The pavement aging of these Sections (Sections 1 and 2) has produced numerous cracks (longitudinal, transverse and diagonal depending on the point); however, these pavement failures are not reflected in their averaged MPD values. Figure 9 shows a surface comparison between Sections 2, 4 and 5 during the second measurement campaign (2013).
On the other hand, despite of the results of Section 5, measured data show that there is not a linear relationship between MPD and noise-level increases. This behavior is related to the fact that macrotexture is just one of the pavement characteristics that influence noise generation. For instance, the LCPtr, 50 km/h noise levels of Sections 1 and 2 (slurry seal sections) increased at a rate of 1.6% and 0.9% respectively, between 2013 and 2015, whereas theirs MPD increase rates were 11.1% and 14.0% respectively. Macrotexture variations (amplitude and wavelength) may affect noise differently. A texture spectrum would be useful to define the relationship between tire/pavement noise levels and macrotexture evolution; however, the authors were not able to carry out a texture spectrum study due to technical limitations.
Figure 10 shows the time evolution of the averaged tire/pavement noise levels in the studied streets of Ciudad Real (tire/pavement noise maps), where the MER had been done according to the Spanish law of noise. This figure illustrates the noisy situation of some of the studied streets, specifically Sections 4 and 5. As seen, every section has increased its noise levels over the time.
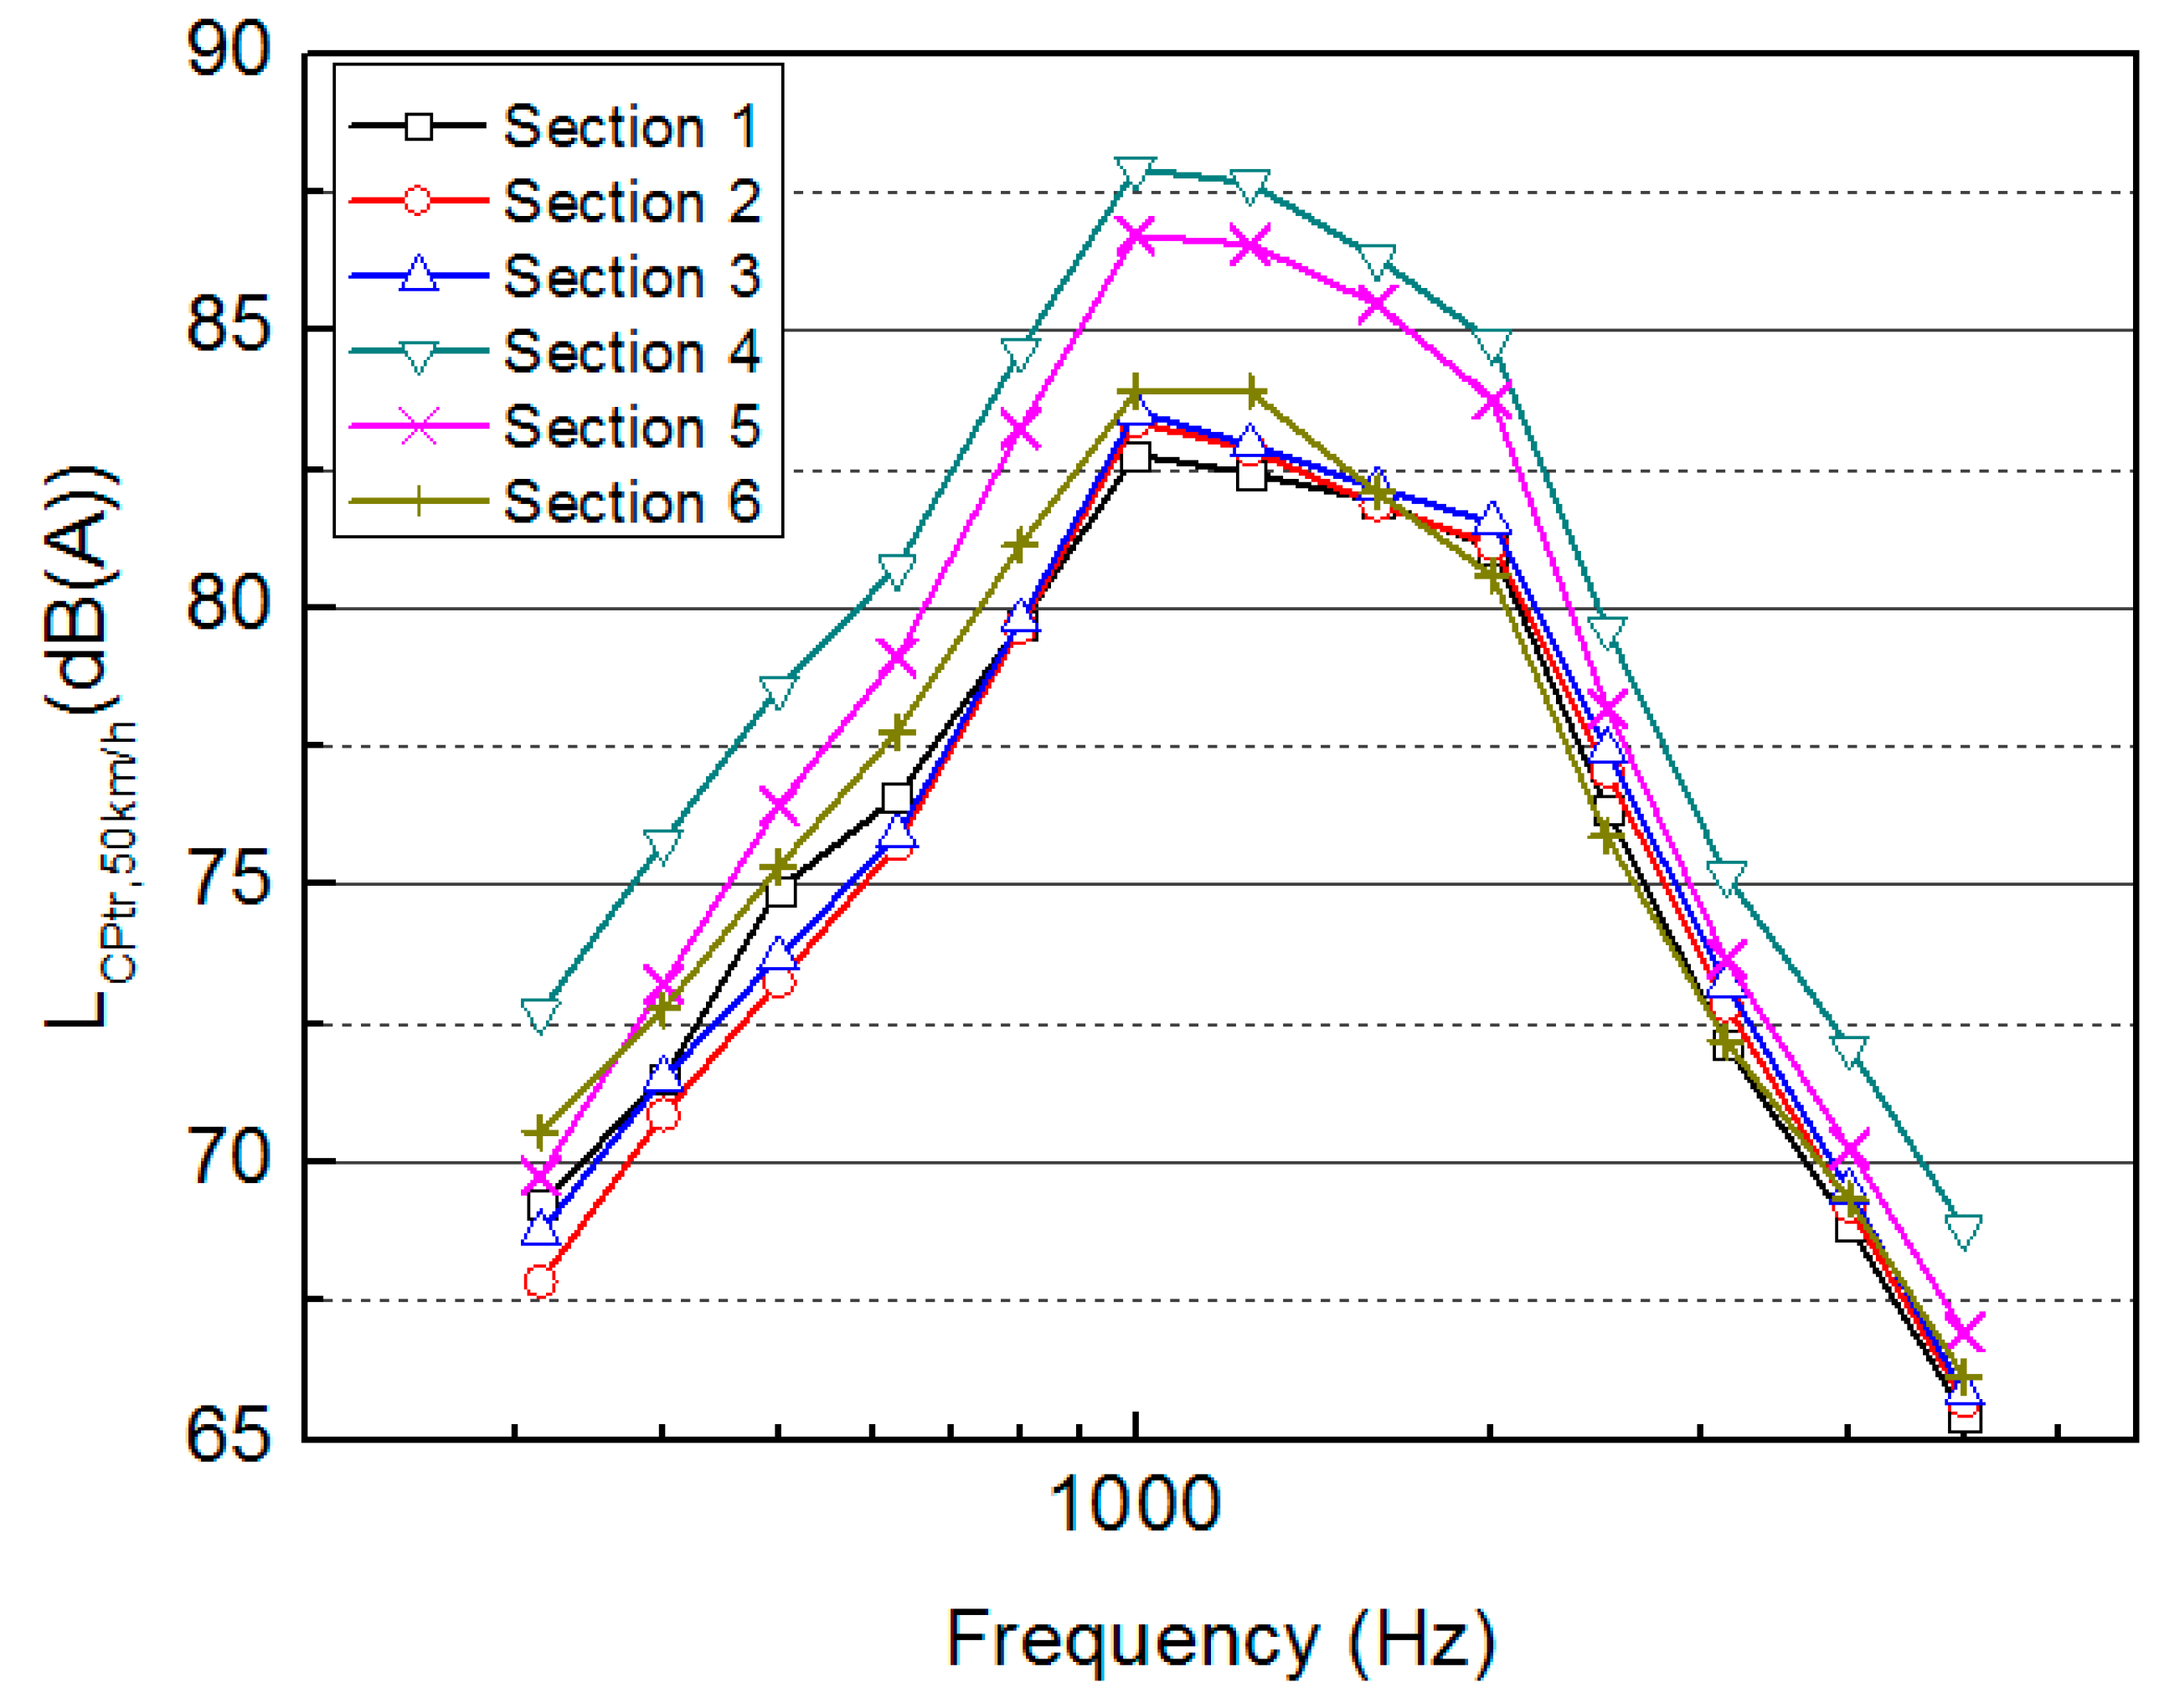
Besides the evolution of the overall tire/pavement noise levels (averaged over every section at 50 km/h), the average noise spectra, between 300 and 5 kHz, were studied for every urban tested section. These results are shown in Figure 11. As seen in this figure, there are relevant differences among the studied surfaces within the last measurement campaign (2015). The studied sections could be divided into two different groups. Whereas Sections 1, 2, 3 and 6 show relative lower tire/pavement noise at low/medium frequencies, the rest of the Sections (Sections 4 and 5) show higher noise values that could reflect the deteriorated state of their wearing course and indeed, the necessary maintenance operations. Otherwise, at higher frequencies, the spectra of Sections 1, 2, 3, 5 and 6 are rather similar. However, at these frequencies (above 2.5 kHz), Section 4 is again the noisiest section. According to our results, Section 4 should be rehabilitated as soon as possible, in order to improve the service quality related to comfort, safety and noise emissions.
From the tire/pavement noise data, the evolution of noise spectra was studied for every section. Figure 12 shows the average spectra from Sections 2 and 4, which present a characteristic behavior of the two groups of sections described before (Sections 1–6). The highest increase of tire/pavement noise levels can be observed, in both groups, at medium frequencies (1 to 2 kHz). At these frequencies the tire/pavement noise values are conducted by a mixture of several noise generation mechanisms related to impacts and vibration (tire/pavement), and the aerodynamical effects and the mechanical impedance of the pavement. However, the highest increments of tire/pavement noise at medium frequencies are achieved in the second group (Sections 4 and 5). At these sections the tire/pavement noise levels increase considerably at high, medium and low frequencies (approximately +2.5 dB(A) at every plotted frequency band). Low frequencies increase with texture amplitude (MPD); thus, these frequencies could be related to deformation and damage of the wearing courses [7,37]. On the other hand, the increase at medium frequencies could be also due to the deterioration of the wearing courses, but also to the increase of the dynamic stiffness (mechanical impedance) of the aged bituminous mixtures [38,39]. Finally, at high frequencies (above 2 kHz), the higher LCPtr, 50 km/h values of Sections 4 and 5 could be due to a higher “horn effect”, as well as to the increase of other noise generation mechanisms (stick-slip and stick-snap mechanisms) [30].
To sum up, the best acoustic performance was achieved in the sections of the first group (Sections 1, 2, 3 and 6), which were built with a wearing course-type slurry seal. These mixtures also show lower MPD values (from 0.49 to 0.60 mm in 2015) than the sections of the second group, i.e., Sections 4 and 5 (0.79 and 1.41 mm in 2015). Section 1 was rehabilitated in 2012 with the same type of bituminous mixture as Sections 2, 3 and 6, and thus its results agree with those of the similar sections. Sections 4 and 5 were built with a conventional bituminous mixture-type asphalt concrete with a maximum aggregate size of 22 mm. Their worse tire/pavement noise evolution may be due to the deterioration of their surface (raveling, cracks and scattered potholes).

5.2. Rolling Noise Mapping at 50 km/h and Environmental Noise Levels (Environmental Noise Directive (END))

The acoustic situation of the National Roads N-401 and N-430, within the urban area of Ciudad Real, was studied according to the environmental noise directive (END), and the Strategic Noise Maps (MER) published in 2012 [27] (Figure 4b). This figure shows that every zone adjacent to the studied sections presents environmental noise levels Lden between 65 and 69 dB(A). According to the Strategic Noise Map (2012), the population affected in these areas by noise levels (higher than 65 dB) is about 33% of their total population [27].
To assess the evolution over time of the environmental noise levels, the authors have estimated the theoretical environmental noise levels at 4 m height (Lenv-CPtr) from CPX tire/pavement noise levels (LCPtr, 50 km/h). The values of Lenv-CPtr are estimated from the measurement campaigns accomplished in 2013 and 2015, and these values are compared to the noise levels (Lden) of the Environmental Noise Maps (MER 2012) in Figure 13. Lenv-CPtr values are the theoretical environmental noise produced by the tire/pavement interaction (linear source); since this source of noise could be considered as the main noise within the studied sections (see Section 2). It must be said that Lenv-CPtr is not the real environmental noise, since there are different factors that could affect the real levels; nevertheless, its estimation from LCPtr, 50 km/h could be a useful procedure to estimate the evolution of environmental noise of urban areas throughout easy measurements.
To sum up, the Lenv-CPtr noise level is a simple theoretical estimation of environmental noise at 4 m height (produced by traffic noise), where just the noise attenuation by distance has been taken into account. As seen in Figure 13, the buildings have been also considered. The grey-dots line defines the line of the façades, from which the equal-loudness contour is unknown due to the attenuation effect of the buildings. The influence of other factors such as ground absorption and attenuation due to vegetation have not been considered in this estimation.
Although Figure 13a (2012, MER) and Figure 13b (2013, from CPX) should be rather similar, there are some factors that must justify the maladjustment of equal-loudness contours. Some of them have been previously cited:
(a)
The attenuation due to the ground absorption or green walls: this effect could have some importance at great distance, such as at the right side of the studied section, where there are no buildings that block the noise propagation.
(b)
The time gap between Lden and Lenv-CPtr measurements. Surface aging during this time interval was possible, especially if the road surface was considerably degraded in 2012. Nevertheless, the gap is not sufficiently large to say that this was a key factor.
(c)
Different noise source related to vehicle density. Figure 13b was elaborated from CPX measurement, which consider a vehicle producing noise at every point of Section 4 and at every second (linear noise source: busy lane). Nevertheless, there is not a vehicle producing noise at every point and every second in Section 4. As shown in Table 1, the annual average daily traffic is 11,157 vehicles/day (from gauging station B, Figure 4a). Considering the worst case (every vehicle during the 12 h of a day and none at evening and afternoon), there would be one vehicle producing noise every 3.9 s. Thus, the real noise source from traffic is not a linear noise source indeed, and therefore, noise at Figure 13b,c has been over estimated.
Despite the differences between Figure 13a,b, the theoretical environmental noise estimation from CPX measurements is a useful method in order to assess the acoustic situation of urban landscapes. Moreover, Figure 13c shows how this situation is getting worse over the time. The use of CPX data to estimate the environmental noise (Lenv-CPtr) can be a suitable procedure to assess the acoustic evolution of urban areas in a straightforward way.
On the other hand, as seen in Figure 13b,c, the urban areas assessed in 2013 are affected by acoustic pollution. The environmental noise levels exceed the maximum noise levels allowed in these areas (Lday = 65 dB(A), residential use). On the other hand, environmental noise will have considerably increased between 2013 and 2015. According to Figure 13c, the Lden levels would have increased (regarding 2012), affecting new areas where dwellings and buildings with educational use are sited. Thus, corrective actions would be needed in order to improve the acoustic performance of every studied section (especially Section 4).

6. Conclusions

This work focuses on pavement surface aging and its effect on tire/pavement noise (and environmental noise) in a medium-sized city. The main scope of this paper is to assess the medium-term evolution of urban pavements’ surface characteristics, such as the tire/pavement noise and the MPD, and the relationship between them. A theoretical estimation of environmental noise levels due to tire/pavement interaction (Lenv-CPtr), and its comparison with the Strategic Noise Maps (MER; Lden), was also accomplished.
The CPX results presented in this research work show better behavior in those pavements fabricated with slurry seal layers with regard to conventional mixture-type asphalt concrete. The quieter behavior must be linked to smoother surfaces (lower macrotexture amplitudes, lower noise generation related to impact and vibrations). However, measured LCPtr, 50 km/h levels were higher than those achieved with other paving solutions such as BBTM or PAC pavements.
According to the results, the MPD could be related to the pavement aging, and therefore, the evolution of the tire/pavement noise. However, the MPD–LCPtr, 50 km/h relationship does not follow the same pattern for every studied section. This relation depends on the pavement’s original characteristics and its degree of deterioration. Each studied pavement surface (slurry seal, asphalt concrete) was affected by different pavement failures, and therefore their MPD evolution was different. Nevertheless, tire/pavement noise is not just related to macrotexture amplitude (MPD), there are other pavement characteristics involved in its generation. Due to this, sections with higher MPD values are not the noisiest sections. In any case, the acoustic situation of the studied areas must be improved to meet the European END.
Rolling noise mapping (theoretical environmental noise levels Lenv-CPtr) from LCPtr, 50 km/h has been depicted. These maps are based on the geometrical spreading of sound energy. The employed methodology does not take into account ground absorption, and considers a continuous traffic noise (linear sound source). Nevertheless, this methodology represents a valuable technique to assess the evolution of environmental noise, especially at short distances from the noise sources (closest façades). This methodology is based on real CPX measurements; thus, it shows the real state of the pavement.
Rolling noise mapping could be a useful tool for local and regional authorities when maintenance actions must be carried out on roads to improve their service performance: this assessment allows us to recognize when and where these maintenance actions should be accomplished. Besides, the acoustic assessment by CPX could be integrated into standards such as EN-12271 (surface dressing) or EN-12273 (slurry surfacing), in order to characterize surface treatments.

Author Contributions

Experimental measurements were conducted by all the co-authors. The analysis of the results was conducted by V.F.V. The interpretation of the results as well as conclusions were conducted by V.F.V. and S.E.P., and the manuscript was written and reviewed by all the co-authors.

Funding

This work was partially supported by the Spanish Ministry of Economy and Competitiveness with European Regional Development Funds (FEDER), in the project TRA2016-77418-R (AEI/FEDER, UE) within the framework of the National Plan for Scientific Research.

Acknowledgments

The authors wish to acknowledge F. Paz for his valuable assistance.

Conflicts of Interest

The authors declare no conflict of interest.

References

  1. Torija, A.J.; Genaro, N.; Ruiz, D.P.; Ramos-Ridao, A.; Zamorano, M.; Requena, I. Priorization of acoustic variables: Environmental decision support for the physical characterization of urban sound environments. Build. Environ. 2010, 45, 1477–1489. [Google Scholar] [CrossRef]
  2. Guillermo, R.G.; Juan Miguel, B.M.; José, T.C.; David, M.G.; Pedro, A.M.; Valentín, G.M.; Rosendo, V.G.; Juan, A.M.S.; Carlos, P.G. Study on the relation between urban planning and noise level. Appl. Acoust. 2016, 111, 143–147. [Google Scholar]
  3. Bluhm, G.; Eriksson, C. Cardiovascular effects of environmental noise: Research in Sweden. Noise Health 2011, 13, 212–216. [Google Scholar] [CrossRef] [PubMed]
  4. Banerjee, D.; Das, P.P.; Foujdar, A. Association between road traffic noise and prevalence of coronary heart disease. Environ. Monit. Assess. 2014, 186, 2885–2893. [Google Scholar] [CrossRef] [PubMed]
  5. Licitra, G.; Cerchiai, M.; Teti, L.; Ascari, E.; Fredianelli, L. Durability and variability of the acoustical performance of rubberized road surfaces. Appl. Acoust. 2015, 94, 20–28. [Google Scholar] [CrossRef]
  6. Soares, F.; Freitas, E.; Cunha, C.; Silva, C.; Lamas, J.; Mouta, S.; Santos, J.A. Traffic noise: Annoyance assessment of real and virtual sounds based on close proximity measurements. Transp. Res. Part D 2017, 52, 399–407. [Google Scholar] [CrossRef]
  7. Vázquez, V.F.; Paje, S.E. Study of the road surface properties that control the acoustic performance of a rubberized asphalt mixture. Appl. Acoust. 2016, 102, 33–39. [Google Scholar] [CrossRef]
  8. Donavan, P.R.; Rymer, B. Effects of aging on tire-pavement noise generation for concrete pavements of different textures. Transp. Res. Rec. 2011, 2233, 152–160. [Google Scholar] [CrossRef]
  9. Mogrovejo, D.E.; Flintsch, G.W.; Izeppi, E.D.D.; McGhee, K.K.; Burdisso, R.A. Short-term effect of pavement surface aging on tire-pavement noise measured with onboard sound intensity methodology. Transp. Res. Rec. 2014, 2403, 17–27. [Google Scholar] [CrossRef]
  10. Sandberg, U.; Ejsmont, J.A. Tyre/Road Noise Reference Book; INFORMEX: Kisa, Sweden, 2002; ISBN 91-631-2610-9. [Google Scholar]
  11. Anfosso-Lédée, F. Modeling the local propagation effects on tire-road noise: Propagation filter between CPX and CPB measurements. In Proceedings of the Inter-Noise Congress, Prague, Czech Republic, 22–25 August 2004. [Google Scholar]
  12. Bérengier, M.; Bendtsen, H.; Haider, M. A methodology to estimate the effect of pavement management on noise emission in urban areas. In Proceedings of the 19th International Congress on Acoustic, Madrid, Spain, 2–7 September 2007. [Google Scholar]
  13. Cesbron, J.; Klein, P. Correlation between tyre/road noise levels measured by the Coast-By and the Close-ProXimity methods. Appl. Acoust. 2017, 126, 36–46. [Google Scholar] [CrossRef]
  14. Van Blokland, G.; Roovers, M.S. SILVIA Deliverable D14: Measurement Methods; Technical Report SILVIA-M+P-015-02-WP2-140705, SILVIA Project Report; European Commission: Brussels, Belgium, 2005. [Google Scholar]
  15. Peeters, H.M.; Roovers, M.S. CPX-SPB/CPB Relation; Technical Report SILVIA-M+P-008-00-WP2-080904, SILVIA Project Report; European Commission: Brussels, Belgium, 2004. [Google Scholar]
  16. Haider, M.; Descornet, G. Noise Classification Methods for Urban Road Surfaces; Classification Methodology; F.D13, Project SILENCE; European Commission: Brussels, Belgium, 2006. [Google Scholar]
  17. Licitra, G.; Losa, M.; Alfinito, L.; Cerchiai, M. Correlation factor between statistical Pass-By and Close-ProXimity noise level on Italian roads. In Proceedings of the 19th International Congress on Acoustic, Madrid, Spain, 2–7 September 2007. [Google Scholar]
  18. Jonasson, H. Test Method for the Whole Vehicle; Technical Report HAR11TR-020301-SP10; European Commission: Brussels, Belgium, 2004. [Google Scholar]
  19. Anfosso Lédée, F.; Dutilleux, G.; Conter, M. Compatibility of the ROSANNE noise characterization procedure for road surfaces with CNOSSOS-EU model. In Proceedings of the Inter-Noise Congress, Hamburg, Germany, 21–24 August 2016. [Google Scholar]
  20. Skov, R.S.H. Analysis and comparison of methods, CPX and SPB, for measuring noise properties of road surfaces. In Proceedings of the Inter-Noise Congress, Hamburg, Germany, 21–24 August 2016. [Google Scholar]
  21. Gardziejczyk, W. The effect of time on acoustic durability of low noise pavements—The case studies in Poland. Transp. Res. Rec. Part D 2016, 44, 93–104. [Google Scholar] [CrossRef]
  22. Gardziejczyk, W. Influence of road pavement macrotexture on tyre/road noise of vehicles. Baltic J. Road Bridge Eng. 2014, 9, 180–190. [Google Scholar] [CrossRef]
  23. Tonin, R. Quiet road pavements: Design and measurement—State of the art. Acoust. Austral. 2016, 44, 235–247. [Google Scholar] [CrossRef]
  24. Licitra, G.; Cerchiai, M.; Teti, L.; Ascari, E.; Bianco, F.; Chetoni, M. Performance assessment of low-noise load surfaces in the leopoldo Project: Comparison and validation of different measurement methods. Coatings 2015, 5, 3–25. [Google Scholar] [CrossRef]
  25. Harris, C.M. Handbook of Acoustical Measurements and Noise Control, 3rd ed.; McGraw-Hill: New York, NY, USA, 1991. [Google Scholar]
  26. Makarewicz, R. Cylindrical spreading due to downwind refraction. J. Acoust. Soc. Am. 2016, 139, 1611–1617. [Google Scholar] [CrossRef] [PubMed]
  27. DGC. Dirección General de Carreteras (Ministerio de Fomento). Mapas Estratégicos de Ruido de las Carreteras de la Red del Estado Segunda Fase. 2012. 2013. (Strategic Noise Maps of Spanish Road Network). Retrieved 24 March 2018. Available online: http://sicaweb.cedex.es/mapas-consulta-fase2.php (accessed on 29 May 2018). (In Spanish).
  28. Carlos, I.M.; Luis, D.B.; Mario, S. Noise pollution in national parks: Soundscape and economic valuation. Landsc. Urban Plan. 2014, 123, 1–9. [Google Scholar]
  29. Feiteira Dias, J.L.; Picado-Santos, L.G.; Capitao, D.D. Mechanical performance of dry process fine crumb rubber asphalt mixture placed on the portuguese road network. Constr. Build. Mater. 2014, 73, 247–254. [Google Scholar] [CrossRef]
  30. Paje, S.E.; Luong, J.; Vázquez, V.F.; Bueno, M.; Miró, R. Road pavement rehabilitation using a binder with a high content of crumb rubber: Influence on noise reduction. Constr. Build. Mater. 2013, 47, 789–798. [Google Scholar] [CrossRef]
  31. Vázquez, V.F.; Luong, J.; Bueno, M.; Teran, F.; Paje, S.E. Assessment of an action against environmental noise: Acoustic durability of a pavement Surface with crumb rubber. Sci. Total Environ. 2016, 542, 223–230. [Google Scholar] [CrossRef] [PubMed]
  32. Bueno, M.; Luong, J.; Terán, F.; Viñuela, U.; Vázquez, V.F.; Paje, S.E. Noise reduction properties of an experimental bituminous slurry with crumb rubber incorporated by the dry process. Coatings 2014, 4, 602–613. [Google Scholar] [CrossRef]
  33. Paje, S.E.; Bueno, M.; Terán, F.; Miró, R.; Pérez-Jiménez, F.; Martínez, A.H. Acoustic field evaluation of asphalt mixtures with crumb rubber. Appl. Acoust. 2010, 71, 578–582. [Google Scholar] [CrossRef]
  34. Paje, S.E.; Bueno, M.; Terán, F.; Viñuela, U.; Luong, J. Assessment of asphalt concrete acoustic performance in urban streets. J. Acoust. Soc. Am. 2008, 123, 1439–1445. [Google Scholar] [CrossRef] [PubMed]
  35. Bueno, M.; Viñuela, U.; Teran, F.; Paje, S.E.; Luong, J. A first step toward a close proximity noise map. J. Acoust. Soc. Am. 2008, 123, 3686. [Google Scholar] [CrossRef]
  36. Mioduszewski, P.; Gardziejczyk, W. Inhomogeneity of low-noise wearing courses evaluated by tire/road noise measurements using the close-proximity method. Appl. Acoust. 2016, 111, 58–66. [Google Scholar] [CrossRef]
  37. Sandberg, U. Road traffic noise—The influence of the road surface and its characterization. Appl. Acoust. 1987, 21, 97–118. [Google Scholar] [CrossRef]
  38. Li, M.; van Keulen, W.; Ceylan, H.; Cao, D.; van de Ven, M.; Molenaar, A. Pavement stiffness measurements in relation to mechanical impedance. Constr. Build. Mater. 2016, 102, 455–461. [Google Scholar] [CrossRef]
  39. Vazquez, V.F.; Paje, S.E. Dynamic stiffness assessment of construction materials by the resonant and non-resonant methods. J. Nondestruct. Eval. 2016, 35, 34. [Google Scholar] [CrossRef]
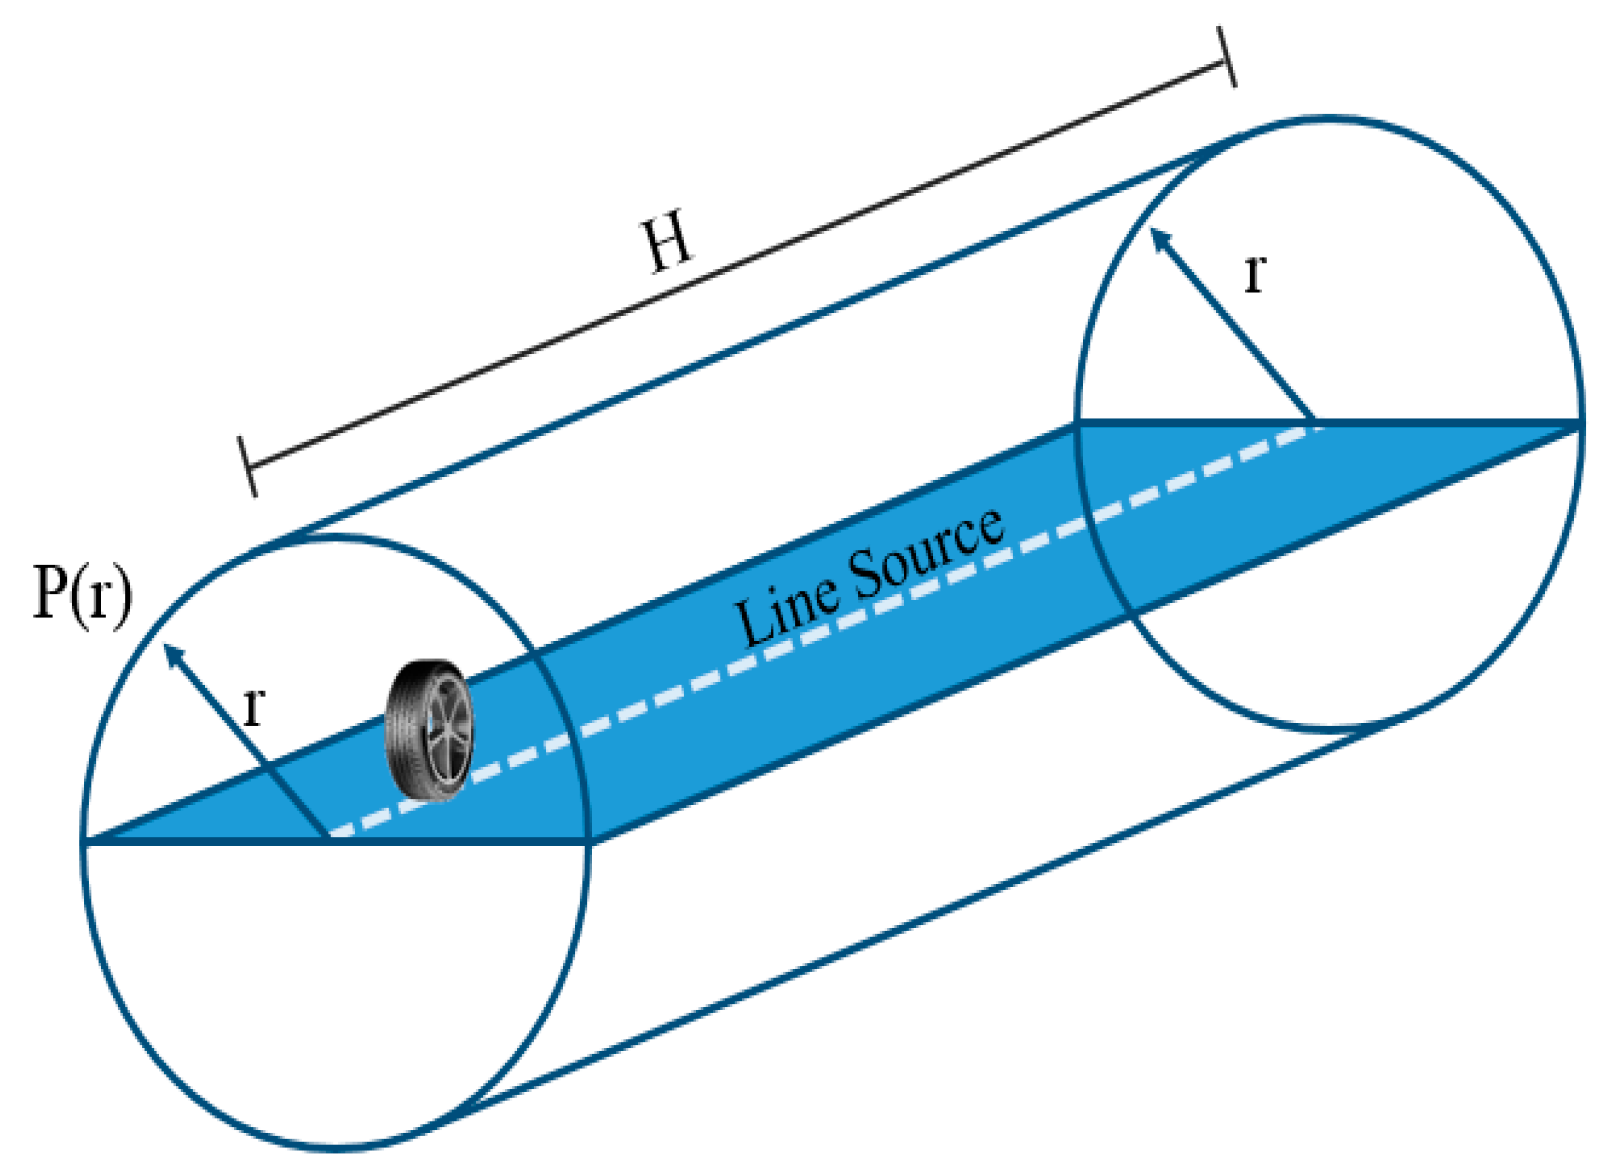
Figure 1. Cylindrical noise spreading (undefined line source).
Coatings 08 00206 g001
Figure 2. Lp noise levels at 4 m height depending on the ri distance from the source.
Coatings 08 00206 g002
Figure 3. Ciudad Real and surrounding urban areas.
Coatings 08 00206 g003
Figure 4. (a) Sections and gauging stations, (b) Strategic Noise Map (2012) of Ciudad Real.
Coatings 08 00206 g004
Figure 5. Equipment employed for the simultaneous measure of tire/pavement noise levels and surface profile.
Coatings 08 00206 g005
Figure 6. Semi-anechoic chamber with the reference tire and microphone positions.
Coatings 08 00206 g006
Figure 7. Noise-level distribution over a representative length of the studied sections, measured at 50 km/h. (a) Section 2, (b) Section 3, (c) Section 4, (d) Section 5.
Coatings 08 00206 g007
Figure 8. Time evolution of LCPtr, 50 km/h (columns) and mean profile depth (MPD) (points) of the studied sections.
Coatings 08 00206 g008
Figure 9. Comparison of some studied sections: S.2 (slurry seal), S.4 and S.5 (asphalt concrete)
Coatings 08 00206 g009
Figure 10. LCPtr, 50 km/h of the studied sections of Ciudad Real: (a) 2008, (b) 2013, (c) 2015.
Coatings 08 00206 g010
Figure 11. Average tire/pavement noise spectra (LCPtr, 50 km/h, 2015) from tire/pavement noise maps.
Coatings 08 00206 g011
Figure 12. Evolution of LCPtr, 50 km/h spectra of characteristic Sections 2 and 4 (2008–2015).
Coatings 08 00206 g012
Figure 13. Environmental noise levels Lden (2012 (a)) and Lenv-CPtr (2013 (b) and 2015 (c)) of Section 4. The grey-dotted line defines the line of the façades near the noise source.
Coatings 08 00206 g013
Table 1. Studied sections: characteristics and adjacent land uses (age referred to 2015). Maximum aggregate size (MAS).
SectionStreetMixture Type (MAS, mm)Age (Years)Vehicles/DayUse (Left/Right)
1N-401 Toledo roadSlurry Seal (10)>36200Dwellings/Business park
2N-430C Ronda ToledoSlurry Seal (10)>10Dwellings/Schools, Univ.
3N-430C Ronda CalatravaSlurry Seal (10)>10Dwellings/Schools, Univ.
4N-430 CrossingAsphalt Concrete (22)>811,157Schools, Univ./Dwellings
5N-430 Carrion roadAsphalt Concrete (22)>8Business park/Business park
6N-430 Ronda La MataSlurry Seal (10)>10Schools/Dwellings