2.4. Experimental Results Analysis
Effective modeling relies overwhelmingly on the selection of parameters with the most influence on the phenomenon. For this reason, the statistical study of process results is required before modeling to determine the impact of the parameters and the contribution of each. Several statistical tools can be used, though the most frequently used is the analysis of variation (ANOVA). ANOVA analysis is a computational technique that reveals all the necessary information about the process parameters that can help determine the impact of each parameter and its contribution to the controlling response. Information provided by ANOVA analysis includes degrees of freedom, sum of squares, mean square,
p-value and
f-value; based on this information, the process parameters were ranked according to their importance in the experiment. The response surface methodology (RSM) model corresponding to the measured case depth (
dH) was established according to the analytic methods depicted above. ANOVA analysis was performed with a stepwise mode, which automatically eliminate the insignificant terms.
Table 2 presents the detailed statistical analysis confirming that
f-value is important for almost all factors except the roughness surface and a
p-value of less than 0.09. In this case, the laser power (
PL), scanning speed (
VS) and initial hardness (
HC) were all significant model terms. Based on the ANOVA results, the parameters predominantly affecting the LHQ were laser beam power (52.76%) and beam scanning speed (32.92%). The contribution of initial hardness was less than 5%, and the factor related to surface roughness had no effect on the case depth in that situation. However, the contribution of the total error was about 8.73%. This result means that the process responses were somehow not controlled by the all-important input parameters. The coefficient of determination (
R2) is mainly used to measure the relationship between experimental data and measured data. In this case,
R2 was equal to 91.26%, proving a high correlation between experimental results and predicted results. The predicted
R2 of 54.34% was in representative agreement with the adjusted
R2 of 81.27%. Adequate precision measures the signal to noise ratio. The standard deviation related to the case depth prediction model was evaluated at 0.3201.
A similar experiment was performed with the same input parameters, except that the surface roughness parameter (
Ra) was replaced by surface nature (
SN). In this case, the first level correspond to the surface as initially treated and the second level is that obtained after machine tool finishing. Some similarities were noted regarding
f-value and
p-value concerning the analysis considering
Ra. In fact,
f-value was very important, exceeding 10 for the least significant factor (
SN), and the
p-value was less than 0.015 for
SN again. It was also clear that
PL has the largest effect on the response value,
VS has less of an effect and
HC has a little more effect. The three interaction terms affected the case depth less but were not ignored. This study allows for determination of the various effects and the ranking of each effect on the case depth (
dH). Based on the data in
Table 3, the variation in the three characteristics represents each parameter’s degree of influence on the response. It was confirmed by analyzing their contributions that
PL affects
dH by more than 58.66% and that
VS contributes to the overall variation by more than 16%. The initial hardness influences the case depth by about 19% with an error of less than 2.5%. Most of the parameters were therefore taken into account during this study. It is important to note the non-presence of interactions between the four factors used in this study. The coefficient of determination (
R2) was about 96.03%, proving a high correlation between experimental results and predicted results. The predicted
R2 of 79.26% was in reasonable agreement with the adjusted
R2 of 91.49%. Adequate precision measures the signal to noise ratio. The standard deviation related to the case depth prediction model was evaluated at 0.3240.
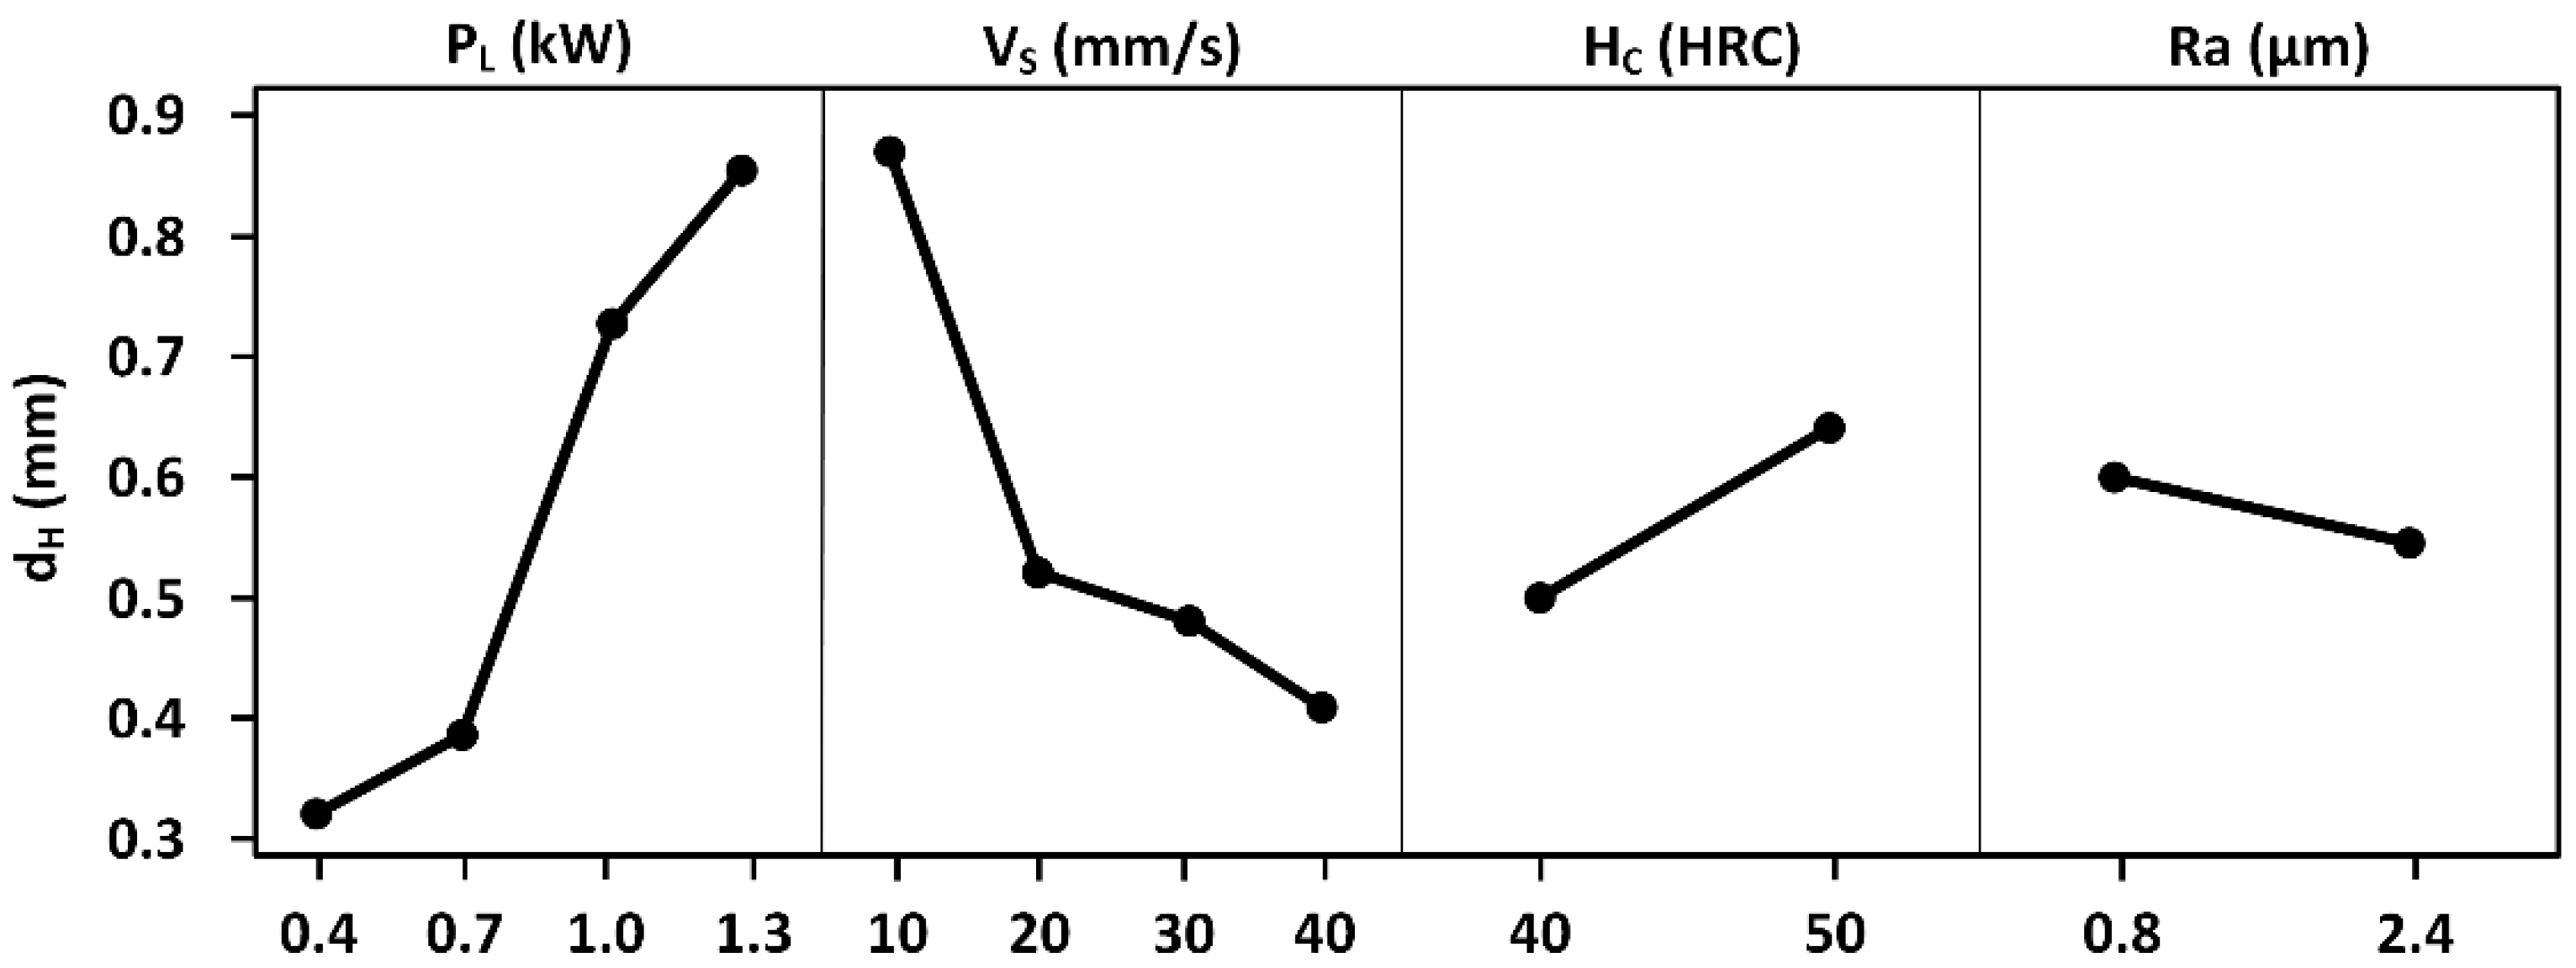
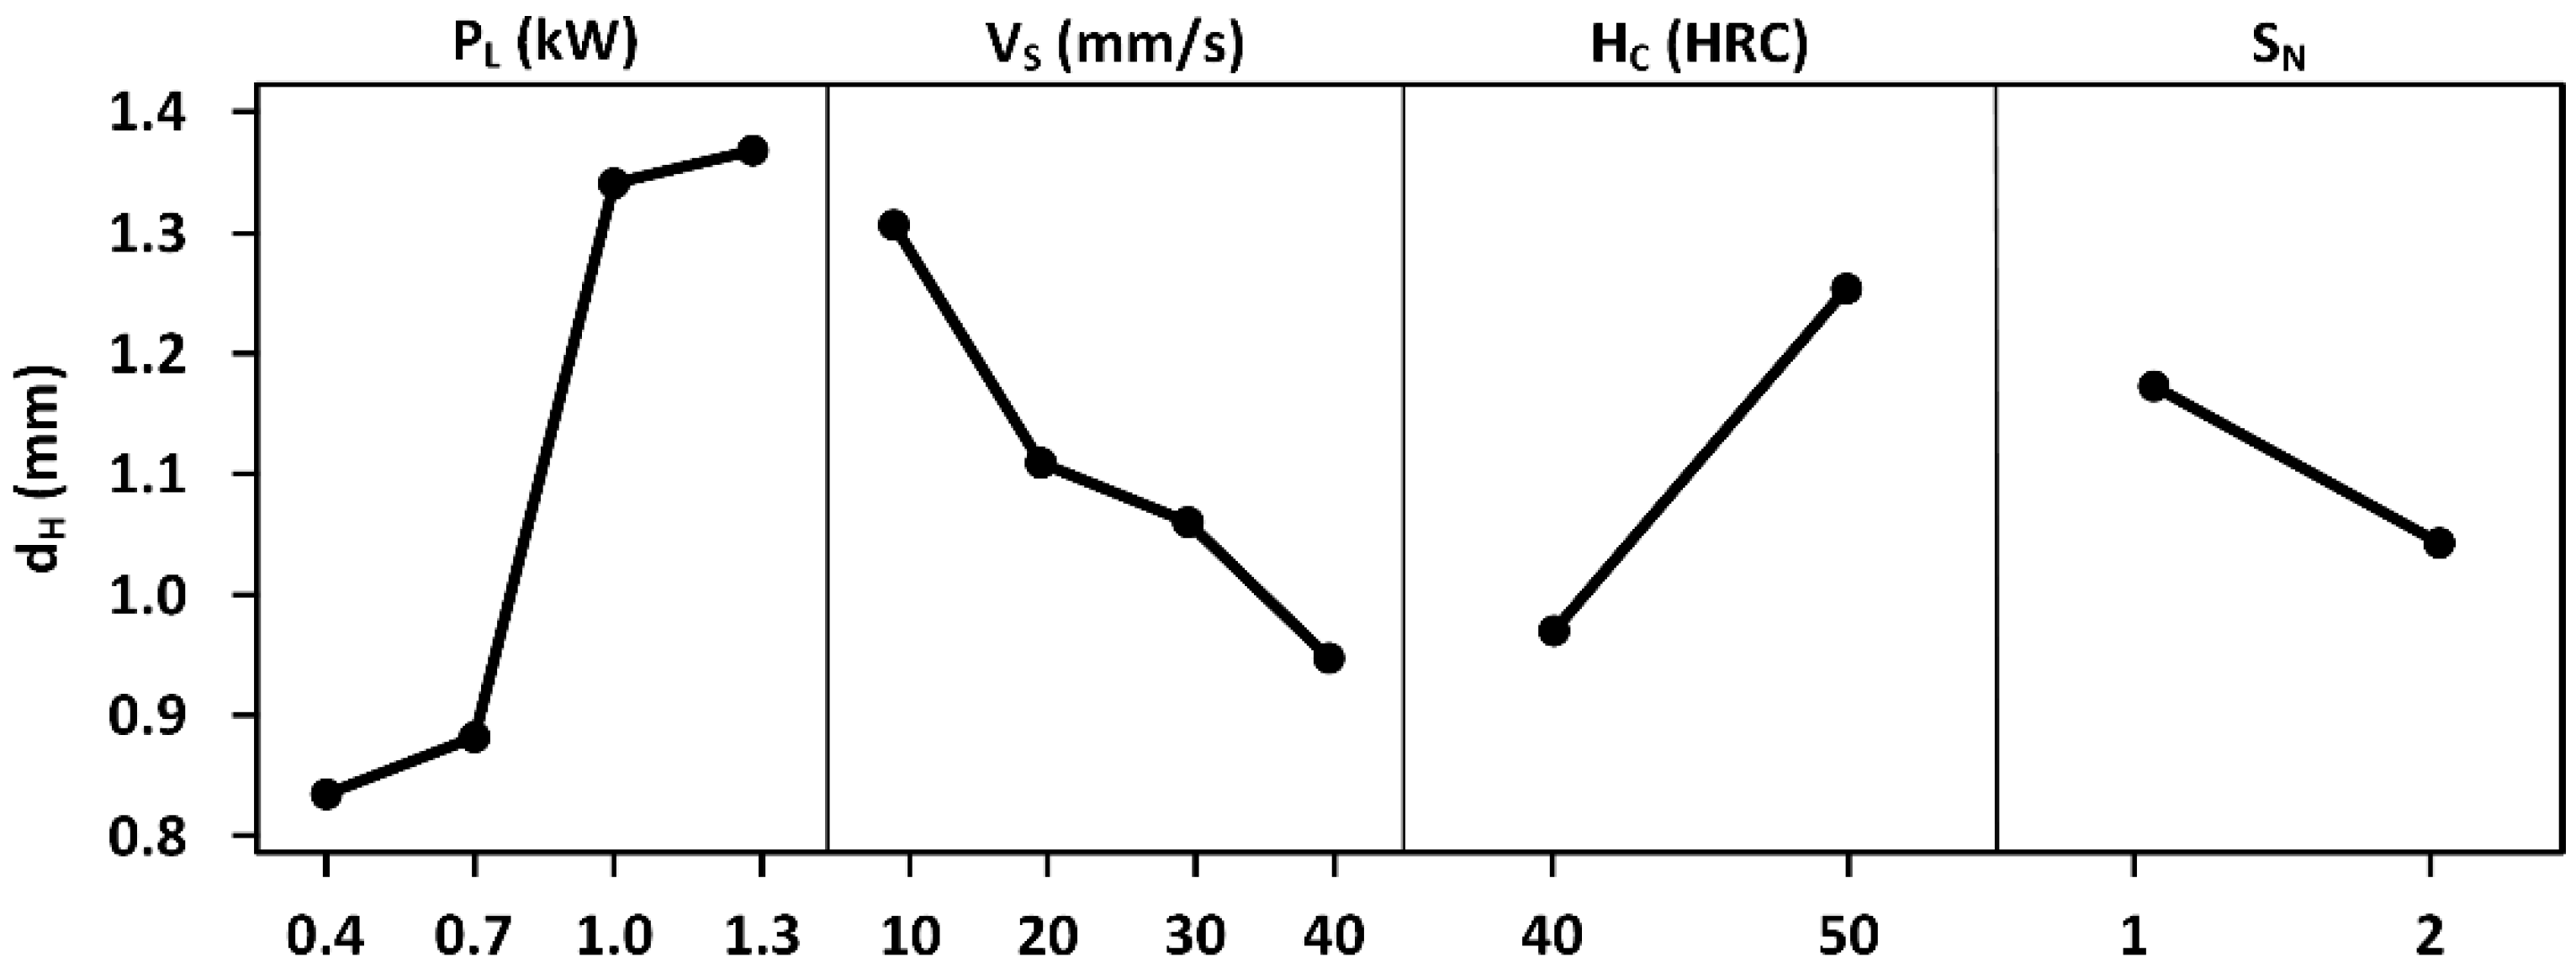
Figure 3 and
Figure 4 present the average effect graphs certifying that the four parameters affected the case depth to different degrees.
dH increased with power and initial hardness and decreased with speed and surface roughness.
dH also increased with power and initial hardness and decreased with speed and surface nature. The drawn points match up to the averages of the observations for each factor level. These results confirm the relative importance of the contribution of different factors in the variation of
dH. The effects of the four factors in both cases (
Ra and
SN) do not follow the same tendencies. Overall, the case depth recorded maximum values at 1.3 kW, 10 mm/s, 50 HRC and
Ra of approximately 0.8 µm. However, the minimum value was recorded at 0.4 kW, 40 mm/s and 40 HRC when the surface roughness was adjusted to 0.8 µm. The case depth recorded maximum values at 1.3 kW, 10 mm/s and 50 HRC when the surface was treated. However, the minimum value was recorded at 0.4 kW, 40 mm/s and 40 HRC when the surface was polished.
The information above shows that the surface nature (SN) of the treated plate had a greater impact on dH and on the other output response than surface roughness (Ra). The error contribution of the second experiment, in which the surface nature was considered as a fourth input parameter, was relatively small compared to the first experiment. This proves that the second experiment considered the important parameters and that laser hardening quality is strongly controlled by these parameters compared to the first experiment. Since the error contribution was less when Ra was replaced by SN in the ANOVA analysis, the selection of PL, VS, HC and SN as input parameters is promising and constitutes an effective choice for LHQ element models. Consequently, elaboration process using the best selection of parameters based on its effect and contribution helps the modeling and the validation steps.


