3.1. Hardness and Roughness
The main results of this experimental part are summarized in
Table 2. Regarding the hardness measurements, two different tests were performed: the first with an applied load of 0.25 N and the second with an applied load of 1 N. The applied loads were used in order to mimic the industrial application of plastic molding. As expected, AlTiN PVD coating showed the best performance at both applied loads. Conversely, TiN exhibited the lowest hardness. It must be noted that TiN has a very low thickness (0.5–1.0 µm), consequently, its hardness could be strongly influenced by penetration depth. As a confirmation of this, a new measurement at a lower applied load (0.1 N) was carried out and a hardness of 913 ± 110 HV
0.01/10 was obtained. This value is comparable with the typical hardness of hard chromium plating (850–1100 Vickers). Depending on the applied load, similar hardness was observed among the other three PVD coatings. This range of values is compatible with the typical hardness required for rubber and plastic molding applications [
2].
Multilayer Cr-based PVD coatings showed a similar performance at high applied load (1 N), while the more brittle layer of NbN seemed to affect the total hardness of the coating at 0.2 N. This finding was also confirmed in the scratch test. With respect to the average surface roughness of the tested coatings, some interesting observations could be drawn by scrutinizing the reported data (
Ra,
Table 2). For the specific application, a high value of roughness is also required [
2,
6]. Moreover, releasing agents affecting the wettability at the emulsion/coating interface during the molding process are commonly used [
2,
6,
17]. We found that AlTiN, TiN, and ZrN PVD coatings again showed better performance than chromium-based coating, exhibiting a higher average roughness factor; indeed, the CrN/Cr showed roughness values three times less. However, when the last layer was different from chromium (CrN/Nb), both hardness and roughness approached the same values for AlTiN, TiN, and ZrN PVD coatings.
3.2. Scratch Test
Coating adhesion was evaluated using the scratch test, and the results are summarized in
Table 2. All coatings showed similar values apart from CrN/Nb, which had low LcI. In
Figure 3, an example of results obtained by measurement on AlTiN PVD coating is shown.
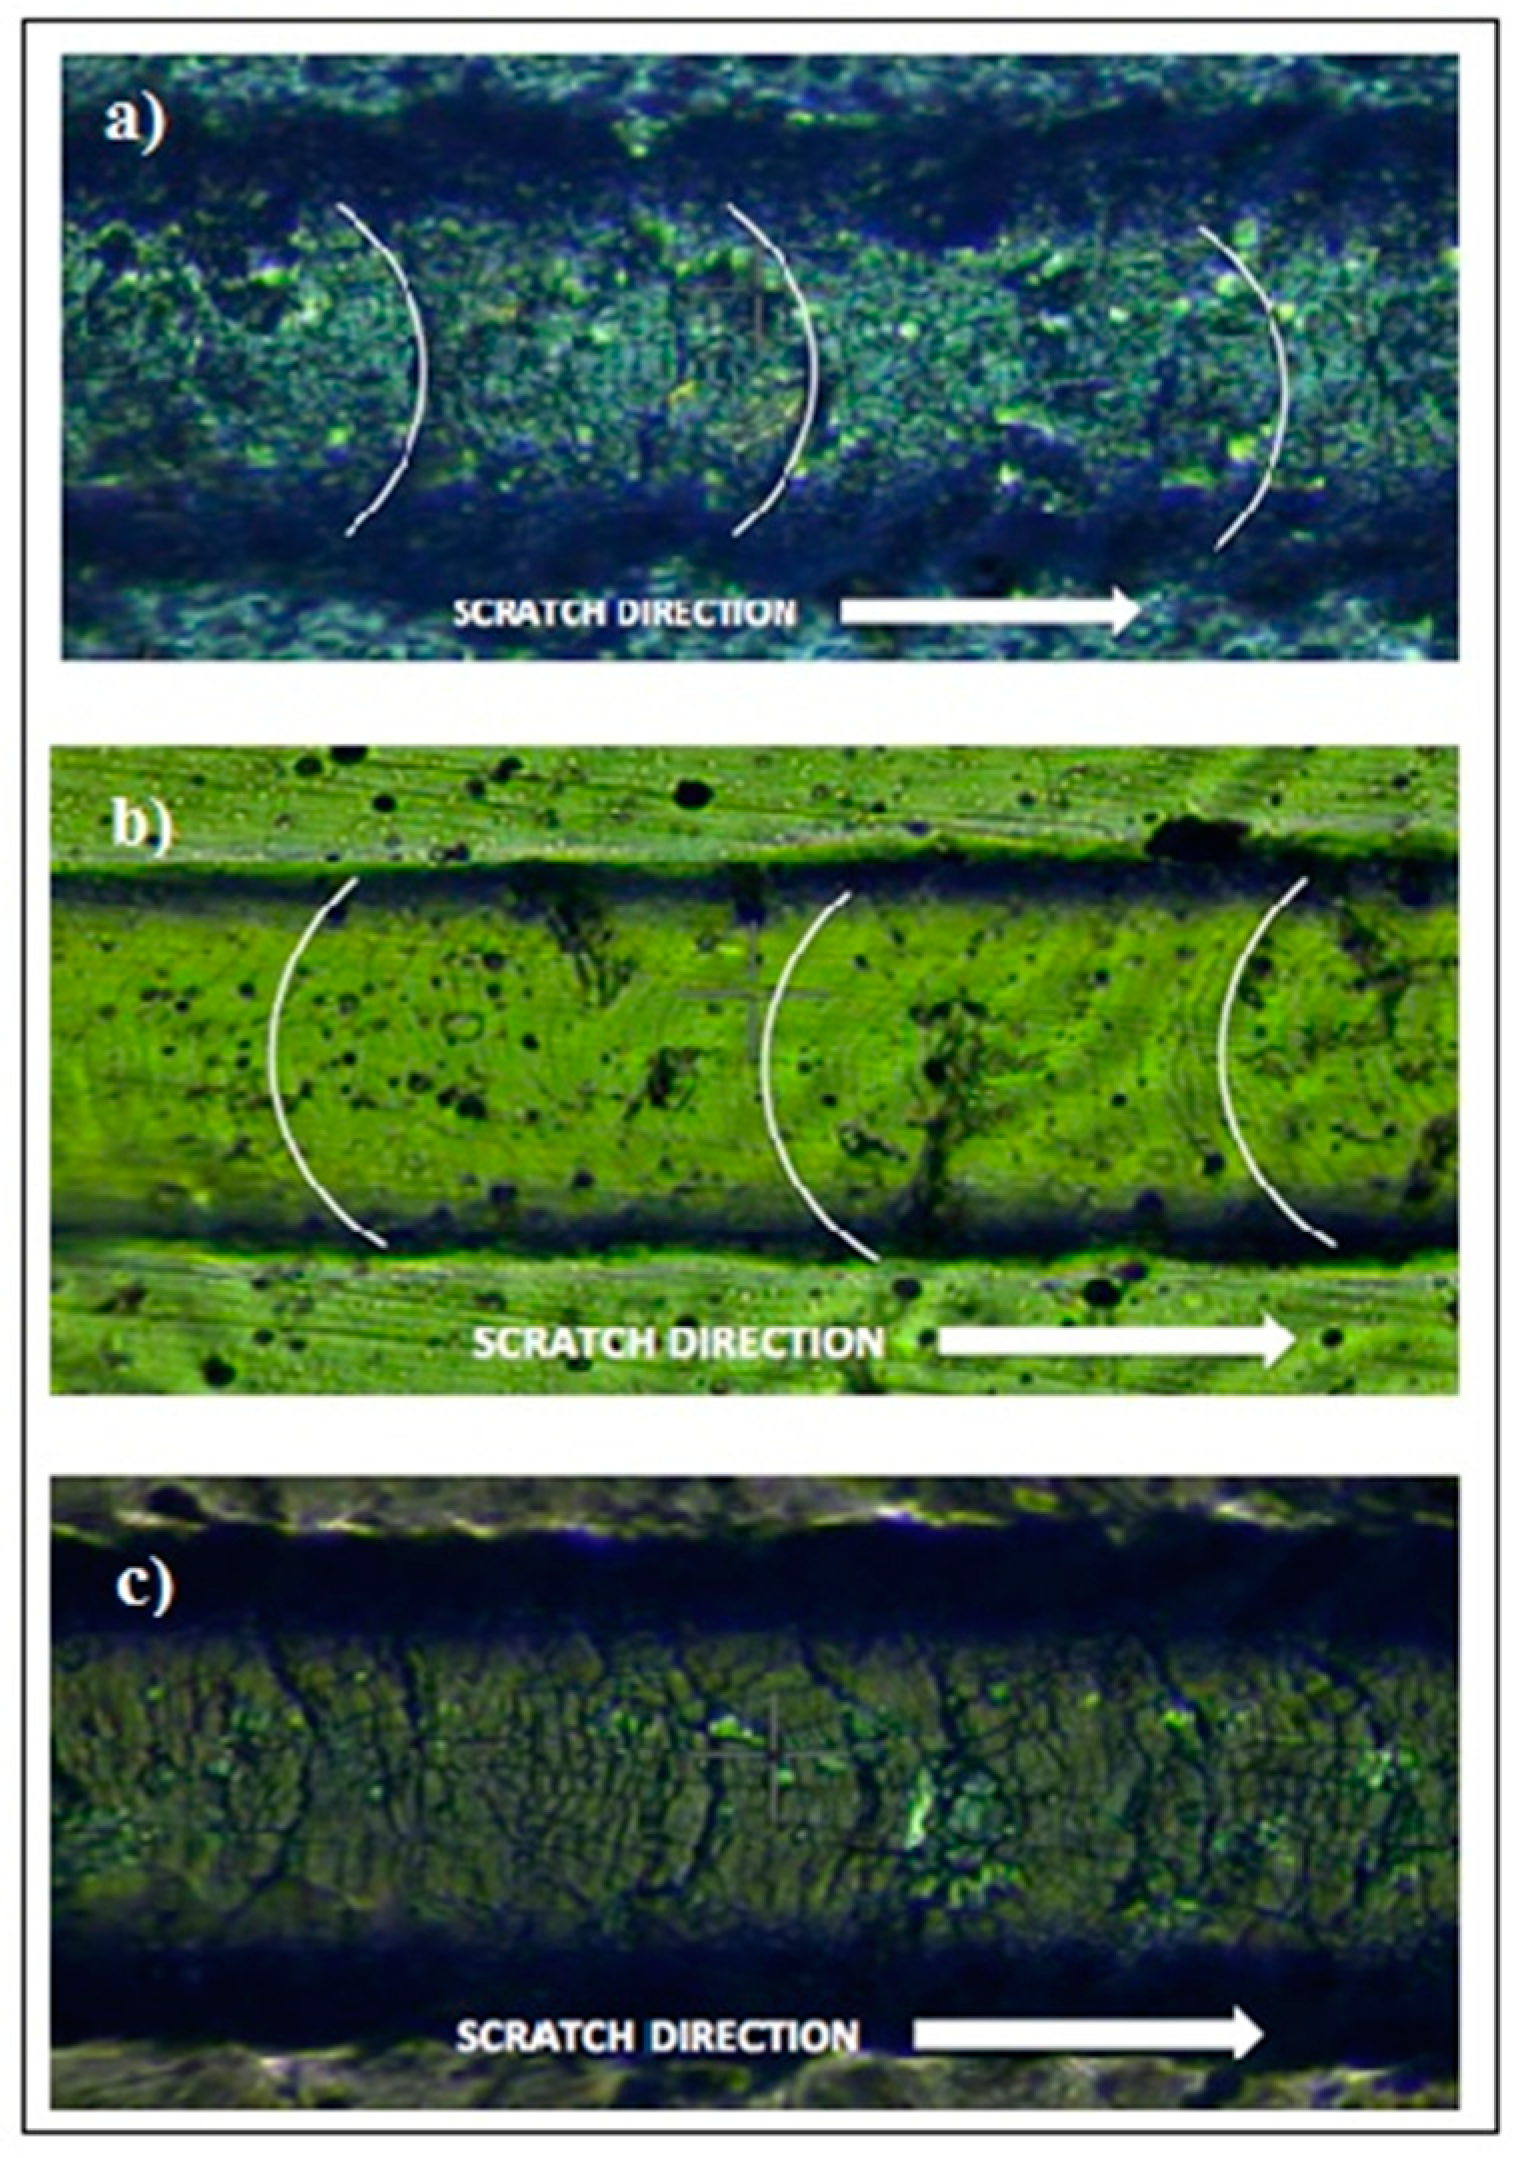
Critical load is not enough to fully evaluate adhesion properties of the coating. For multilayer coatings, both cohesive (inside the same layer) and adhesive (between different layers and coating/substrate) forces should be considered. Scratch tests, together with microscopic observation of the shape of the cracks (
Figure 4), allowed us to determine which forces prevailed. We found that if the crack followed the scratch direction, cohesive forces outweighed adhesive ones (see
Figure 4a) as in the case of AlTiN. Conversely, in the ZrN coating, cracks were oriented in the opposite direction with respect to the scratch, meaning adhesive forces prevailed over cohesive ones (
Figure 4a,b). The cracks on CrN/Cr showed an intermediate shape (
Figure 4c), indicating that adhesive and cohesive forces were comparable.
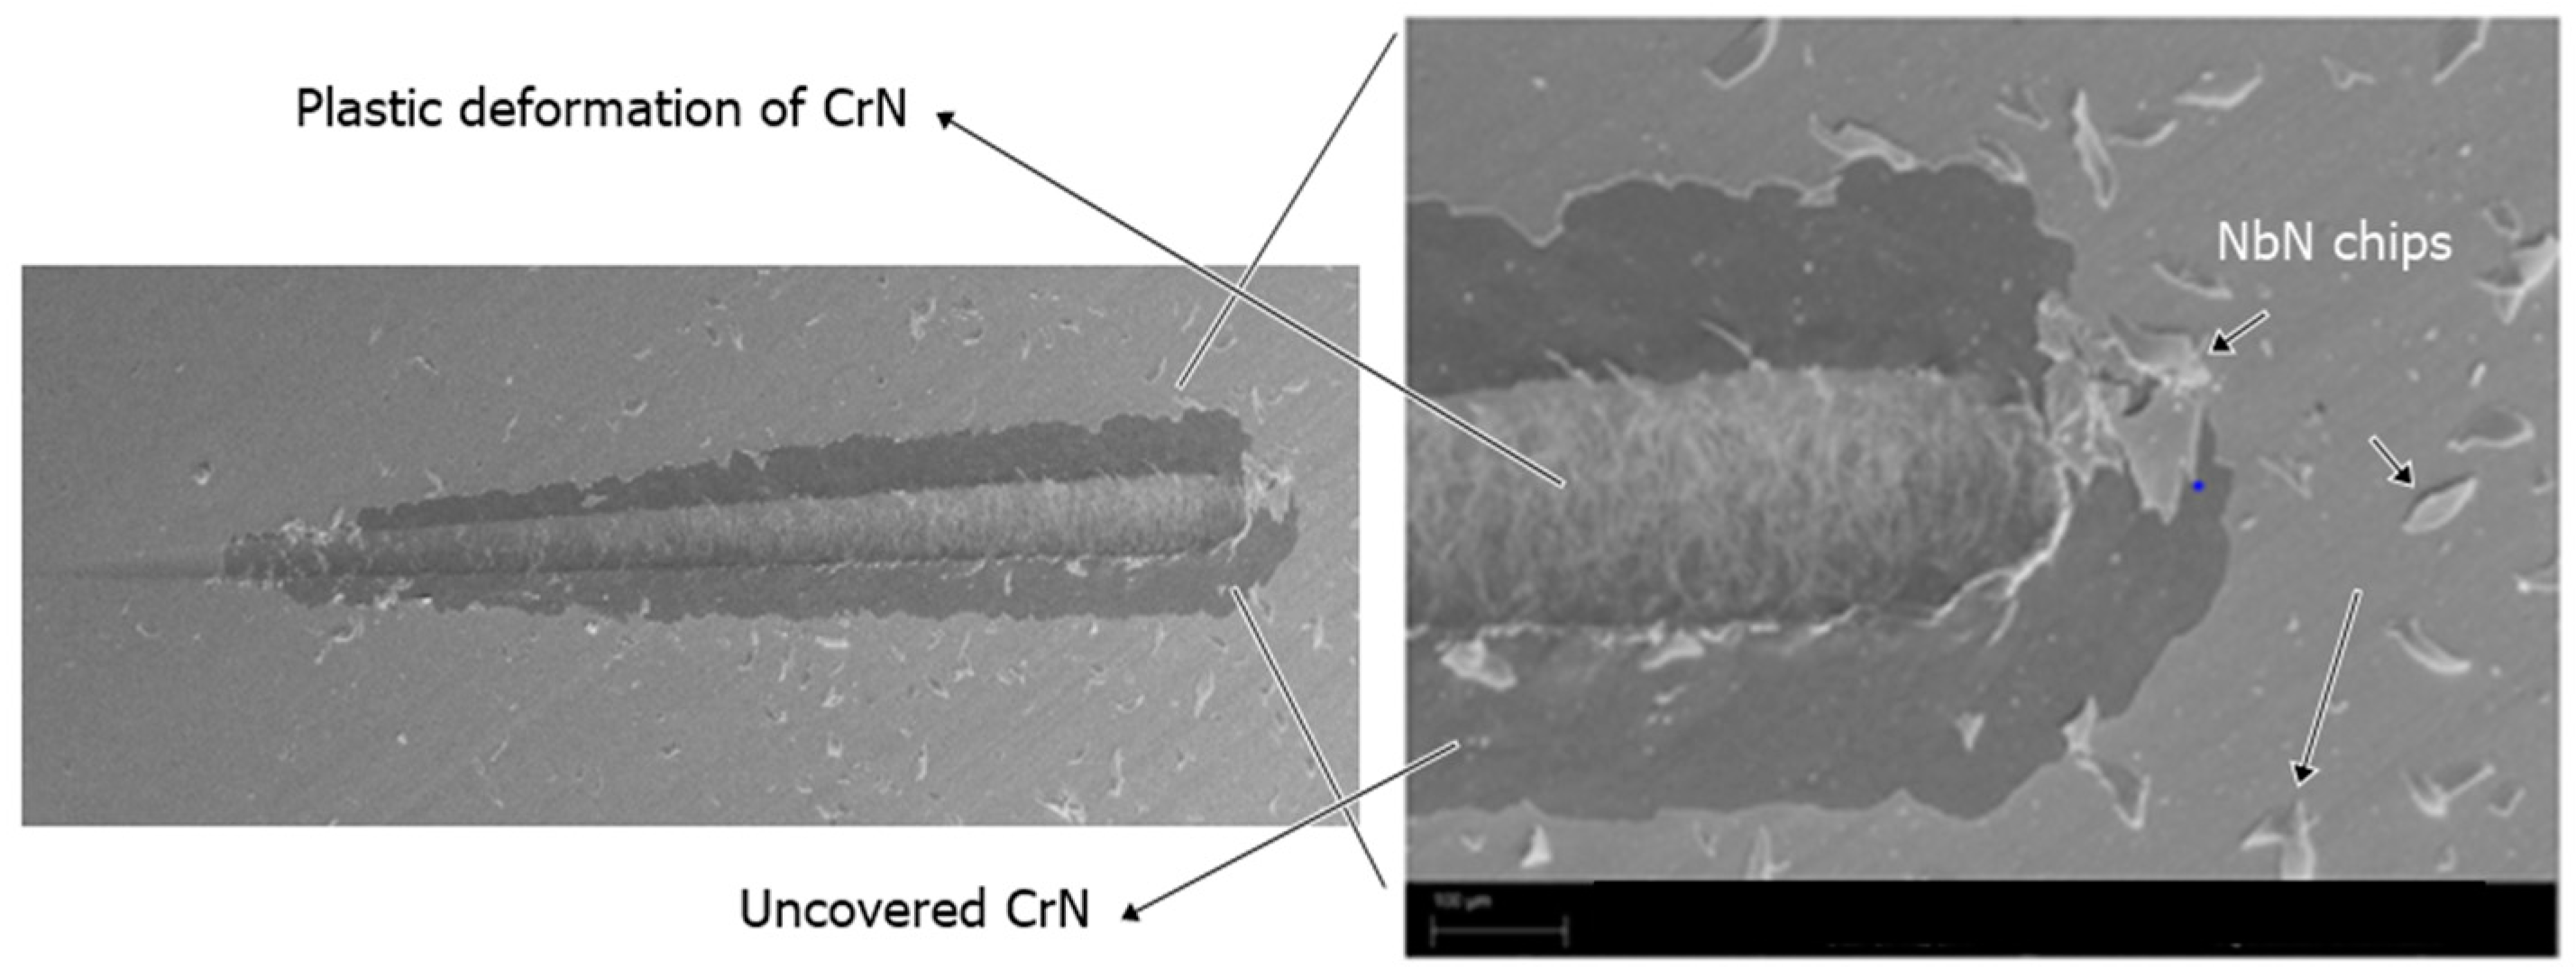
Analyzing the scratch growths, it was possible to point out the damage phenomena involved.
Figure 5 shows a CrN/Nb SEM micrograph of the surface after the scratch. CrN/Nb PVD coating showed the lowest value of first critical load (LcI was 5 N). From the higher magnification, the brittleness and the poor adhesion of the NbN top layer could be observed. A brittle failure and spallation of the NbN uncovering a large area of underlying CrN layer could also be observed. Furthermore, there were visible NbN chips and small to large cracks on the surface. This delamination could be possibly detrimental to corrosion performance of the coating, particularly in aggressive media such as NaCl solution.
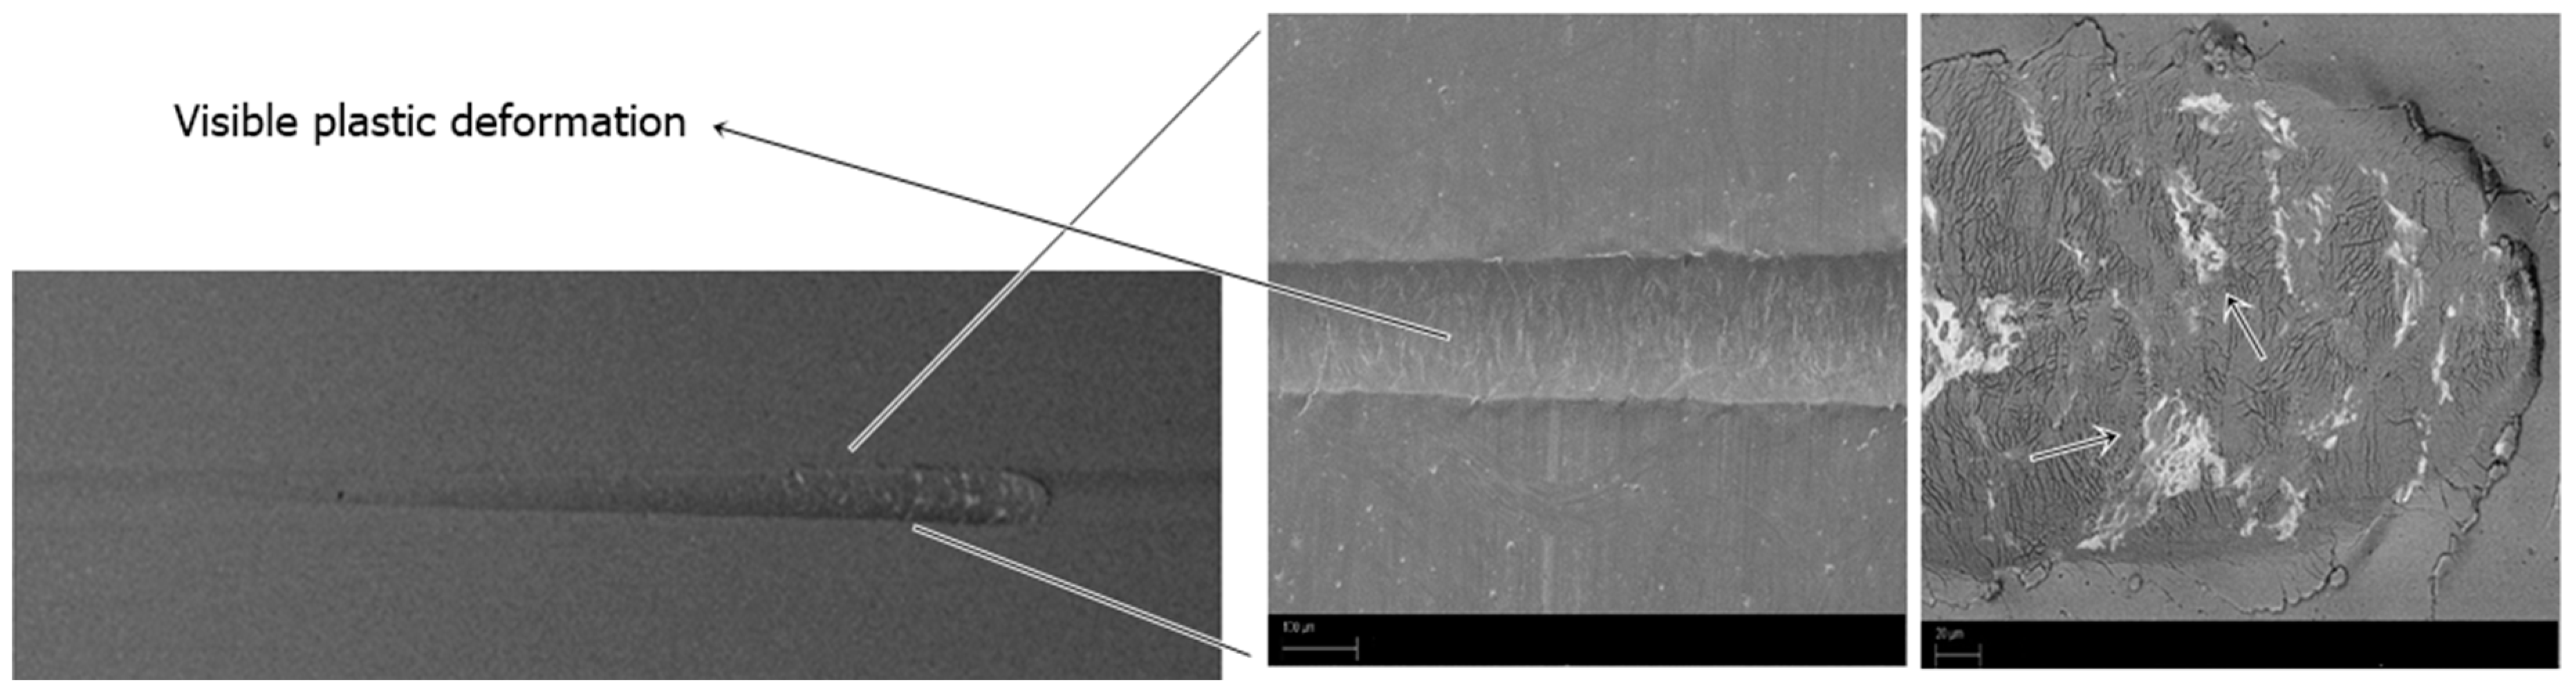
As a comparison, TiN single layer PVD coating after the scratch is shown in
Figure 6. In this case, the adhesion of the coating was higher (LcI was 13 N) than CrN. The damage mechanism of the scratch showed a plastic deformation with presence of arc tensile cracks. Finally, some parts of TiN PVD coating peeled off partially, thus uncovering the substrate clearly visible at the end of the scratch.
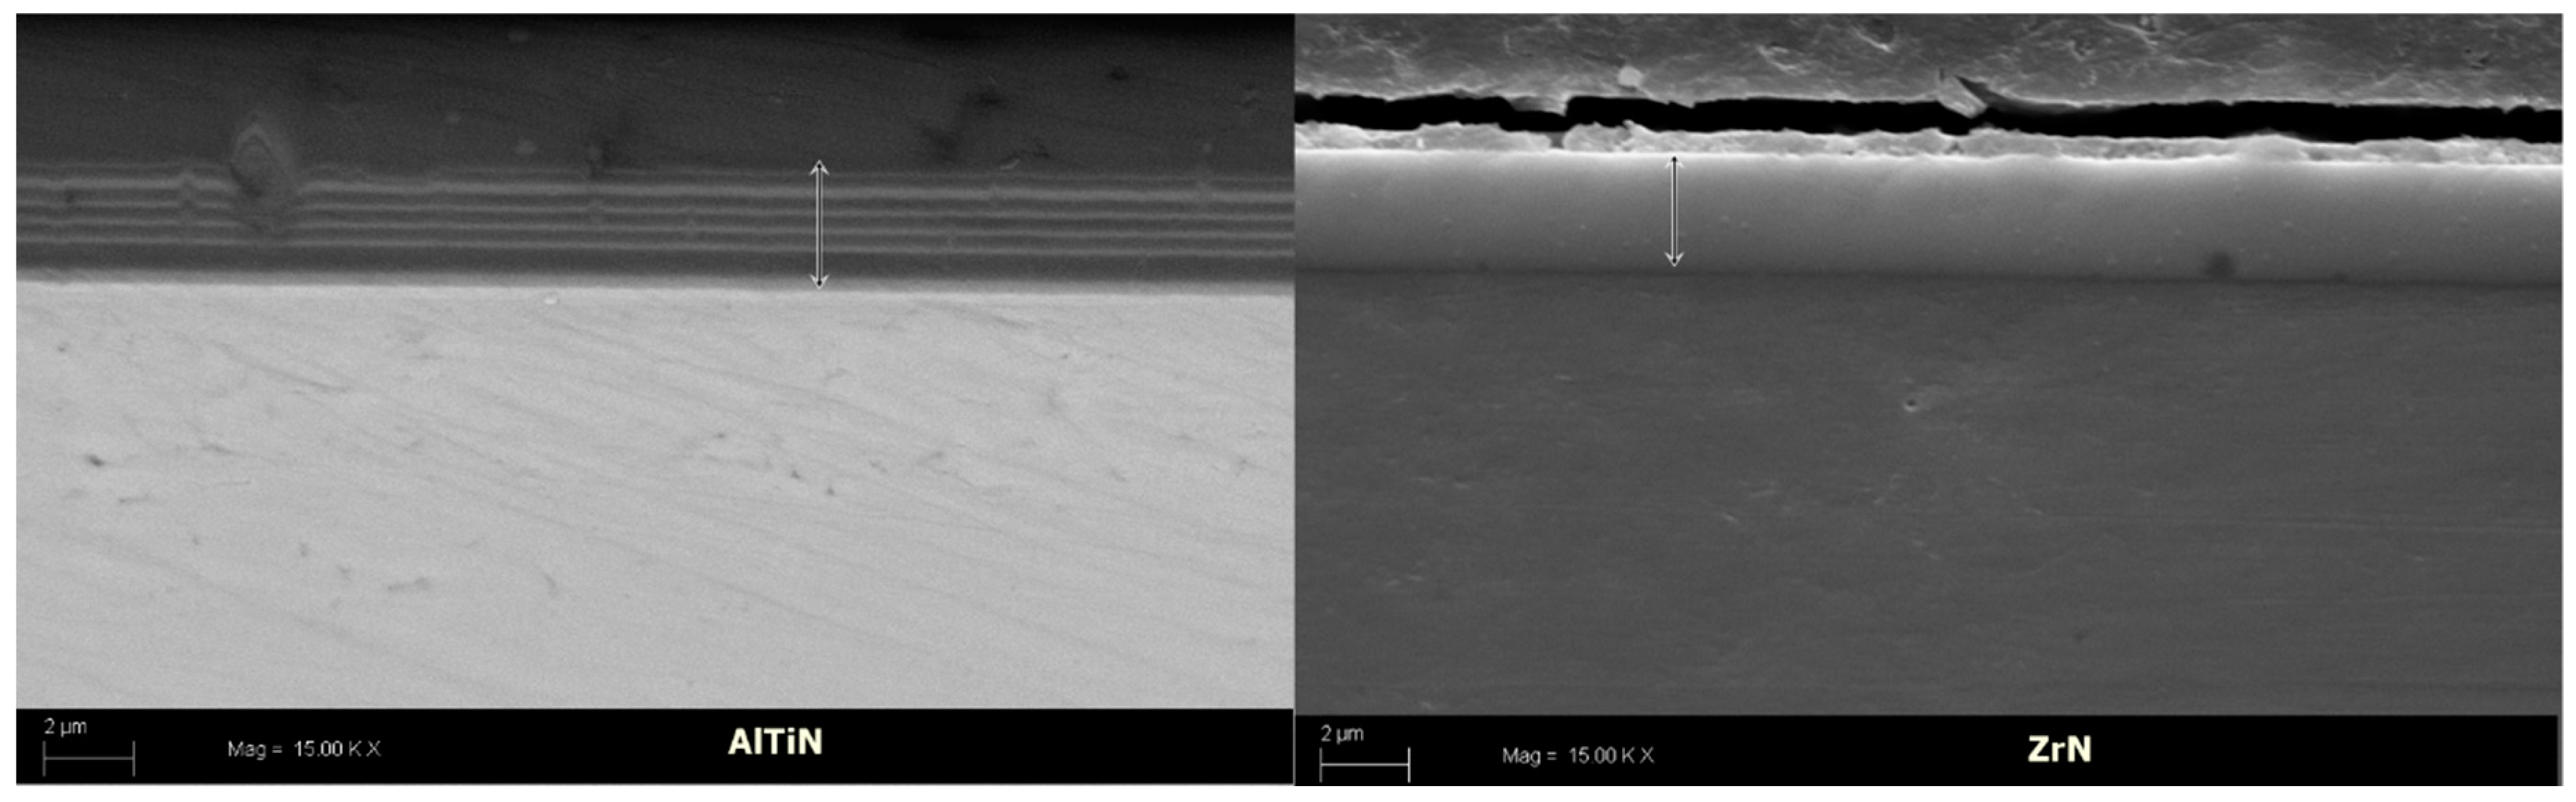
3.3. Scanning Electron Microscopy
SEM cross-section micrographs of ZrN and AlTiN are shown in
Figure 7 as an example of single-layer and multilayer coatings, respectively. In the case of multilayer coating, it was possible to observe a clear succession of the layers (
Figure 7). All coatings appeared adherent, compact, and uniformly distributed along the surface profile; only CrN/Cr showed the presence of some defects, mainly in the form of cracks. Using SEM, it was also possible to evaluate the thickness; these values are listed in
Table 3. The variation of the thicknesses of Cr-based and Ti-based PVD coatings was in a fairly small range. This is relevant when comparing coating properties like adhesion, hardness, and roughness as they can be strictly related to the thickness.
As can be seen in
Figure 7a, the nitride layers were clearly visible on the surface of the samples. The coatings were homogeneously distributed without defects or discontinuities like inclusions, nodules, droplets and microcracks. ZrN single layer (
Figure 7b) was the thickest PVD coating, and TiN was the thinnest one.
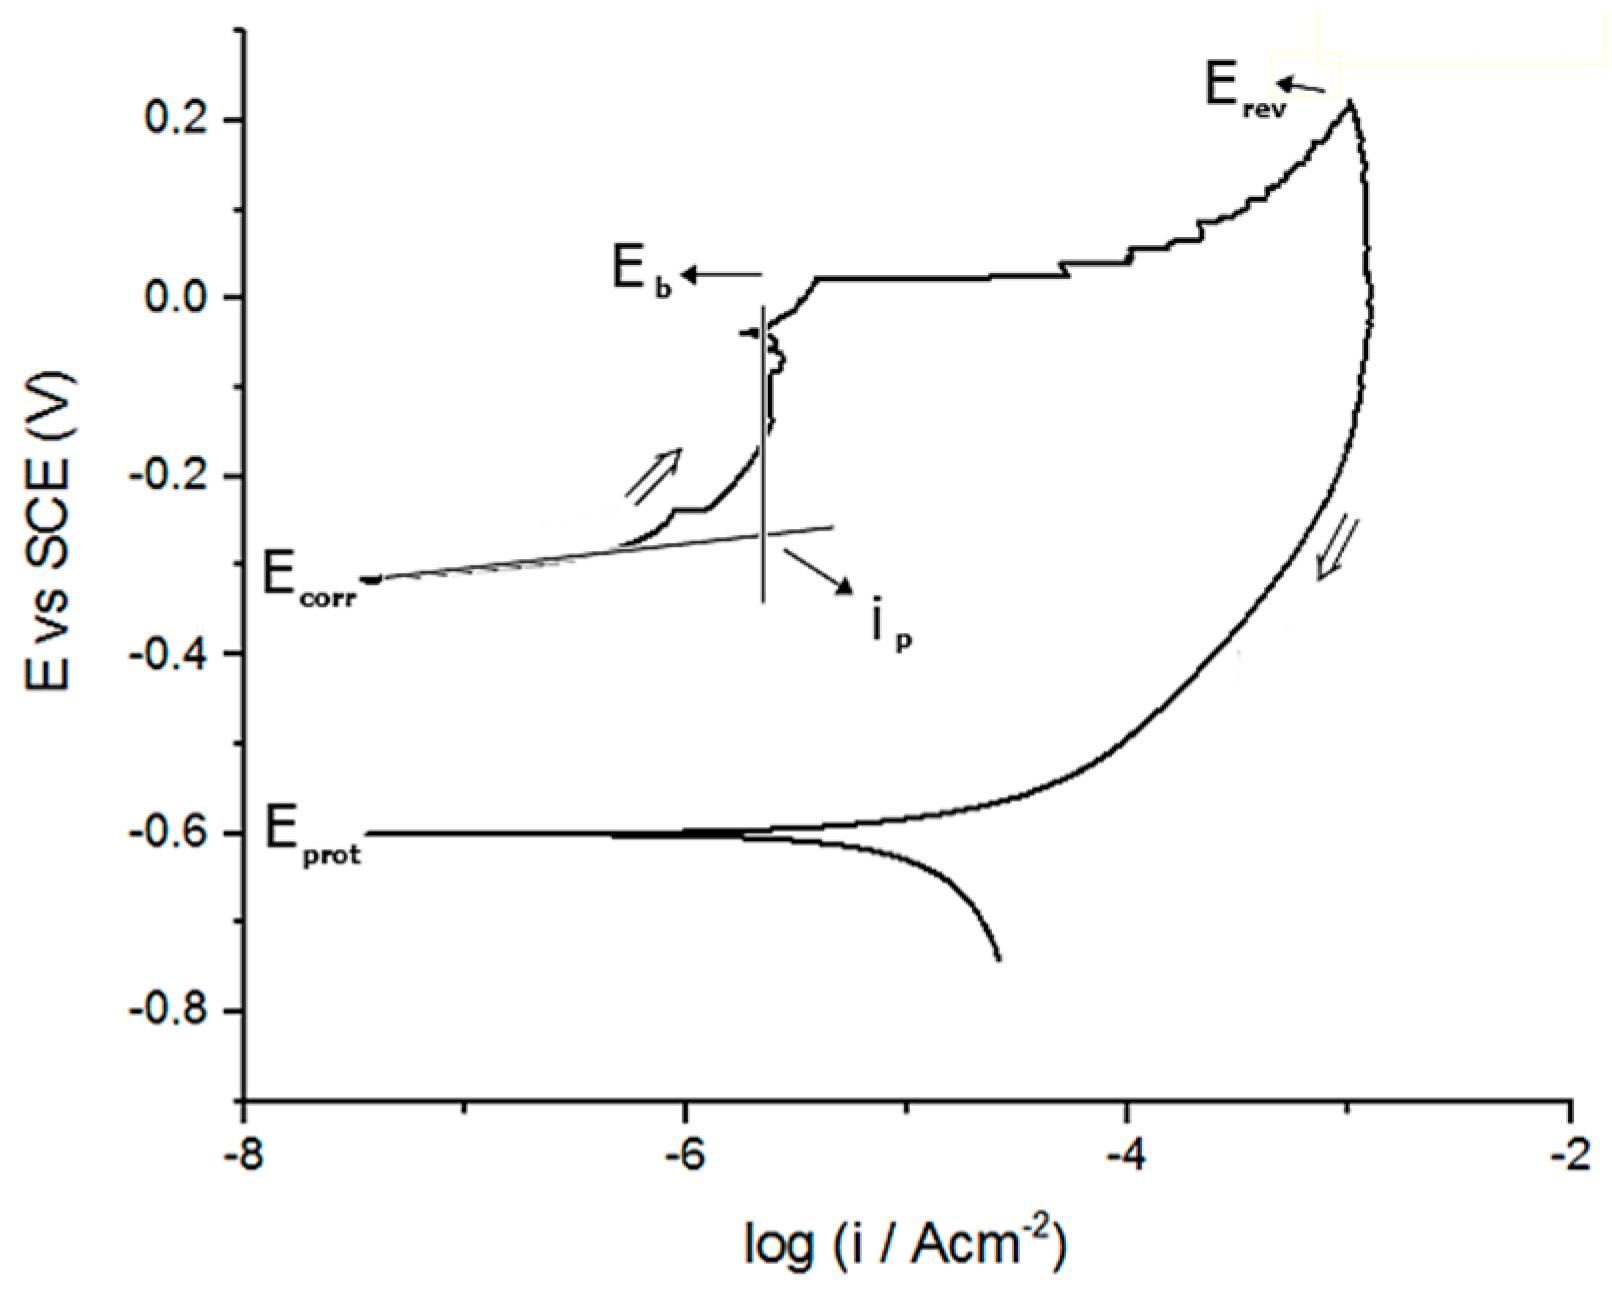
3.4. Corrosion Behavior
Corrosion resistance was investigated on the five coatings in 0.1 M Na
2SO
4, pH 5.5 ± 0.4, and in 0.1 M NaCl, pH 5.5 ± 0.4, by means of single anodic cyclic polarization. The two types of solutions were selected to mimic mild and aggressive environments, respectively [
24,
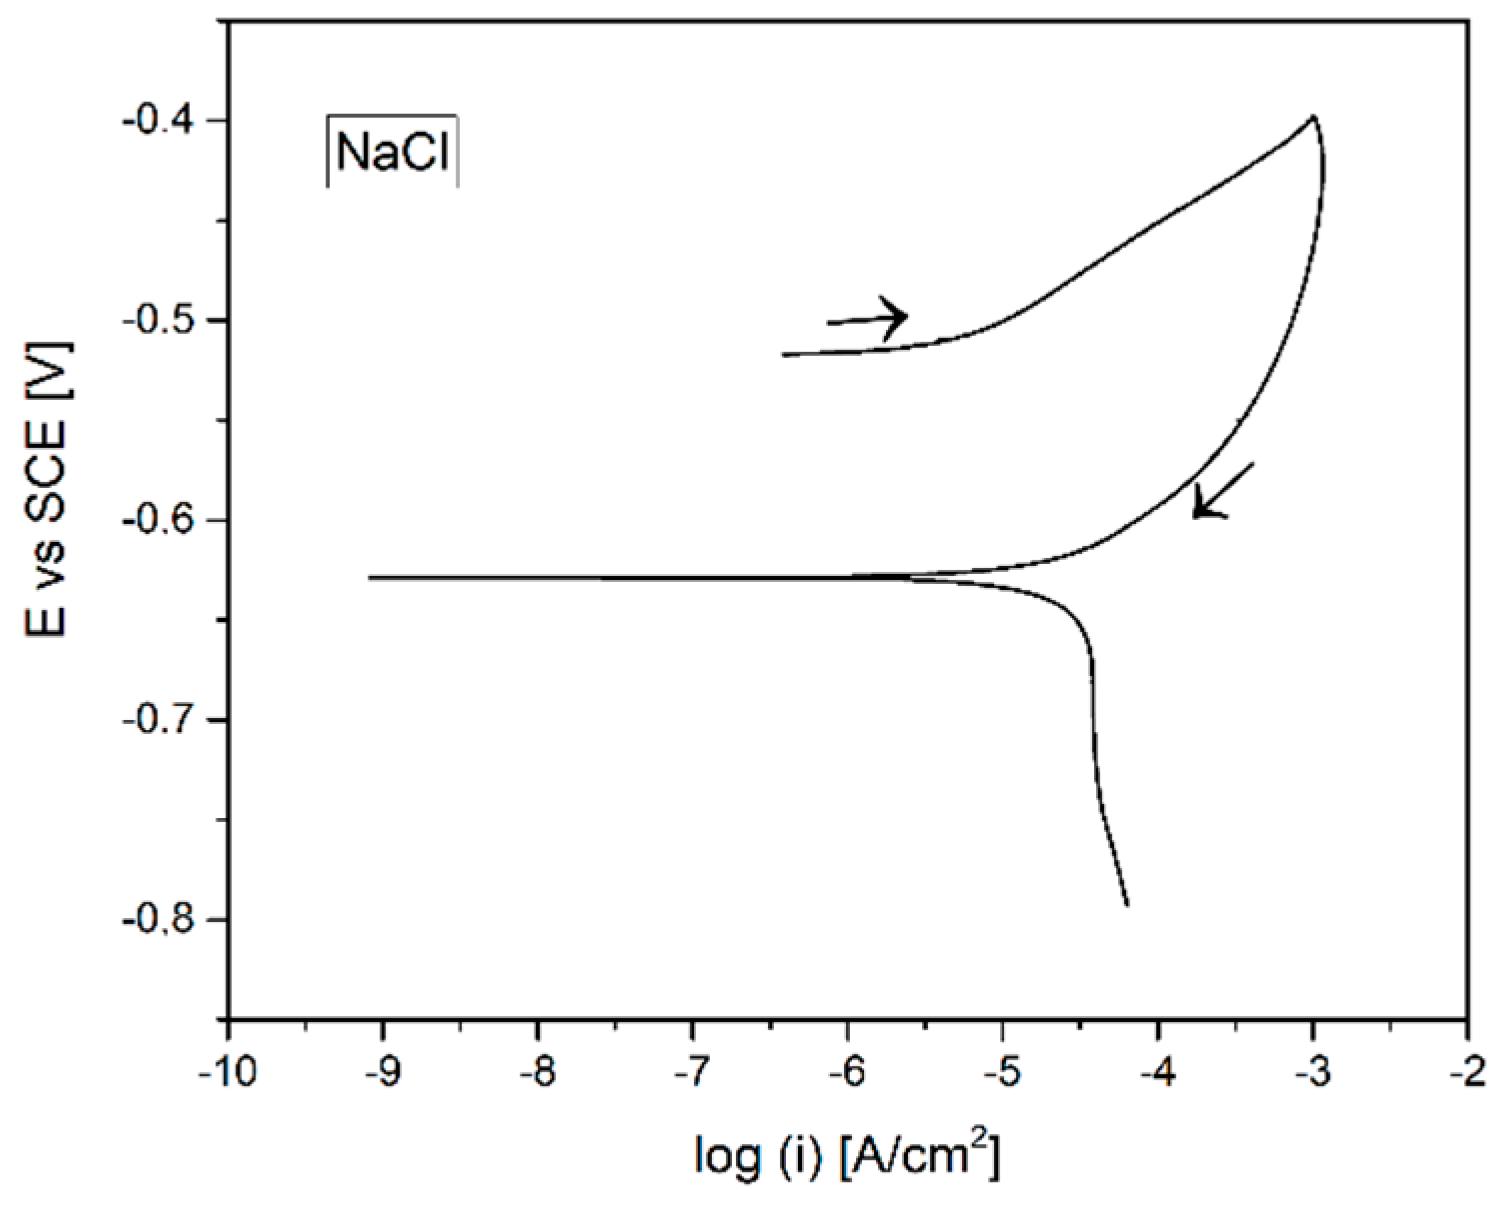
25]. The electrochemical behavior of bare steel in NaCl solution is shown in
Figure 8. The steel exhibited an active behavior, with the current density continuously increasing with the potential and a reverse branch forming a wide negative hysteresis. This curve is typical for a material undergoing uniform corrosion. The same curve was obtained in Na
2SO
4 solution but at slightly lower current densities.
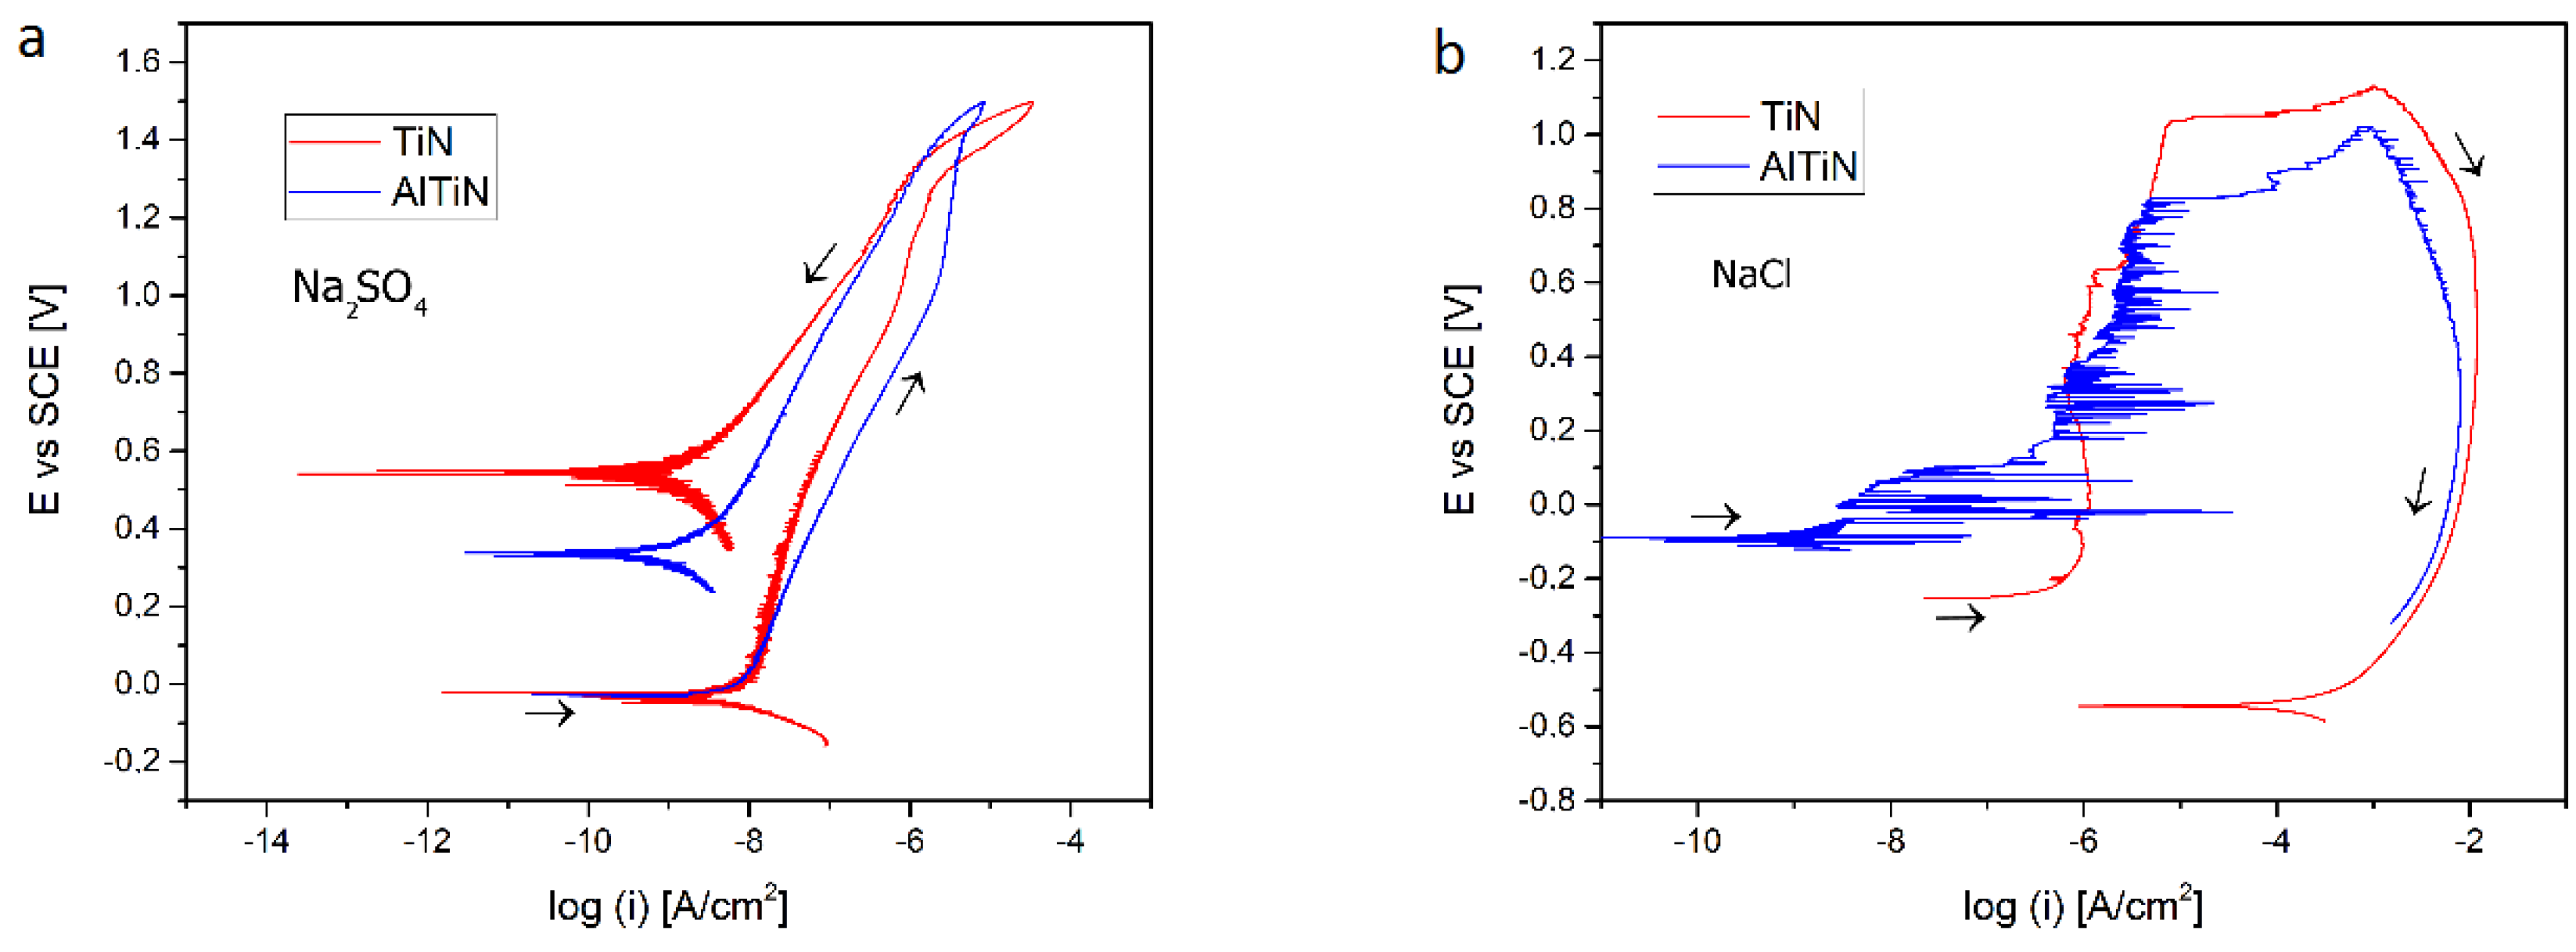
After PVD deposition and independently of coating type, steel drastically improved its performance, moving from an active to a passive behavior. As an example, the polarization curves of titanium-based PVD coatings are shown in
Figure 9.
In Na2SO4 solution, TiN and AlTiN both showed a passive behavior with a positive hysteresis and a wide passive potential window that started to break at ca. 1.3 V vs. SCE. These features indicated a great stability of the coatings in the tested solution. In NaCl solution, a passive behavior (forward branch) was still clearly visible, but the breakdown potential of the two coatings was markedly lower than that obtained in Na2SO4, reaching values as low as 0.85 and 1.1 V vs. SCE for AlTiN and TiN, respectively. This premature rupture of the coatings was accompanied by the initiation (and subsequent propagation at increasing potentials) of localized corrosion phenomena, thus leading to a wide negative hysteresis in the reverse branch. A strict analysis of the forward branch of the curves in NaCl showed that despite both coatings exhibiting a passive behavior, the presence of appreciable oscillations of the electrochemical signal of AlTiN during the recording of the forward branch was indicative of a coating showing certain instability in the solution under examination. This was clearly reflected in the coating breakdown potential, which was much lower than that of TiN. On the base of these preliminary results, it can be concluded that the presence of a multilayer (AlTiN) with higher thickness does not necessarily show beneficial effects against corrosion when compared to a single layer (TiN).
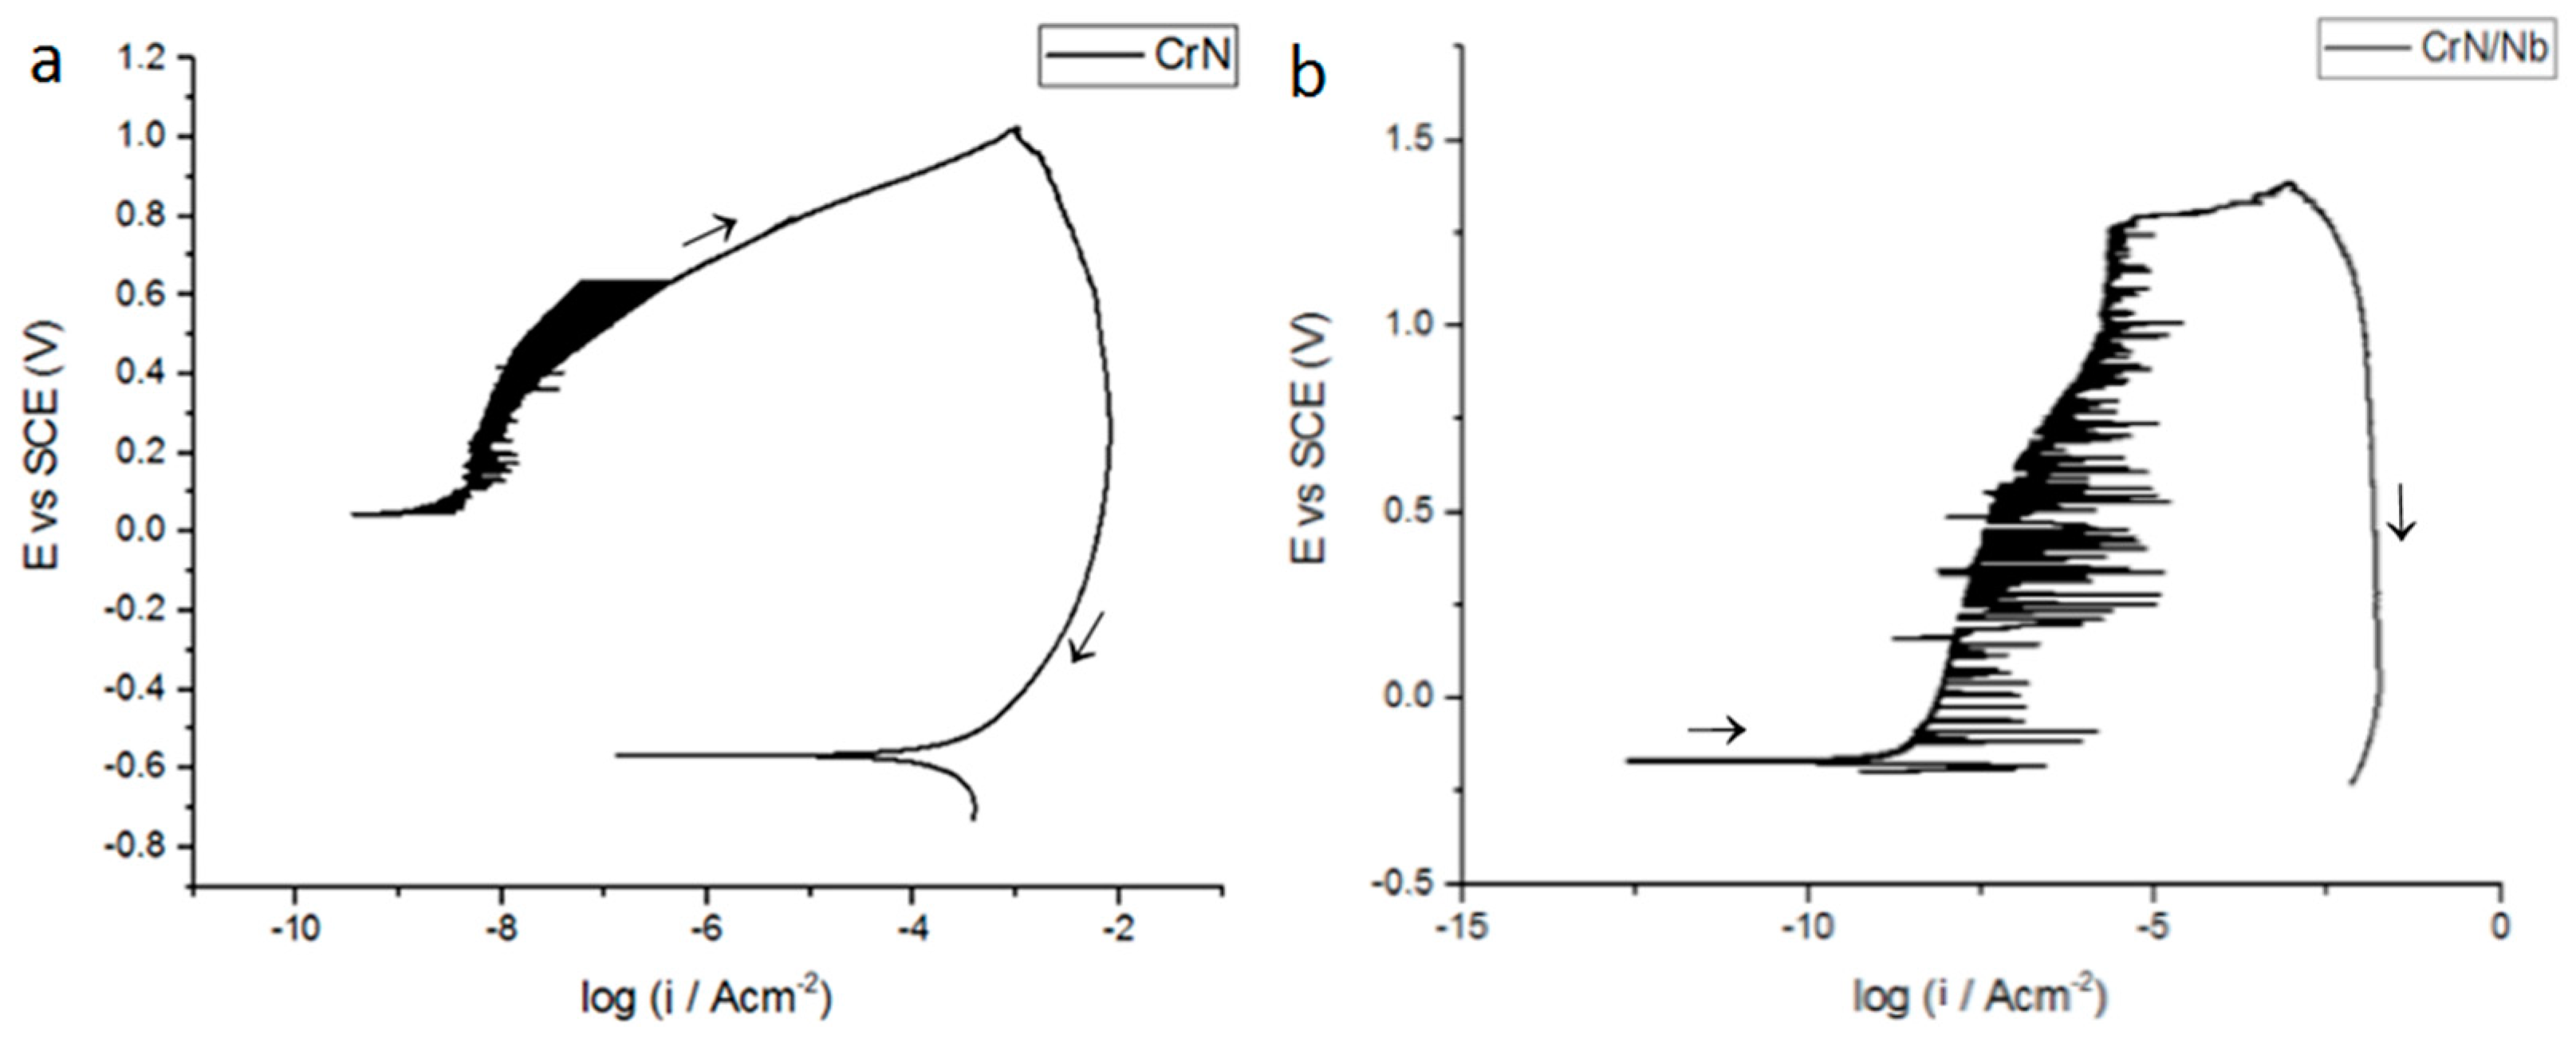
The corrosion behavior of two four-layer PVD coatings is shown in
Figure 10. The curves refer to CrN/Cr and CrN/Nb in 0.1 M NaCl solution.
Both PVD coatings exhibited a similar electrochemical behavior, i.e., a passive zone in the forward branch followed by a negative hysteresis in the reverse one. However, some differences between the two coatings could be underlined. The breakdown potential for CrN/Cr was ca. 0.5 V vs. SCE, while the corresponding value for CrN/Nb was markedly higher, close to 1.3 V vs. SCE. This means that despite the scratch test revealing a certain fragility of the last layer of niobium, the underneath layers appeared sufficiently free of defects, thus leading to a wide passive potential range. Nevertheless, it is worth noting that some oscillations around the passive current density were visible. Accordingly, the long-term stability of the coating could be compromised. These findings could possibly account for the different thicknesses of the two coatings, with CrN/Cr being thinner than CrN/Nb.
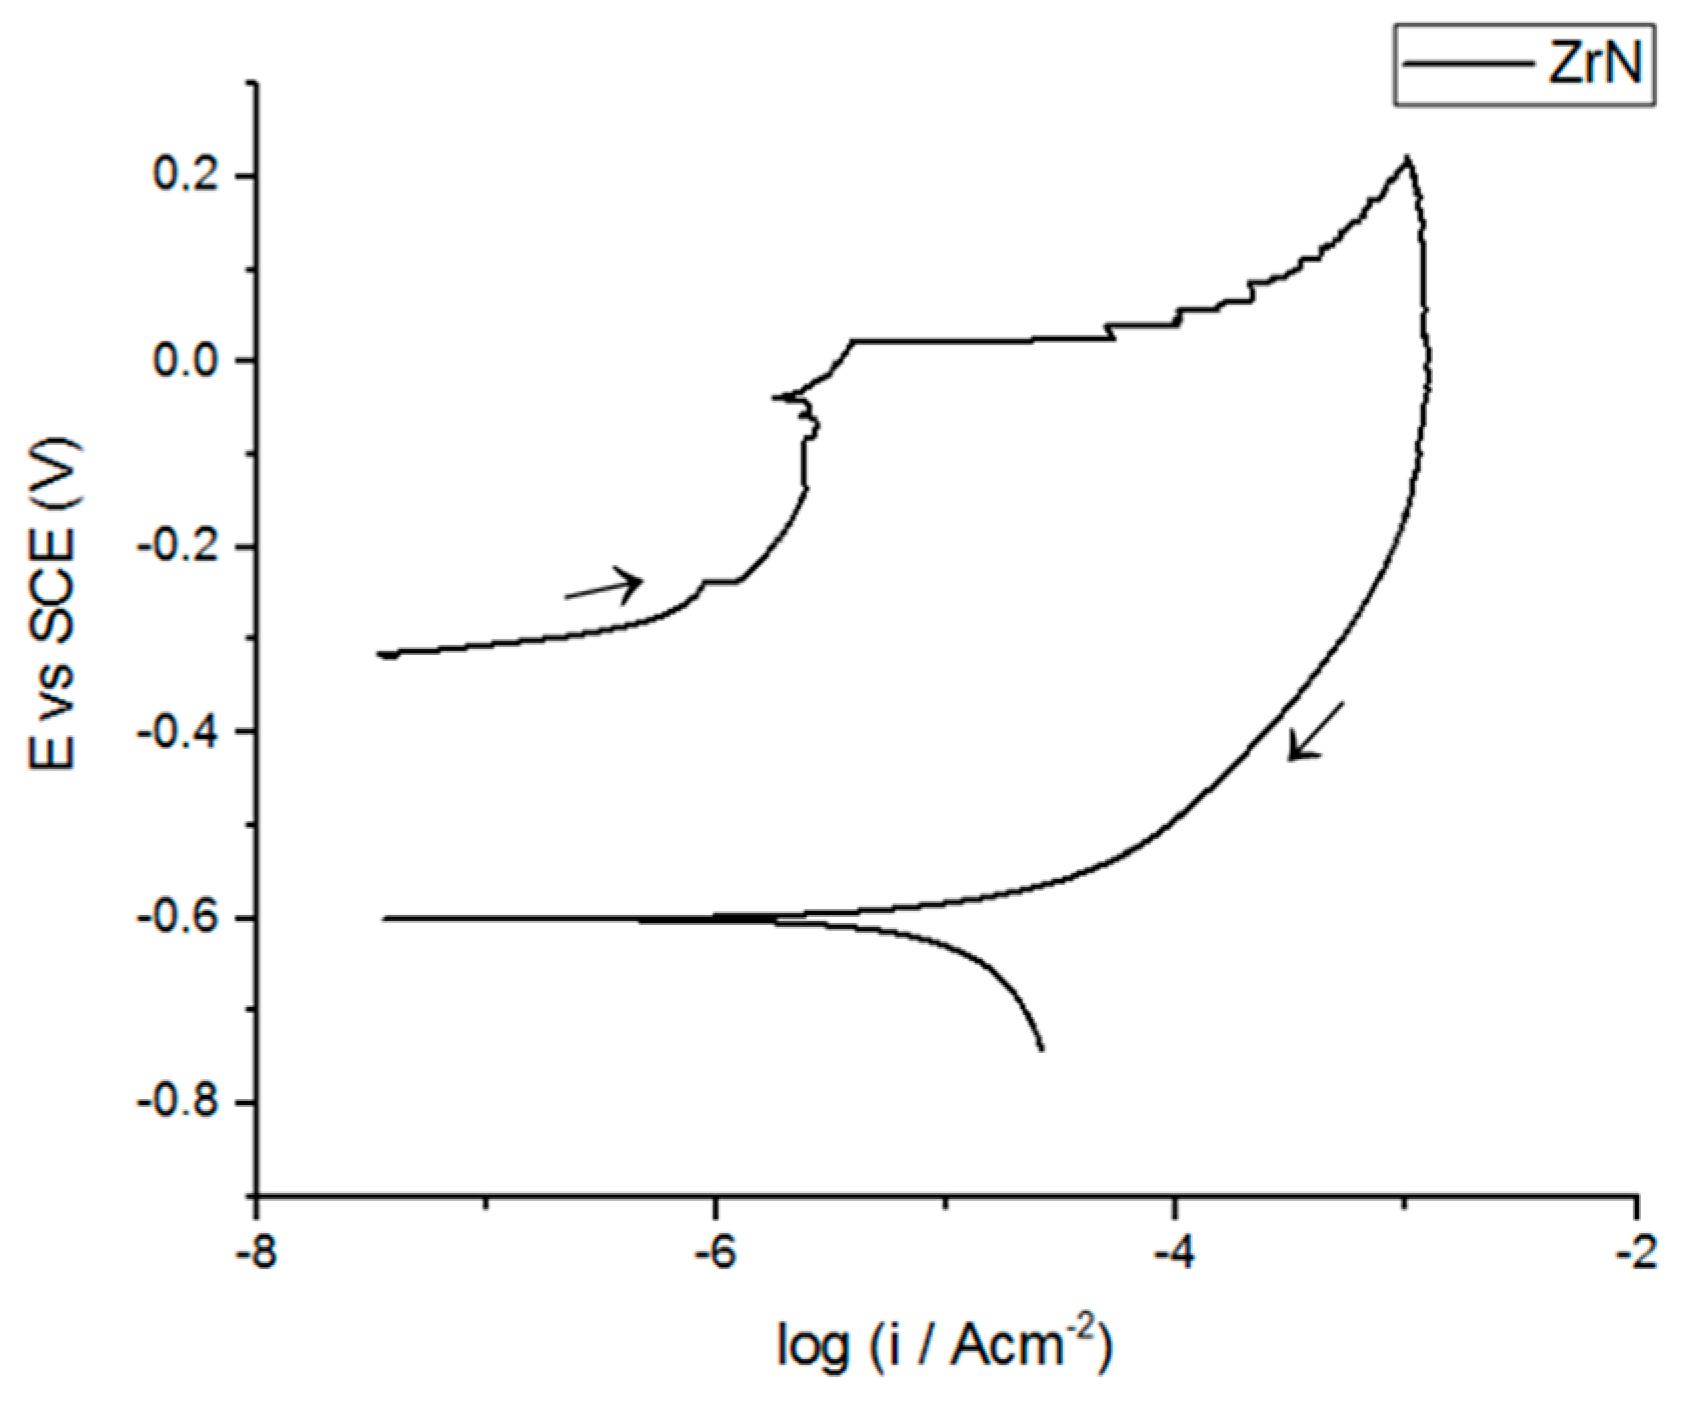
The effect of a thick coating on the corrosion behavior is appreciable in
Figure 11, where the polarization curve of the single layer ZrN coating is shown.
This coating had a thickness in the range 3.0–3.5 µm, the highest value among the PVD coatings under examination. In spite of the fact that the coating thickness was so high, the electrochemical features were poor, exhibiting a breakdown potential of ca. 0.1 V vs. SCE and a modest passive potential window.
The corrosion potential of each tested coating as obtained in open circuit conditions are listed in
Table 4. The open circuit potential of the coatings showed a remarkable shift to positive values compared with that of bare steel, with the latter exhibiting a potential value of −0.622 V in Na
2SO
4 (−0.521 V in NaCl), which was once more typical for an active material subjected to a uniform corrosion process [
26,
27,
28]. Consequently, the improvement of corrosion resistance of the coatings with respect to the substrate was appreciable. Comparing the open circuit potentials of substrate and PVD coatings, it can be observed that CrN/Cr and titanium-based coatings showed less negative values, while CrN/Nb had
Ecorr = −0.214 V vs. SCE. This negative potential could be firstly put in relation to the scratch test results, where it was apparent that the last layer of niobium was too fragile, thus leading to possible failure of the overall coating. Indeed, it can be observed that niobium and zirconium had very negative reversible potentials (Zr
4+ + 4 e
− ⇌ Zr(s)
E° = −1.45 V vs. SHE and Nb
3+ + 3 e
− ⇌ Nb(s)
E° = −1.099 V vs. SHE), thus justifying the observed open circuit potential.
The overall electrochemical features from a strict analysis of every curve are listed in
Table 5 and
Table 6 for PVD coatings in Na
2SO
4 and NaCl.
By strict analysis of the reported values, it was possible to confirm the above considerations concerning the corrosion behavior of different PVD coatings.


