Article

Crack Sensitivity Control of Nickel-Based Laser Coating Based on Genetic Algorithm and Neural Network

School of Mechanical Engineering, Xinjiang University, Urumqi 830047, China
*
Authors to whom correspondence should be addressed.
Coatings 2019, 9(11), 728; https://doi.org/10.3390/coatings9110728
Submission received: 17 September 2019 / Revised: 28 October 2019 / Accepted: 31 October 2019 / Published: 3 November 2019
(This article belongs to the Section Surface Characterization, Deposition and Modification)

Abstract

:
This paper aimed to establish a nonlinear relationship between laser cladding process parameters and the crack density of a high-hardness, nickel-based laser cladding layer, and to control the cracking of the cladding layer via an intelligent algorithm. By using three main process parameters (overlap rate, powder feed rate, and scanning speed), an orthogonal experiment was designed, and the experimental results were used as training and testing datasets for a neural network. A neural network prediction model between the laser cladding process parameters and coating crack density was established, and a genetic algorithm was used to optimize the prediction results. To improve their prediction accuracy, genetic algorithms were used to optimize the weights and thresholds of the neural networks. In addition, the performance of the neural network was tested. The results show that the order of influence on the coating crack sensitivity was as follows: overlap rate > powder feed rate > scanning speed. The relative error between the predicted value and the experimental value of the three-group test genetic algorithm-optimized neural network model was less than 9.8%. The genetic algorithm optimized the predicted results, and the technological parameters that resulted in the smallest crack density were as follows: powder feed rate of 15.0726 g/min, overlap rate of 49.797%, scanning speed of 5.9275 mm/s, crack density of 0.001272 mm/mm2. Therefore, the amount of crack generation was controlled by the optimization of the neural network and genetic algorithm process.

1. Introduction

Laser cladding technology is an advanced manufacturing method that uses a high-energy laser beam to irradiate cladding powder and a matrix to rapidly melt and solidify it [1]. It can produce high-performance alloy surfaces on inexpensive metal substrates without affecting the properties of the matrix, thus conserving valuable rare metal materials [2,3]. Laser cladding technology has not been widely promoted since its conception, mainly because the most difficult problem in laser cladding is the cracking of the cladding layer, which limits its practical application [4]. The laser cladding of high-hardness, nickel-based coatings is particularly prone to crack generation, and is difficult to find the optimal process in traditional process experiments [5,6,7]. In this study, Ni60 powder was laser clad on a #45 steel substrate. There are differences in the physical properties of #45 steel and Ni60 powder materials. Together with the rapid heating and rapid cooling of high-energy laser beams, if the process is not properly selected, the cladding layer will generate great thermal stress. The thermal stress of the laser cladding layer is usually tensile stress, and cracks are generated when the local tensile stress exceeds the strength of the coating material. Cracks tend to occur in these places due to the low strength of the dendritic boundaries, pores, and inclusions of the laser cladding layer, which tend to cause stress concentration [8]. There are many influencing factors of the laser cladding process [9,10]; each factor affects the others, exhibiting a nonlinear dynamic process. Many experts and scholars in the field of laser cladding have conducted relevant research to comprehensively and intelligently control the quality of the cladding layer. Wang et al. [11] used a neural network and genetic algorithm to predict and optimize the bonding strength and microhardness of a thick, multi-layer, laser-clad, nano-ceramic coating. Ni et al. [12] used a neural network and particle swarm optimization to predict the height and width of the cladding. Yang et al. [13] studied the surface quality prediction of laser solid formed materials based on an artificial neural network, and effectively predicted the surface quality of single-channel and multi-layer laser solid formed samples. Lei et al. [14] effectively predicted the characteristic parameters of the laser cladding pool by using a neural network. Wang et al. [15] successfully predicted the crack density of a K465 superalloy laser cladding layer via a BP neural network. Liu et al. [16] refined the microstructure of the coating by adding an appropriate amount of CeO2 to reduce the “herringbone” crack of the titanium-based laser cladding composite coating. Wang et al. [17] used ultrasonic-assisted laser cladding to reduce the number of cracks in Al2O3-ZrO2 ceramic coatings. Yu et al. [18] produced an iron-based coating with low crack sensitivity by adding an appropriate amount of TiO2. Some of these scholars have used intelligent algorithms to predict cladding formation and performance, and some used various processes or added other elements to control cladding cracks, with the ultimate goal of improving the quality of the cladding. However, there exist few studies on the comprehensive multi-factor intelligent control of cracks on a high-hardness, nickel-based laser cladding layer.
Aiming at the problem of crack defects in the high-hardness, nickel-based alloy, laser cladding layer, the mechanism of crack generation was deeply explored in the present study. Orthogonal experiments were designed by analyzing several process parameters with a large influence on crack sensitivity, and a neural network model for genetic algorithm optimization was established. According to the orthogonal test results, the order of influence of laser cladding factors on the crack sensitivity of the cladding layer was obtained. The neural network model optimized by the genetic algorithm was trained to realize the mapping relationship between the powder feed rate, overlap rate, and scanning speed, and its effect on the crack density of the cladding layer. The genetic algorithm was used to optimize the predicted value of the network, and the technological parameters that resulted in the least number of cracks were obtained. This optimization provides a new method for the study of the intelligent control of cracks on a high-hardness, nickel-based laser cladding layer.

2. Laser Cladding Test and Analysis

2.1. Test Equipment and Materials

The laser used in the experiment was a 4 kW fiber laser produced by the IPG Company (New York, NY, USA). The laser cladding robot used was a German six-degrees-of-freedom KUKA robot (Augsburg, Germany) the model number of which was KR30HA. The entire machine control system adopted the Siemens PLC controller (Siemens, Munich, Germany) and the model number was S7300. The powder feeder was a SIASUN XSL-PF-01B-2 with a double bin and negative pressure type. Argon was used as the protective gas. A double temperature chiller was used for cooling; this was produced by the Dongluyang Company (Shenzhen, China), and the model number was PH-LW296-TH2P. The laser cladding equipment is depicted in Figure 1.
A #45 steel plate with a size of 110 mm × 80 mm × 8 mm was used as the base, and the quantity totaled 20 pieces. Before laser cladding, the substrate was first sandblasted and cleaned with absolute ethanol to make the surface of the substrate flat and free of oil and other debris. To obtain a corrosion-resistant, wear-resistant, high-hardness laser cladding layer, a Ni60 self-fluxing alloy powder was selected as the cladding powder. The powder particle size was 45–106 μm. The powder was previously dried (120 °C, held for 2 h). The chemical compositions of the #45 steel and the Ni60 powder are exhibited in Table 1 and Table 2.

2.2. Experimental Method

The mechanism of crack formation in the laser cladding layer was investigated [19,20]. It was found that the process parameters, especially the powder feeding rate, the lapping rate, and the scanning speed, had a great influence on the crack sensitivity. A three-factor, four-level orthogonal experiment (L16 (43)) was designed, as exhibited in Table 3 and Table 4. The laser power was 1600 W, and the defocus amount was 16 mm. The crack density was evaluated to measure the impact of the process parameters on the crack sensitivity, and is given by Equation (1). The laser cladding orthogonal experiment results are presented in Table 4.
ρ = i = 1 n l i λ
where ρ represents the crack density; l i indicates the crack length; and λ represents the area of the laser cladding layer corresponding to a certain set of process parameters.
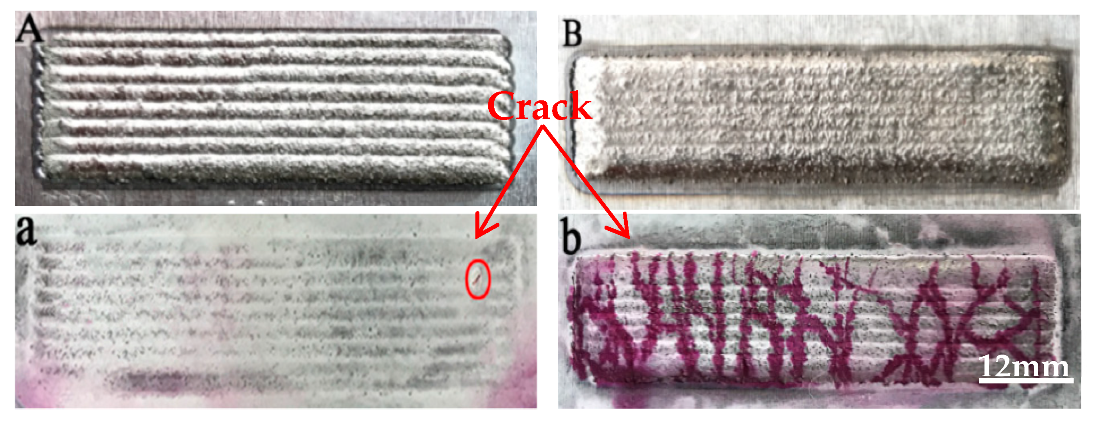
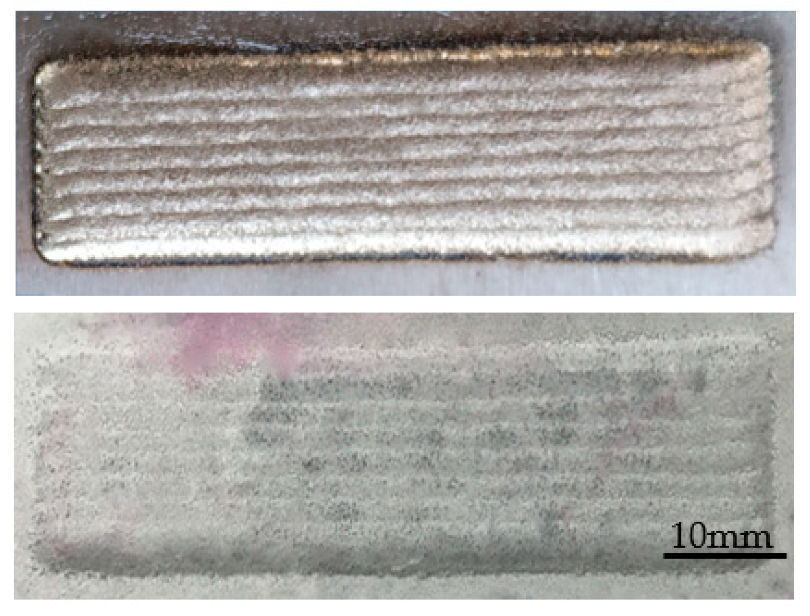
On the surface of the laser cladding layer, the number of cracks generated under different orthogonal experimental schemes was measured by a colored penetrant detection agent, and the crack length was measured to calculate the crack density. The test schemes with the least and largest numbers of cracks in the cladding layer are respectively shown in Figure 2a,b.

2.3. Analysis of Orthogonal Experiment Results

To study the degree of influence of various factors on crack sensitivity, the range analysis of the orthogonal test crack density is presented in Table 5.
Ki represents the average crack density corresponding to each factor when the level number is i. If the range of factors is smaller, the degree of influence on the crack is smaller. If the range of factors is greater, the degree of influence on the crack is greater.
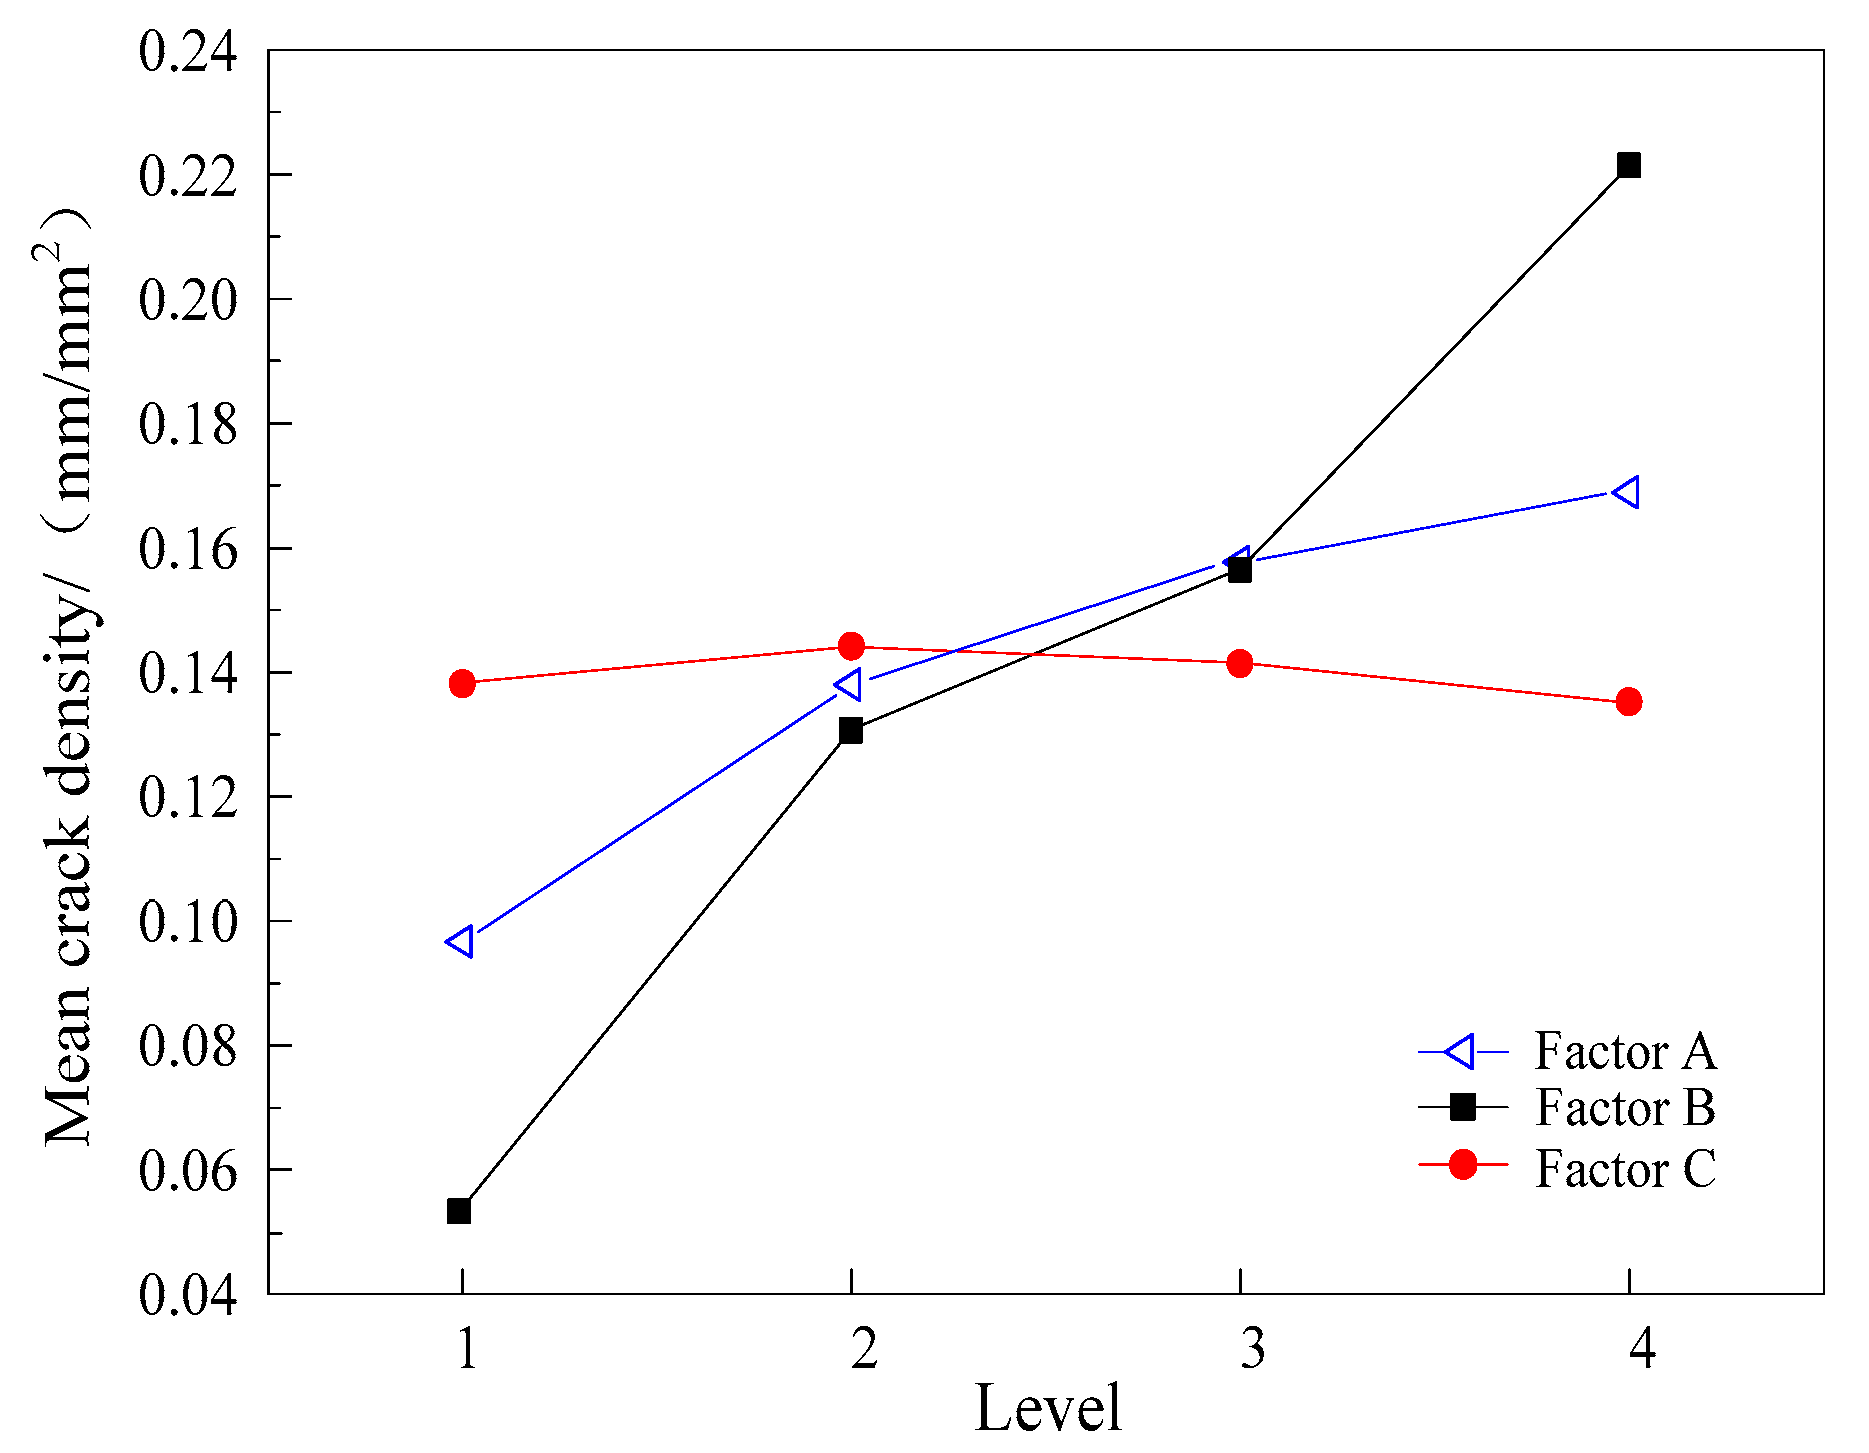
According to the data on the range analysis in Table 5, the order of the influence of laser cladding on the cracking of the cladding layer was as follows: overlap rate (B) > powder feed rate (A) > scanning speed (C). The overlap rate had the greatest influence on the cracking of the cladding layer, and the scanning speed had the least influence on the cracking of the cladding layer. In the orthogonal test, the optimum process parameters were those of the group with the smallest crack density, so the optimum group was A1B1C1, the parameters of which were a powder feeding rate of 15 g/min, a lapping rate of 45%, and a scanning speed of 5 mm/s. The factor effect curve of the orthogonal experiment is shown in Figure 3.
The powder feed rate, overlap rate, and scanning speed had different degrees of influence on the crack sensitivity [21], which is evident from the factor effect curve. With the increase in the level, the crack density produced by factor A showed an increasing trend, and the crack density of factor B increased the fastest; however, the crack density of factor C did not change significantly.
  • In the range of the powder feed rate from 15 to 21 g/min, the crack density of the cladding layer increased gradually with the increase in the powder feed rate. The crack density of the cladding layer was the smallest when the powder feed rate was 15 g/min. The main reason for this is that the laser power was constant and the total output energy of the laser equipment was definite. Additionally, the specific energy decreased as the powder feed rate increased, and the temperature gradient became larger, resulting in an increase in crack density. In addition, with the increase of powder feeding, the specific energy was insufficient; some powders were not fully melted, and the hardness and brittleness of the cladding layer increased, which is also an important factor that led to the increase in crack sensitivity.
  • In the range of the lapping rate from 45% to 60%, the crack density of the cladding layer increased continually with the increase of the overlap rate. When the overlap rate range was the minimum of 45%, the crack density of the cladding layer was the smallest. The reason for this is that with the increase of the overlap rate, the cladding layer became increasingly thicker; when the overlap became too high, it resulted in the excessive overlap phenomenon. As the cladding layer became thicker and inclined at a certain angle, the temperature gradient of the cladding layer increased, as did the internal stress, resulting in the increase in the number of cracks.
  • In the scanning speed range of 5 to 11 mm/s, the crack density of the cladding layer increased with the increase of scanning speed. The crack density was the lowest when the scanning speed was 5 mm/s. The reason for this is that the energy of the input substrate and cladding layer decreased with the increase in scanning speed [22]. The molten pool gradually became shallower, and the thickness of the cladding layer became thinner. The molten pool and the powder were not sufficiently melted, so the crack sensitivity was increased.

3. Prediction and Control of Cracks in Nickel-Based Laser Cladding Layer Based on Neural Network and Heritage Algorithms

Traditionally, the direct process test has been used to find the optimal process parameters to control cracks; however, this process is time-consuming, laborious, cost-increasing, and wastes materials [23,24,25]. As the direct process test requires the range of process parameters to be set and the process parameters to be optimized by experiments in a certain range, it is difficult to obtain the absolute optimal parameters via the direct process test. This problem must therefore be solved with a method that predicts global optimization as a whole.
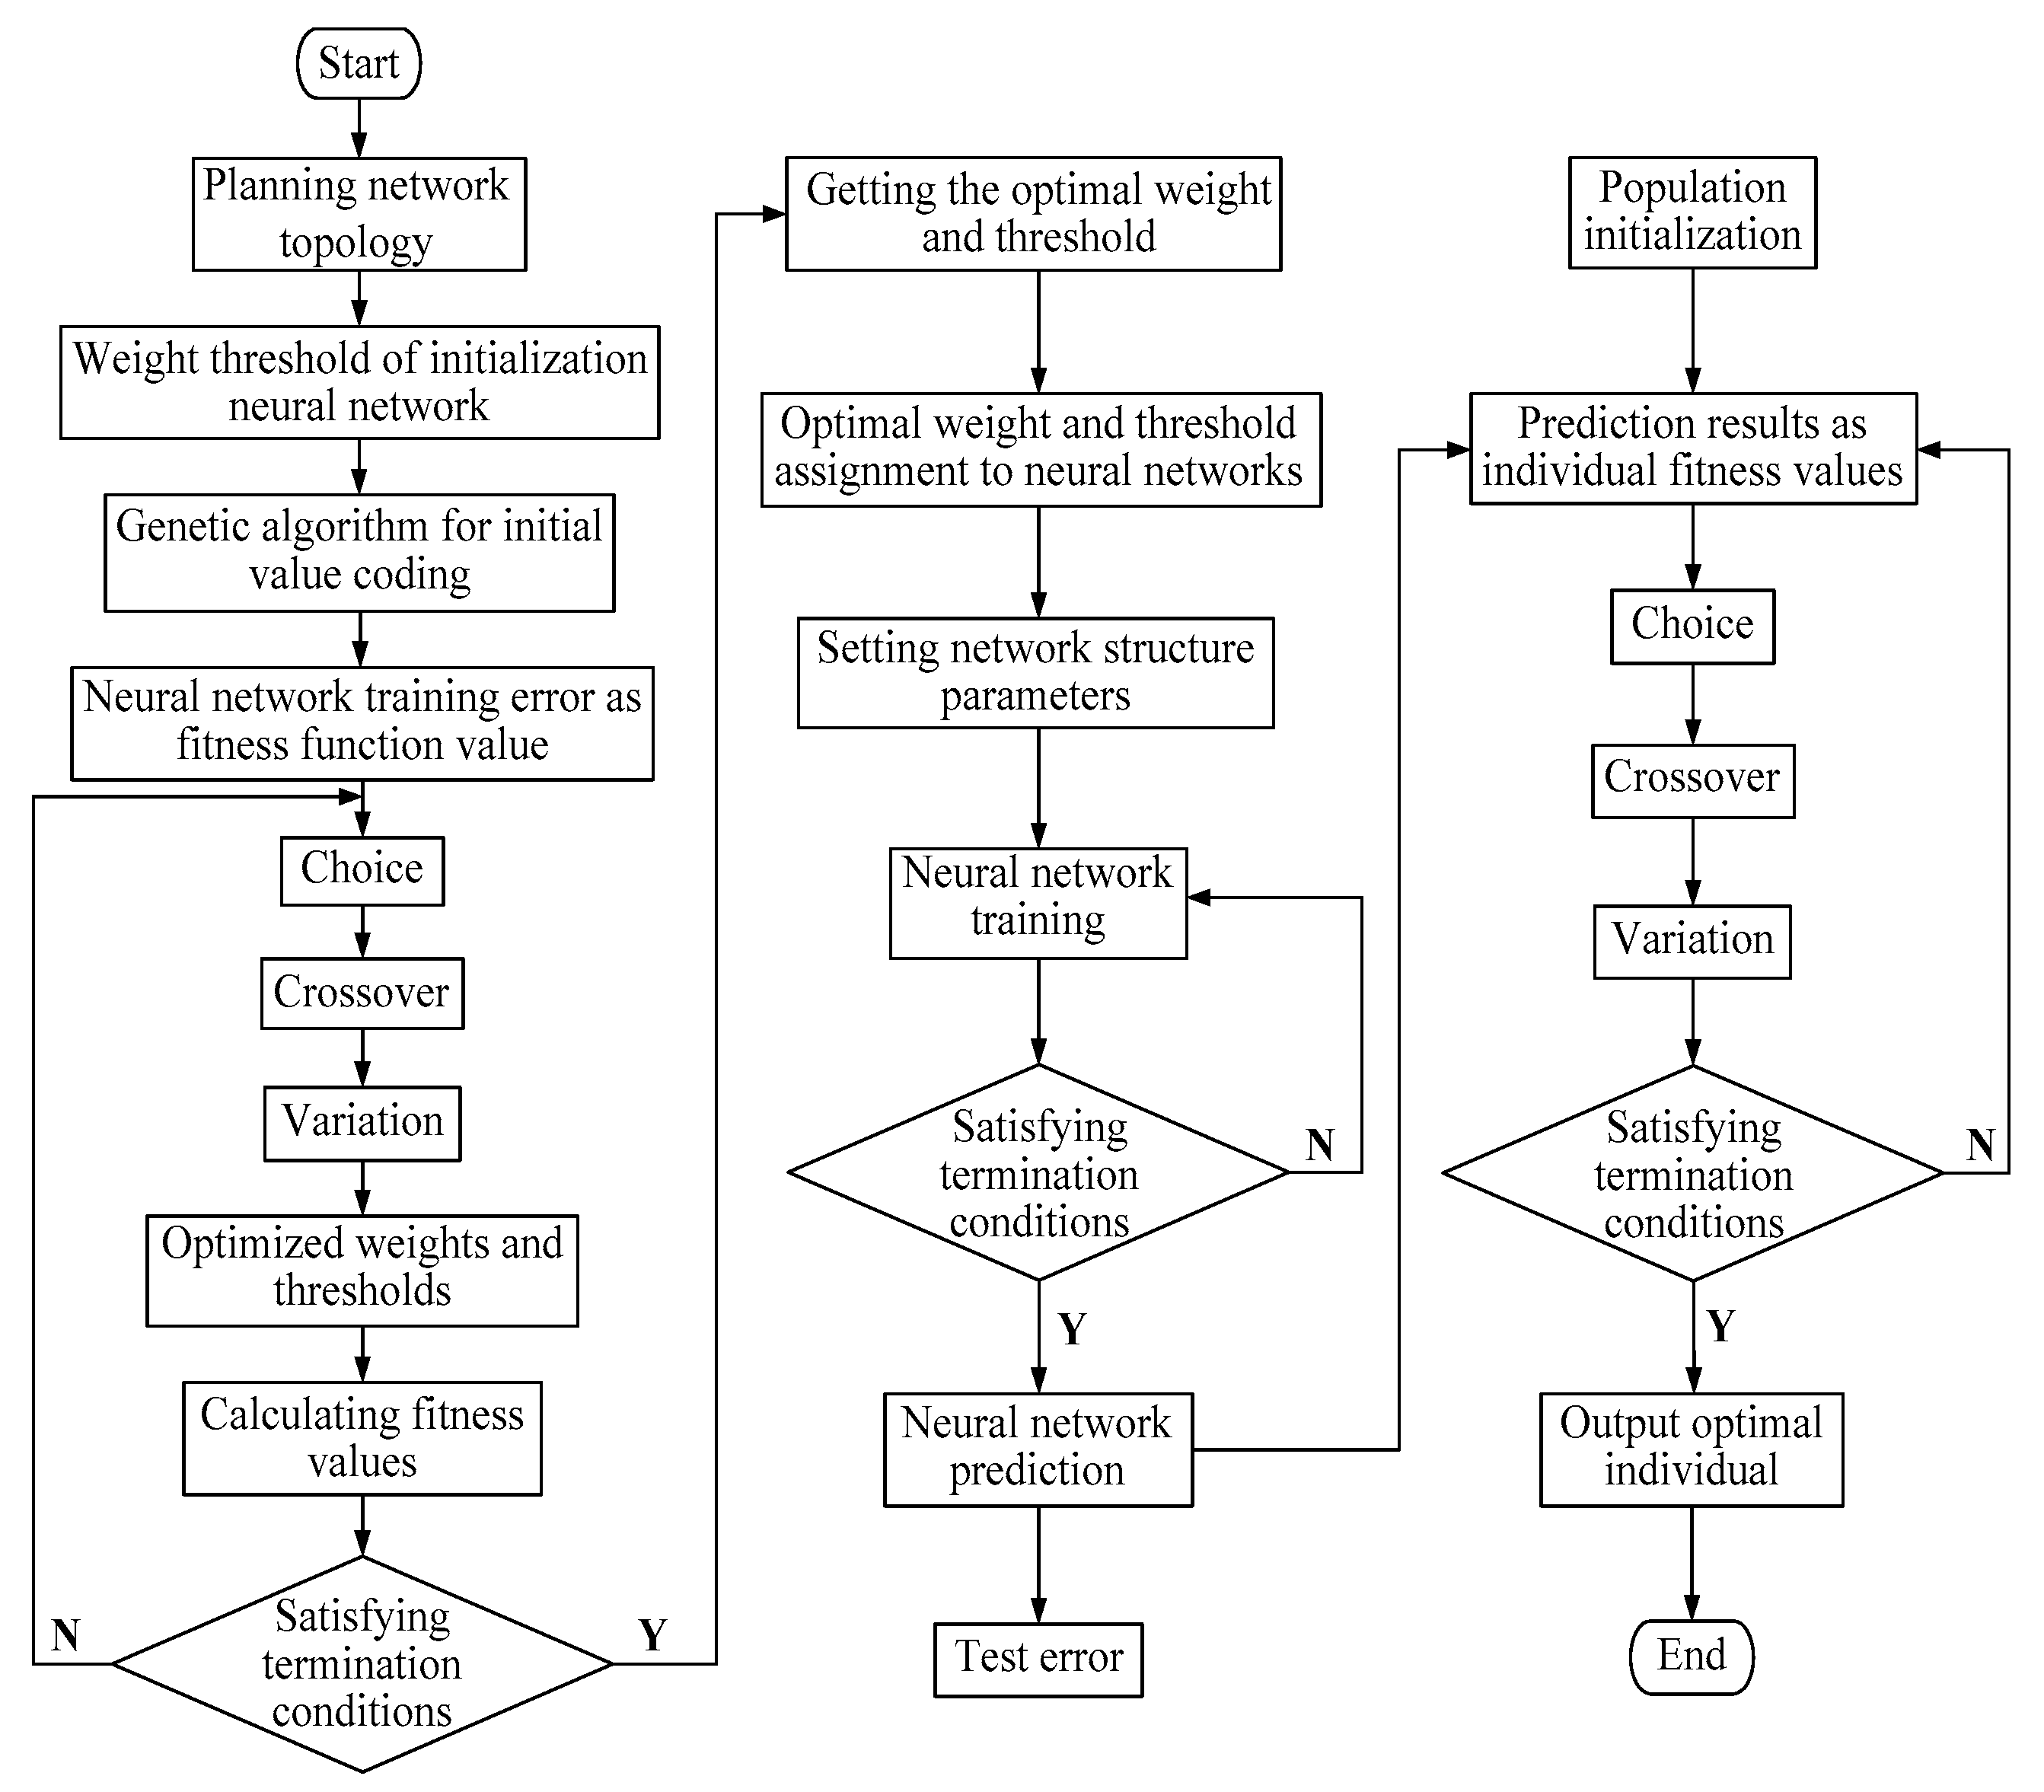
The neural network is characterized by nonlinear fitting prediction. The genetic algorithm can find the optimal solution within the specified range via iterative optimization. The combination of the neural network and genetic algorithm can realize intelligent predictive optimization. Due to the limited number of training samples, the genetic algorithm was used in the present study to optimize the weights and thresholds of the neural network to improve its predictive accuracy, and was then used to optimize the predicted results of the neural network. The overall algorithm flow is presented in Figure 4.
The specific process of the genetic algorithm for the optimization of the neural network (weight and threshold) and the prediction results is as follows. (1) Planning is conducted to determine the network topological structure. (2) The genetic algorithm encodes the weight and threshold of the neural network. (3) The predicted error of the neural network is regarded as the fitness function, and the optimal weights and thresholds are output by selection, crossing, and mutation until the genetic algebra is satisfied. (4) The optimized weights and thresholds are assigned to the neural network and trained through the neural network until the mean square error satisfies the accuracy requirement. (5) The optimized neural network is used for prediction according to the process parameters, and the prediction result is used as the individual fitness function value of the genetic algorithm. (6) The optimal individual is output by cyclical selection, crossing, and mutation until the termination condition of the genetic algorithm is met.

3.1. Establishment of Network Topology Model for Crack Prediction

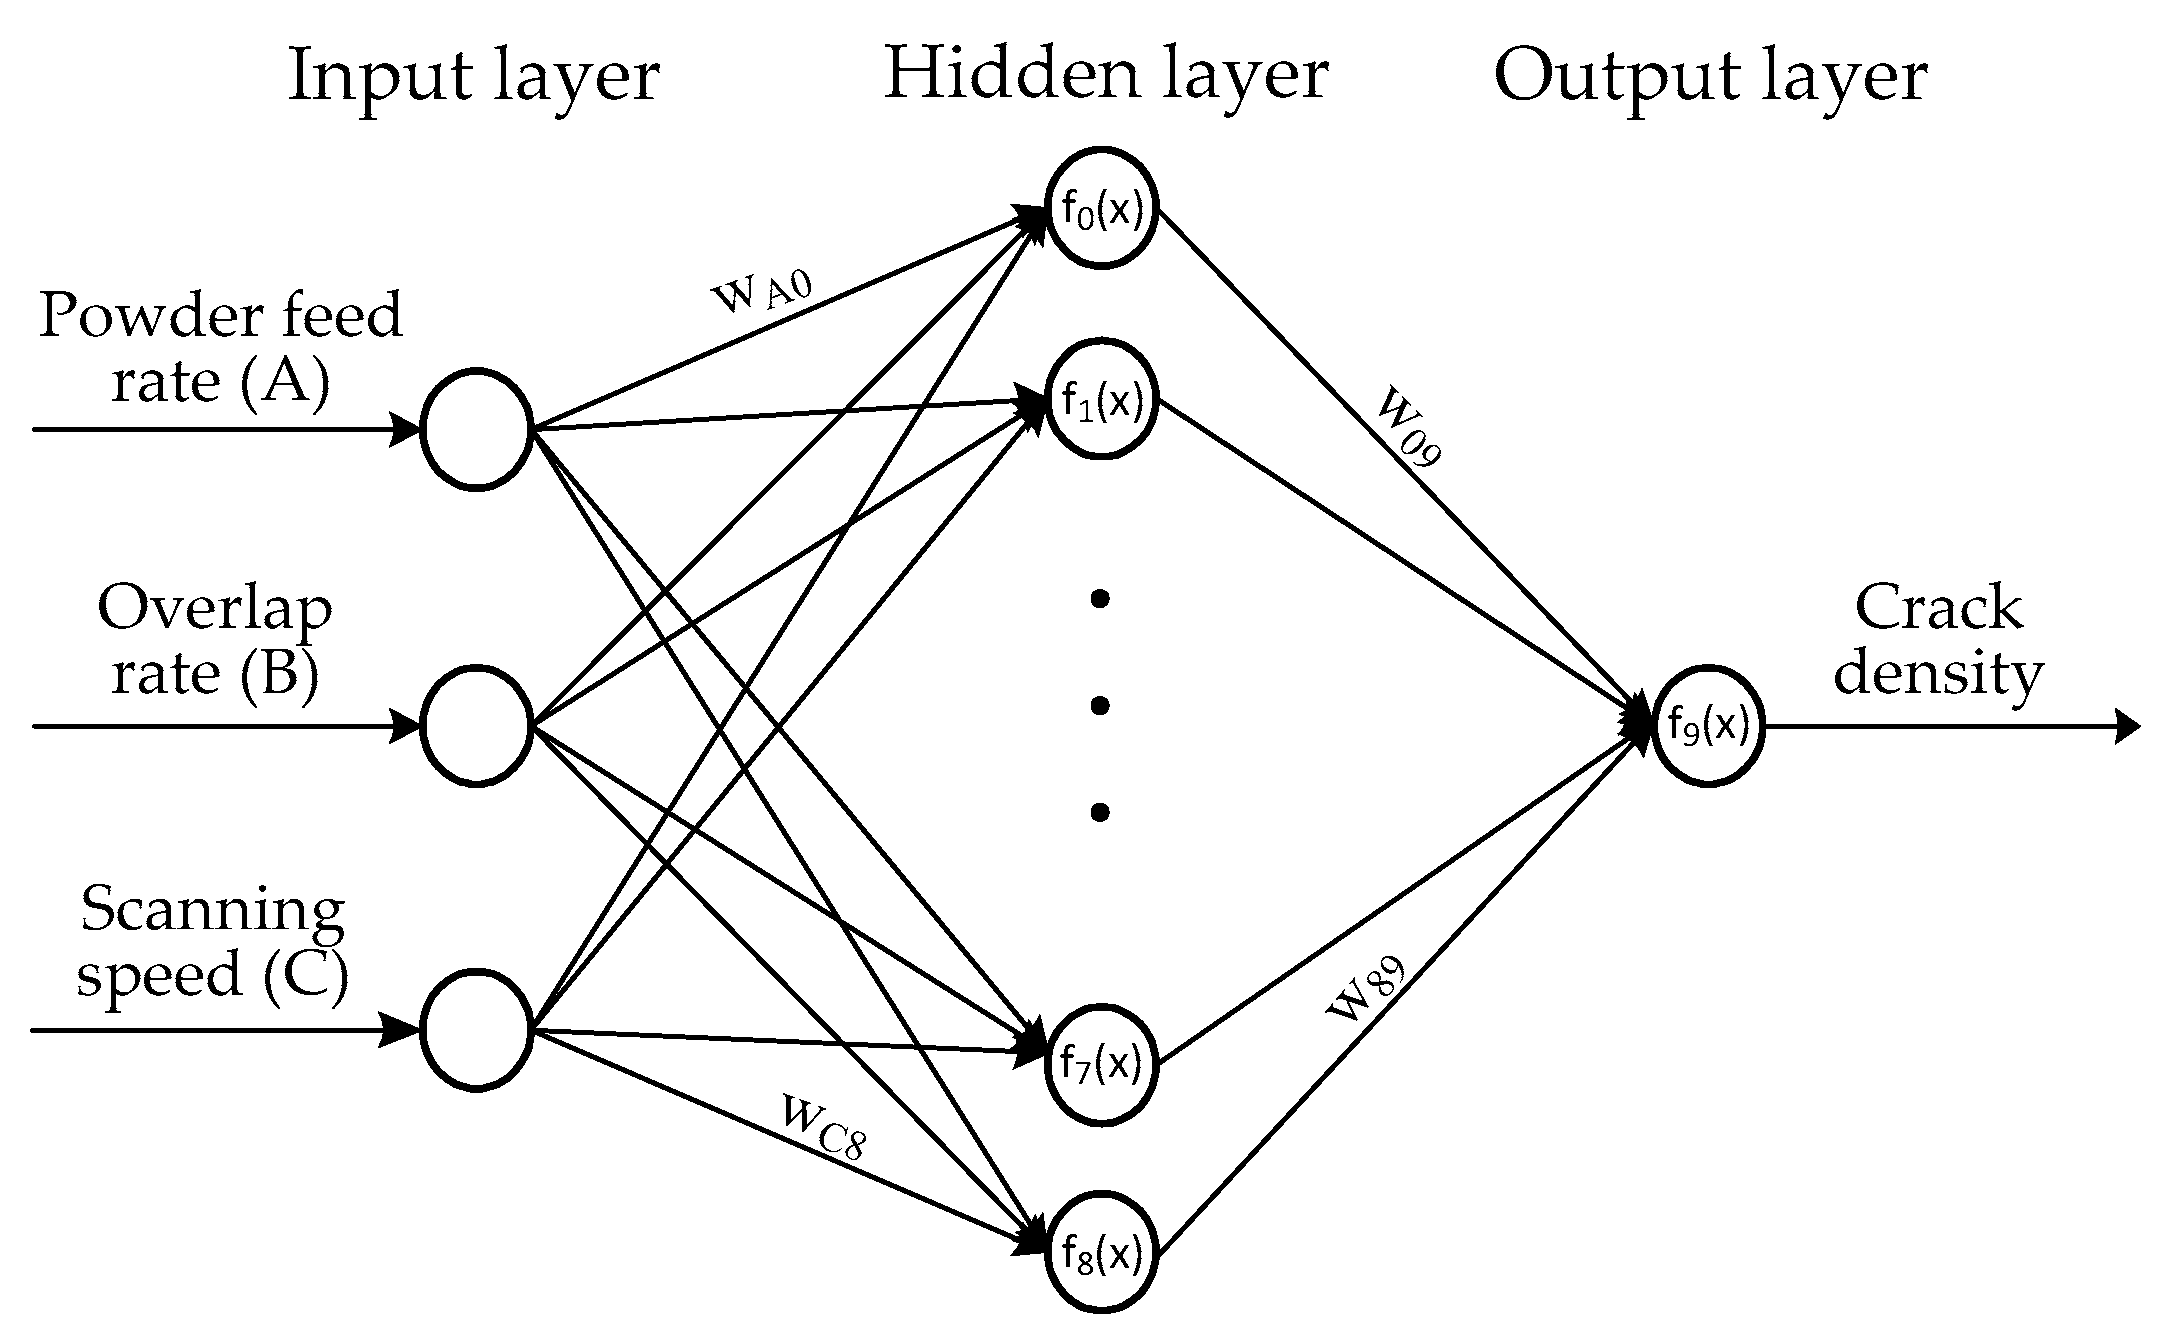
The topological structure of the neural network between the powder feed rate, overlap rate, scanning speed, and crack density was established as shown in Figure 5. The neural network was created by the newff function. The neural network is suitable for prediction and has the characteristics of strong nonlinear approximation ability, a simple training algorithm, and high adaptive ability. The topological structure of the neural network was divided into three layers including the input layer, hidden layer, and output layer. The input layer had three neurons, which represent the powder feed rate, overlap rate, and scanning speed, respectively. According to empirical Equation (2) [26] and the trial-and-error method, it can be determined that there were nine neurons in the hidden layer. The output layer had one neuron, which represented the crack density.
M = Q + G + C
where G is the number of input neurons; Q is the number of output neurons; C is a constant between [1,10]; and M is the number of neurons in the hidden layer.
There were 36 link weights among neurons, there were 10 thresholds for the hidden layer and output layer, and the sum of the link weights and thresholds for the neural network model was 46. The connection weights were continuously modified via the genetic algorithm optimization of the neural network weights and thresholds and neural network sample training to better converge the neural network model and target model.

3.2. Training of Crack Prediction Network Model

As presented in Table 4, 16 groups of laser cladding Ni60 coating process parameters and crack densities were used as training samples to train the constructed neural network structure. The unit between the factors and the output of the orthogonal experiment was not uniform, and the range of the activation function of the neural network output layer was limited. Therefore, the target data of the network training were mapped to the value range of the activation function, and the data needed to be normalized. The training data were normalized and converted into numbers in the interval (0,1). Equation (3) is the normalization processing formula:
P = ( S S m i n ) ( S m a x S m i n )
where P is the normalized data; S is the arbitrary data; and S m a x and S m i n represent the maximum and minimum values in the data, respectively.
The prediction neural network is a forward-type instructor learning neural network model. The number of iterations was set as 1000. The sample was used to train the network model in Figure 5.
The input layer is represented by a matrix:
X = [ A , B , C ]
The connection weights of hidden layers are expressed by matrices:
W 0 = [ w A 0 w B 0 w C 0 ] W 1 = [ w A 1 w B 1 w C 1 ] W 2 = [ w A 2 w B 2 w C 2 ] W 3 = [ w A 3 w B 3 w C 3 ] W 4 = [ w A 4 w B 4 w C 4 ] W 5 = [ w A 5 w B 5 w C 5 ] W 6 = [ w A 6 w B 6 w C 6 ] W 7 = [ w A 7 w B 7 w C 7 ] W 8 = [ w A 8 w B 8 w C 8 ]
The activation function is:
f ( x ) = 1 1 + e α x
y i = f i ( X W i )
The network output value of each hidden layer node y i ( i = 0 , 1 , 2 , 3 8 ) was found.
The network output value of the output layer is:
Y = f 9 ( i = 0 8 y i w i 9 )
The training error backpropagation adjusted the connection weight for error correction. The training error target was 10−5. The training error formula for the predicted and experimental values of each sample is:
δ = 1 2 ( Z k Y k ) 2   ( k = 123   16 )
where δ represents the training error; Z k is the experimental value; and Y k is the predicted value.
The error formula between the nodes of the hidden layer is:
δ i = w i 9 δ ( i = 0 ,   1 ,   2 ,     8 )
Error backpropagation between the hidden layer and the input layer corrected the connection weight:
f ( x ) = d f ( x ) d x = α e α x ( 1 + e α x ) 2   w A 0 = w A 0 + η δ 0 d f 0 ( x ) d x A w B 0 = w B 0 + η δ 0 d f 0 ( x ) d x B   w C 0 = w C 0 + η δ 0 d f 0 ( x ) d x C w A 1 = w A 1 + η δ 1 d f 1 ( x ) d x A
In Equation (11), η is the set value of the learning rate of 0.01. There were 27 connection weights from the input layer to the hidden layer, and the modified connection weights from the input layer to the hidden layer were calculated in turn. f ( x ) and w are the derivatives of the activation function and the modified weight, respectively.
The weights between the hidden layer and the output layer were updated from w 09 to w 89 :
w 09 = w 09 + η δ d f 9 ( x ) d x y 0   w 19 = w 19 + η δ d f 9 ( x ) d x y 1   w 29 = w 29 + η δ d f 9 ( x ) d x y 2 w 89 = w 89 + η δ d f 9 ( x ) d x y 8
The cycle calculations of Equations (3), (4) and (6)–(8) were performed until the training error requirement was satisfied. The training of the next sample was carried out to make each sample meet the set approximation accuracy, and the training ended. The recognition ability and prediction ability were then tested. The reduction process of the training error is shown in Figure 6.

3.3. Optimization of the Neural Network by the Genetic Algorithm

The genetic algorithm-optimized neural network was used to optimize the initial weights and thresholds of the neural network algorithm by using the iterative optimization characteristics of the genetic algorithm. The optimal individuals (weights and thresholds) were then assigned to the neural network for neural network prediction. The genetic algorithm-optimized neural network mainly included the initial population, fitness function, selection, crossover, and mutation. The initialized population was coded by real numbers using individual coding methods. Each individual was a binary string, and the individual contained all the weights and thresholds of the neural network. According to the weights and thresholds optimized by the genetic algorithm, the neural network was trained with test samples, and then used to predict the output, the sum of the absolute error of the predicted value, and the test value as the fitness function. The fitness function is given by Equation (13). The genetic algorithm used roulette to select the operation. The crossover operation used real number crossing, and the mutation operation randomly mutated a point in the chromosome according to the mutation probability to generate a new individual.
E = m ( i = 1 n | g i l i | )
where E is the value of the individual fitness function; m is the coefficient; n is the number of network output nodes; g i is the test value; and l i is the predicted value.
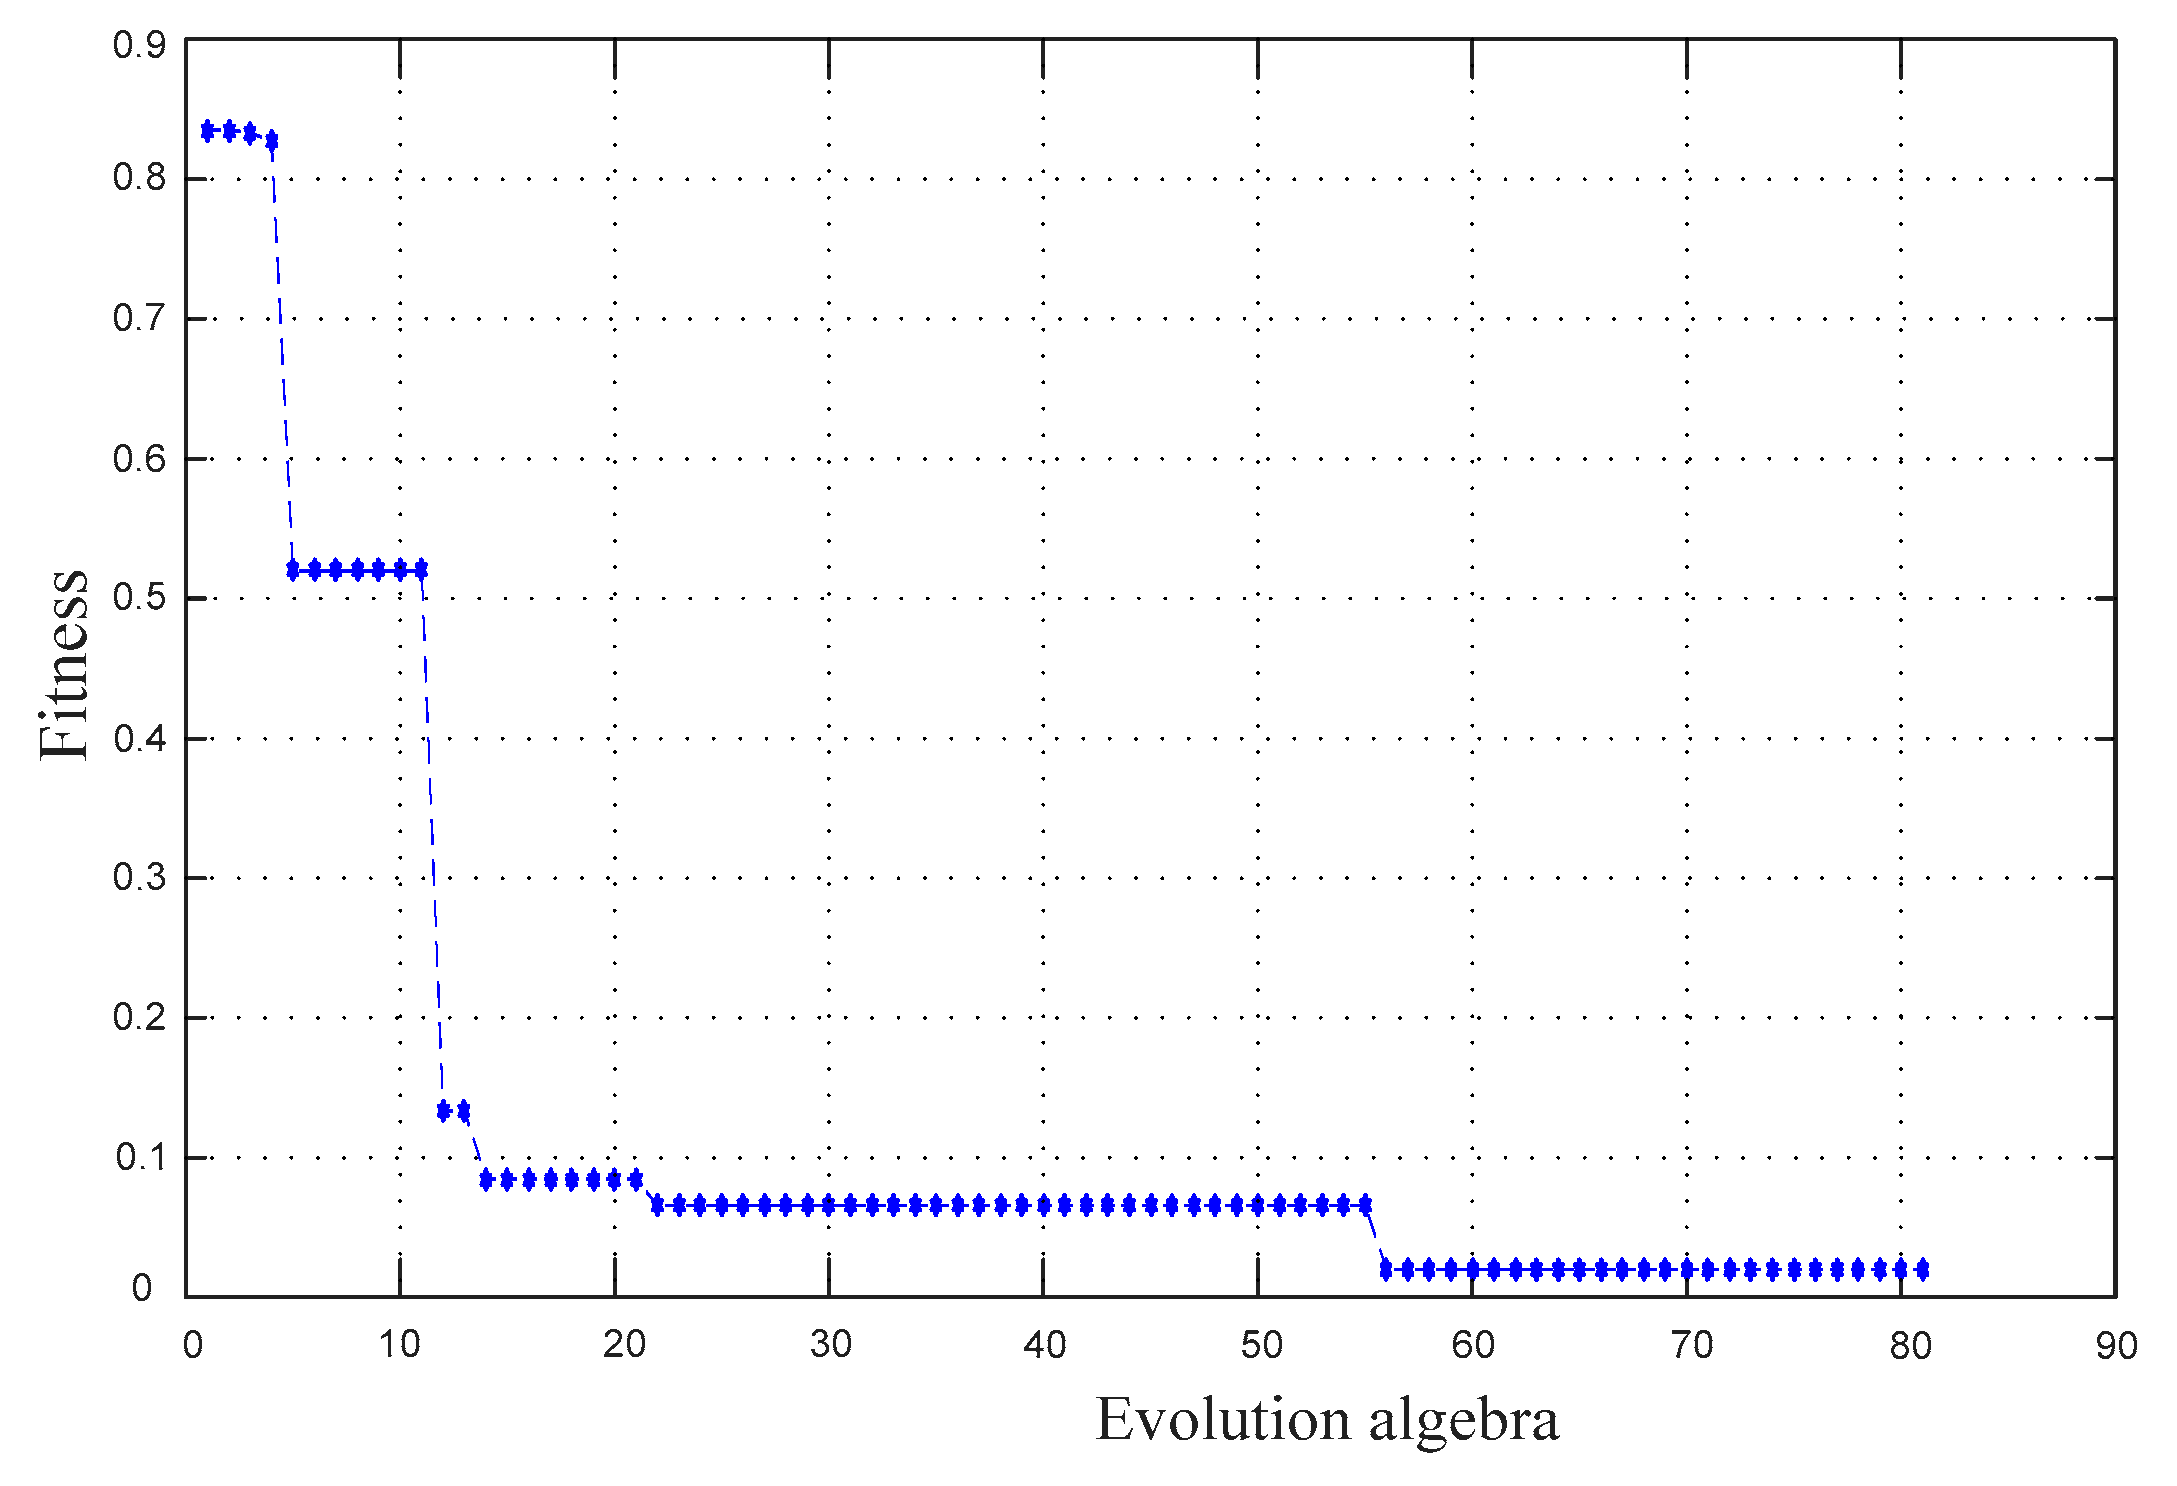
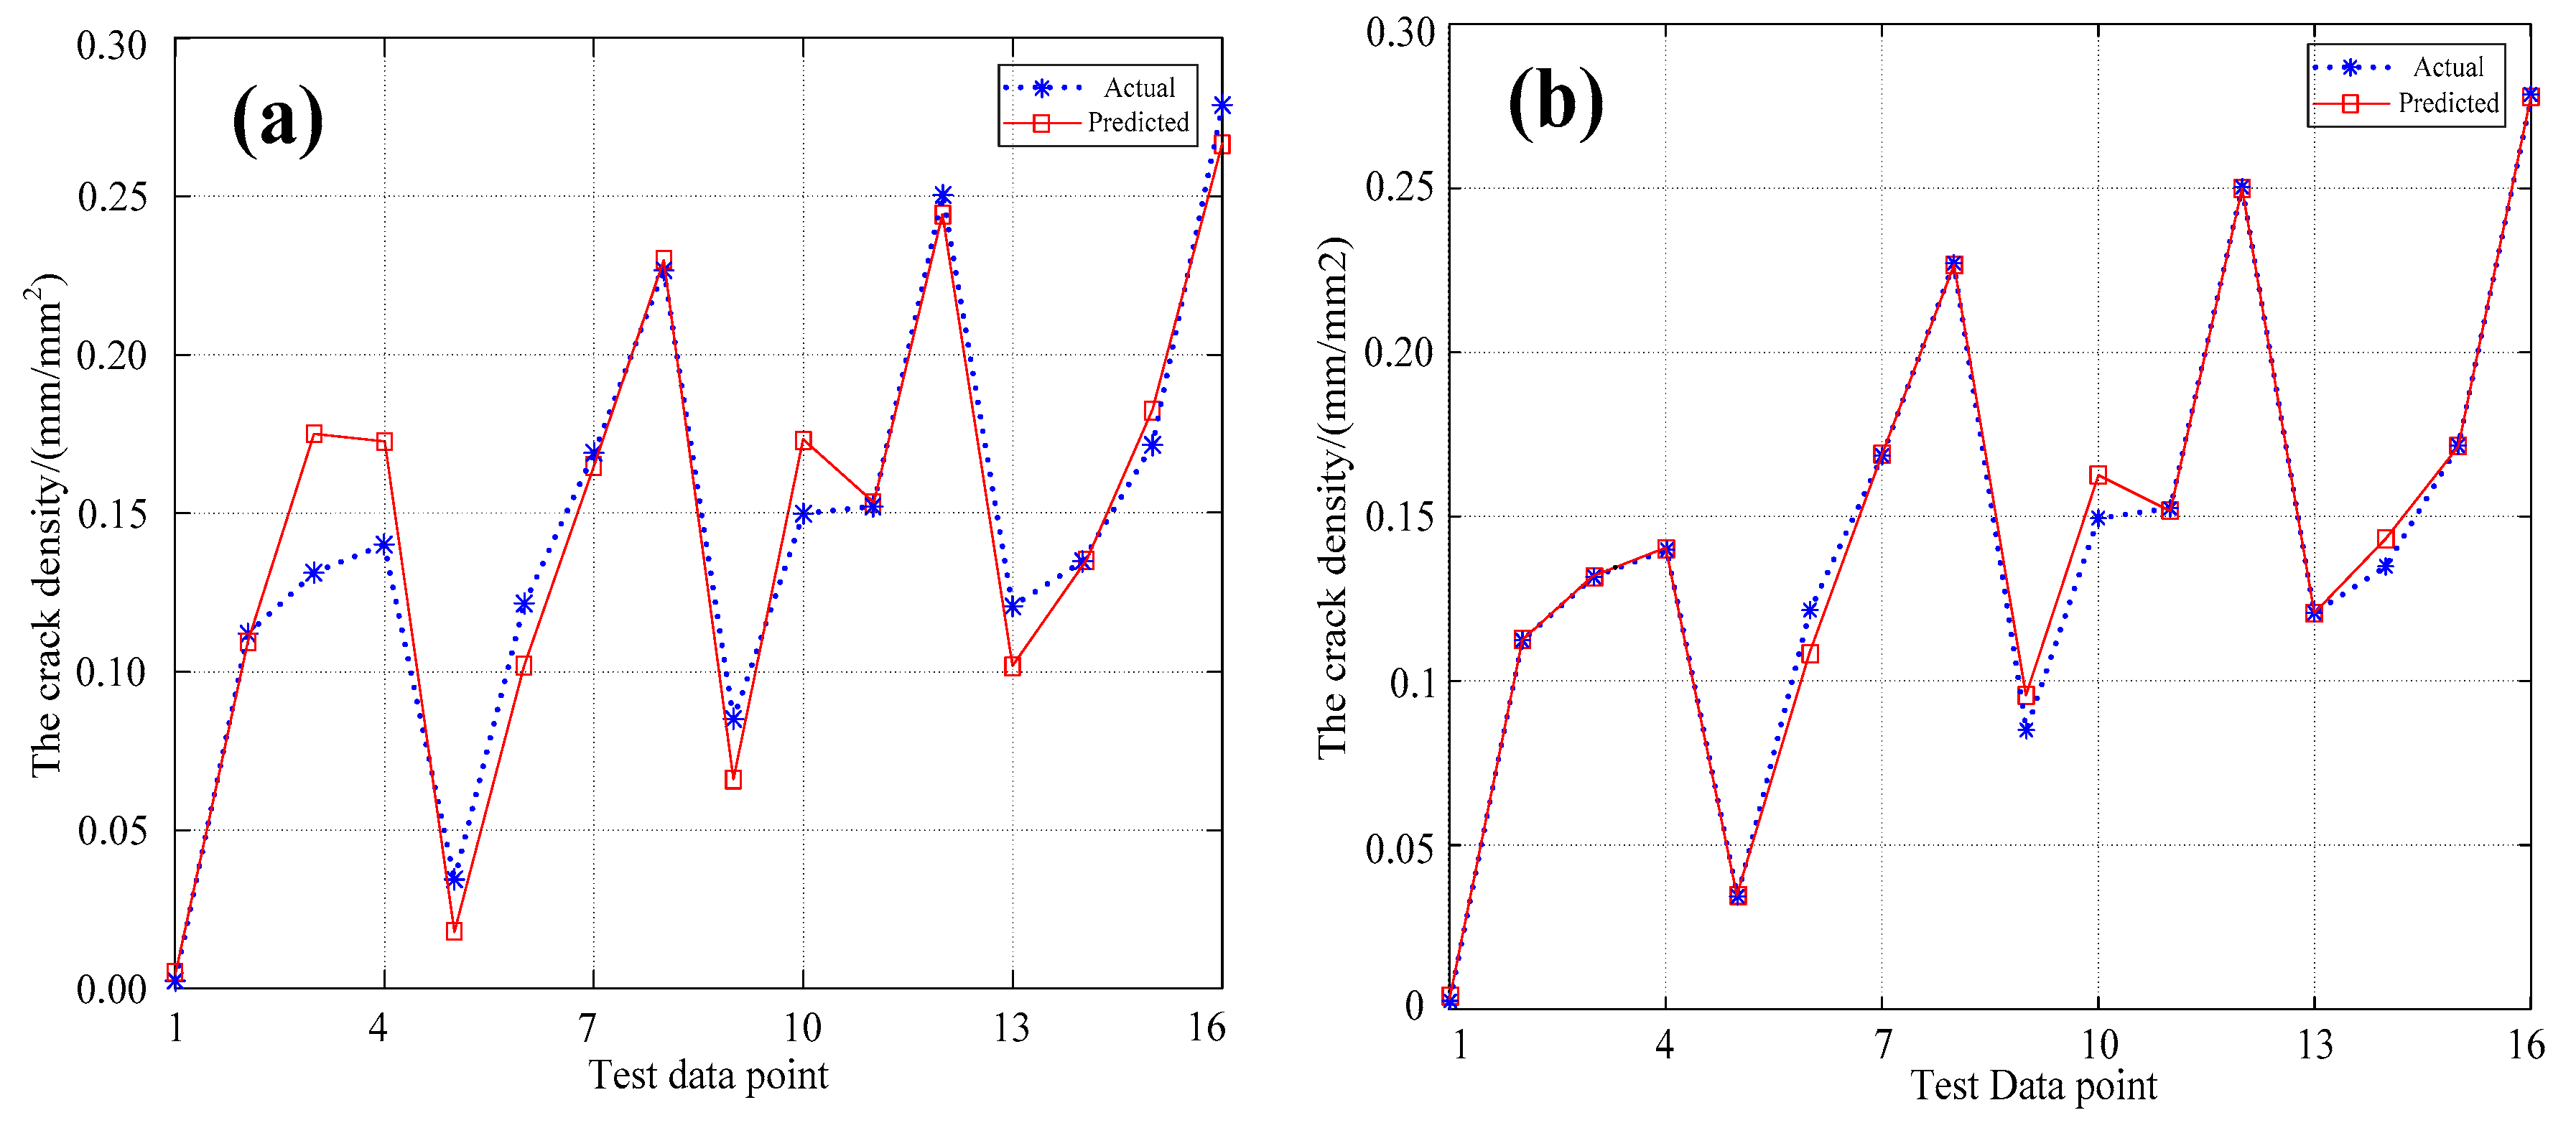
The parameters of the neural network optimized by the genetic algorithm were set as a genetic algebra of 80, population size of 10, crossover probability of 0.3, and mutation probability of 0.1. The iterative descent process of the fitness value in Figure 7 and the simulation diagram of the neural network prediction of genetic algorithm optimization in Figure 8b were obtained via programming simulation. Figure 8a presents a predictive simulation diagram of the neural network without genetic algorithm optimization. Figure 8 is a comparison of the predicted simulation results, and demonstrates that the neural network predictions optimized by the genetic algorithm were more accurate.
The comparison between the predicted values of the neural network optimized by the genetic algorithm and the experimental values is shown in Table 6. The maximum relative error between the predicted and experimental values of the genetic algorithm-optimized neural network was 9.02%, which demonstrates that the precision of the neural network model optimized by the genetic algorithm is acceptable. Equation (14) is the mean square error formula. The mean square error of the neural network optimized by the genetic algorithm was 1.624376 × 10⁻⁵, and that of the unoptimized neural network was 3.250437 × 10⁻⁴. The mean square error was thus greatly improved.
V = 1 N t = 1 N ( O t P t ) 2
where V represents the mean square error; O t is the experimental value; and P t is the predicted value.

3.4. Genetic Algorithm-Optimized Neural Network Model Verification

Three groups of process tests were carried out to verify the predictive effect of the genetic algorithm-optimized neural network model on the crack density of the high-hardness, nickel-based cladding layer. The prediction results obtained by using the optimized neural network model are shown in Table 7. It can be concluded that the difference between the test value and the predicted value was small, and the errors of the three groups of test results were within 9.8%. The reliability of the optimized neural network model was verified, and the feasibility of applying the optimized neural network model to predict the crack density in the field of laser cladding was proven.
The reasons for the errors in the neural network model optimized by the genetic algorithm are as follows. (1) There were defects in the neural network model optimized by the genetic algorithm. It was only an approximation of the non-linear problem, and was not the real value. (2) The accuracy was limited because sample collection was difficult, the number of samples was small, and the training of the neural network was insufficient. (3) The process of sample data acquisition of the neural network is the manual measurement of the crack data, and there were errors in the measurement data itself. (4) In the process of laser cladding, external environmental factors also have different effects on the crack sensitivity of the cladding layer.

3.5. Genetic Algorithms for Optimizing the Prediction Results of the Neural Network Model

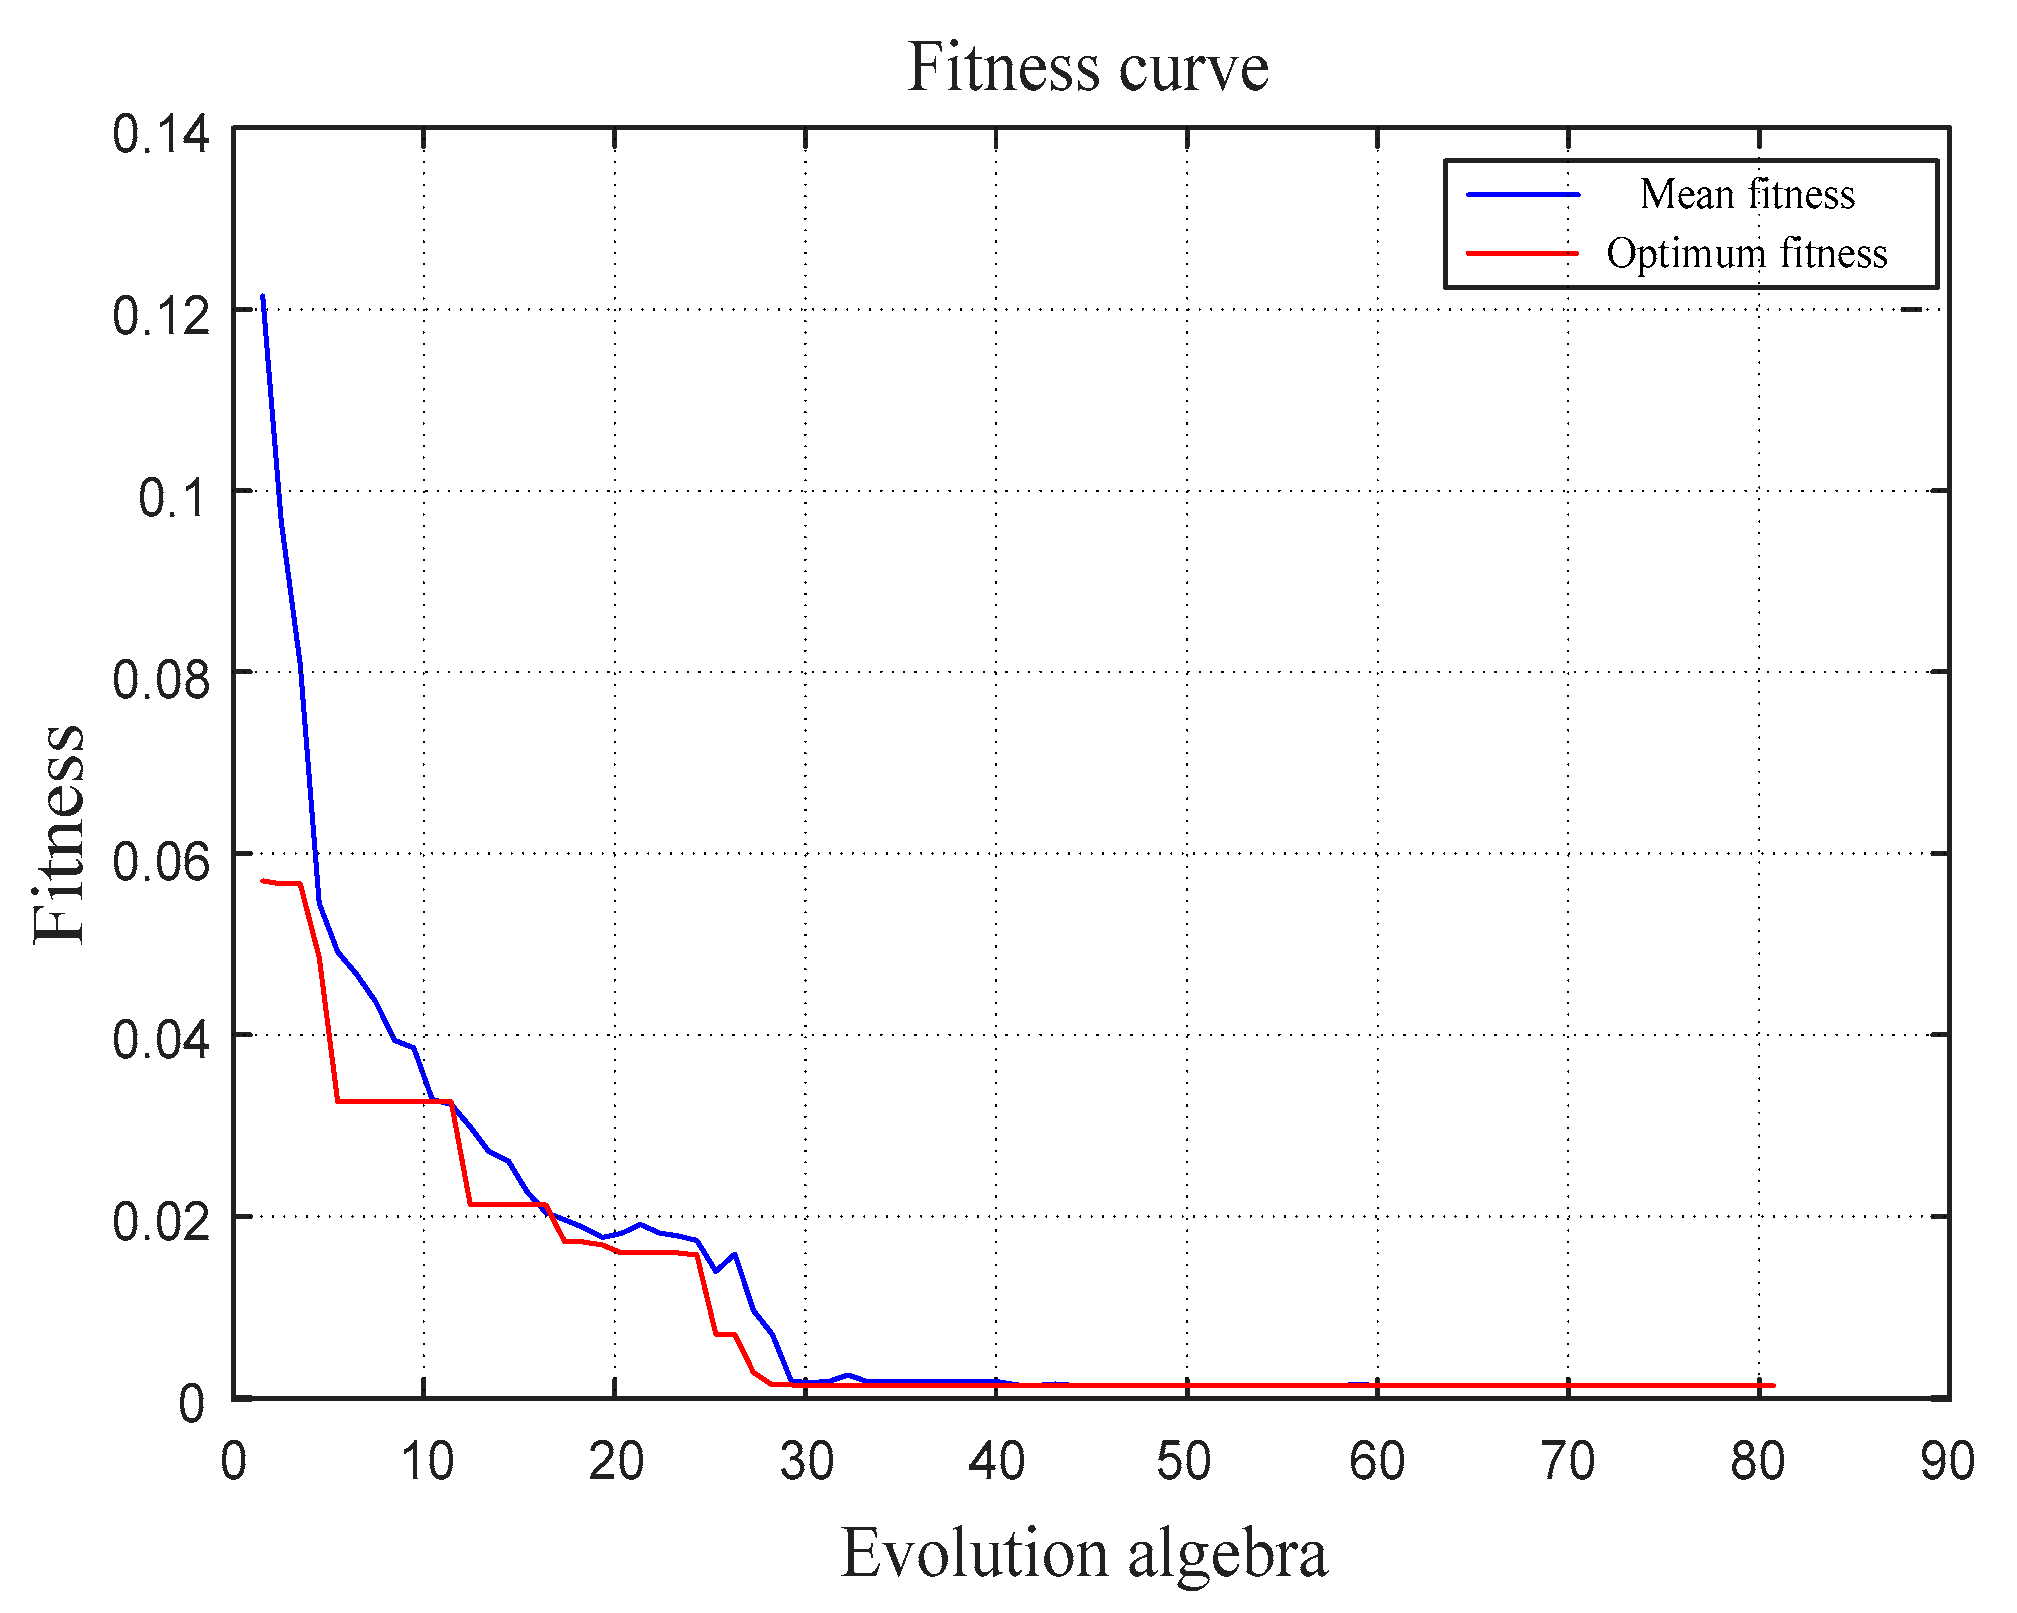
According to the prediction results of the optimized neural network model, the genetic algorithm was used again to optimize the predicted values, and the process parameters with the smallest crack density were found to achieve intelligent optimization. The neural network predicted the crack density value as the fitness function value, and the smaller the crack density, the better the individual. For the initialization of the genetic algorithm population, the genetic algebra was 80, the population size was 20, the crossover probability was 0.4, and the mutation probability was 0.2. The fitness function change curve of the genetic algorithm is presented in Figure 9. The average fitness curve and the best fitness curve coincided after about 40 generations of iteration, and the fitness function value did not change. The genetic algebra was set to iterate for 80 generations, the iteration was stopped, and the optimal individual was output.
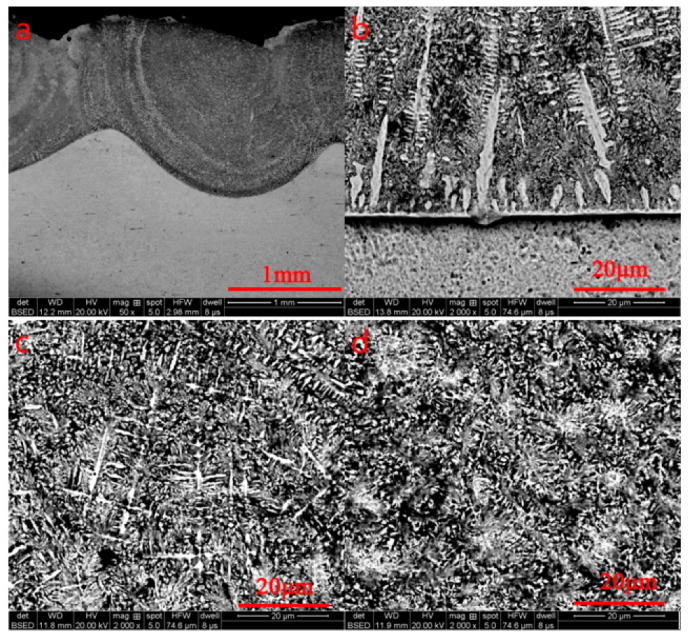
The orthogonal experimental results showed that the optimal process parameters obtained by the laser cladding test were a powder feed rate of 15 g/min, an overlap rate of 45%, a scanning speed of 5 mm/s, and a crack density of 0.002472 mm/mm2. The genetic algorithm optimized the predicted results, and the technological parameters with the smallest crack density were a powder feed rate of 15.0726 g/min, an overlap rate of 49.7997%, a scanning speed of 5.9275 mm/s, and a minimum crack density of 0.001272 mm/mm2. The optimal laser cladding process parameters obtained via predictive optimization produced a crack density that was smaller than the crack density obtained by the orthogonal experiments, and the optimization effect was better. Experimental verification was carried out according to the optimal prediction process parameters obtained by the genetic algorithm. The validation results are displayed in Figure 10, which depicts the inside of the cladding layer as observed via SEM. No obvious cracks were found on the surface of the cladding layer, which is different from the minimum crack density obtained by the genetic algorithm optimization.
The main reason for this is that there were errors in the algorithms used for prediction and optimization and the contingency of the verification experiment, and the algorithm needs to therefore be further improved. However, intelligent control of the surface crack of the coating was basically realized by this process. Figure 11 presents the SEM micrographs of the inside of the cladding layer, which show no significant cracks.

4. Conclusions

  • It was determined via orthogonal experimentation that the order of influence of the parameters on the crack sensitivity of the laser cladding, high-hardness, nickel-based alloy coating was as follows: overlap rate > powder feed rate > scanning speed.
  • A genetic algorithm-optimized neural network model between the powder feeding rate, lapping rate, scanning speed, and crack density of the laser cladding, nickel-based cladding layer was established. The simulation results demonstrated that the neural network optimized by the genetic algorithm was more accurate than the neural network model without genetic algorithm optimization.
  • The crack density of the high-hardness, nickel-based laser cladding layer could be effectively predicted by the process parameters. The prediction error of the genetic algorithm-optimized neural network model was within 9.8%, which proves the reliability of the model. The genetic algorithm optimized the prediction result of the neural network to obtain the process parameters for minimum crack density: a powder feed rate of 15.0726 g/min, an overlap rate of 49.7997%, and a scanning speed of 5.9275 mm/s. The minimum crack density was 0.001272 mm/mm2. The predicted and optimized crack densities were smaller than the minimum crack density obtained by the orthogonal test, and the optimization effect was better. Applying this prediction optimization method to the crack control of laser cladding forming has high practical value.

Author Contributions

W.S., H.H., W.W., Y.W., and Y.H. assisted in the completion of the experiments. J.Y. completed the design of the method and the writing of the article.

Funding

This research was funded by Karamay Major Project (No. 2018ZD002B) and Construction Project of Public Technical Service System in Autonomous Region (No. 2015531096).

Acknowledgments

The author appreciates the support from the Karamay Major Project (No. 2018ZD002B) and Construction Project of Public Technical Service System in Autonomous Region (No. 2015531096).

Conflicts of Interest

The authors declare no conflicts of interest.

References

  1. Liu, H.; Qin, X.; Huang, S.; Jin, L.; Wang, Y.; Lei, K. Geometry characteristics prediction of single track cladding deposited by high power diode laser based on genetic algorithm and neural network. Int. J. Prec. Eng. Manuf. 2018, 19, 1061–1070. [Google Scholar] [CrossRef]
  2. Rahman Rashid, R.A.; Palanisamy, S.; Attar, H.; Bermingham, M.; Dargusch, M.S. Metallurgical features of direct laser-deposited Ti6Al4V with trace boron. J. Manuf. Process. 2018, 35, 651–656. [Google Scholar] [CrossRef]
  3. Nazari, K.A.; Rahman Rashid, R.A.; Palanisamy, S.; Xia, K.; Dargusch, M.S. A novel Ti-Fe composite coating deposited using laser cladding of low cost recycled nano-crystalline titanium powder. Mater. Lett. 2018, 229, 301–304. [Google Scholar] [CrossRef]
  4. Quazi, M.M.; Fazal1, M.A.; Haseeb, A.S.M.A.; Farazila, Y.; Masjuki, H.H.; Arslan, A. Effect of rare earth elements and their oxides on tribo-mechanical performance of laser claddings: A review. J. Rare Earths 2016, 34, 549–564. [Google Scholar] [CrossRef]
  5. Xu, Z.; Jiao, J.; Zhang, Z.; Yang, Y.; Zhang, W. Study on laser repair technology of Nickel-based superalloy. Mater. Rev. 2019, 33, 3196–3202. [Google Scholar]
  6. Ge, M.; Xiang, J.; Fan, Z. Effect of laser cladding repair on fatigue crack growth rate of TC4 titanium alloy. Mater. Rev. 2018, 32, 2803–2808. [Google Scholar]
  7. Zhou, C.; Lin, C.; Zhang, J.; Wang, Q.; Du, S. The effect of Nickel-based solder on defects of laser cladding Ni-based WC alloy coating on #45 steel. Surf. Technol. 2018, 47, 91–95. [Google Scholar]
  8. Dai, Q.; Luo, C.; You, F. Crack restraining methods and their effects on the microstructures and properties of laser cladded WC/Fe coatings. Materials 2018, 11, 2541. [Google Scholar] [CrossRef]
  9. Rahman Rashid, R.A.; Nazari, K.A.; Barr, C.; Palanisamy, S.; Orchowski, N. Effect of laser reheat post-treatment on the microstructural characteristics of laser-cladded ultra-high strength steel. Surf. Coat. Technol. 2019, 372, 93–102. [Google Scholar] [CrossRef]
  10. Li, X.; Liu, S.; Wang, J.; Yu, M.; Tang, H. Effect of Different ZrN Addition on microstructureand wear properties of titanium based coatings by laser cladding technique. Coatings 2019, 9, 261. [Google Scholar] [CrossRef]
  11. Wang, D.; Yang, Y.; Tian, Z.; Shen, L.; Huang, Y. Process optimization of laser multi-layer cladding thick nano-ceramic coating based on neural network and genetic algorithm. Chin. J. Lasers 2013, 40, 62–70. [Google Scholar]
  12. Ni, L.; Liu, J.; Wu, Y.; Yan, C. Laser cladding process optimization based on neural network and particle swarm optimization. Chin. J. Lasers 2011, 38, 99–104. [Google Scholar]
  13. Yang, D.; Ma, L.; Huang, W. Surface quality prediction of laser solid forming parts based on artificial neural network. Chin. J. Lasers 2011, 38, 88–93. [Google Scholar]
  14. Lei, K.; Qin, X.; Liu, H.; Ran, Y. Prediction of characteristic parameters of broadband laser cladding pool based on neural network. J. Optoelectr. Laser 2018, 29, 1212–1220. [Google Scholar]
  15. Wang, X.; Lin, X.; Yang, H.; Li, Q.; Tan, H.; Han, J.; Huang, W. Research on the crack predictions in K465 superalloy by laser remelting based on BP neural networks. Appl. Laser 2014, 34, 9–14. [Google Scholar] [CrossRef]
  16. Liu, Y.; Sun, R.; Niu, W.; Zhang, T.; Lei, Y. Effects of CeO2 on microstructure and properties of TiC/Ti2 Ni reinforced Ti-based laser cladding composite coatings. Opt. Lasers Eng. 2019, 120, 84–94. [Google Scholar]
  17. Wang, Y.L.; Li, C.; Jiang, F.L.; Zhang, J.; An, X.L. Microstructure and mechanical properties of ultrasonic assisted laser cladding Al2O3-ZrO2 ceramic coating. Mater. Res. Express 2019, 6, 106563. [Google Scholar] [CrossRef]
  18. Yu, J.; Yan, M.; Liang, E.; Yuan, B. Effect of TiO2 on the microstructure and properties of laser cladding layers of Fe-based alloy. Appl. Laser 2003, 4, 201–204. [Google Scholar]
  19. Fan, Z.; Dong, X.; Wang, K.; Duan, W.; Wang, R.; Mei, X. Effect of drilling allowance on TBC delamination, spatter and re-meltedcracks characteristics in laser drilling of TBC coated superalloys. Int. J. Mach. Tools Manuf. 2016, 106, 1–10. [Google Scholar] [CrossRef]
  20. Fan, Z.; Wang, K.; Dong, X.; Wang, R.; Duan, W. The role of the surface morphology and segmented cracks on thedamage forms of laser re-melted thermal barrier coatings in presence of a molten salt (Na2SO4+ V2O5). Corros. Sci. 2017, 115, 56–67. [Google Scholar] [CrossRef]
  21. Zhang, L.; Chen, X.; Liu, W.; Jiang, Z.; Zhao, P.; Liu, D. Study on crack formation mechanism and sensitivity of laser cladding Ni-based alloys. Laser Optoelectr. Prog. 2019, 56, l176–l183. [Google Scholar]
  22. Li, R.; Jin, Y.; Li, Z.; Zhu, Y.; Wu, M. Effect of the remelting scanning speed on the amorphous forming abilityof Ni-based alloy using laser cladding plus a laser remelting process. Surf. Coat. Technol. 2014, 259, 725–731. [Google Scholar] [CrossRef]
  23. Wang, D.; Hu, Q.; Zheng, Y.; Xie, Y.; Zeng, X. Study on deposition rate and laser energy efficiency of laser-inductionhybrid cladding. Opt. Laser Technol. 2016, 77, 16–22. [Google Scholar] [CrossRef]
  24. Abioye, T.E.; Mccartney, D.G.; Clare, A.T. Laser cladding of inconel 625 wire for corrosion protection. J. Mater. Proc. 2015, 217, 232–240. [Google Scholar] [CrossRef]
  25. Akbari, M.; Saedodin, S.; Panjehpour, A.; Hassani, M.; Afrand, M.; Torkamany, M.J. Numerical simulation and designing artificial neural network for estimating melt pool geometry and temperature distribution in laser welding of Ti6Al4V alloy. Optik-Int. J. Light Electr. Opt. 2016, 127, 11161–11172. [Google Scholar] [CrossRef]
  26. Liu, G.; Huang, B. Prediction of morphology of Nickel-based alloy cladding coating based on GA-BP neural network. Appl. Laser 2018, 38, 527–535. [Google Scholar]
Figure 1. Laser cladding equipment.
Coatings 09 00728 g001
Figure 2. Crack detection results. (A,a) The scheme with the least crack before and after the flaw detection. (B,b) The scheme with the largest crack before and after the flaw detection.
Coatings 09 00728 g002
Figure 3. Factor effect curve.
Coatings 09 00728 g003
Figure 4. Overall algorithm flow.
Coatings 09 00728 g004
Figure 5. Crack prediction network topology.
Coatings 09 00728 g005
Figure 6. Training error reduction process.
Coatings 09 00728 g006
Figure 7. The process of fitness value decline.
Coatings 09 00728 g007
Figure 8. Comparison of the predicted results. (a) Neural network prediction simulation diagram. (b) Genetic algorithm-optimized neural network prediction simulation diagram.
Coatings 09 00728 g008
Figure 9. Fitness curve.
Coatings 09 00728 g009
Figure 10. Validation results of the optimized parameters.
Coatings 09 00728 g010
Figure 11. SEM micrographs of the inside of the cladding layer. (a) The overall picture of the cladding layer. (b) The lower, (c) middle, and (d) upper parts of the cladding layer.
Coatings 09 00728 g011
Table 1. Chemical composition of the #45 steel (mass fraction %).
ElementCrSSiCpMnNiCu
Content≤0.25≤0.0350.17~0.370.42~0.50≤0.0350.50~0.80≤0.25≤0.25
Table 2. Chemical composition of the Ni60 alloy powder (mass fraction %).
ElementCCrBSiFeNi
Content0.8163.54.5≤15.0Bal.
Table 3. Orthogonal test level and factor design.
LevelPowder Feed Rate A/(g/min)Overlap Rate B/(%)Scanning Speed C/(mm/s)
115455
217507
319559
4216011
Table 4. Laser cladding results of the orthogonal testing.
SamplesA/(g/min)B/(%)C/(mm/s)Crack Density/(mm/mm2)
#11110.002472
#21220.112450
#31330.131451
#41440.140142
#52120.034483
#62210.121578
#72340.169252
#82430.226565
#93130.085027
#103240.149855
#113310.152161
#123420.250340
#134140.120522
#144230.134810
#154320.171483
#164410.278756
Table 5. Range analysis.
Test IndexPowder Feed Rate (A)Overlap Rate (B)Scanning Speed (C)
K10.0966290.0606260.138742
K20.1379700.1296730.142189
K30.1593460.1560870.144463
K40.1763930.2239510.144943
Range0.0797640.1633250.006201
Influence orderB > A > C
Optimal levelA1B1C1
Optimal groupA1B1C1
Table 6. Comparison of the predicted and experimental values.
Serial NumberTest Value/(mm/mm2)Predicted Value/(mm/mm2)Relative Error/(%)
#10.0024720.002484 0.465210%
#20.1124500.112576 0.112050%
#30.1314510.131371 0.060859%
#40.1401420.140271 0.092049%
#50.0344830.034578 0.275498%
#60.1215780.115506 4.994325%
#70.1692520.169319 0.039586%
#80.2265650.226416 0.065765%
#90.0850270.088607 4.210427%
#100.1498550.158379 9.024724%
#110.1521610.151899 0.172186%
#120.2503400.250255 0.033954%
#130.1205220.120482 0.033189%
#140.1348100.140005 3.853572%
#150.1714830.171375 0.062980%
#160.2787560.278351 0.145288%
Table 7. Verification of the optimized neural network model.
Powder Feed Rate/(g/min)Overlap Rate/(%)Scanning Speed/(mm/s)Test Result/(mm/mm2)Prediction Results/(mm/mm2)Relative Error/(%)
1650100.0821560.0741129.791129%
1945120.0912110.0884453.032529%
205560.2591200.2609310.698904%