Abstract
The recent interest in the development of nanomaterials has led researchers to the study of their electrical properties and the applications that they may have as insulating materials. One of these applications is the use of nanofluids as electrical insulation of power transformers. It has been reported that the dielectric properties of insulating liquids in which small amounts of nanoparticles have been dispersed are, in some cases, superior to those of the base fluids. Although these materials are promising, and their application could lead to advantages for the transformer design and reliability in the future, more research is necessary to evaluate different combination of materials under a wider range of experimental conditions. In this paper, a research on the lightning impulse breakdown voltage of mineral oil and several Fe3O4-based nanofluids is presented. Fluids prepared with different concentrations of nanoparticles were subjected to impulse lightning voltages considering both positive and negative polarities. As shown in this work the positive impulse breakdown voltage of the liquids showed improvements of up to 50%; in the case of the negative impulses not significant improvements were obtained.
1. Introduction
Mineral oil (MO) and ester-based liquids are widely used nowadays as transformer liquid insulation. In the last decade, the addition of Nanoparticles (NP) to transformer insulating liquids has been proposed as an attempt to improve the electrical and thermal properties of conventional insulating liquids [1,2]. The obtention of liquids with superior dielectric and thermal properties could lead to the manufacturing of transformers with smaller sizes and higher reliability.
Several authors have demonstrated that the addition of small concentrations of NP can significantly improve the dielectric [3,4,5] and thermal [6] properties of the oils. Experimental works have been published reporting large improvements in the AC and DC breakdown voltage, the partial discharge inception level and the impulse breakdown voltage of these liquids compared with those of the base fluids [7,8,9,10]. However, the results are strongly dependent on the used materials (base fluid, NP type), the manufacturing methods and the testing procedures, and more tests are required to evaluate the properties of these new liquids making possible their safe application in the future [3,4,11].
A streamer is a transient electrical discharge which may appear when an insulating medium, such as insulating oil, is exposed to a large voltage drop, such as a lightning or switching impulse. According to the ASTM D3300 standard [12] and IEC 60897 [13], streamer propagation is generally measured using a standard lightning impulse voltage 1.2/50 µs in a needle-sphere combination of electrodes with a 25 mm gap. Some studies have maintained this needle-sphere combination of electrodes as [1,14,15,16] although some other authors used other electrode configurations in their studies such as needle-plane electrodes [17] or sphere-sphere as [18]. The speed of streamer propagation in dielectric liquids is strongly dependent on the polarity of the applied voltage and its peak amplitude [14,19,20]. In the particular case of MO, it has been proved that the streamers originated on a positive electrode tend to initiate at lower voltages than those originated on a negative electrode, and propagate faster and further [21] supposing a higher risk for the transformer insulation.
According to the survey published by the insurance company Hartford Steam Boiler Inspection & Insurance, which was obtained from a database with thousands of transformers from all over the world investigated during a 20 years period [22], 17% of the failures originated in transformers are caused by lightning events. In this report lightning is listed as the second cause of transformer failure, only preceded by the failures produced by electrical disturbances (switching surges, voltage spikes, line faults, flashovers) which suppose the 29% of the cases. It seems clear that the use of insulating liquids with a higher dielectric strength under impulse conditions would improve the reliability of transformers greatly.
Several authors have proved that nanodielectric fluids (NDF) have higher breakdown voltages than the base fluids when subjected to lightning impulses. Sugumaran [23] studied the impact of adding of two different types of NP (ZrO2 and TiO2) to a MO, comparing the impulse breakdown voltage (BDV) of the resulting liquids for different NP concentrations obtaining that at lower concentrations (0.005 wt %) the improvement was of 16% for ZrO2 and 19% for TiO2, at medium concentrations (0.01 wt %) the improvement was a 13% in both cases and at higher concentration (0.05 wt %) the improvement was 7% for ZrO2 and 9% for TiO2. In [24] Rafiq concluded that the addition of SiO2 NP leads to an improvement of the dielectric strength under impulse conditions but only for positive impulses, while for negative impulses the author observes a worsening of the properties. In another study by the same author [15], the BDV under impulse conditions results are compared using Fe3O4 NP of different sizes. Rafiq obtained better results when using NP with diameter 20 nm than at 10 or 40 nm, concluding that, “when magnetic nanoparticle’s size is higher than 20nm, the bigger size of NPs may produce chains in close proximity of electrodes that give rise to the internal local electric field causing a breakdown initiation [25]”.
Although some experimental works have been published in the last years on the topic of impulse properties of Fe3O4-based NDF, the topic is still very new and more experiences are necessary to make possible the advance of these materials. One of the challenges is the variety of materials and testing methods used by the different authors what complicates the comparison of results.
In this work an exhaustive evaluation of the impulse breakdown voltage of several Fe3O4 MO based NDF is carried out studying the differences between the streamer propagation in the MO and in the prepared NDF. The AC BDV of the same fluids was analyzed by the authors in a previous work [26,27]. Although the thermal properties of dielectric materials are important to describe the behavior of transformer insulation, this paper only handles the dielectric behavior of these materials when subjected to lightning impulse tests. Additional investigation on the thermal aspects would be needed to get a full picture of the system behavior.
The experimental study presented in the work extends the previous studies performed by other authors, as the authors evaluate the effect of the NP concentration on the BDV and include a detailed statistical analysis based not only in comparing the average values of the BDV of the evaluated liquids but also on the BDV for low probabilities of failure. Liquids with three different concentrations of NP were tested to study how the presence of the NP affects the dielectric properties in positive and negative impulse conditions. The results were analyzed with nonparametric statistical analysis and by means of a parametric study through Weibull distribution. The streamer velocity was calculated for all the liquids and the obtained values were used to explain the experimental observations and to describe physical mechanisms to justify the results.
2. Materials and Methods
2.1. Preparation of the Materials
Commercial MO Nytro 4000X (Nynas AB, Stockholm, Sweden) was used as base fluid for the preparation of the NDF tested in this work.
Small masses of a ferrofluid suspension of Fe3O4 NP were added to the base fluid in order to obtain the NDF. The suspension used for this work was custom made by the company Magnacol.co (Cambridge, United Kingdom) and consists of Fe3O4 NP, 10 nm diameter, dissolved in MO Nitro 4000X up to a concentration 60 wt %.
The procedure to manufacture the NDF analysed in this work was as follows:
Firstly, the MO was filtered, degassed and dried in a vacuum oven at 50 °C. Next, the amount of NP suspension that must be added to the MO is calculated taking into consideration the total amount of NDF to be prepared, the required NP concentration and the solid content of NP in the suspension. Table 1 shows the concentration of the prepared NDF expressed in g/L and W/w. In addition, Table 1 shows the amounts of suspension added for each considered concentration for the preparation of a NDF volume 0.5 L.

Table 1.
Mass of NP suspension added to obtain 0.5 L of NDF.
The NP are added to the MO. The mixture is performed using an ultrasonic probe (sonicator) with wave intensity 270 W/cm2. The mixture is stirred for two hours in intervals of 30 s of agitation and a 30 s of pause, to avoid overheating of the mixture.
The samples are kept at ambient temperature for 24 h to ensure that the bubbles generated by the sonicator are released, and finally they are dried in a vacuum oven at 50 °C and 0.1 atm for a minimum time of 48 h before starting the tests.
Liquids with NP concentrations 0.2, 0.4, and 0.6 g/L were prepared that remained stable at ambient temperature for more than a year following the procedure described above. In a previous work [28], the stability of the obtained NDF was analysed in detail; measures of NP sizes were performed to detect the presence of NP aggregates. The obtained NP radius were very close to those provided by the manufacturer (within 10.5 and 12.3 nm).
2.2. Impulse Breakdown Voltage Tests
The BDV under impulse of the prepared NDF was characterized according to ASTM D 3300–12 standard [12]. The impulses were applied by means of a High Voltage Module Test System, manufactured by HIGH VOLT (Dresden, Germany) which incorporates a single-phase transformer with rated AC voltage 100 kV (model WGBS 6.6/100-135), and several HV modules that combined as shown in Figure 1 constitute an impulse generator. The system is controlled by a High Voltage manual control module (model High Volt SM4). The measurements are recorded with a Lecroy WavePro 950 oscilloscope (Teledyne LeCroy, Chestnut Ridge, New York, USA). A diagram of the measuring scheme is shown in Figure 1.
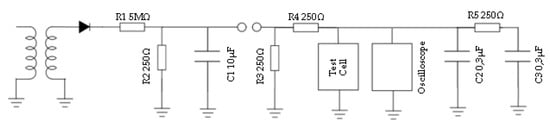
Figure 1.
Diagram of the measuring scheme.
A normalized lightning impulse wave 1.2/50 µs was considered in the study. The application of the transient voltages was performed by means of a needle electrode opposing a grounded sphere following the recommendations of ASTMD3300-12 Std [12].
The test cell used in the tests was manufactured according to the recommendations of ASTM D 3300-12 Std [12]. It was made in polycarbonate, a material of high dielectric strength, with thickness 15 mm and with the dimensions recommended in the mentioned Std, what guarantees that the electrical breakdown is restricted to the electrode gap. The electrodes consist of a polished brass sphere of 12.7 mm (0.5 inches) diameter and a steel needle of ratio 0.35 mm. Figure 2 shows the diagram and a picture of the cell.
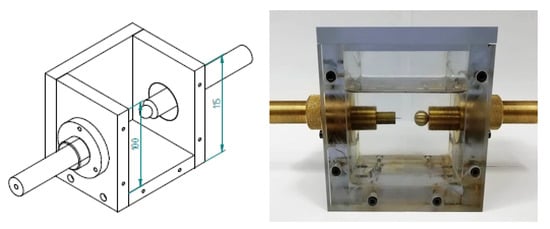
Figure 2.
Diagram of the cell (dimensions are expressed in mm) and picture of the cell.
Although the ASTM D 3300-12 standard [12] recommends setting a distance between electrodes of 25 mm for needle-to-sphere electrodes, the gap spacing used in this work was modified, since the impulse generator employed does not reach voltages above 110 kV which are not enough to get the electric breakdown of the dielectric liquids evaluated in this work. The distance between electrodes was set at 10 mm for positive impulses and at 3 mm for negative impulses. The test values at these distances are not valid for transformer design purposes but they are useful to provide comparison between different liquids.
For each liquid included in the study a set of ten measures of positive impulse and ten measures of negative impulse was carried out. Therefore, as the experimental work presented in this paper includes the analysis of four liquids, a MO and three NDF with different concentrations of NPs (0.2, 0.4 and 0.6 g/L), eighty measures were performed.
Before starting each test, the test cell was filled with 500 mL of the liquids under analysis and the sample was left to rest for ten minutes. Then the impulses were applied allowing the liquid to settle for two minutes after each breakdown. The measuring sequence was as follows:
First, an impulse wave is applied with a crest voltage level which is 5 kV below the expected breakdown level. Three impulse waves are applied with the same voltage. If no breakdown takes place, the crest voltage is increased in steps of 5 kV and successive impulses are applied until the first breakdown takes place. After applying each impulse test without breakdown, a minimum time of 30 s is allowed before applying a new impulse. When the first breakdown has occurred, the applied voltage is decreased by 5% and three impulses are applied at the new voltage. If any of the three impulses causes a breakdown, the voltage of the next impulse is decreased by 5%. If no breakdown is recorded after applying three impulses, the crest voltage is increased another 5% and thee impulses are applied at the new voltage. The process is repeated until a total of ten breakdowns are recorded, registering for each breakdown, the values of the breakdown voltage and the time to breakdown. To characterize the impulse BDV of an insulating liquid, IEC Std 60897 [13] recommends carrying out five breakdowns measurements and then, calculating the average value of the BDV and its standard deviation. In this work we extended the measuring campaign to five additional breakdowns obtaining 10 values of impulse BDV for each of the four tested fluids.
Although the BDV characterization would be more precise if a higher number of breakdowns were recorded, most of the previous works in the field of NDF base their results in five and even less breakdowns (i.e [7] and [16] considers five ruptures, [1] and [8] three ruptures and [15] six ruptures). It must be considered that NDF are not commercially available and so their testing involves a fluid manufacturing stage that complicates the measuring campaign. Obtaining a higher number of BDV measures would require the replacement of the NDFs under test with a new sample after ten ruptures [14]. In this work the ten ruptures used to obtain the BDV value at each polarity were measured on the same sample.
An example of one of the applied impulses is shown in Figure 3 including the main measured parameters (i.e the impulse BDV and the time to breakdown).
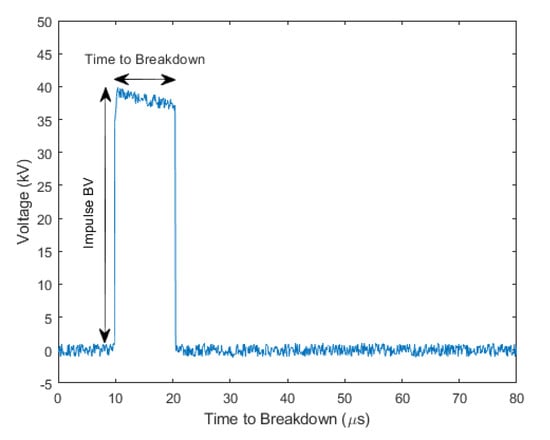
Figure 3.
Evolution of voltage during one of the measures.
After five breakdowns the needle is changed and after ten breakdowns, the spherical electrode is replaced too. After finishing the positive polarity test and before adding a new sample of liquid, the test cell is carefully cleaned with water, ether and detergent, then it is rinsed with distilled water and dried in an oven for 2 h at 110 °C. When all the positive polarity tests are finished, the assembly is changed and the procedure is restarted to measure the BDV of the four liquids under lightning impulses with negative polarity.
3. Results
Figure 4 summarizes the results of the positive and negative impulse tests for the four analysed liquids (MO and NDF with NP concentrations 0.2, 0.4 and 0.6 g/L). In each case, the impulse BDV and the time to breakdown of the ten ruptures, plotted in increasing order.
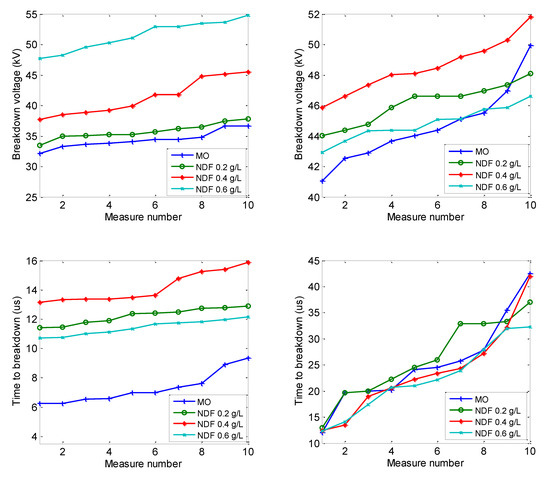
Figure 4.
BDV and time to breakdown recorded for positive (figures at the left, electrode distance 10 mm) and negative impulses (figures at the right electrode distance 3 mm) on the MO and the NDFs.
As can be seen, a clear improvement in the BDV of positive impulses is observed when NP are added to the MO. Specifically, the liquid with NP concentration of 0.6 g/L shows the best results of the study for positive impulse. Regarding the negative impulses, only a very slight improvement is appreciated, which is more noticeable for the liquid with NP concentration 0.4 g/L.
It should be noted that the measures of the positive and negative impulses were carried out considering a different gap, so the absolute values of both polarities should not be compared. However, considering that the gap distance in the case of the positive impulse was 3 times larger than that considered for negative impulse tests (10 mm vs. 3 mm) it seems clear that the positive impulse supposes a greater risk for the insulating liquids. That observation agrees with the theoretical explanation provided in [20] and with the further measures performed by the authors at different electrode distances shown in Section 3.3.
3.1. Statistical Analysis
The mean value of the impulse breakdown voltage was calculated for each liquid and each polarity. Figure 5 shows the average values of ten measurements for the liquid at different concentrations of NP, for both positive and negative impulses. As can be seen, the average BDV of the liquids improves as the concentration of NP increases for the positive impulses. On the other hand, the results of the average values of the BDV for the negative impulses show that there is hardly any variation of this parameter as NP are added to the oil.
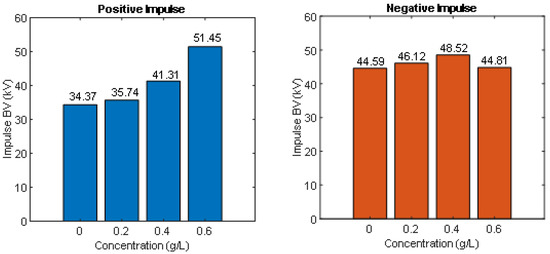
Figure 5.
Average value of the BDV for the MO and the NDF with different concentrations of NPs. Positive impulses (left; electrode distance 10 mm) and Negative impulses (right, electrode distance 3 mm).
Table 2. shows the results of the mean values of the BDV measurements and the standard deviation (SD) of the measures. As can be seen, the SD is higher for the liquids prepared with 0.4 g/L and 0.6 g/L concentrations of NP, while for 0.2 g/L the SD is lower than in the MO. A high presence of NP (0.4 and 0.6 g/L) seems to increase the dispersion of the data obtained.
Table 2.
Average value, SD and percentiles of the BDV under Positive Impulse.
As shown in Table 2, the percentile 10 of the positive-impulse BDV enhances greatly when NP are added to the oil. Specifically, for a concentration of 0.6 g/L of NP, the improvement to a percentile 10 is 45%. The improvement of low percentiles can be of great importance when designing a transformer [29,30] as it is related with failure probability at low voltages. In the case of the Median (i.e., percentile 50), the data are very similar to those observed in the average value.
In the case of negative impulses, for the considered set up, the results are quite different from what was shown for positive impulses (Table 3). First of all, there is no significant improvement in the mean value of the impulse BDV for the NDF, although it can be seen that the presence of NP decreases the SD.
Table 3.
Average value, median, SD and percentiles of the BDV under Negative Impulse.
Given that the differences in the mean values of the four liquids are small, an analysis of variance (ANOVA) [31] was performed to determine if there is significant difference between them. The ANOVA analysis shown that there are significant statistical differences between the means of the four groups (p-value = 4.0704 × 10⁻⁵, F = 10.5366). Further comparisons using the Tukey HSD test [32] indicated that the mean score for the BDV of the NDF with NO concentration 0.4 g/L is significantly different than the BDV of the three other samples. Figure 6 shows the multiple comparison of the means; as it can be seen there is an overlapping of the confidence bounds obtained for the BDV of the MO and the NDF with NP concentrations 0.2 and 0.6 g/L but these do not overlap with the BDV of the sample of concentration 0.4 g/L. It can only be pointed out that for lower percentiles the concentration that shows the best performance is the one that was prepared with NP concentration 0.4 g/L. In this case, the percentile 10 is enhanced by 10%.
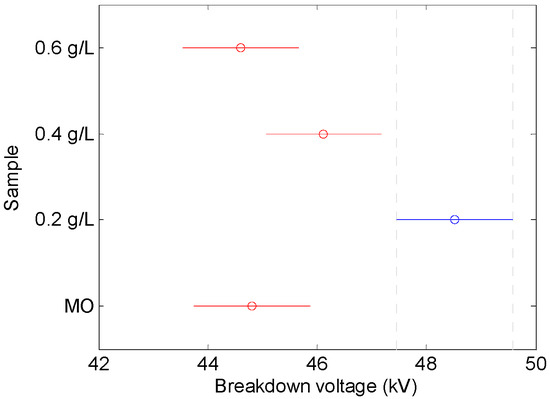
Figure 6.
Multiple comparison of the means of the BDV of the four NDF and the MO.
Additionally, the time to breakdown was analyzed for positive and negative impulses. Table 4 shows the average values of the times to breakdown for positive and negative impulses. As can be seen the times calculated for positive impulses are always higher for oils with NP. On the other hand, no significant variations of the times are observed for the negative impulses when NP are added to the MO.
Table 4.
Times to breakdown for positive and negative impulses for every concentration of NP.
3.2. Weibull Study
The impulse BDV results were adjusted to a Probability Weibull distribution (Equation (1)):
where P(V) is the failure rate of the test liquid when subjected to a voltage V, a is the scale parameter (which shows the breakdown voltage at a failure probability of 63% and its units are kV) and b is the shape parameter (which is related with the dispersion of the BDV measurements). The parameters obtained for each liquid are shown in Table 5.
Table 5.
Parameters for the Weibull adjustment of the Positive Impulses.
Figure 7 shows the positive impulse BDV vs the probability of failure for the four analyzed liquids. Additionally, Table 6 shows the values of the BDV for probability of failure 25%, 50% and 75% estimated with the Weibull distribution for the MO and the NDF with NP concentrations 0.2, 0.4 and 0.6 g/L. As can be seen, the addition of NP leads to a clear improvement of the dielectric strength under positive impulse conditions.
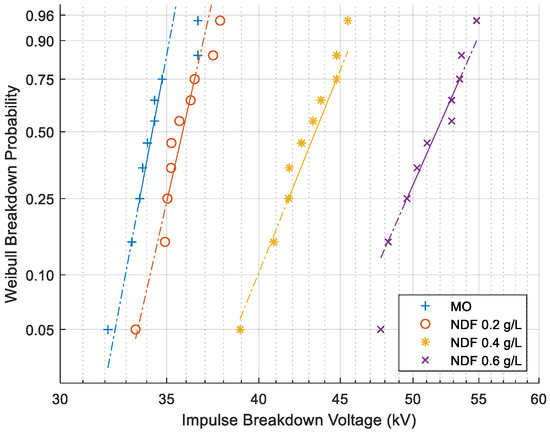
Figure 7.
Weibull Probability for Positive Impulse BDV.
Table 6.
Weibull probability for positive impulse BDV (kV) at different concentration of NPs.
Figure 8 shows the Negative Impulse BDV vs the probability of failure for the different liquids. As can be seen, the presence of NP slightly improves the dielectric properties under negative impulse conditions. The parameters obtained for each liquid are shown in Table 7.
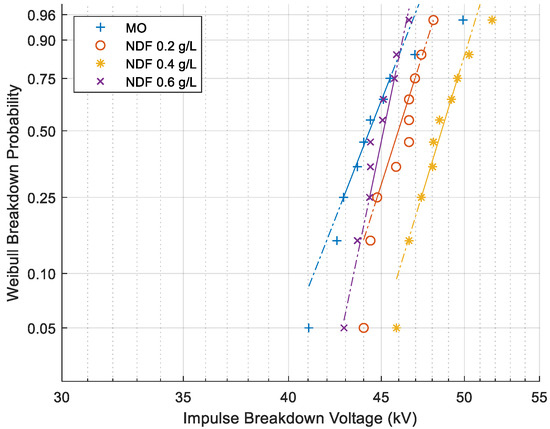
Figure 8.
Weibull Probability for Negative Impulse BDV.
Table 7.
Parameters for the Weibull adjustment of the Negative Impulses.
Table 8 shows the BDV under negative impulse, calculated with the Weibull distribution for failure probabilities 25%, 50% and 75%. As can be seen, the presence of NP leads to a minor improvement of the values.
Table 8.
BDV (kV) for different probabilities of failure for negative impulses according to Weibull distribution.
3.3. Comparison of the Results of Positive and Negative Impulses
As explained before, the electrode distances considered in this work for the characterization of positive and negative impulse BDV were different; in the case of positive impulses a distance 10mm was set between the electrodes and for the negative impulses it was shortened to 3 mm.
To allow a comparison between the results of the positive and negative impulse tests, an additional set of tests was carried out. The MO used as base fluid was subjected to five new positive impulses tests considering electrode distances 3, 5, 15, 20 and 25 mm and to an additional negative impulse test with electrode distance 5mm. The testing procedure followed for these measures was the one described in Section 2.2.
The average values of the 10 BDV values recorded for each distance are shown in Table 9. The data for the negative impulse values were completed with the specifications provided by the manufacturer for the MO under negative impulse test at normalized distance (i.e., negative BDV at 25mm >300 kV).
Table 9.
Average value of the positive and negative BDV of MO for different electrode distances.
The positive and negative impulse BDV at different electrode distances are shown in Figure 9. The data of positive and negative impulse were fitted to a quadratic polynomial to make possible the normalization of the results. The obtained relations were (2) and (3).
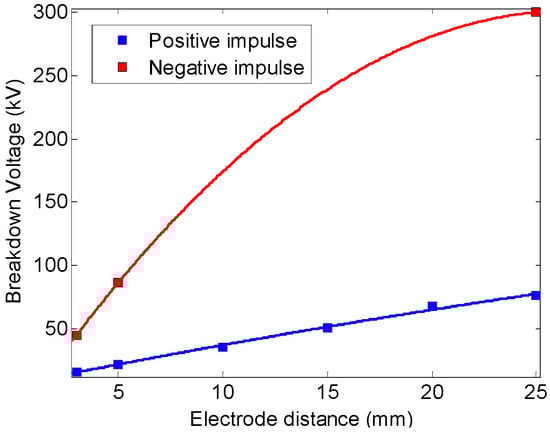
Figure 9.
Average value of the positive and negative BDV of MO for different electrode distances and tendency line.
Equations (2) and (3) were used to normalize the data of the NDF at different electrode distances. Table 10 compares the positive and negative BDV at 3, 10 and 25 mm. These results are a rough estimation, as to calculate them me assumed that Equations (2) and (3) are valid for the NDF.
Table 10.
Comparison of positive and negative impulse BDV for several electrode distances.
4. Discussion
To evaluate the impact of the NP in the impulse BDV of the MO, the ratios of increase of the average BDV, the percentiles and the BDV for different failure probabilities have been calculated for positive and negative impulses.
Table 11 shows the enhancement obtained for positive impulses. As can be seen, the performance of NDF is clearer superior to that of MO under positive impulse. Moreover, as the concentration of NP rises, the percentage of improvement of the BDV average value increases, reaching a maximum improvement of 50% at a concentration of NP 0.6 g/L. The percentile values and the BDV for different failure probabilities have the same tendency, showing the best results the NDF with higher concentration of NP (0.6 g/L) where the improvement of all the parameters was around 50%.
Table 11.
Ratio of improvement (%) of the BDV under positive impulses for the NDF vs. the MO.
These results are very similar to the ones presented by other authors. Rafiq reported an improvement of up to 30% in the positive BDV Fe3O4 [15] and SiO2 based NDF [24].
The ratios of improvement obtained for the negative impulse measurements are shown in Table 12. As can be seen, the improvements in this case are much lower, finding a maximum increase of the average BDV of 8% for the NDF with NP concentration 0.4 g/L. For the other two NDF the change is almost null (i.e., in the case of the NDF with NP concentration 0.6 g/L it is below 1%). Regarding the percentiles and the BDV for different failure probabilities, similar results are found: the improvements are low, and in some cases a slight worsening is even observed.
Table 12.
Ratio of improvement (%) of the BDV under negative impulses for the NDF vs. the MO.
These results are also in agreement with those shown by other authors although it is difficult to perform a precise comparison because of the diversity in electrode configurations (i.e electrode shapes and distances), base fluids and NP types and concentrations used by the authors that have worked in the topic. In, [33] a worsening of the Impulse BDV is reported for several NDF prepared with various NP (ZnO, BaTiO3, TiO2) at different concentrations (0.01% and 0.03%). A deterioration is also reported by Rafiq et al. in [24] for SiO2 based NDF.
From all the previous, it can be concluded that there is a significant difference in the rate of variation of the dielectric strength of NDF when they are subjected to positive impulses and to negative impulses. While a major improvement of the BDV is obtained for positive impulses at all tested NP concentrations (especially at higher ones), the impact of NP in the negative impulse BDV is small and at high concentrations of NP the properties of the base fluid are even worsened.
Several authors have related the enhancement of the positive-impulse breakdown voltage of NDF with the fact that part of the fast electrons involved in the streamer are trapped by the NP reducing their mobility [34]. The low mobility of charged NP hinders the formation of a space charge zone at the streamer tip avoiding the propagation of the electric field wave needed to drive electric-field-dependent molecular ionization, and hence streamer propagation [35]. At low concentrations, the distance between NP is very large allowing the movement of most of the electrons, but as the concentration of NP increases, the distance between NP is shorter and electrons are captured to a greater extent, slowing down the propagation of the streamer and giving rise to higher values of BDV.
Some theoretical analysis of the streamer propagation phenomena in NDF have been reported by other authors [36,37]. These studies analyze the streamer processes by means of finite elements models and proved that streamer propagation in insulating liquids requires ionization of the liquids and in NDF many of the electrons generated by this ionization are trapped by the NP before they are transported out of the ionization region. For this reason, the time scales of streamer development in NDF are significantly longer than those in the unmodified base fluids.
Lv et al. [16] studied the pre-breakdown phenomena in a TiO2 and MO based NDF using an Intensified Charge Coupled Device camera to capture streamer propagation images. They proved that the shape of the streamer is very different in MO and in NDF. While positive streamers propagate with a tree-like shape in the case of the MO, in the case of NDF the branches are thicker and propagate with a lower speed. The shape for the negative streamers is very different as well. In this case the streamer presents a bush-like shape in the MO, while in the NDF multi filamentary discharge channels are appreciated that propagate fast towards the ground electrode [16].
As stated by [38] in order to evaluate the impulse breakdown properties of dielectric liquids, it is important to evaluate the propagation average speed as:
where d is the distance between electrodes and t is the time to breakdown. Table 13 shows the average speeds calculated for positive and negative impulses with the experimental data obtained in this work.
Table 13.
Streamer propagation speed for positive and negative impulses in MO and in the Fe3O4 based NDF.
As can be seen, there is a decrease of about a 40 % in the speed of propagation of positive impulses when NP are added to the MO, while the presence of NP does not seem to affect the speed of propagation of negative streamers. This result is in agreement with the theories and results reported by other authors [16,39,40,41], and confirm that the variation of the streamer propagation speed is deeply related with the improvements observed of the BDV values. If the propagation is slower there is a higher probability of the streamer being extinguished and the rupture does not take place.
It is also interesting to note that the speed of propagation of negative streamers in MO is more than 10 times smaller than the speed of propagation of positive streamers in the same liquid. The difference can be justified by analyzing the electric field distribution across the gap and the subsequent ability of that electric field to produce a molecular ionization that could derive in a dielectric breakdown. The risk associated to positive impulses is much higher that the risk associated to negative ones and in consequence the enhancement of the positive impulse BDV is a very advantageous property of the NDF.
5. Conclusions
In this work an exhaustive experimental evaluation of the impulse BDV of Fe3O4 based NDF has been carried out showing that the presence of NP improves the dielectric properties significantly under positive impulse conditions. Improvements up to 50% were obtained for liquids with concentrations of NP 0.6 g/L. In the case of negative impulses, the presence of NP hardly modifies the values obtained, but does not worsen the values of Impulse BDV either. The experimental measurements were fitted to a Weibull distribution finding similar conclusions: in the case of positive impulses, a considerable improvement of the values of the BDV is appreciated. This improvement is very important at low probabilities of failure raising from 32 kV (approximately) of BDV in MO without NP to a value of 45 kV (approximately) for a concentration of 0.6 g/L, In the case of negative impulses, this improvement is not significant although the data show a lower dispersion.
The observed results are related with the variation of the streamer propagation speed: In the case of positive streamer, the propagation speed is halved, what hinders the evolution of the discharge and thus increases the BDV value.
It is important to note that streamers originating from a positive electrode are the ones that poses a higher risk for the transformer integrity, as they tend to initiate at lower voltages than those originating from a negative electrode, and to propagate faster and further so this differential property of NDF could suppose an important advantage for the design of transformer dielectric insulation.
Although a few authors have studied the impulse BDV of Fe3O4- and MO- based NDF, the topic of NDF is still very new and more data is required to evaluate the repeatability of the observations, the lack of dependence on the manufacturing and testing processes and the performance of different combination of materials. In this sense, the presented work contributes to the state of the art on Fe3O4 based NDF.
The results presented in the paper agree with those presented by previous authors on the topic. However, the conclusions obtained in this work are derived form a more detailed study; a higher number of NP concentrations were included in the testing campaign and each liquid was subjected to a higher number of measures what allowed us to improve the reliability of our experiments. The statistic study presented in the paper is not only based in the evaluation of the mean values of the BDV, as is a common practice in previous works, but also analyses the low failure probabilities, which are important to characterize the quality of a dielectric liquid. The study is completed with the analysis of the streamer velocity of the different liquids, which is not obtained by most previous authors, and the obtained values are used to explain the experimental observations and to describe physical mechanisms to justify the results. The study presented in this work extends the studies performed by previous authors and contributes to a better understanding of the phenomena that take place in MO Fe3O4-based NDF when subjected to lightning impulse over-voltages.
Author Contributions
V.A.P. performed the experiments, interpreted the results and wrote the manuscript. B.G. interpreted the results and wrote the manuscript. J.C.B. interpreted measurements and revised the manuscript. D.P.-R. performed the experiments.
Funding
This research was funded by the Spanish Ministry of Economy and Competitiveness. Grant number DPI2015-71219-C2-2-R.
Acknowledgments
The authors acknowledge Ángel Gómez Solanilla for his help with the definition of the measuring process and Alan Meredith-Jones for providing samples of the NP dispersion manufactured by Magnacol Ltd.
Conflicts of Interest
The authors declare no conflict of interest.
References
- Segal, V.; Hjortsberg, A.; Rabinovich, A.; Nattrass, D.; Raj, K. AC (60 Hz) and impulse breakdown strength of a colloidal fluid based on transformer oil and magnetite nanoparticles. In Proceedings of the Conference Record of the 1998 IEEE International Symposium on Electrical Insulation (Cat. No.98CH36239), Arlington, VA, USA, 7–10 June 1998; Volume 2, pp. 619–622. [Google Scholar]
- Segal, V.; Raj, K. An investigation of power transformer cooling with magnetic fluids. Indian J. Eng. Mater. Sci. 1998, 5, 416–422. [Google Scholar]
- Rafiq, M.; Lv, Y.; Li, C. A review on properties, opportunities, and challenges of transformer oil-based nanofluids. J. Nanomater. 2016, 2016, 8371560. [Google Scholar] [CrossRef]
- Primo, V.A.; Garcia, B.; Albarracín, R. Improvement of transformer liquid insulation using nanodielectric fluids: A review. IEEE Electr. Insul. Mag. 2018, 34, 13–26. [Google Scholar] [CrossRef]
- Devendiran, D.K.; Amirtham, V.A. A review on preparation, characterization, properties and applications of nano fl uids. Renew. Sustain. Energy Rev. 2016, 60, 21–40. [Google Scholar]
- Choi, C.; Yoo, H.S.; Oh, J.M. Preparation and heat transfer properties of nanoparticle-in-transformer oil dispersions as advanced energy-efficient coolants. Curr. Appl. Phys. 2008, 8, 710–712. [Google Scholar] [CrossRef]
- Nazari, M.; Rasoulifard, M.H.; Hosseini, H. Dielectric breakdown strength of magnetic nano fl uid based on insulation oil after impulse test. J. Magn. Magn. Mater. 2016, 399, 1–4. [Google Scholar] [CrossRef]
- Zhou, J.Q.; Du, Y.F.; Chen, M.T.; Li, C.R.; Li, X.X.; Lv, Y.Z. AC and lightning breakdown strength of transformer oil modified by semiconducting nanoparticles. In Proceedings of the Annual Report Conference on Electrical Insulation and Dielectric Phenomena, CEIDP, Cancun, Mexico, 16–19 October 2011; pp. 652–654. [Google Scholar]
- Peppas, G.D.; Bakandritsos, A.; Charalampakos, V.P.; Pyrgioti, E.C.; Tucek, J.; Zboril, R.; Gonos, I.F. Ultrastable natural ester-based nanofluids for high voltage insulation applications. ACS Appl. Mater. Interfaces 2016, 8, 25202–25209. [Google Scholar] [CrossRef]
- Danikas, M.G.; Bakandritsos, A.; Peppas, G.D.; Charalampakos, V.P.; Pyrgioti, E.C.; Gonos, I.F. Statistical investigation of AC breakdown voltage of nanofluids compared with mineral and natural ester oil. IET Sci. Meas. Technol. 2016, 10, 644–652. [Google Scholar]
- Sima, W.; Shi, J.; Yang, Q.; Huang, S.; Cao, X. Effects of conductivity and permittivity of nanoparticle on transformer oil insulation performance: Experiment and theory. IEEE Trans. Dielectr. Electr. Insul. 2015, 22, 380–390. [Google Scholar] [CrossRef]
- ASTM D3300-12: Standard Test Method for Dielectric Breakdown Voltage of Insulating Oils of Petroleum Origin Under Impulse Conditions; ASTM: West Conshohocken, PA, USA, 2019.
- Commission International Electrotechnical. IEC 60897:1987 Methods for the Determination of the Lightning Breakdown Voltage of Insulating Liquids; Commission International Electrotechnical: Geneva, Switzerland, 1987; p. 27. [Google Scholar]
- Rozga, P.; Stanek, M.; Rapp, K. Lightning Properties of Selected Insulating Synthetic Esters and Mineral Oil in Point-to-Sphere Electrode System. IEEE Trans. Dielectr. Electr. Insul. 2018, 25, 1699–1705. [Google Scholar] [CrossRef]
- Rafiq, M.; Yi, K.; Li, C.; Lv, Y.; Numan, M.; Nasir, U. Effect of Fe3O4 Nanoparticle Size on Impulse Breakdown Strength of Mineral Oil-Based Nanofluids. In Proceedings of the 2016 International Conference for Students on Applied Engineering (ICSAE), Newcastle upon Tyne, UK, 20–21 October 2016; pp. 186–189. [Google Scholar]
- Ge, Y.; Lv, Y.; Han, Q.; Sun, Q.; Huang, M.; Li, C.; Qi, B.; Yuan, J. Effect of TiO2 nanoparticles on streamer propagation in transformer oil under lightning impulse voltage. IEEE Trans. Dielectr. Electr. Insul. 2016, 23, 2110–2115. [Google Scholar]
- Denat, A.; Lesaint, O.; Cluskey, F.M. Géophysiques, Breakdown of liquids in long gaps: Influence of distance, impulse shape, liquid nature, and interpretation of measurements. IEEE Trans. Dielectr. Electr. Insul. 2015, 22, 2581–2591. [Google Scholar] [CrossRef]
- Liu, Q.; Wang, Z.D.; Perrot, F. Impulse Breakdown Voltages of Ester-based Transformer Oils Determined by Using Different Test Methods. In Proceedings of the 2009 IEEE Conference on Electrical Insulation and Dielectric Phenomena, Virginia Beach, VA, USA, 18–21 October 2009; pp. 608–612. [Google Scholar]
- Rozga, P.; Stanek, M. Comparative analysis of lightning breakdown voltage of natural ester liquids of different viscosities supported by light emission measurement. IEEE Trans. Dielectr. Electr. Insul. 2017, 24, 991–999. [Google Scholar] [CrossRef]
- Lesaint, O. Prebreakdown phenomena in liquids: Propagation ‘modes’ and basic physical properties. J. Phys. D Appl. Phys. 2016, 49, 144001. [Google Scholar] [CrossRef]
- Jadidian, J.; Member, S.; Zahn, M.; Lavesson, N.; Widlund, O.; Borg, K. Effects of impulse voltage polarity, peak amplitude, and rise time on streamers initiated from a needle electrode in transformer oil. IEEE Trans. Plasma Sci. 2012, 40, 909–918. [Google Scholar] [CrossRef]
- Available online: https://pdfs.semanticscholar.org/512f/4e9992c567e45ee96258dd54b3a6b6a3447a.pdf (accessed on 28 November 2019).
- Sugumaran, P. Experimental Evaluation on Dielectric and Thermal Characteristics of Nano Filler Added Transformer Oil. In Proceedings of the 2012 International Conference on High Voltage Engineering and Application, Shanghai, China, 17–20 September 2012; pp. 207–210. [Google Scholar]
- Rafiq, M.; Li, C.; Lv, Y.; Yi, K.; Arif, I. Breakdown Characteristics of Transformer Oil Based Silica Nanofluids. In Proceedings of the 2016 19th International Multi-Topic Conference (INMIC), Islamabad, Pakistan, 5–6 December 2016; pp. 1–4. [Google Scholar]
- Lee, J.; Seo, H.; Kim, Y. The increased dielectric breakdown voltage of transformer oil-based nano fl uids by an external magnetic field. Int. J. Therm. Sci. 2012, 62, 29–33. [Google Scholar] [CrossRef]
- Primo, V.A.; García, B.; Burgos, J.C.; Pérez-Rosa, D. AC Breakdown voltage of Fe3O4 based nanodielectric fluids. Part 1: Analysis of dry fluids. IEEE Trans. Dielectr. Electr. Insul. 2019, in press. [Google Scholar]
- Primo, V.A.; García, B.; Burgos, J.C.; Pérez-Rosa, D. AC Breakdown voltage of Fe3O4 based nanodielectric fluid. Part 2: Analysis of fluids with high moisture contents. IEEE Trans. Dielectr. Electr. Insul. 2019, in press. [Google Scholar]
- Primo, V.A.; Pérez-Rosa, D.; García, B.; Cabanelas, J.C. Evaluation of the Stability of Dielectric Nanofluids for Use in Transformers under Real Operating Conditions. Nanomaterials 2019, 9, 143. [Google Scholar] [CrossRef]
- Orosz, T. Evolution and modern approaches of the power transformer cost optimization methods. Period. Polytech. Electr. Eng. Comput. Sci. 2019, 63, 37–50. [Google Scholar] [CrossRef]
- Dahinden, V.; Schultz, K.; Küchler, A. The function of solid insulation in transformers. Transform 1998, 98. [Google Scholar]
- Miller, R.G. Beyond ANOVA: Basics of Applied Statistics; Harold Chapman: San Francisco, CA, USA, 1997. [Google Scholar]
- McClave, S. Statistics, 11th ed.; University of South Florida: Tampa, FL, USA, 2009. [Google Scholar]
- Muangpratoom, P.; Pattanadech, N.; Kunakorn, A.; Vittayakorn, W. Impulse Breakdown Characteristic of Mineral Oil Based Nanofluid. In Proceedings of the 19th IEEE International Conference on Dielectric Liquids (ICDL), Manchester, UK, 25–29 June 2017; pp. 29–32. [Google Scholar]
- Mansour, D.E.A.; Atiya, E.G.; Khattab, R.M.; Azmy, A.M. Effect of Titania Nanoparticles on the Dielectric Properties of Transformer Oil-Based Nanofluids. In Proceedings of the Annual Report Conference on Electrical Insulation and Dielectric Phenomena, Montreal, QC, Canada, 14–17 October 2012; pp. 295–298. [Google Scholar]
- Hwang, J.G.; O’Sullivan, F.; Zahn, M.; Hjortstam, O.; Pettersson, L.A.A.; Liu, R. Modeling of streamer propagation in transformer oil-based nanofluids. In Proceedings of the Annual Report Conference on Electrical Insulation and Dielectric Phenomena, Quebec, QC, Canada, 26–29 October 2008; pp. 361–366. [Google Scholar]
- O’Sullivan, F.M. A Model for the INITIATION and Propagation of Electrical Streamers in Transformer Oil and Transformer Oil Based Nanofluids. Ph.D. Thesis, Massachusetts Institute of Technology, Dept. of Electrical Engineering and Computer Science, Cambridge, UK, 2007; p. 309. [Google Scholar]
- Velasco, J.; Frascella, R.; Albarracín, R.; Burgos, J.C.; Dong, M.; Ren, M.; Yang, L. Comparison of Positive Streamers in Liquid Dielectrics with and without Nanoparticles Simulated with Finite-Element Software. Energies 2018, 11, 361. [Google Scholar]
- Lesaint, O.; Massala, G. Positive streamer propagation in large oil gaps: Experimental characterization of propagation modes. IEEE Trans. Dielectr. Electr. Insul. 1998, 5, 360–370. [Google Scholar] [CrossRef]
- Yin, N.W. Nano Dielectric Fluids. U.S. Patent 2013/0285781, 31 October 2013. [Google Scholar]
- Lv, Y.; Rafiq, M.; Li, C.; Shan, B. Study of Dielectric Breakdown Performance of Transformer Oil Based Magnetic Nanofluids. Energies 2017, 10, 1025. [Google Scholar]
- Aljure, M. Streamer inception from ultra-sharp needles in mineral oil based nanofluids. Energies 2018, 11, 2064. [Google Scholar] [CrossRef]
© 2019 by the authors. Licensee MDPI, Basel, Switzerland. This article is an open access article distributed under the terms and conditions of the Creative Commons Attribution (CC BY) license (http://creativecommons.org/licenses/by/4.0/).