3.1. Physicochemical Characterization of Sc-Doped Nanoparticles
A series of synthesized Sc-doped TiO
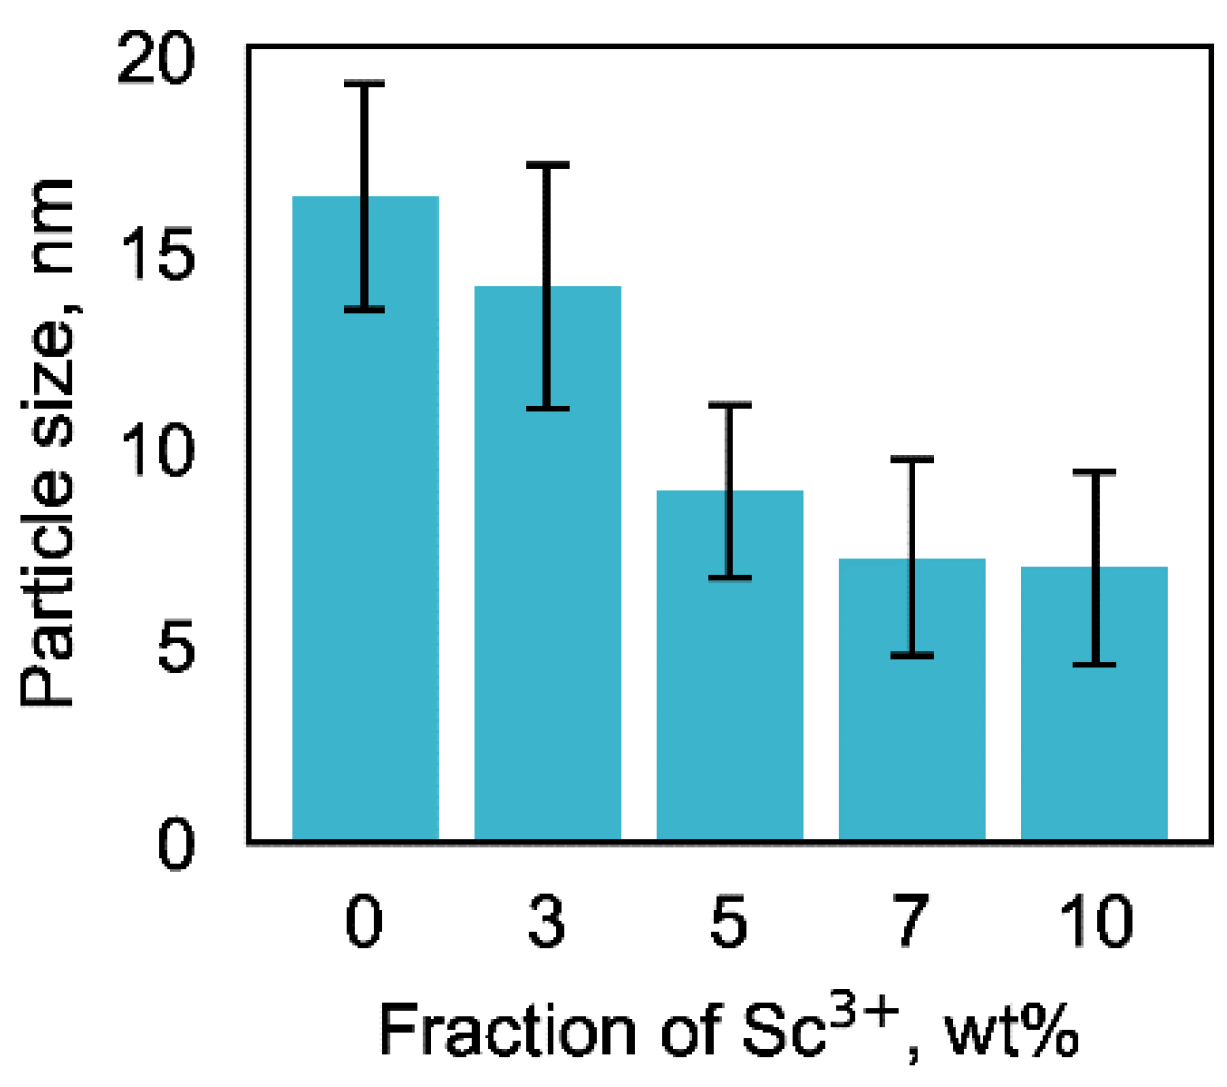
2 nanoparticles with Sc contents varying from 0 to 10 wt.% were synthesized and thoroughly characterized. The synthetic approach used here followed a procedure introduced previously for the sol–gel synthesis of anatase nanoparticles with the addition of a stoichiometric amount of scandium ions. The increase of the concentration of Sc
3+ ions was accompanied by a decrease of the average hydrodynamic particle diameter as measured by the dynamic light scattering (DLS) method (
Figure 1). EDX analysis was performed on small areas and more significant fields of the samples revealed a homogeneous Sc distribution across the nanoparticles in concentrations close to the intended ones (
Table 1).
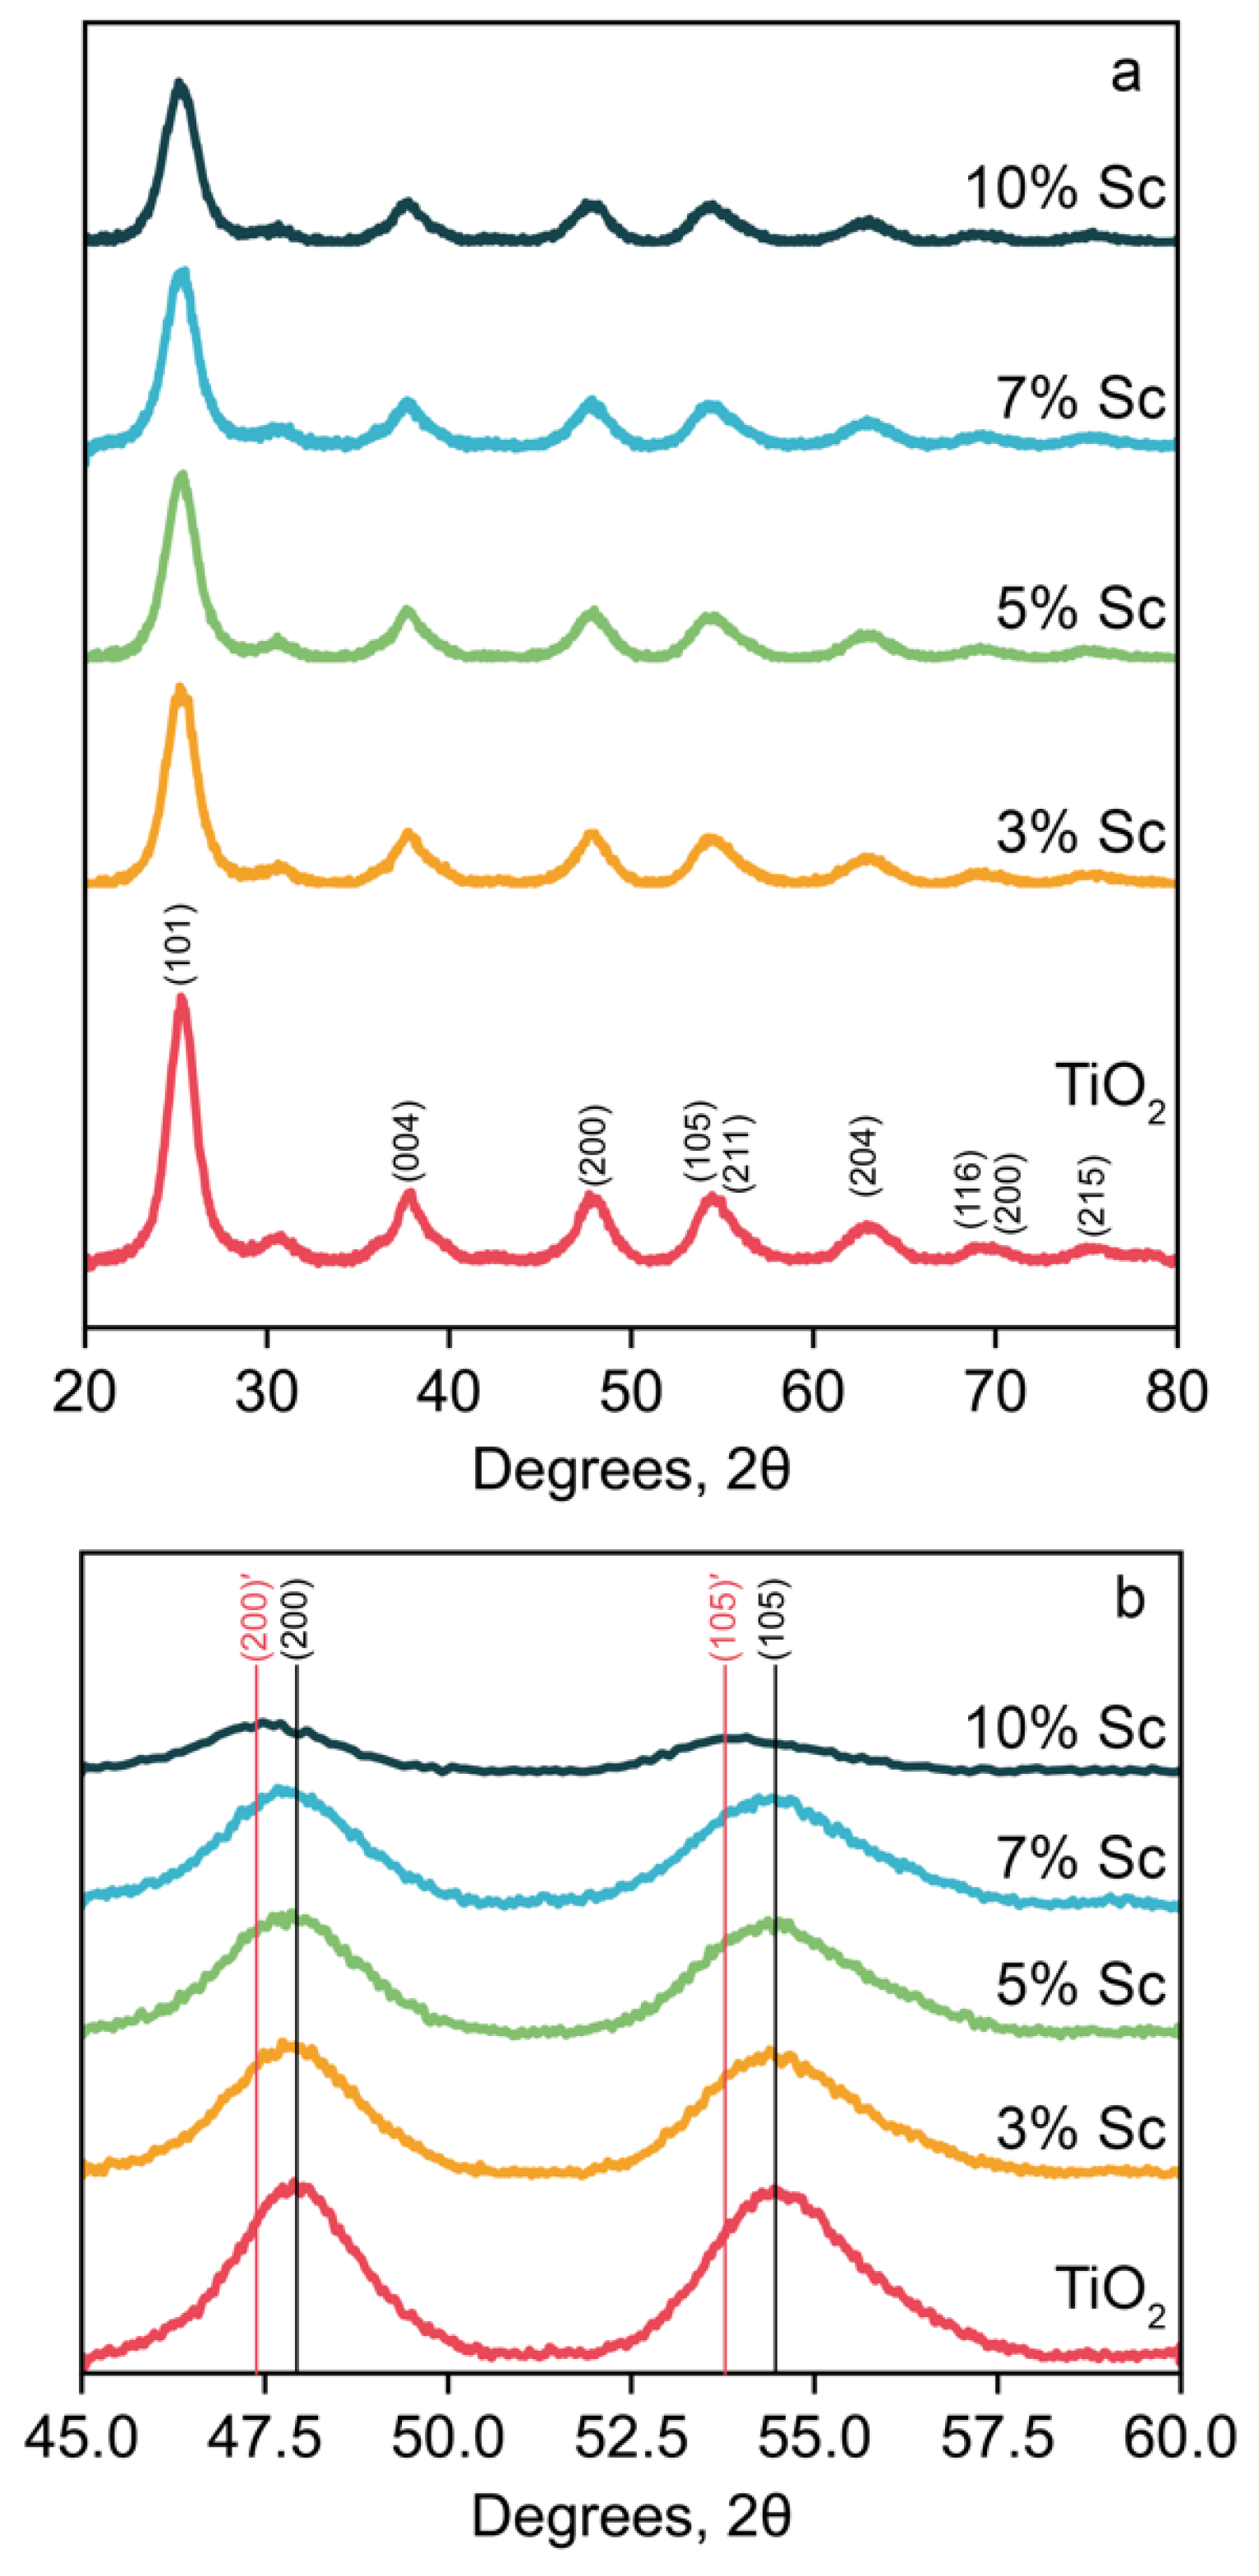
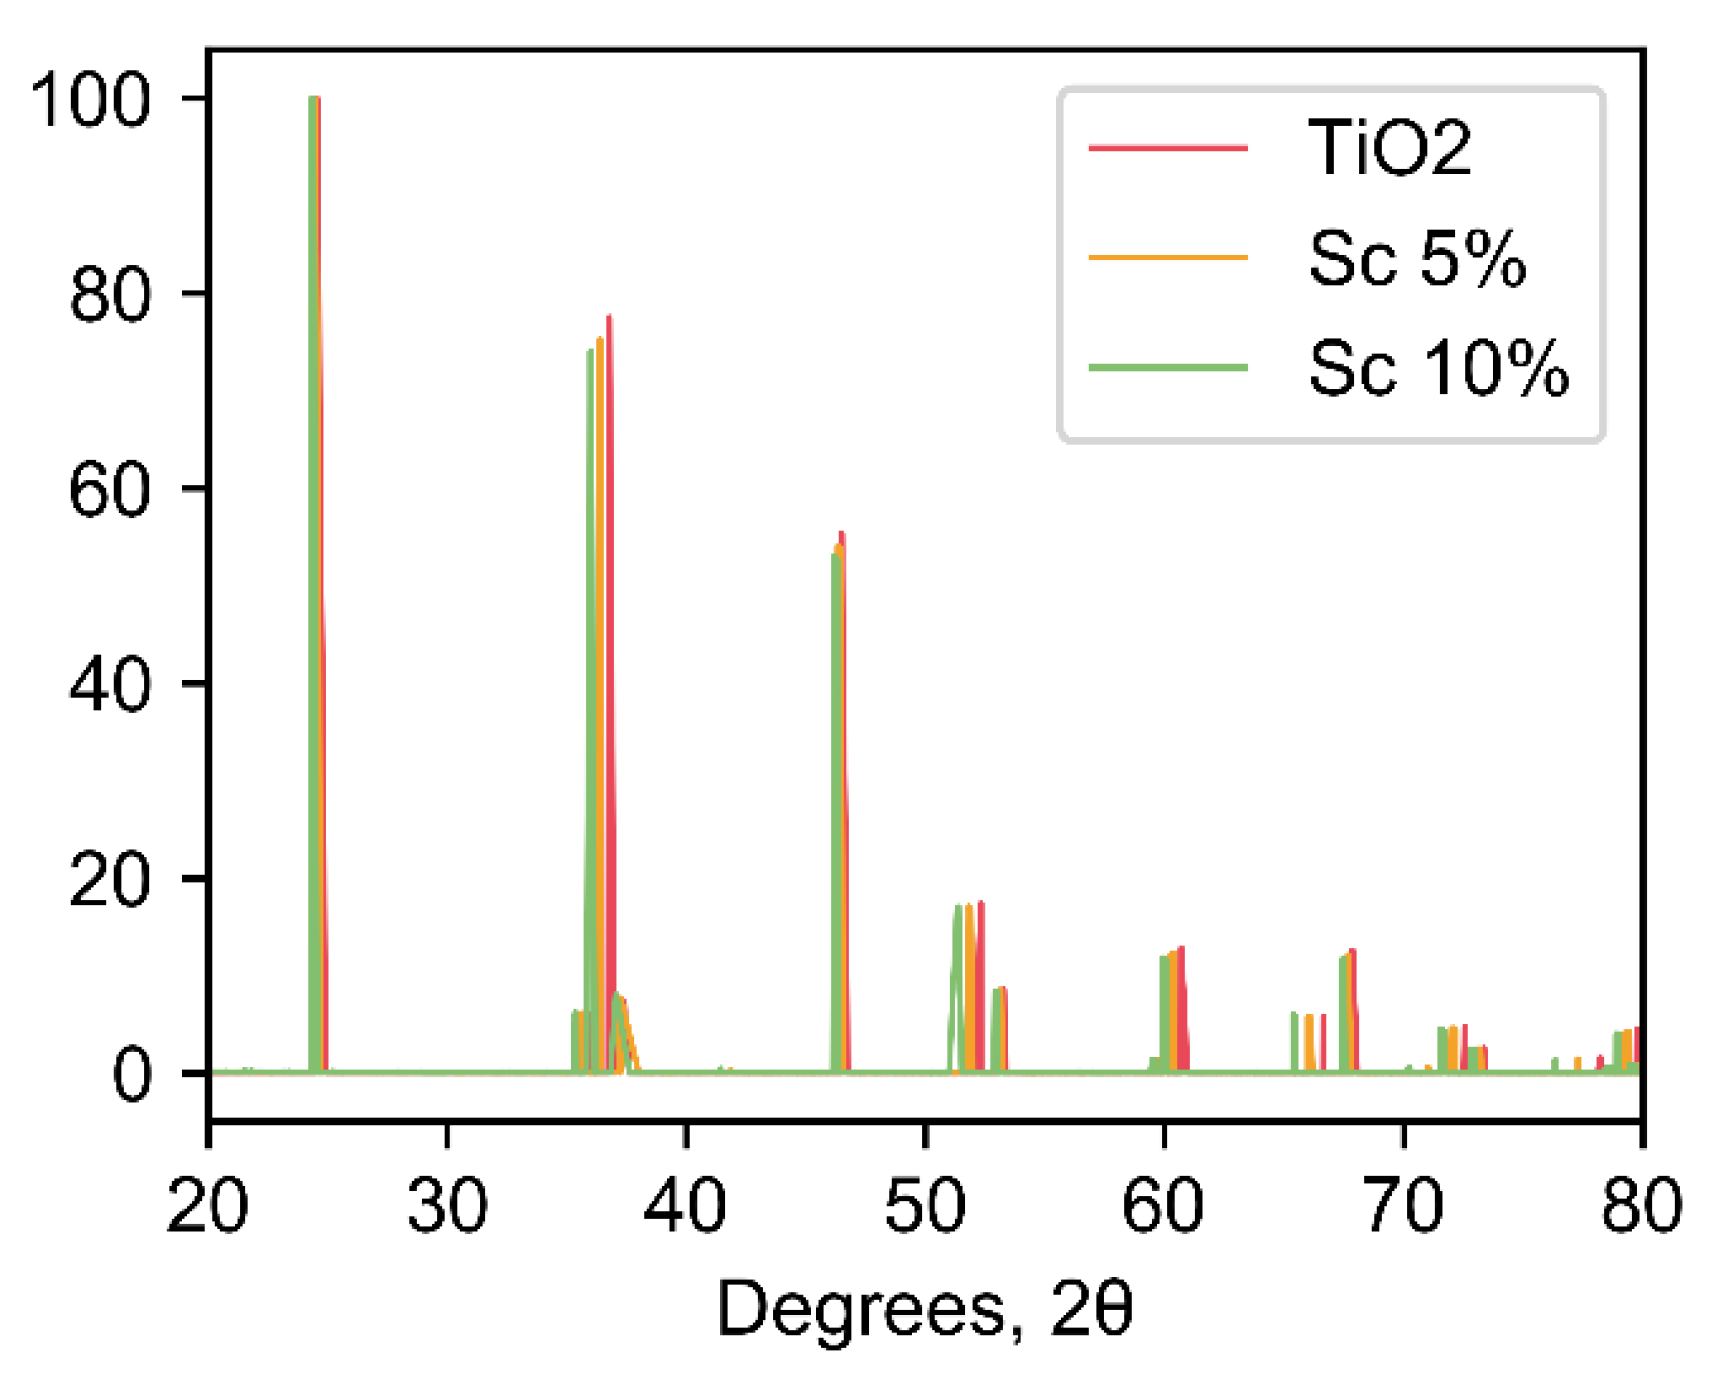
The phase composition and the crystallinity of the synthesized samples were examined by powder X-ray diffraction (XRD) analysis. The corresponding XRD patterns of the synthesized samples of pure and Sc-doped TiO
2 nanoparticles evidenced a pure anatase phase with a high crystallinity for all samples (
Figure 2). The diffractograms clearly showed the efficient embedding of the guest ions in the anatase structure because no additional peaks were detected in the doped materials. No evidence of phase separation was observed.
The incorporation of Sc into the TiO
2 lattice resulted in the shift of the (200) and (105) reflections by 0.6° and 0.75°, respectively (
Figure 2b). The increase of the Sc content in the samples from 0 to 10 wt.% resulted in uniform shifts of both reflections in the XRD patterns, evidencing a homogeneous incorporation of Sc into the TiO
2 lattice that was accompanied only smooth changes in the lattice parameters without substantial structural changes.
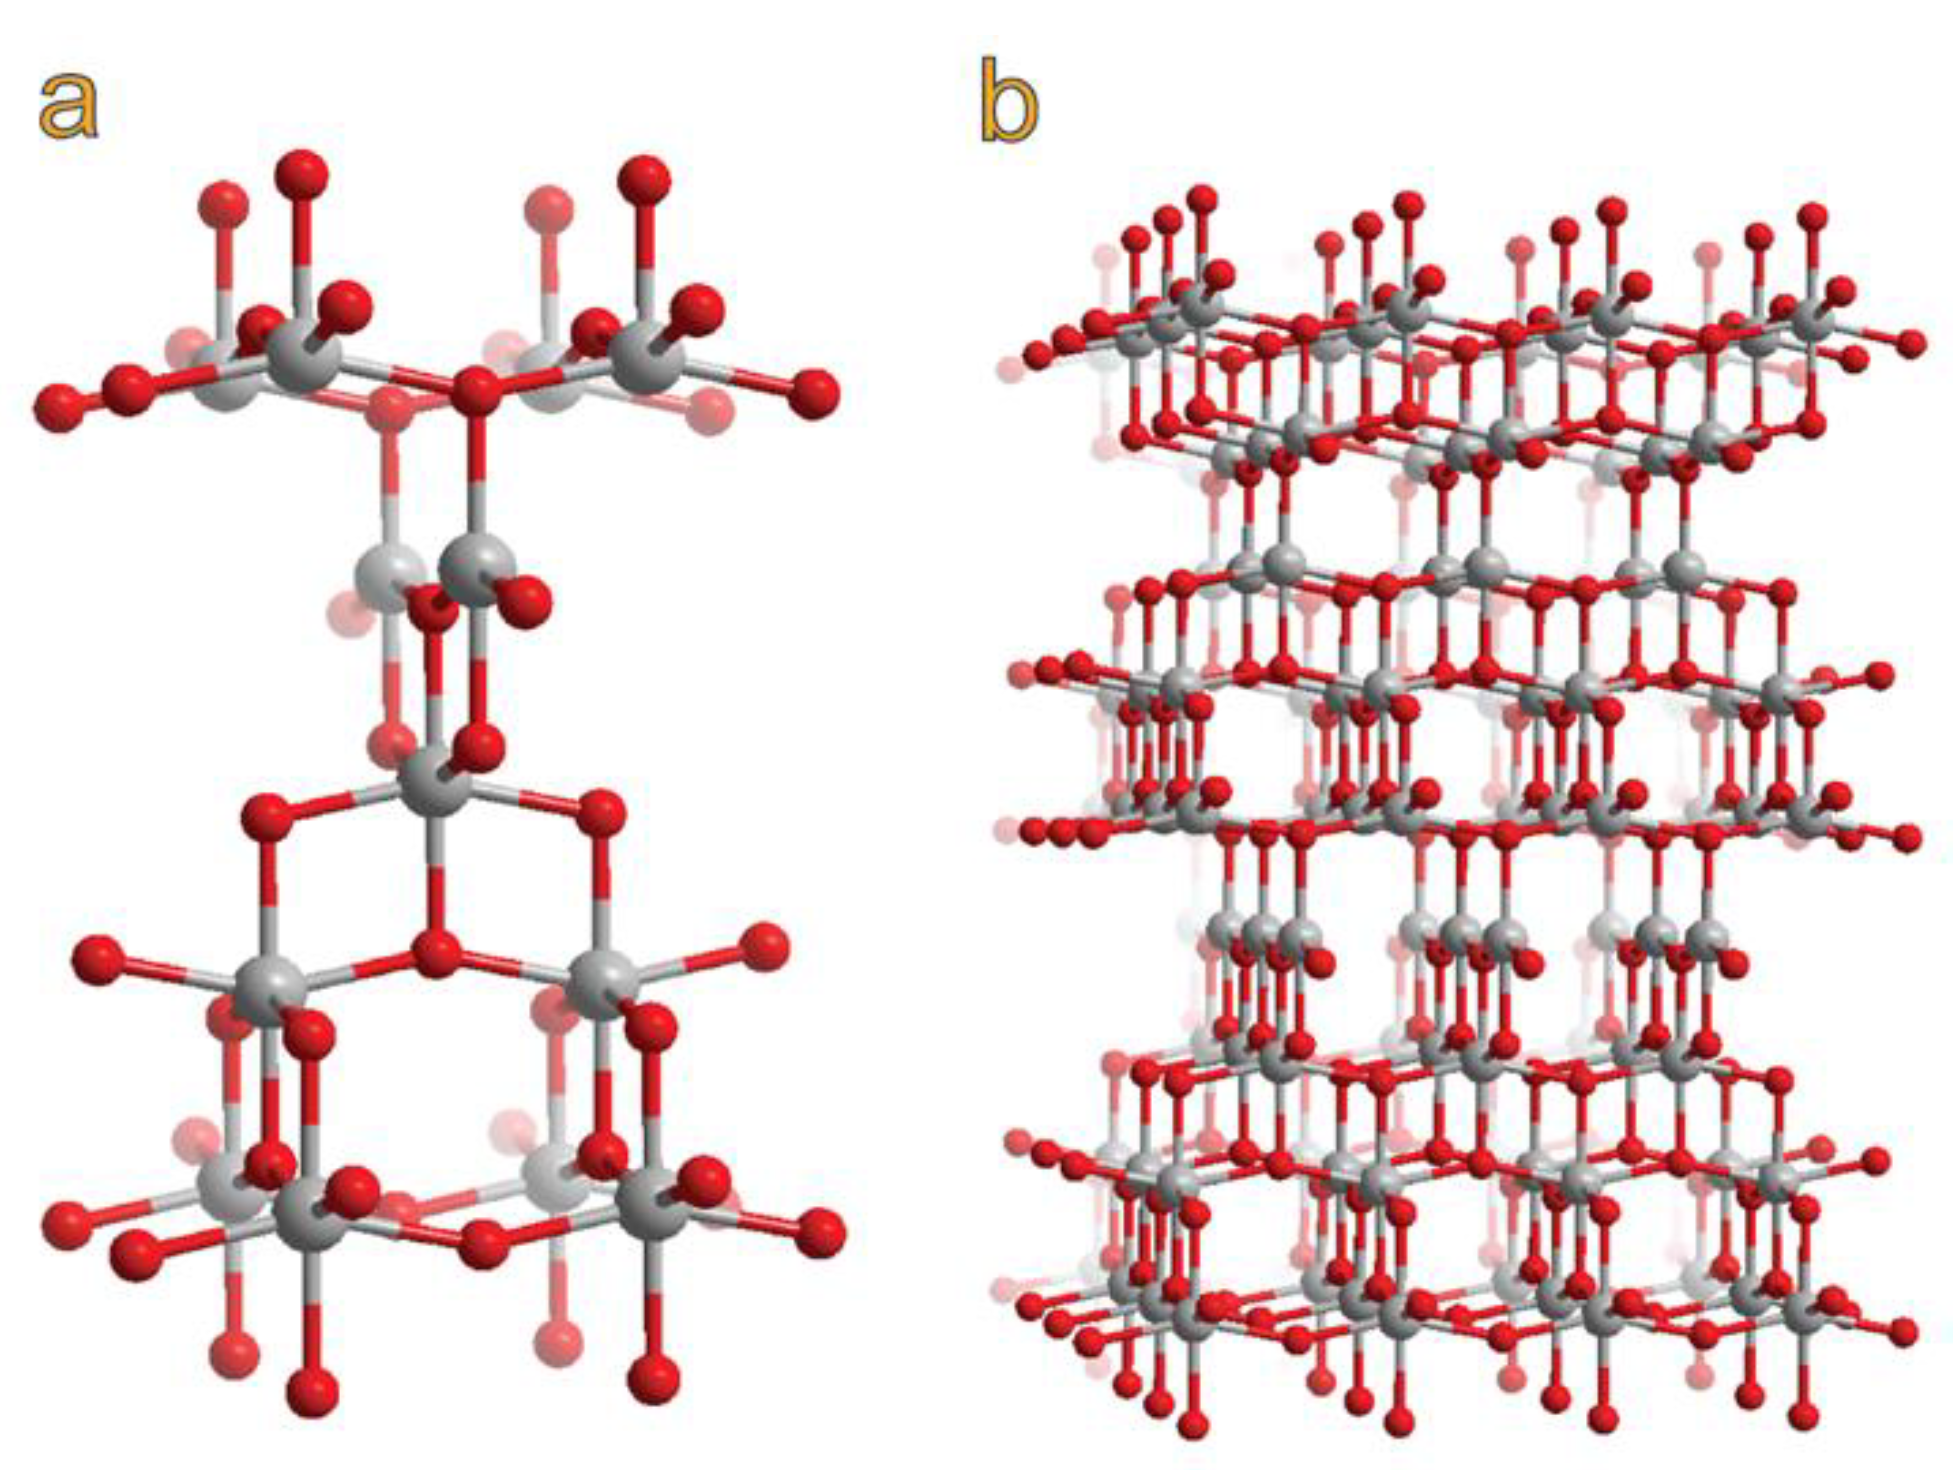
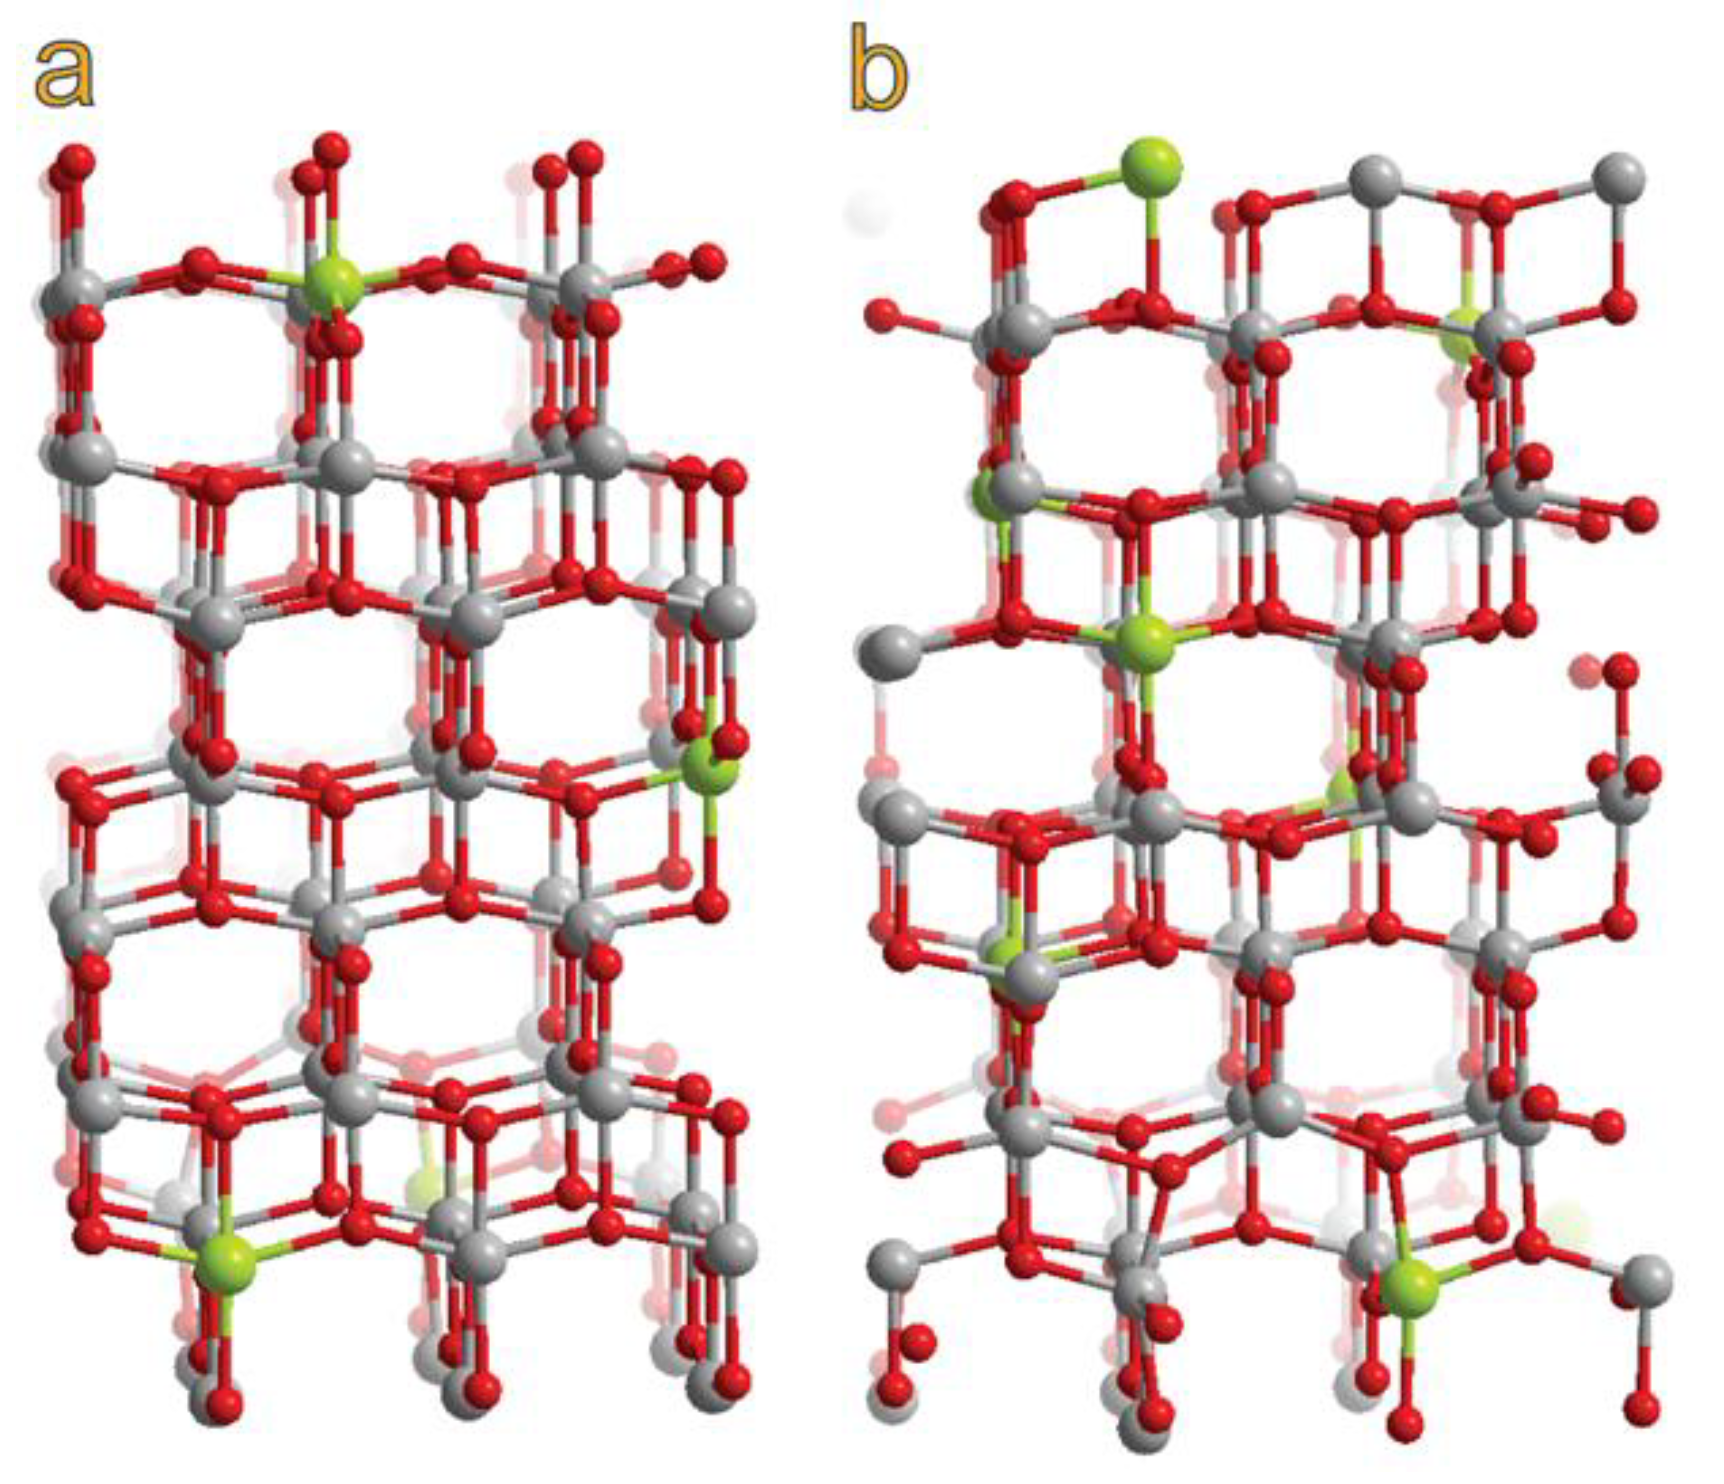
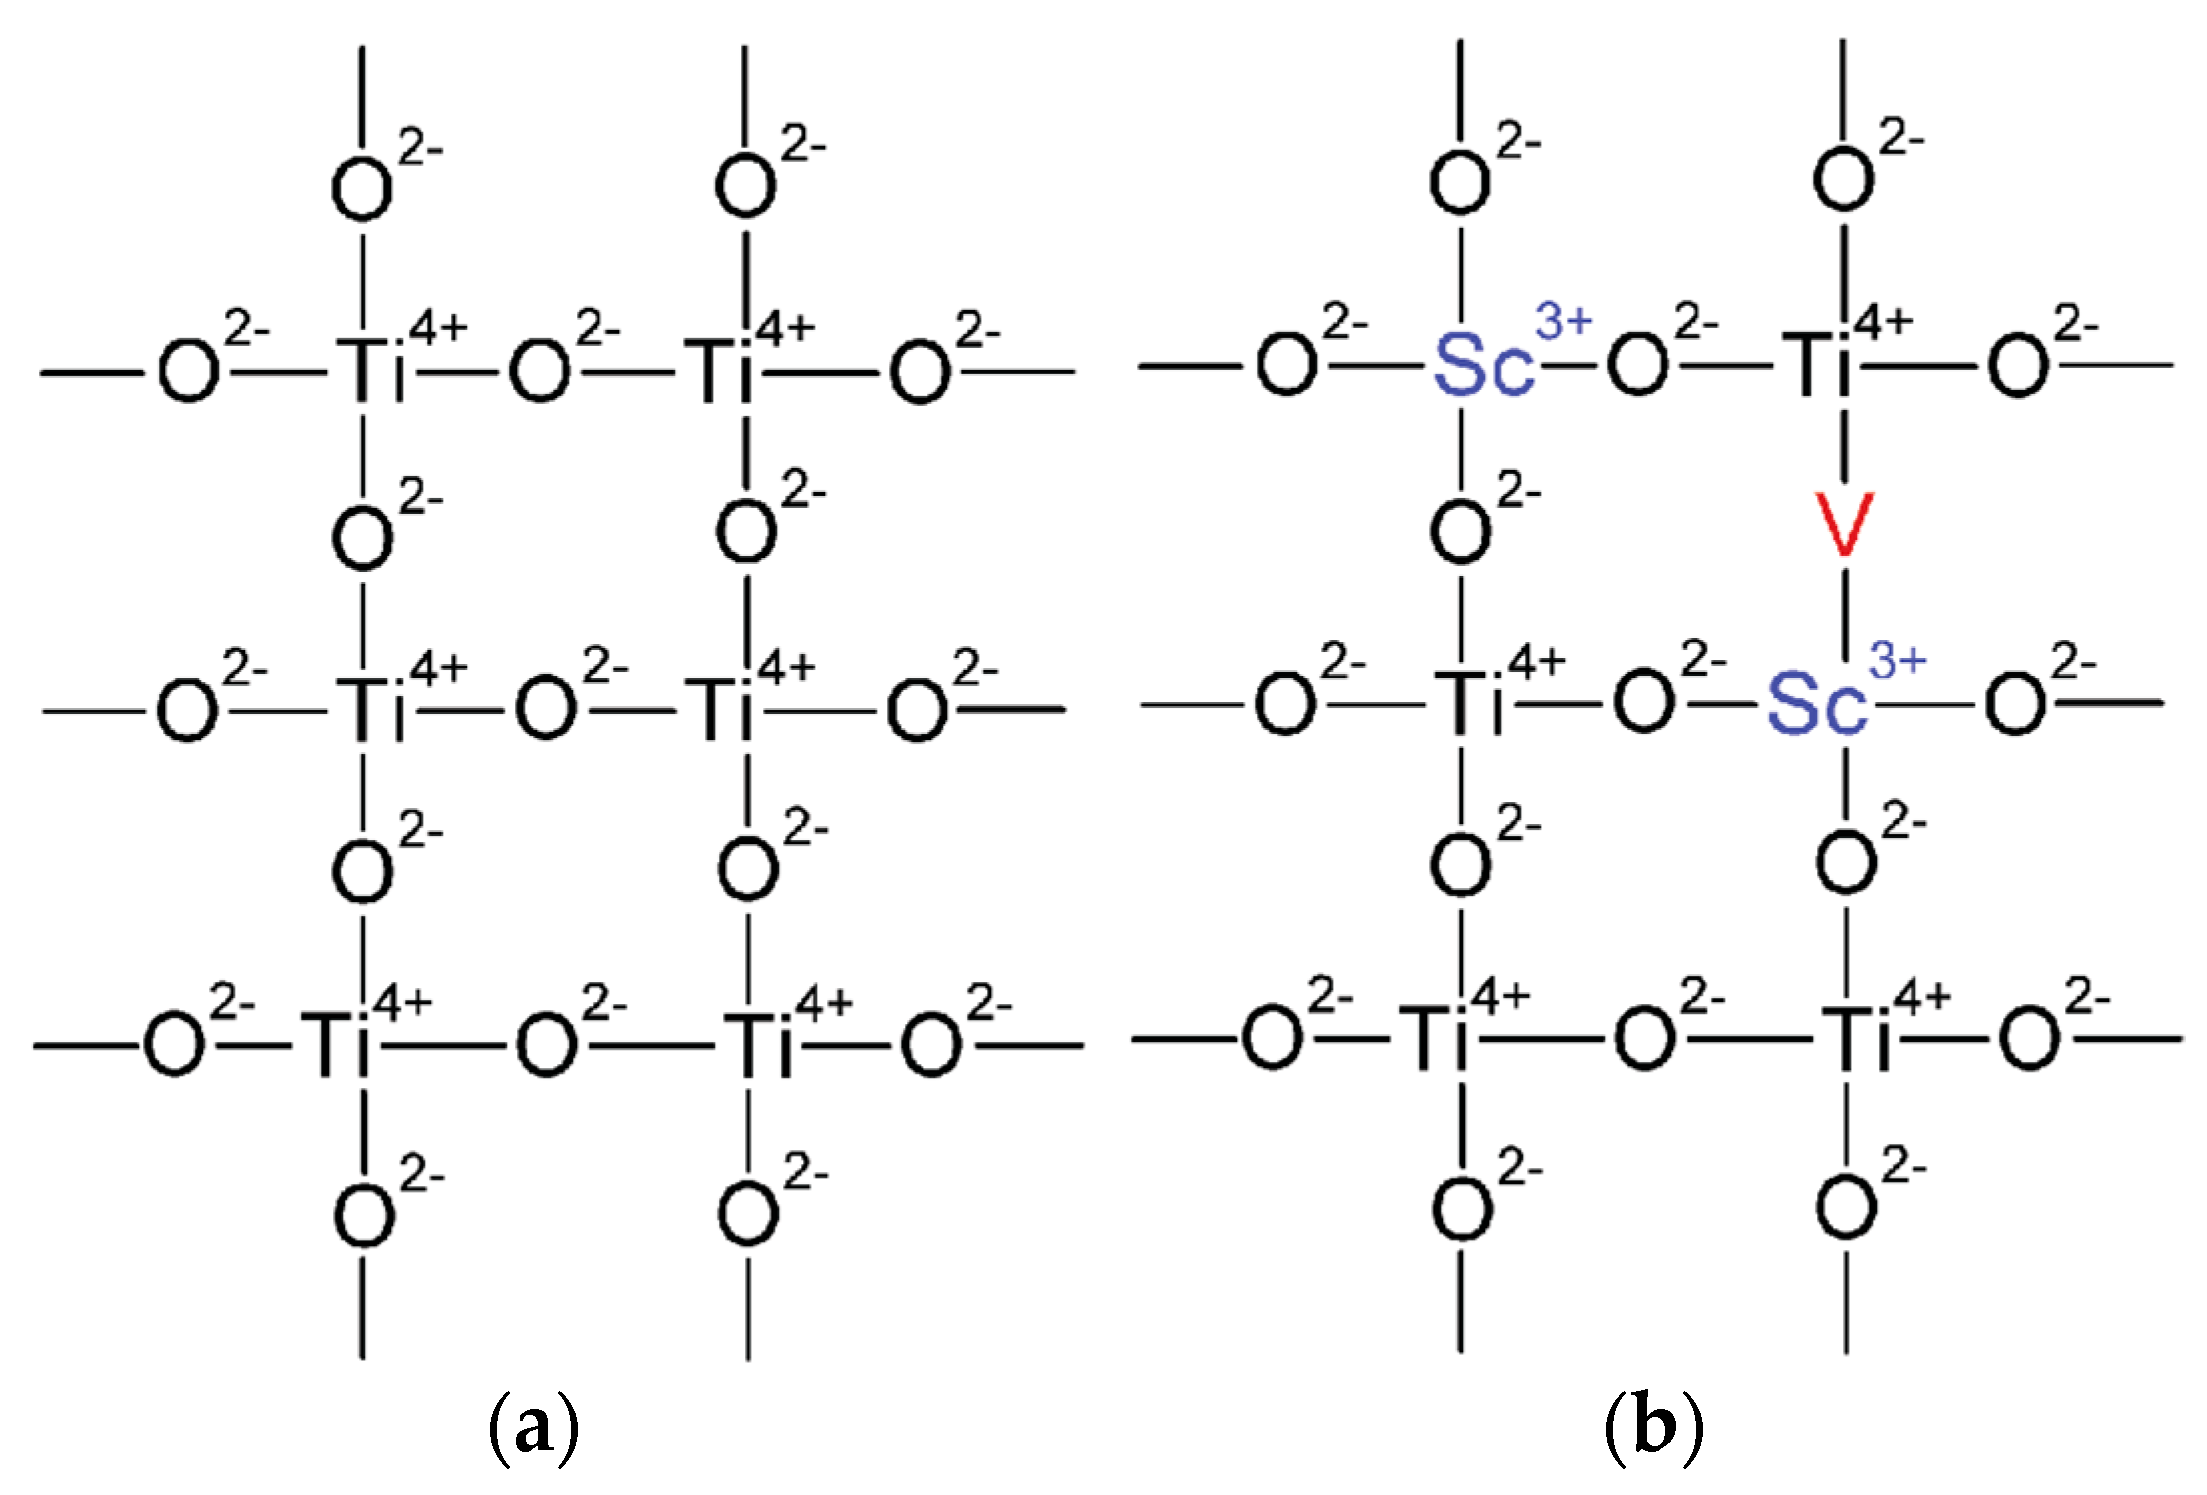
To further verify the proposed structural transformations in TiO
2 in the presence of Sc, we carried out periodic DFT calculations on model TiO
2 structures and their doped counterparts. Our calculations revealed that the substitution of part of Ti with Sc and the formation of oxygen defects led to a distortion of the crystal structure that represented the expansion of the supercell by up to 0.5% along the
a-axis and up to 2% along the
c-axis for the model with the highest Sc content (10 wt.%) (see
Table S6). The cell expansion was in line with the larger ionic radius of Sc (88.5 pm) compared to that of Ti (74.5 pm). In line with the experimental observations, these structural changes were reflected in minor but notable shifts of the main reflections in the simulated XRD patterns (see
Figure S3).
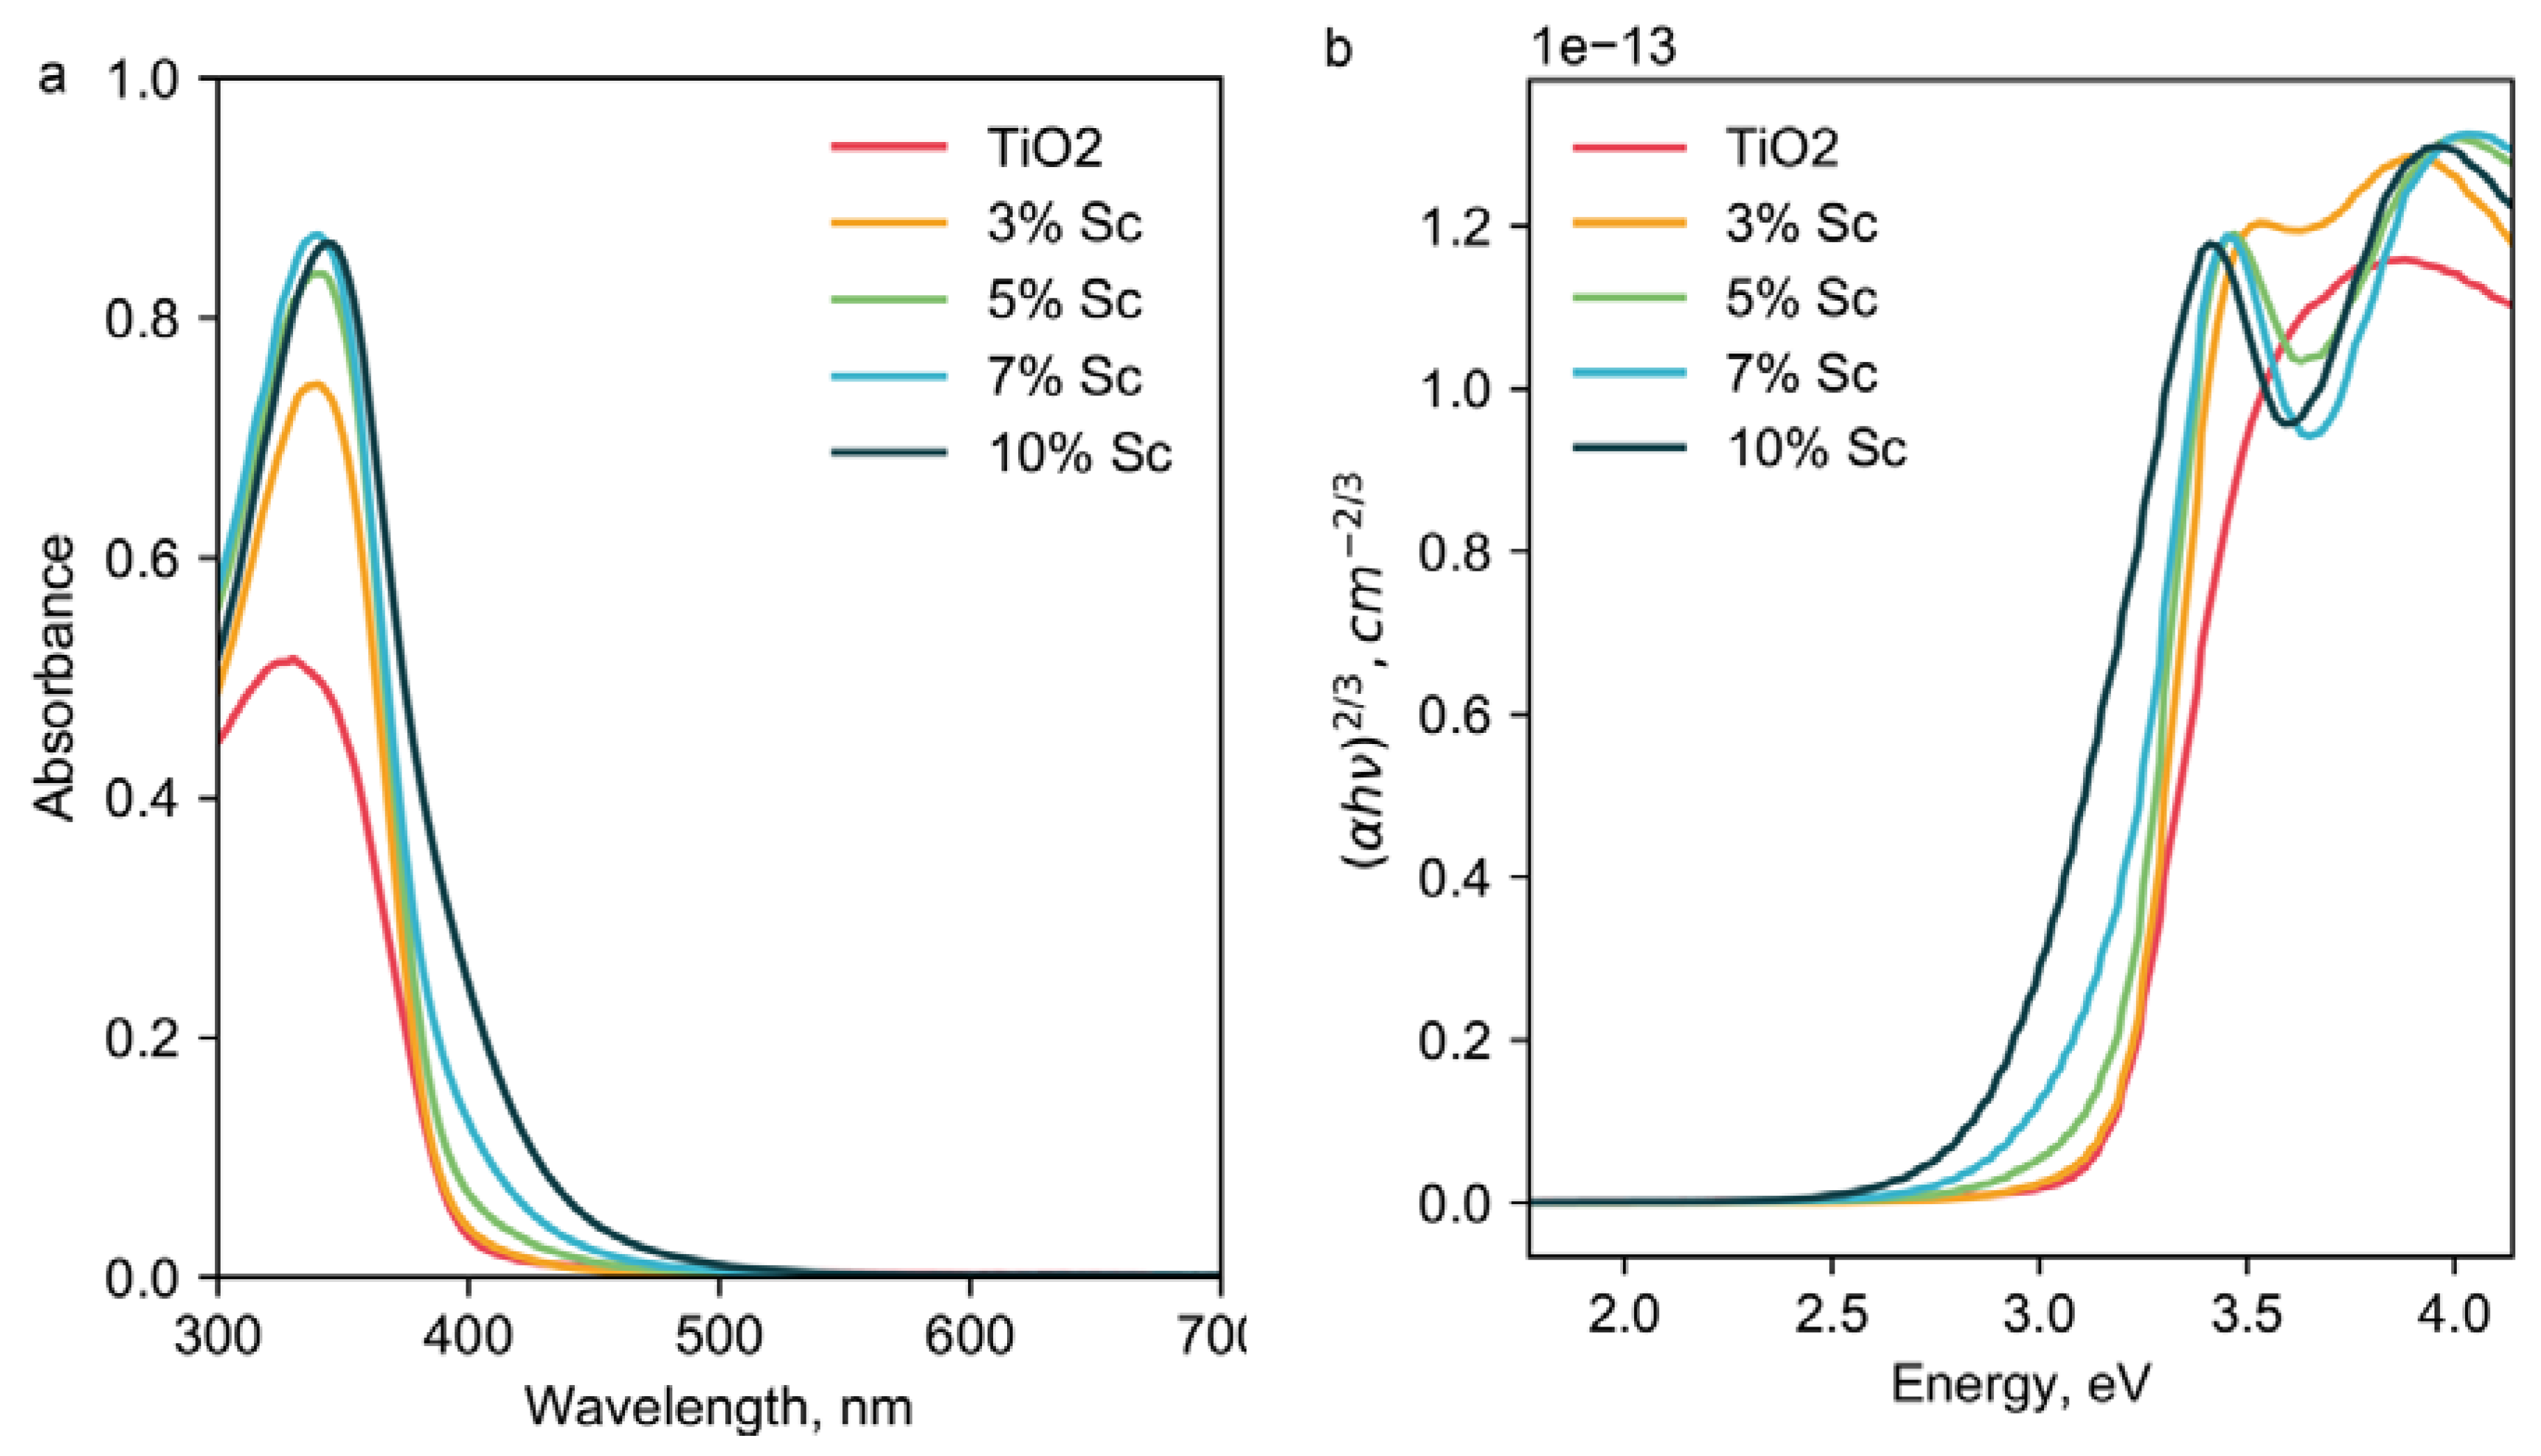
To estimate how the introduction of Sc influences the photoabsorption activity of TiO
2, experimental UV-vis measurements of pure and Sc-doped samples were conducted (
Figure 3). Besides the extension of the absorption edge to the visible range, the spectra in
Figure 3a evidenced a significant increase of the overall absorbance in the UV region. Moreover, the increasing A bandgap is an important characteristic of semiconductors and it can be estimated from Tauc plots based on the observed spectra (
Figure 3b). This approach employs a linear approximation of the energy of the probing radiation
hν as a function of the semiconductor absorption coefficient
α near the fundamental absorption edge [
36]. The
x-axis in the Tauc plots corresponds to
hν and the
y-axis gives the (α
hν)
1/n, where
n stands for the transition index [
37]. Because anatase is an indirect bandgap semiconductor, its transition index for the indirect forbidden transition was given as
n = 3. To calculate the absorption coefficient
α, we used the Kubelka–Munk equation:
The values of the forbidden optical bandgaps were derived from the Tauc plots by constructing tangent lines for each sample. The results presented in
Table 2 evidence the declining bandgap value with increasing Sc contents. As a result, the absorbance edge shifts into the visible part of the spectrum that agrees perfectly with our theoretical calculations.
In line with the results of the UV-vis spectroscopy measurements, periodic DFT+U (see
Appendix A) calculations also predicted a substantial change in the electronic structure of the doped anatase. The computed bandgap for pure anatase was 3.27 eV, which is in perfect agreement with the experimental value of 3.2 eV [
38]. The introduction of Sc into the lattice reduced the bandgap to the values of 2.99 eV and 2.85 eV for 5 wt.% and 10 wt.% Sc-TiO
2, respectively (
Table S5). These were translated to the shift of the absorbance maximum in the spectra from 379 nm for pure TiO
2 to 415 nm and 435 nm for 5 wt.% and 10 wt.%. Sc-TiO
2, respectively, rendering these materials appropriate targets for the experimental design of semiconductor materials with improved photochemical characteristics.
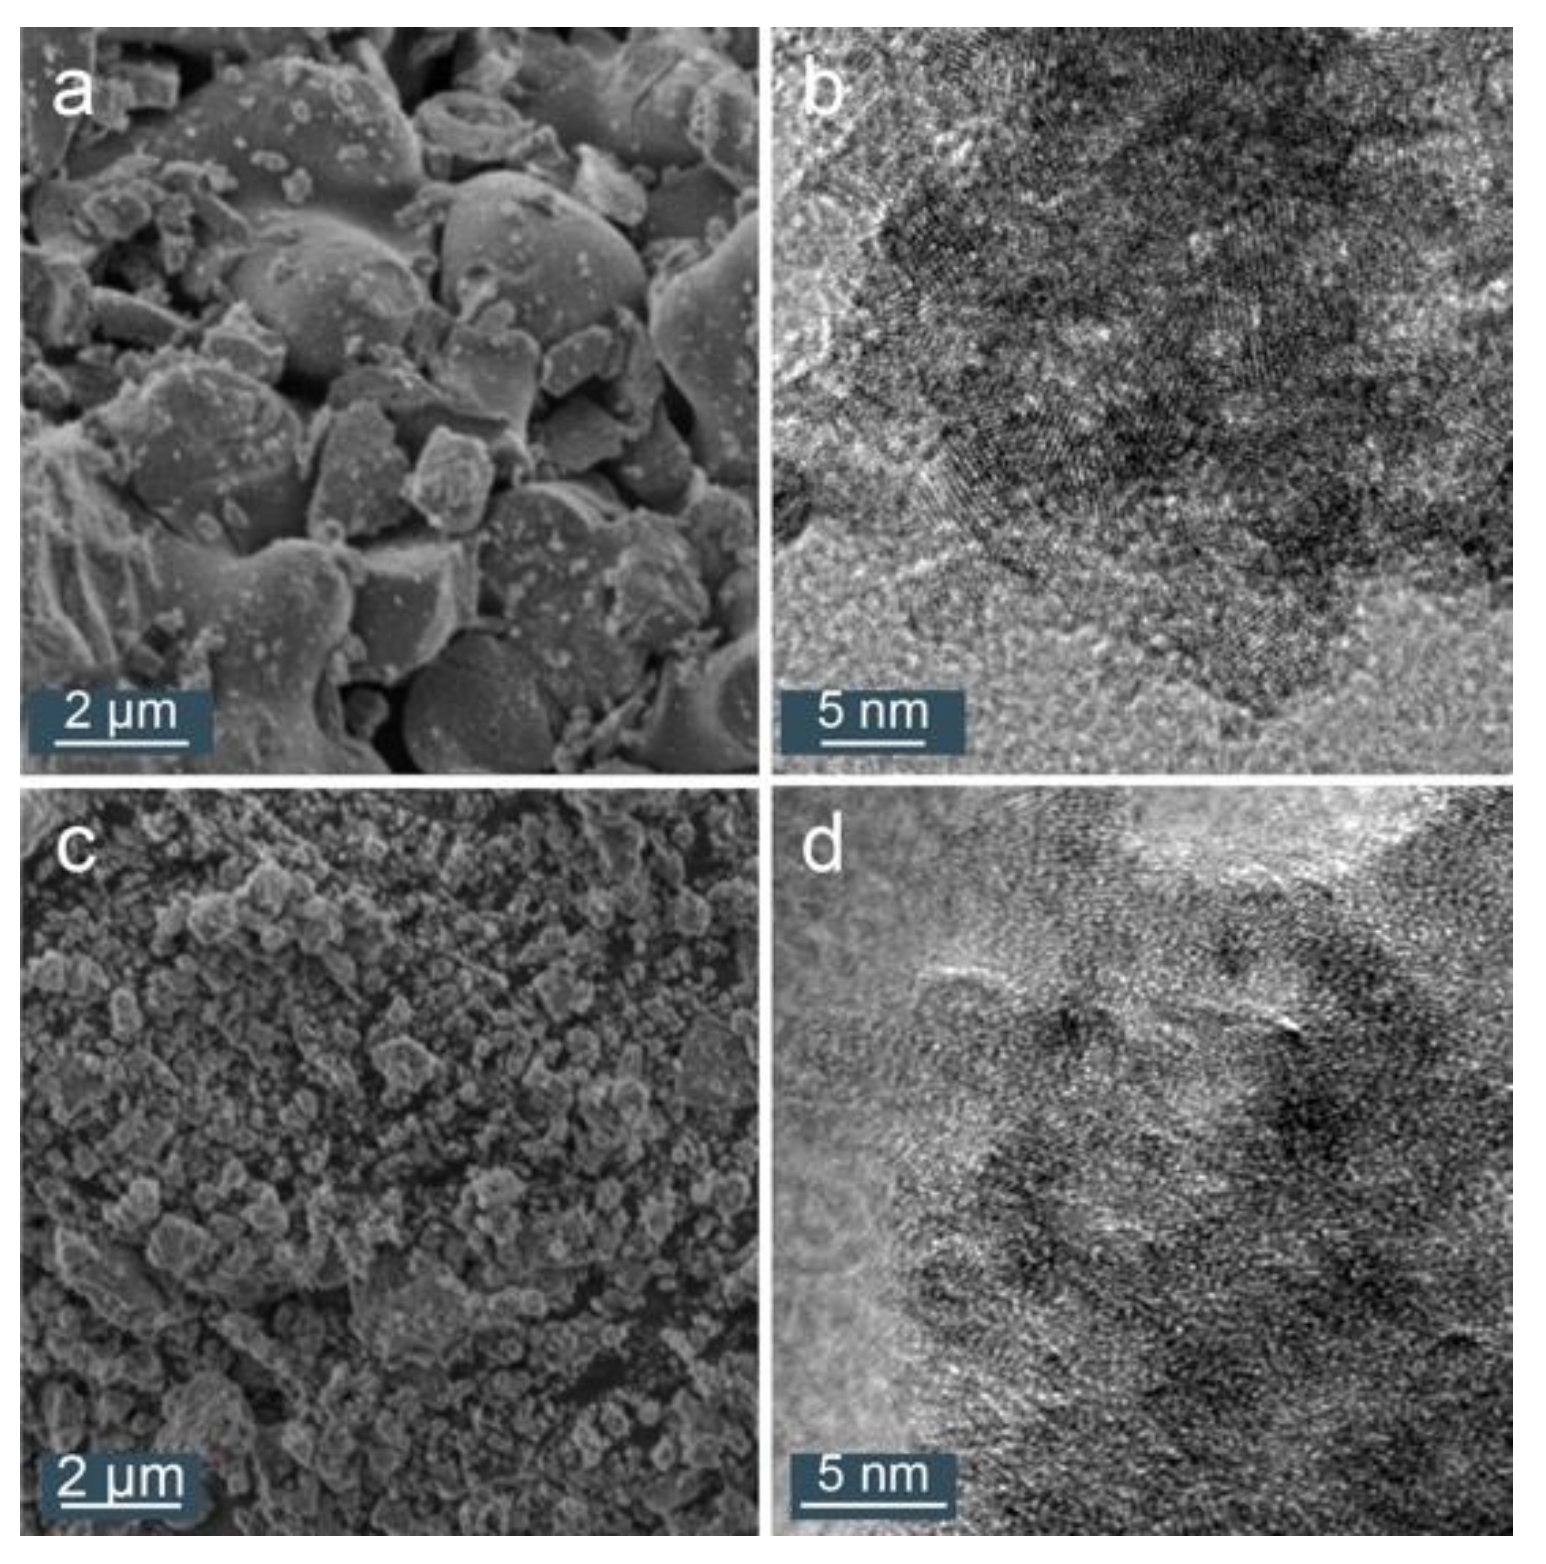
The results of the electron microscopy characterization of the pure and Sc-doped TiO
2 dried nanoparticles are shown in
Figure 4. The comparison of the SEM micrographs for the two materials (
Figure 4a,c) implied only a small influence of Sc doping on the morphology of the main crystallites, although pure TiO
2 nanoparticles tend to form larger aggregates upon drying. TEM micrographs (
Figure 4b,d) also indicated the formation of narrow pores with a diameter below 2 nm, which is in perfect agreement with the results of N
2 physisorption (see
Supplementary Information).
3.2. Inkjet Printing
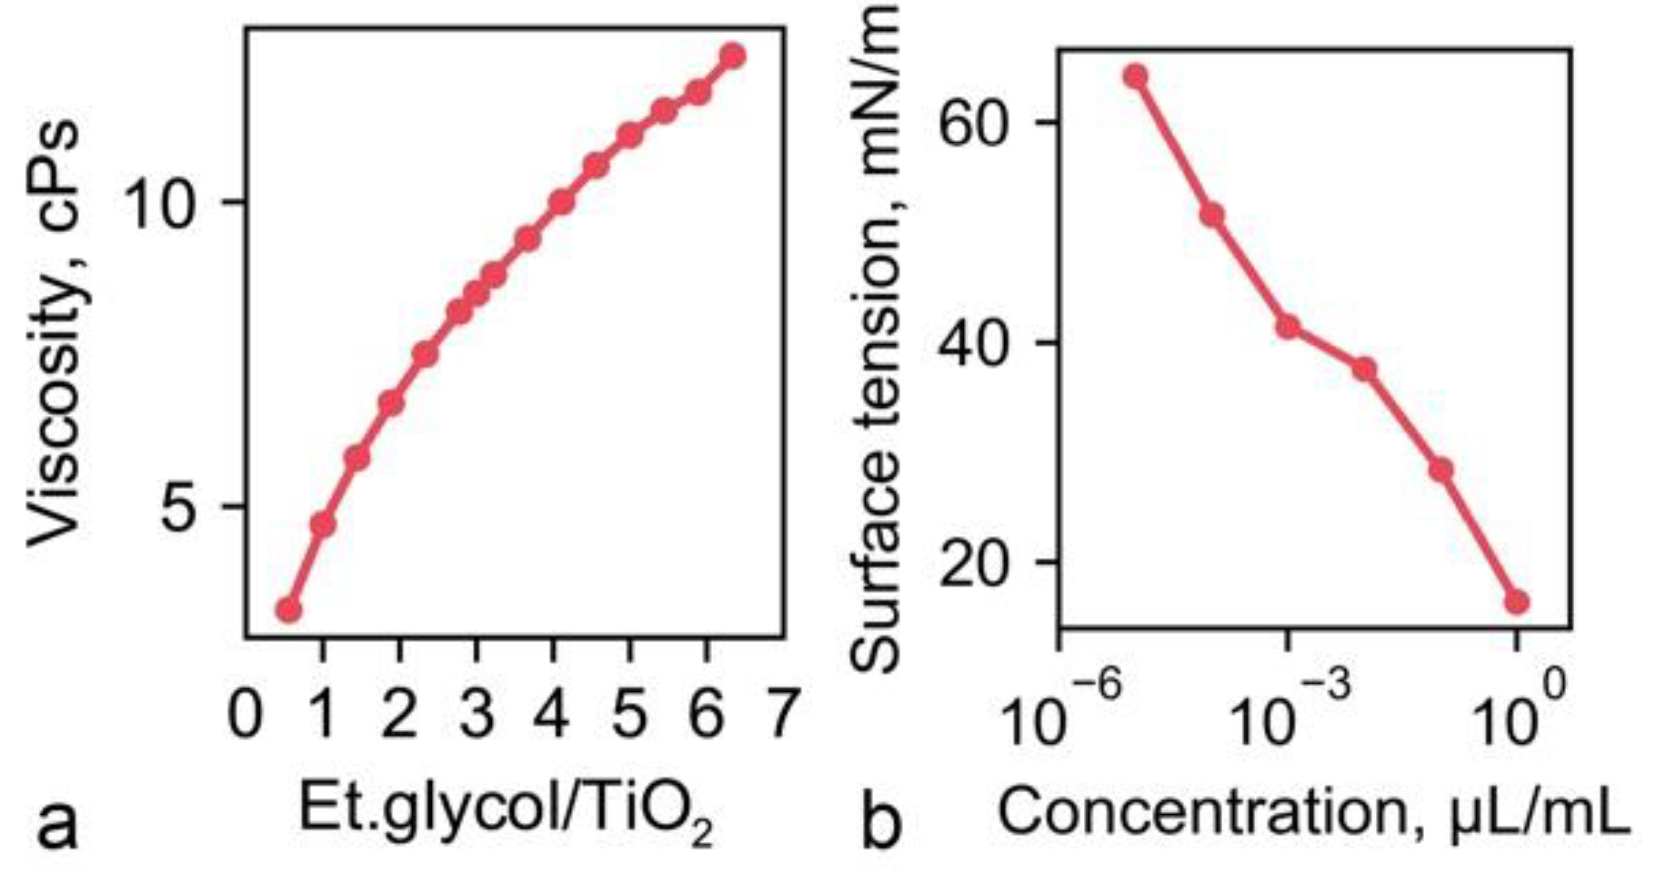
The preparation of inorganic inks for efficient inkjet printing involves—besides the actual synthesis of the stable colloid—the optimization of rheological parameters and filling inks into the cartridge. Because the as-synthesized titanium dioxide is well-dispersive in water and exhibits stable colloid formulation, our primary task was the optimization of the rheological parameters of the inks. The theory of inkjet printing is based on Ohnesorge equations containing the hydrodynamic dimensionless Reynolds and Weber numbers. The Ohnesorge number reflects the physical properties of printability and drop formation. The Reynolds number is a ratio between the inertial and viscous forces in the fluid, while the Weber number demonstrates a ratio between the drop momentum and its surface tension. The critical parameters having the most significant impact on ink printability are viscosity and surface tension.
The viscosity of the water-based sols was adjusted with ethylene glycol.
Figure 5a shows the change of the viscosity as a function of the ethylene glycol concentration. This additive was selected in view of its relatively high viscosity (18 cPs) and low vapor pressure as well as its perfect miscibility with water-based colloids that at the same time does not affect the dispersed nanoparticles. To reduce the surface tension of inks, we introduced the cationic surfactant Dynax DX4000 (Tokyo, Japan).
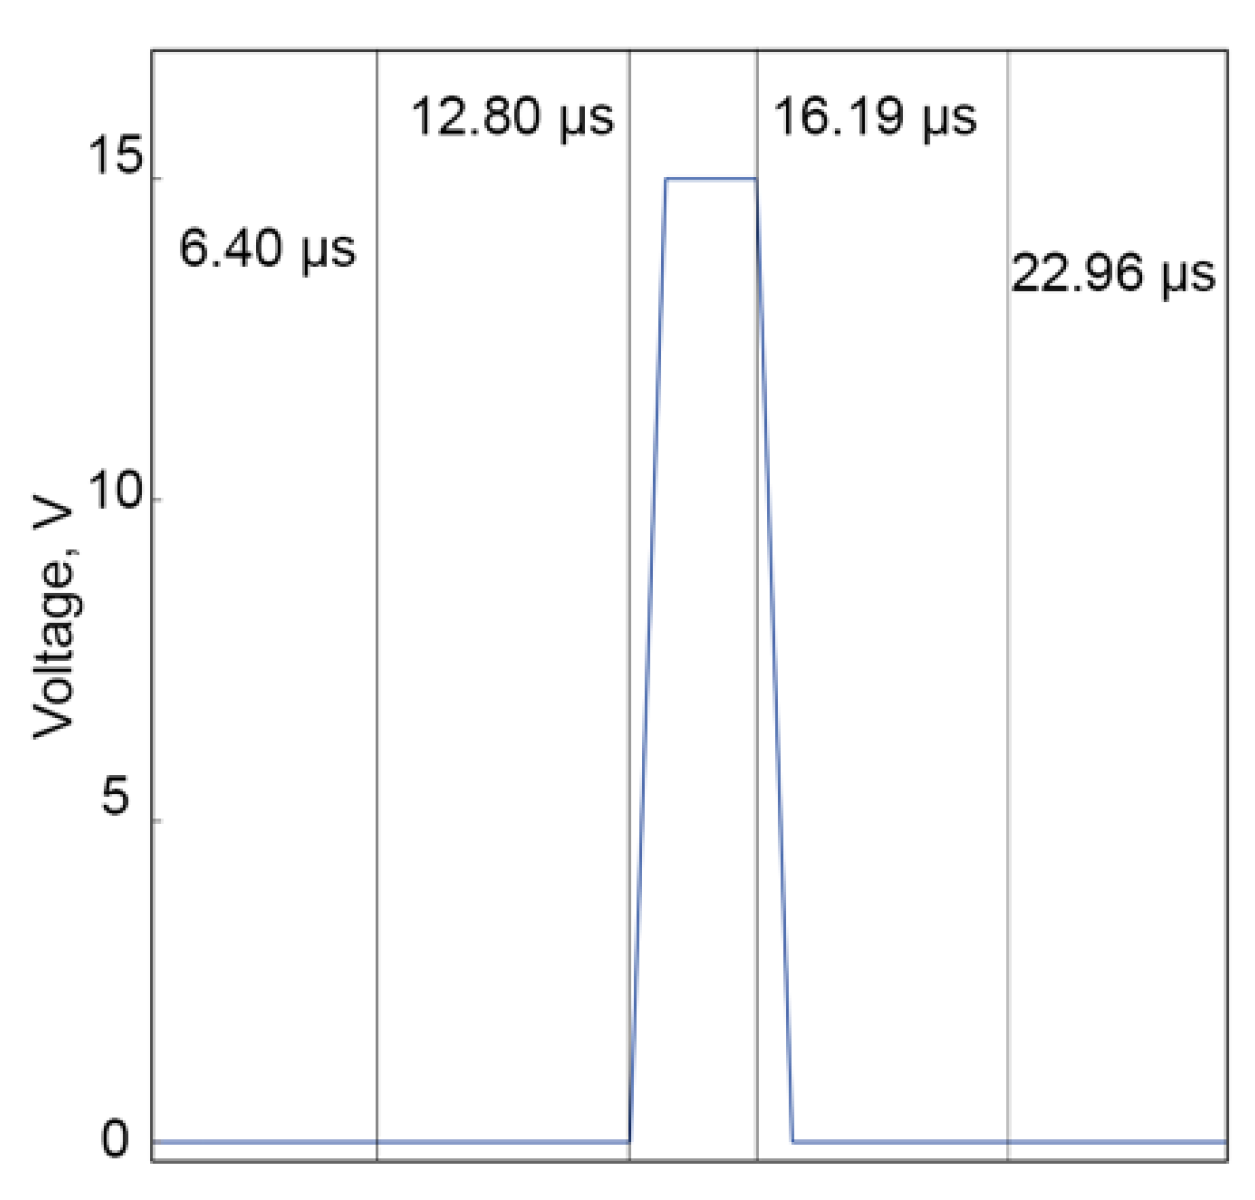
Figure 5b shows the evolution of the surface tension with the concentration of the surfactant. Considering the hydrodynamic calculations of composition adjustments, and as previously reported, it was found that the optimal amount of added surfactant was 20 μL per 1 mL of ethylene glycol and doped titania colloid with a ratio of 2:1, respectively. Because the doping of anatase has no effect on rheology, and its impact on particle size is negligible, the printing parameters and the waveform determined for TiO
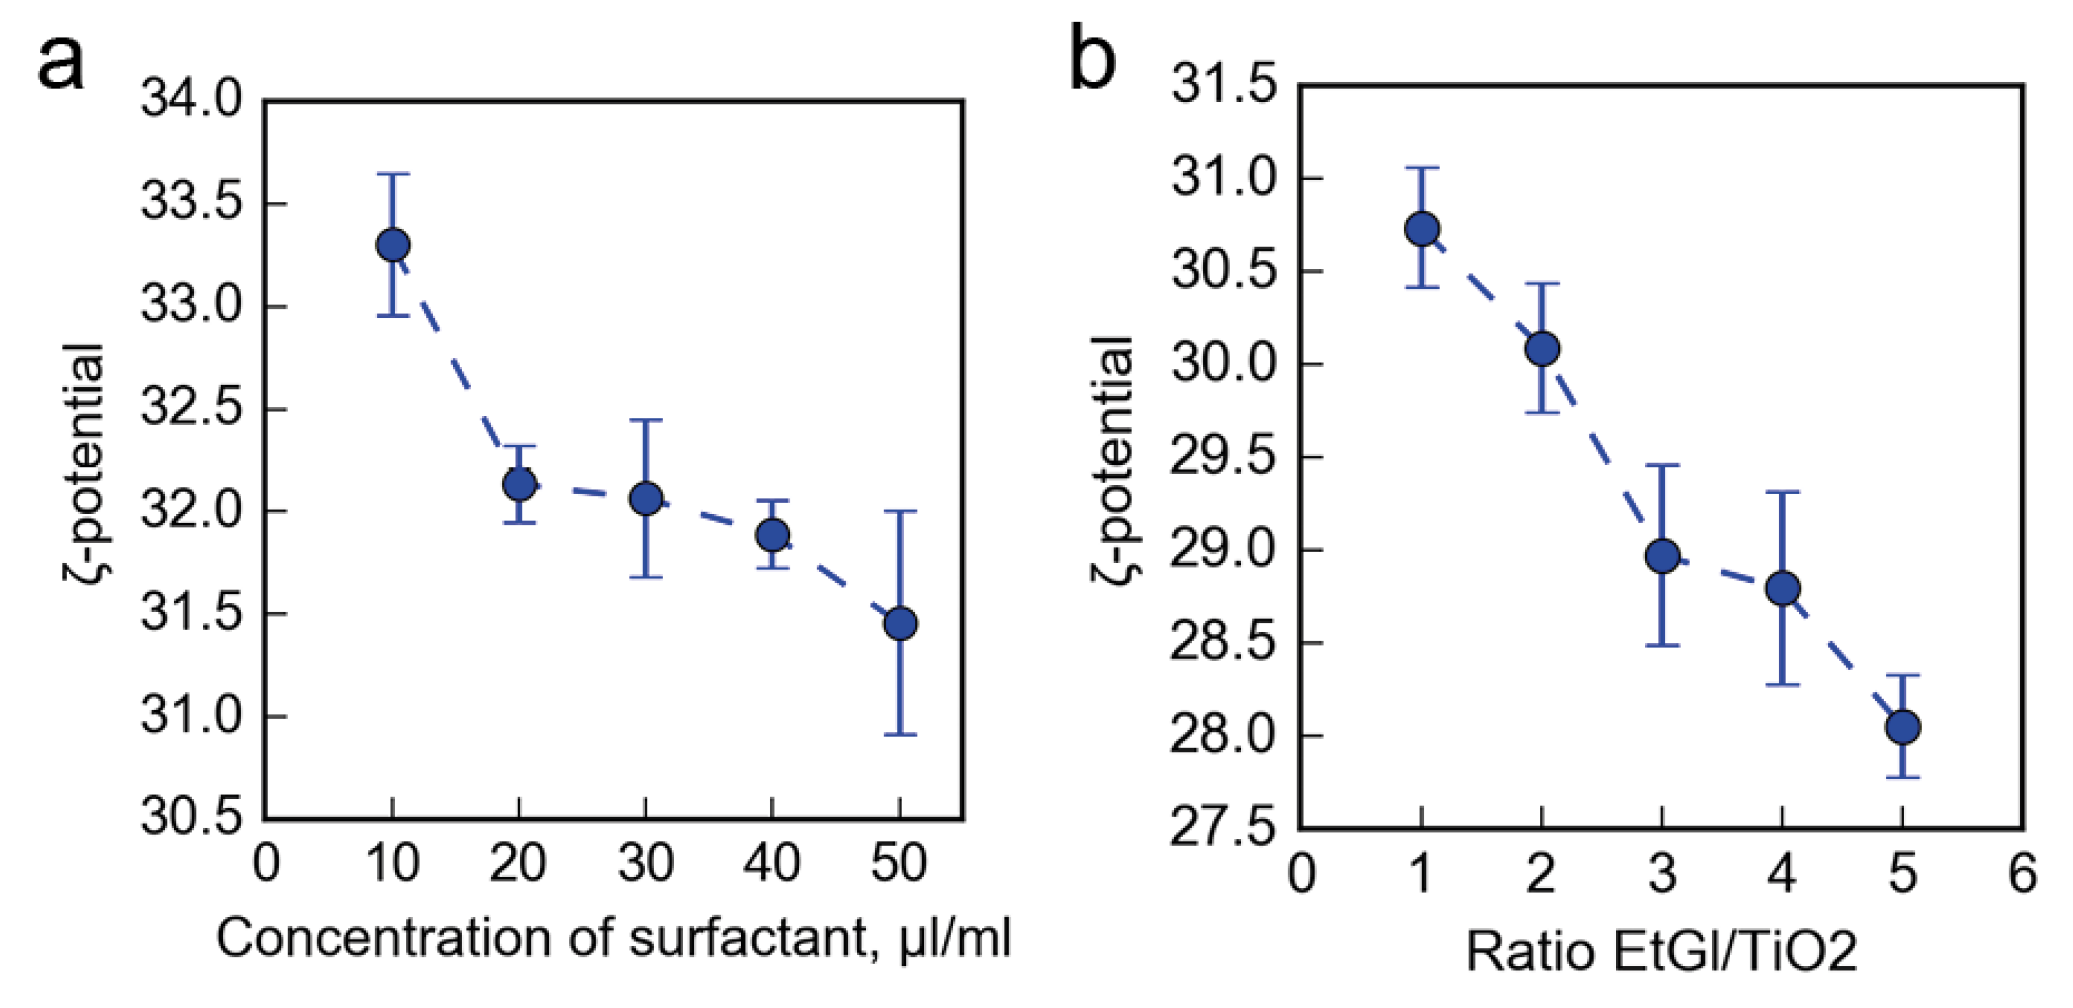
2 were used for the doped material as well. To study the ink stability and the impact of additives on the sedimentation, the zeta potential of inks was measured. The results (
Figure S10) showed a slight effect of the additives on the stability of the ink, with a zeta-potential higher than 30 mV in all cases. The inks were prepared for 10 wt.% Sc-TiO
2 and the final ink parameters are summarized in
Table 3.
In this work, a cartridge with a drop volume of 10 pL was used. Before filling the cartridge, the ink was filtered with a syringe filter featuring a 220-nm membrane followed by degassing for 30 min. These procedures were performed to avoid larger particles and air bubbles in the nozzle that could affect the printing accuracy and performance.
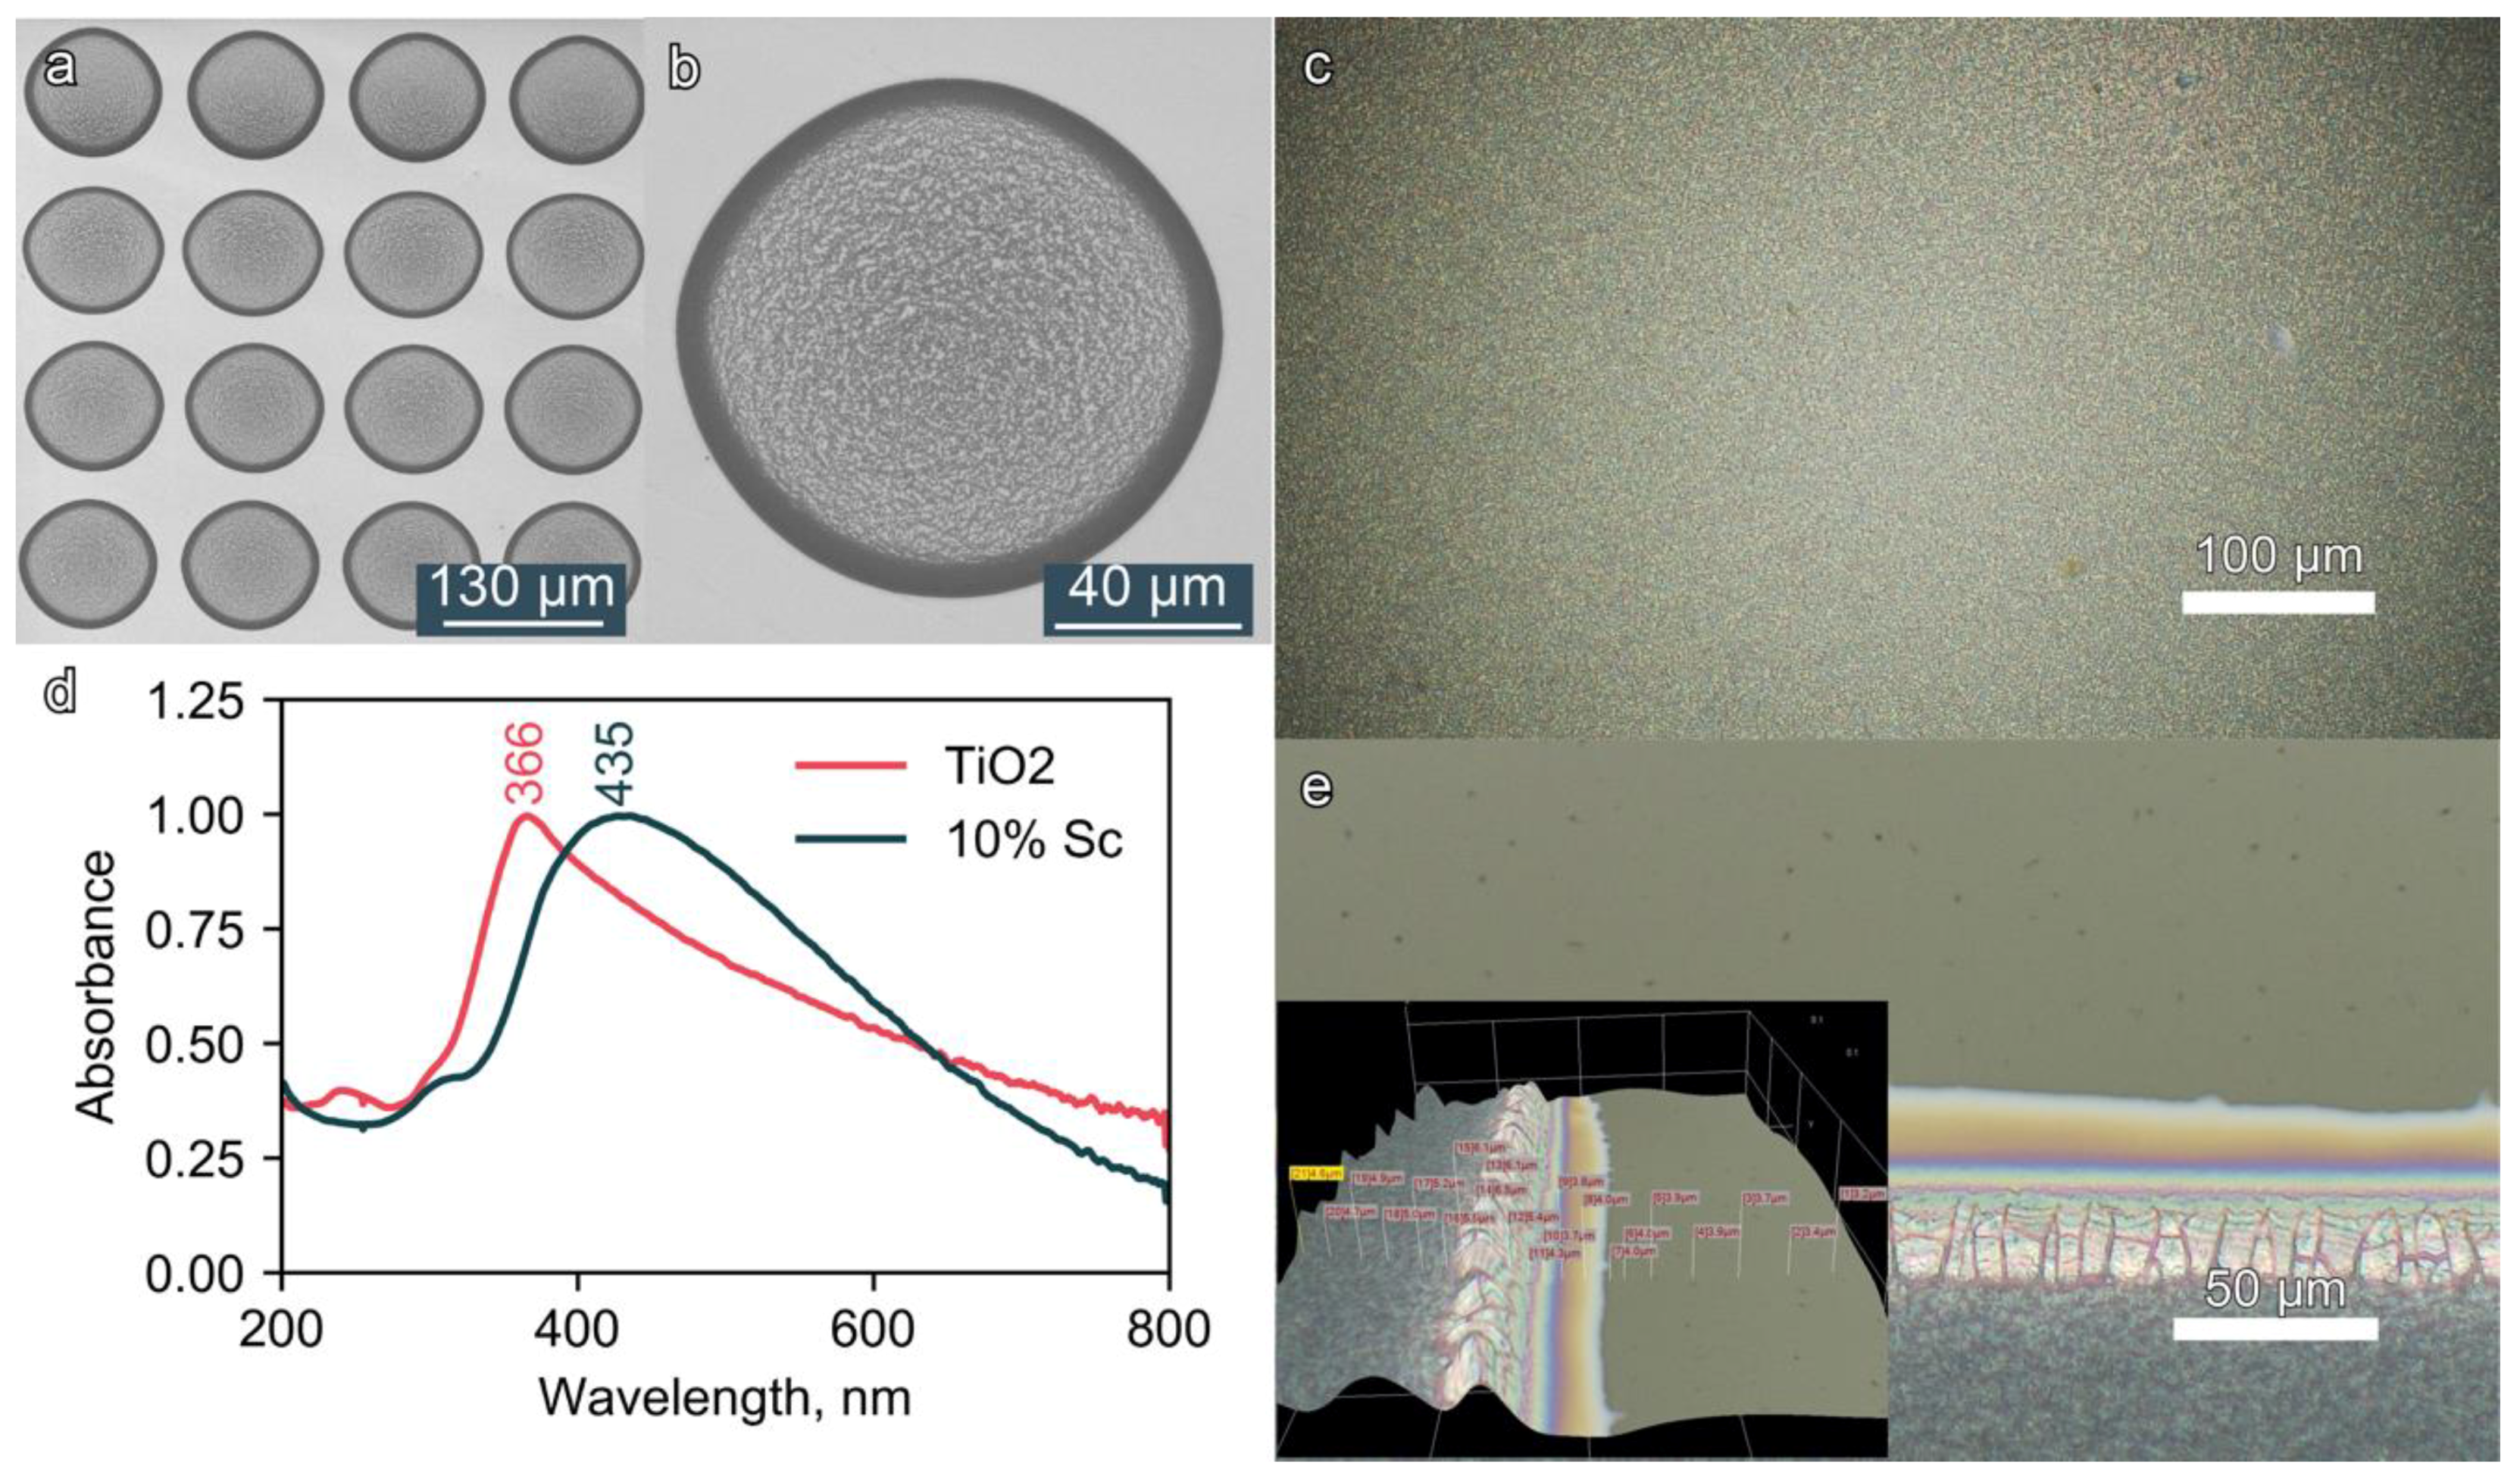
Figure 6a,b show SEM images of the printed 10 wt.% Sc-TiO
2 drops, evidencing their highly uniform deposition at an equal distance of 120 μm (center-to-center) with no traces of satellite droplets. With variation of the drop spacing and a number of printed layers, a film with a defined uniformity and thickness can be achieved.
Figure 6c,e present a film on a glass substrate printed in four layers. The images show even particle distribution and a low film roughness. The film had a thickness of 0.8 μm and a roughness of about 0.1 μm.
To assess the optical characteristics of the resulting thin films of pure titania and its Sc-doped counterparts, the materials were inkjet-printed onto silicon wafers and then characterized by specular reflectance UV-vis spectroscopy, the results of which are shown in
Figure 6c. The presence of Sc dopants in the thin films shifted the absorbance maximum from 366 nm for pure TiO
2 to 425 nm for 10 wt.% Sc-TiO
2.

 ,
, 


