3.1. Reflectance
We prepared a set of 8 Al/AlF
3 mirrors using temperatures ranging from RT to 350 °C. AlF
3 film thickness was set at 26 nm for maximum reflectance at 121.6-nm H Lyman α spectral line, an important line for astrophysics and solar physics. A first 5-nm thick AlF
3 layer was deposited on Al at RT and the complementary 21-nm thick AlF
3 film was deposited once the sample was heated at the desired temperature. Al thickness was set to approximately 70 nm. Two samples were prepared in each vacuum cycle. The first sample was deposited at a larger temperature than the second sample; hence, the first sample was post-annealed at the second sample deposition temperature. For instance, M250 had AlF
3 deposited at 250 °C, and then it was let to cool down to RT. After that we prepared sample M150, so that M250 was annealed at 150 °C when M150 was being deposited. We assumed that post-annealing at a temperature significantly smaller than the deposition temperature should have negligible effects.
Table 1 summarizes sample names and deposition temperature. For one sample, AlF
3 was deposited at 150 °C and it was later annealed in vacuum at 200 °C.
Figure 1 shows FUV reflectance measured for the fresh mirrors after a short contact to the atmosphere of ~1 h. Samples with AlF
3 deposited at 300 and 350 °C displayed an uneven structure that was visible to the naked eye. An attempt to measure FUV reflectance resulted in values as low as ~10%, as well as a strong dependence on the specific spot over the sample so that these samples were not analyzed anymore. This result provides us with an upper limit for the AlF
3 deposition temperature, which must be between 250 and 300 °C.
Mirrors were stored in a desiccator and they were measured again after 4–8 months and after 2 years of aging.
Figure 2 and
Figure 3 display FUV reflectance of middle- and long-time aged mirrors, respectively. Reflectance was also measured in the visible, which is displayed in
Figure 4.
Hot-deposited AlF
3 results in mirrors with enhanced FUV reflectance compared to the mirror deposited at RT. Largest reflectance at the most demanding short FUV wavelengths was obtained at an optimum deposition temperature of 200–250 °C. Furthermore, aging somewhat increased reflectance enhancement over the RT sample, as the reflectivity of the latter decreased more over time than for mirrors deposited at high temperatures. Regarding reflectance in the visible range, no significant difference over the samples was observed. This behavior is similar to what was reported for Al protected with hot-deposited MgF
2 [
22].
The sample that was protected at 150 °C and later annealed in vacuum at 200 °C resulted in a good aging behavior along with a relatively flat reflectance in the long FUV. No other coating was post-annealed at a temperature higher than deposition; hence, no further conclusion can be attained as to whether this was or not a fortuitously positive result.
We can compare the present results with those of del Hoyo and Quijada [
21], who reported a reflectance at 121.6 nm of 90%; their samples were protected with AlF
3 deposited at 250 °C. The largest reflectance at 121.6 nm measured in the present research was 89.9% for the fresh 250 °C-sample, which reduced to 87.3% after a few months of aging. After two years of aging, the 200 °C-sample retained the largest reflectance at 85.5%. Such reflectance is not far from optimum results for the classical Al/MgF
2 mirrors [
22].
All our samples presented a broadband reflectivity dip at ~160 nm, which is attributed to absorption due to the excitation of surface plasmons at the Al/AlF
3 interface. Surface plasmons are evanescent electromagnetic waves that propagate along the surface of the metal. For a free-electron-like metal such as Al, the surface-plasmon dip wavelength depends on the refractive index of the protective layer [
23]. Since the dip is found close to what is observed for Al protected with MgF
2, the refractive index of AlF
3 and MgF
2 must be close to each other at ~160 nm. Surface-plasmon dip is superimposed in wavelength with a dip originated in the first destructive interference for the Al/AlF
3 coatings optimized at ~121.6 nm, which complicates discrimination between the two phenomena. The present results show a deeper reflectance minimum than the commented results of del Hoyo and Quijada [
21], which suggests that the extra decay obtained here must be due to surface plasmon excitation since the interference effects should be approximately the same in the two pieces of research. Surface-plasmon excitation on mirrors like the present ones is permitted by the coupling of radiation wavelength with roughness at the Al/AlF
3 interface. Mainly roughness components with spatial wavelength shorter than radiation wavelength can contribute to the generation of surface plasmons [
24]. This suggests that the present mirrors involve larger short-range roughness components than in Reference [
21]. The Al film may better reproduce long-range substrate roughness components, whereas short-range roughness components may be most probably attributed to the film intrinsic roughness so that the difference observed in surface-plasmon excitation must reside in the Al film growth. Main deposition parameters are film thickness, deposition rate, and deposition and annealing temperature. No significant difference in film thickness or Al deposition rate is observed between the two mirror fabrication methods. For the same heating temperature, there might be a difference in the heating and cooling ramps. A difference between the two methodologies is substrate nature: quartz in [
21] and glass here. It has been said above that substrate roughness should not govern surface-plasmon excitation at the Al/AlF
3 interface; however, the growth of the Al film in terms of crystallite size and preferential crystallite growth directions might be dependent on the crystalline or amorphous nature of the substrate, which might affect the resulting short-range roughness. Regarding the various deposition temperatures in the present research, a dip that is roughly similar in size was observed for the RT-, 200 °C- and 250 °C-deposited fresh samples, so that deposition temperature seems not to be an essential parameter, although samples protected at 100 and 150 °C display a relatively smaller dip. On the other hand, the sample that was protected at 150 °C and post-annealed at 200 °C had the smallest surface-plasmon dip over the present samples; the main difference over the other sample protected at 150 °C is the post-annealing process. In fact, it has been reported that post-annealing an Al film may result in films with the smallest excitation of surface plasmons [
25]. Anyway, all present samples (except the RT one) were annealed after Al deposition (for the deposition of the AlF
3 film), and the surface-plasmon reflectance dip was large instead.
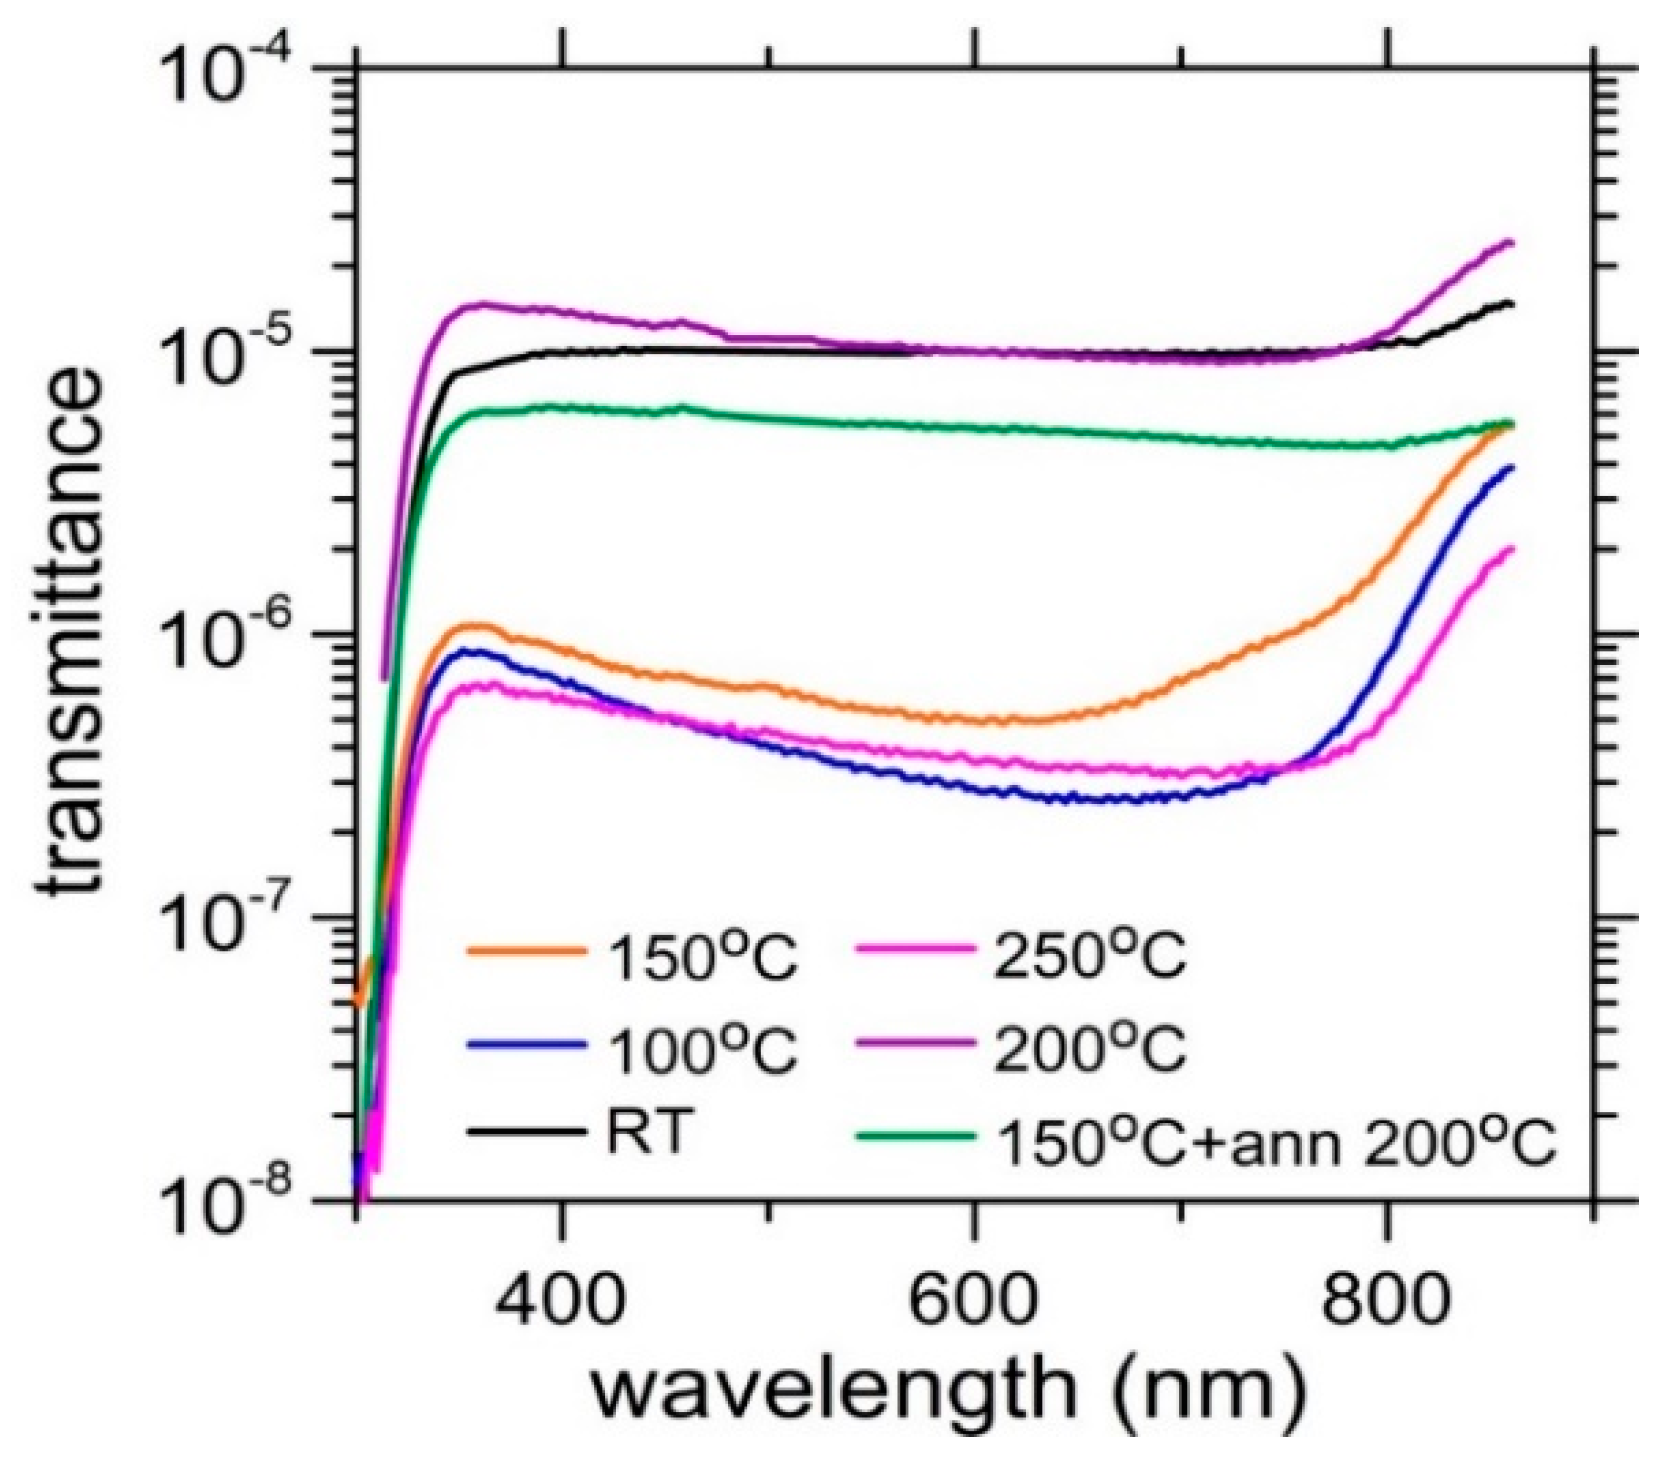
The possible presence of pinholes was measured through transmittance in the visible range, which is plotted in
Figure 5. The smallest measured transmittance can be considered as a top limit of the pinhole fractional open area. Curves in
Figure 5 corresponding to temperatures of 100, 150, and 250 °C display a shape with a minimum in the visible which is typical for the transmittance of an Al film. Samples involving temperatures of RT, 200 °C, and 150 °C + annealing at 200 °C display a relatively flat transmittance shape in the ~400–800-nm range, which suggests a transmittance limited by pinholes. Therefore, the pinhole open area seems to approach 10
−5 for the latter three samples, but it is well below 10
−6 for the former ones. There seems not to be any correlation between the specific temperature and the sample being limited by pinholes, so that the increased number of pinholes in some samples might arise from other unknown factors, such as local defects at the substrate or imperfect substrate cleaning. The present result contrasts with the important correlation observed between MgF
2-deposition temperature and the presence of pinholes in Al/MgF
2 coatings [
22]. Furthermore, the pinhole open area is overall smaller in the present research. The apparently erratic presence of pinholes found here combined with the relatively short statistics both here and in Reference [
22] might be at the root of the contrasting results between the two pieces of research.
3.2. Structural Properties
Samples were measured with XRR. These data were fitted using IMD Software (version 5.04) [
26] from which information on interface and surface roughness and AlF
3 density was obtained along with film thickness. Experimental data were fitted up to ~1°.
Figure 6 displays XRR data and fits for some samples. In the fits, the density of Al was set at 2.7 g/cm
3.
Figure 7,
Figure 8 and
Figure 9 display AlF
3 density as well as Al-AlF
3 interface and outermost AlF
3 surface roughness obtained from XRR fits. AlF
3 density displays a trend to monotonously grow with deposition temperature. Fluoride films are known to grow with a reduced packing density due to the presence of pores, which originates in the low mobility of condensing molecules at film growth on a low-temperature substrate. Evolution of AlF
3 density with deposition temperature can be interpreted as an increase of packing density, with the film approaching bulk density of ~2.88 g/cm
3.
Al surface roughness displays a continuous trend to decrease with increasing temperature. This surface-roughness decrease may be compatible with the growth of larger crystallites with temperature [
27]. As for AlF
3 surface roughness, there is a roughness decrease up to the temperature range of 150–200 °C; the small increase at 250 °C might be within the uncertainty range.
The outer surface topography was measured by means of AFM. Three samples were measured: mirrors with AlF
3 deposited at RT, 100 °C, and 250 °C. Topography data were processed using WSxM software (version 9.1) [
28]; the following functions and algorithms were applied: flatten, plane filter, and Gaussian smooth.
Figure 10 displays the measured topography of these samples.
Surface roughness can be evaluated through power spectral density (PSD) function. PSD provides information about the contribution of the different spatial frequencies to surface roughness. PSD is defined by [
29,
30]:
where
fx and
fy are the spatial frequencies in
X and
Y directions,
L is the sampling length, and
h(
x,
y) represents the surface profile height at each point over the surface. Since no preferential direction is expected for the coating growth, a simplified 2-D isotropic form of PSD can be used by expressing it in polar coordinates and by averaging it over the 2π azimuth angle θ:
PSD calculated for the three mirrors is represented in
Figure 11. The three curves are very close to each other; PSD is slightly smaller for the 250 °C-protected mirror in the spectral range above ~20 μm
−1.
RMS surface roughness σ can be obtained from PSD through [
31]:
where
fmin–
fmax stands for the spatial frequency range in which PSD function is determined. Calculated σ depends on the spatial frequency bandwidth used in the integration. Substrate roughness contribution can be expected to dominate PSD in the low spatial frequencies, whereas the coating is expected to dominate it in the high spatial frequencies [
32]. Hence, we have divided our frequency range of integration in Equation (3) into two subranges separated at 20 μm
−1, since the three curves in
Figure 11 have approximately common values below that frequency. The result of integrating PSD for the three mirrors in the two subranges provides RMS roughness parameters for the low- and for the high-spatial frequencies, which can be roughly attributed to the substrate and to the film, respectively. σ calculated in the full-frequency range and in the two frequency subranges is given in
Table 2. Even though σ in the full-frequency range is similar for the three mirrors, a decrease of the large-frequency σ component can be seen for the 250 °C-protected mirror. The observed high-frequency σ reduction at the largest temperature is consistent with σ decrease for the outer AlF
3 interface obtained from XRR fits.
Surface roughness can be also characterized by means of the autocorrelation function ACF(τ), which is defined in the spatial domain:
ACF enables us to compare a data set
h(r) with a translated version of itself
h(r + τ) [
28,
29]. In Equation (4) we assumed again the absence of any preferential direction. ACF was calculated with the present AFM data for the three mirrors and it is displayed in
Figure 12. Data were normalized as ACF(τ)/ACF(0).
The autocorrelation length
T is defined as the distance at which ACF decays to a certain fraction of ACF (0). The physical meaning of
T is related with the grain width. For random rough surfaces, two common functions are used to fit the autocorrelation function: Gaussian and exponential function. A somewhat more general function, also containing the above ones, can be used [
33,
34]:
where α specifies the type of statistical distribution of surface irregularities; Gaussian distribution stands for α = 1 and exponential distribution for α = 1/2. For the set of functions described by Equation (5), it is convenient to define the autocorrelation length
T as the distance at which ACF decreases from its maximum to 1/e. This decay is used here to define
T.
T calculated for the curves of
Figure 12 is given in
Table 2. There is a moderate increase in grain width with AlF
3-deposition temperature. The obtained width increase may have originated at the AlF
3 protective film but most probably at the thicker Al film [
27].
Summarizing roughness data, σ from XRR has been seen to decrease all the way with deposition temperature for the Al/AlF3 interface and to decrease up to ~150 °C and not to vary significantly above that temperature for the outer AlF3 interface. As per AFM, the average grain width on the outer surface has been seen to increase with AlF3 deposition temperature, whereas surface roughness has been seen to decrease at the largest temperature of 250 °C. Grains in a film are often expected to grow with temperature; from XRR measurements, we have seen that there is an increase in AlF3 packing density with AlF3-deposition temperature up to close to 100% at 250 °C; the decrease in porosity must occur simultaneously with the trend to grow larger crystals at higher temperatures.
X-ray diffraction measurements were performed both in the θ–2θ geometry (XRD) and at grazing incidence (GIXRD). Due to the deep penetration of X-ray radiation, much deeper than the coating thickness, most diffracted photons in the θ–2θ geometry correspond to interaction with the substrate. To reduce this parasitic contribution and to increase the signal coming from the coating, geometry can be changed to grazing incidence, in which the incoming beam impinges at a constant grazing angle and the detector scans the diffraction angle. θ–2θ spectra provide information for crystal planes parallel to the sample surface, whereas GIXRD, with a fixed primary beam and a rotating secondary beam, collects photons diffracted from families of planes that are tilted with respect to the sample surface. Crystal planes in the coating were identified from diffraction spectra using Panalytical X-Pert Plus software package (version 2.2.5), which compares measured data with the International Tables for Crystallography database.
θ–2θ XRD spectra for mirrors with the AlF
3 film deposited at RT, 100, and 250 °C are shown in
Figure 13. For all three samples, a single Al (111) peak is observed; it is the most stable orientation because it has the lowest surface energy [
35,
36]. Al (111) peak integrated area, normalized to the full curve area, is given in
Table 3. Peak integrated area shows a strong increase from the RT coating to the 100 °C-protected coating, with a further increase to the 250 °C-protected one.
GIXRD spectra were obtained for the same three samples and they are displayed in
Figure 14. GIXRD spectra for the RT sample display many Al peaks; that is why we extended the angular range to 140°. The presence of all Al peaks suggests that Al has a polycrystalline grain structure. If we combine this result with the XRD spectrum for the RT sample, we can conclude that the Al film has a polycrystalline structure with some trend to orient the (111) planes parallel to the sample surface. There is only one possible peak of AlF
3, (113), but it is superimposed with Al (200) peak. For the mirror protected at 100 °C, only GIXRD peaks of Al (111), Al (220) (again, AlF
3 (113) peak could appear superimposed with it), and Al (311) remain, with the (220) turning prevalent. For the mirror protected at 250 °C, there is an overwhelming presence of Al (220) peak, and only a tiny Al (111) peak, and an almost undetectable Al (311) peak are left. Hence Al (111) peak dramatically decreases with the increase of AlF
3-deposition temperature and at the same time a strong increase of Al (220) peak is obtained with this same temperature increase; a similar trend was observed in a previous research for Al mirrors protected with MgF
2 films [
37]. In fact, the observed behavior may be independent of the particular protective coating on Al, and the specific AlF
3-deposition temperature could be interpreted as a post-annealing temperature of the already deposited Al film.
With XRD spectra we collect photons diffracted by families of crystal planes that are parallel to the sample surface. Hence the increased integrated intensity with rising temperature that we measured for the Al (111) crystal planes suggests that these planes have an increasing trend with temperature to grow parallel to the sample surface. On the other hand, GIXRD collects photons diffracted from families of planes that are tilted with respect to the sample surface; if the incidence angle is α (measured from the sample surface; here α = 0.5°) and the secondary beam is deviated 2θ upon diffraction, the planes contributing to diffract in that direction are tilted θ-α from the sample surface towards the primary beam. Hence the Al (220) crystal plane that becomes prevalent in GIXRD spectra for increasing deposition temperature is calculated to be tilted 32.1° from the sample surface toward the primary beam. This value is not far from the angle between crystal planes (111) and (220) in an fcc crystal, which is 35.3°. These two close angles suggest that the prevalent Al (220) GIXRD peak at 100 °C- and 250 °C-protected mirrors may correspond to the same crystals that diffract the Al (111) peak in the θ–2θ XRD spectra, assuming these crystals are merely tilted 35.3° − 32.1° = 3.2° with respect to the sample surface; this angle may be a lower limit of the disorder angle of the Al (111) crystals with respect to the sample surface.
Regarding AlF3, only (113) peak could be identified, at most, in samples where AlF3 was deposited at RT and 100 °C, and none at 250 °C. For polycrystalline AlF3, (113) peak is the second prevalent peak, behind (012) at 26.5°, which is not present in the GIXRD spectra. So, the peak observed can be most probably assigned to Al (200) peak. The small thickness of the AlF3 protective layer of ~26 nm may partly explain the small intensity of AlF3 peaks. GIXRD spectra obtained for AlF3 suggests a small crystallinity.
Combining the present results with those obtained from AFM and XRR data, we can conclude that unheated Al is polycrystalline with some trend to orient the (111) peak parallel to the sample surface; by heating the deposited Al film in the process to protect it with AlF3, Al undergoes a change in the crystallization pattern, with a strong trend for the prevalent Al (111) planes to orient parallel to the coating surface, along with a porosity reduction of the AlF3 film, a reduced internal Al/AlF3 interface and external AlF3 interface roughness, a reduced PSD at high spatial frequencies, and increased autocorrelation length.

 ,
, 


