Extrusion Coating of Paper with Poly(3-hydroxybutyrate-co-3-hydroxyvalerate) (PHBV)—Packaging Related Functional Properties
Abstract
:1. Introduction
1.1. Polyhydroxyalkanoate (PHA)
1.2. Plasticisers
1.3. Motivation and Intention of this Study
2. Materials and Methods
2.1. Materials
2.1.1. PHBV
2.1.2. Plasticisers
2.1.3. Paper Substrate
2.2. Methods
2.2.1. Compounding
2.2.2. Film Extrusion and Paper Coating
2.2.3. Film Thickness
2.2.4. Differential Scanning Calorimetry (DSC)
2.2.5. Thermogravimetric Analysis (TGA)
2.2.6. Melt Flow Rate (MFR)
2.2.7. Mechanical Properties
2.2.8. PHBV Layer Bond Strength on Paper
2.2.9. Grease Barrier (Staining)
2.2.10. Surface Roughness
2.2.11. Atomic Force Microscopy (AFM)
2.2.12. Polarisation Microscopy
2.2.13. Scanning Electron Microscopy (SEM)
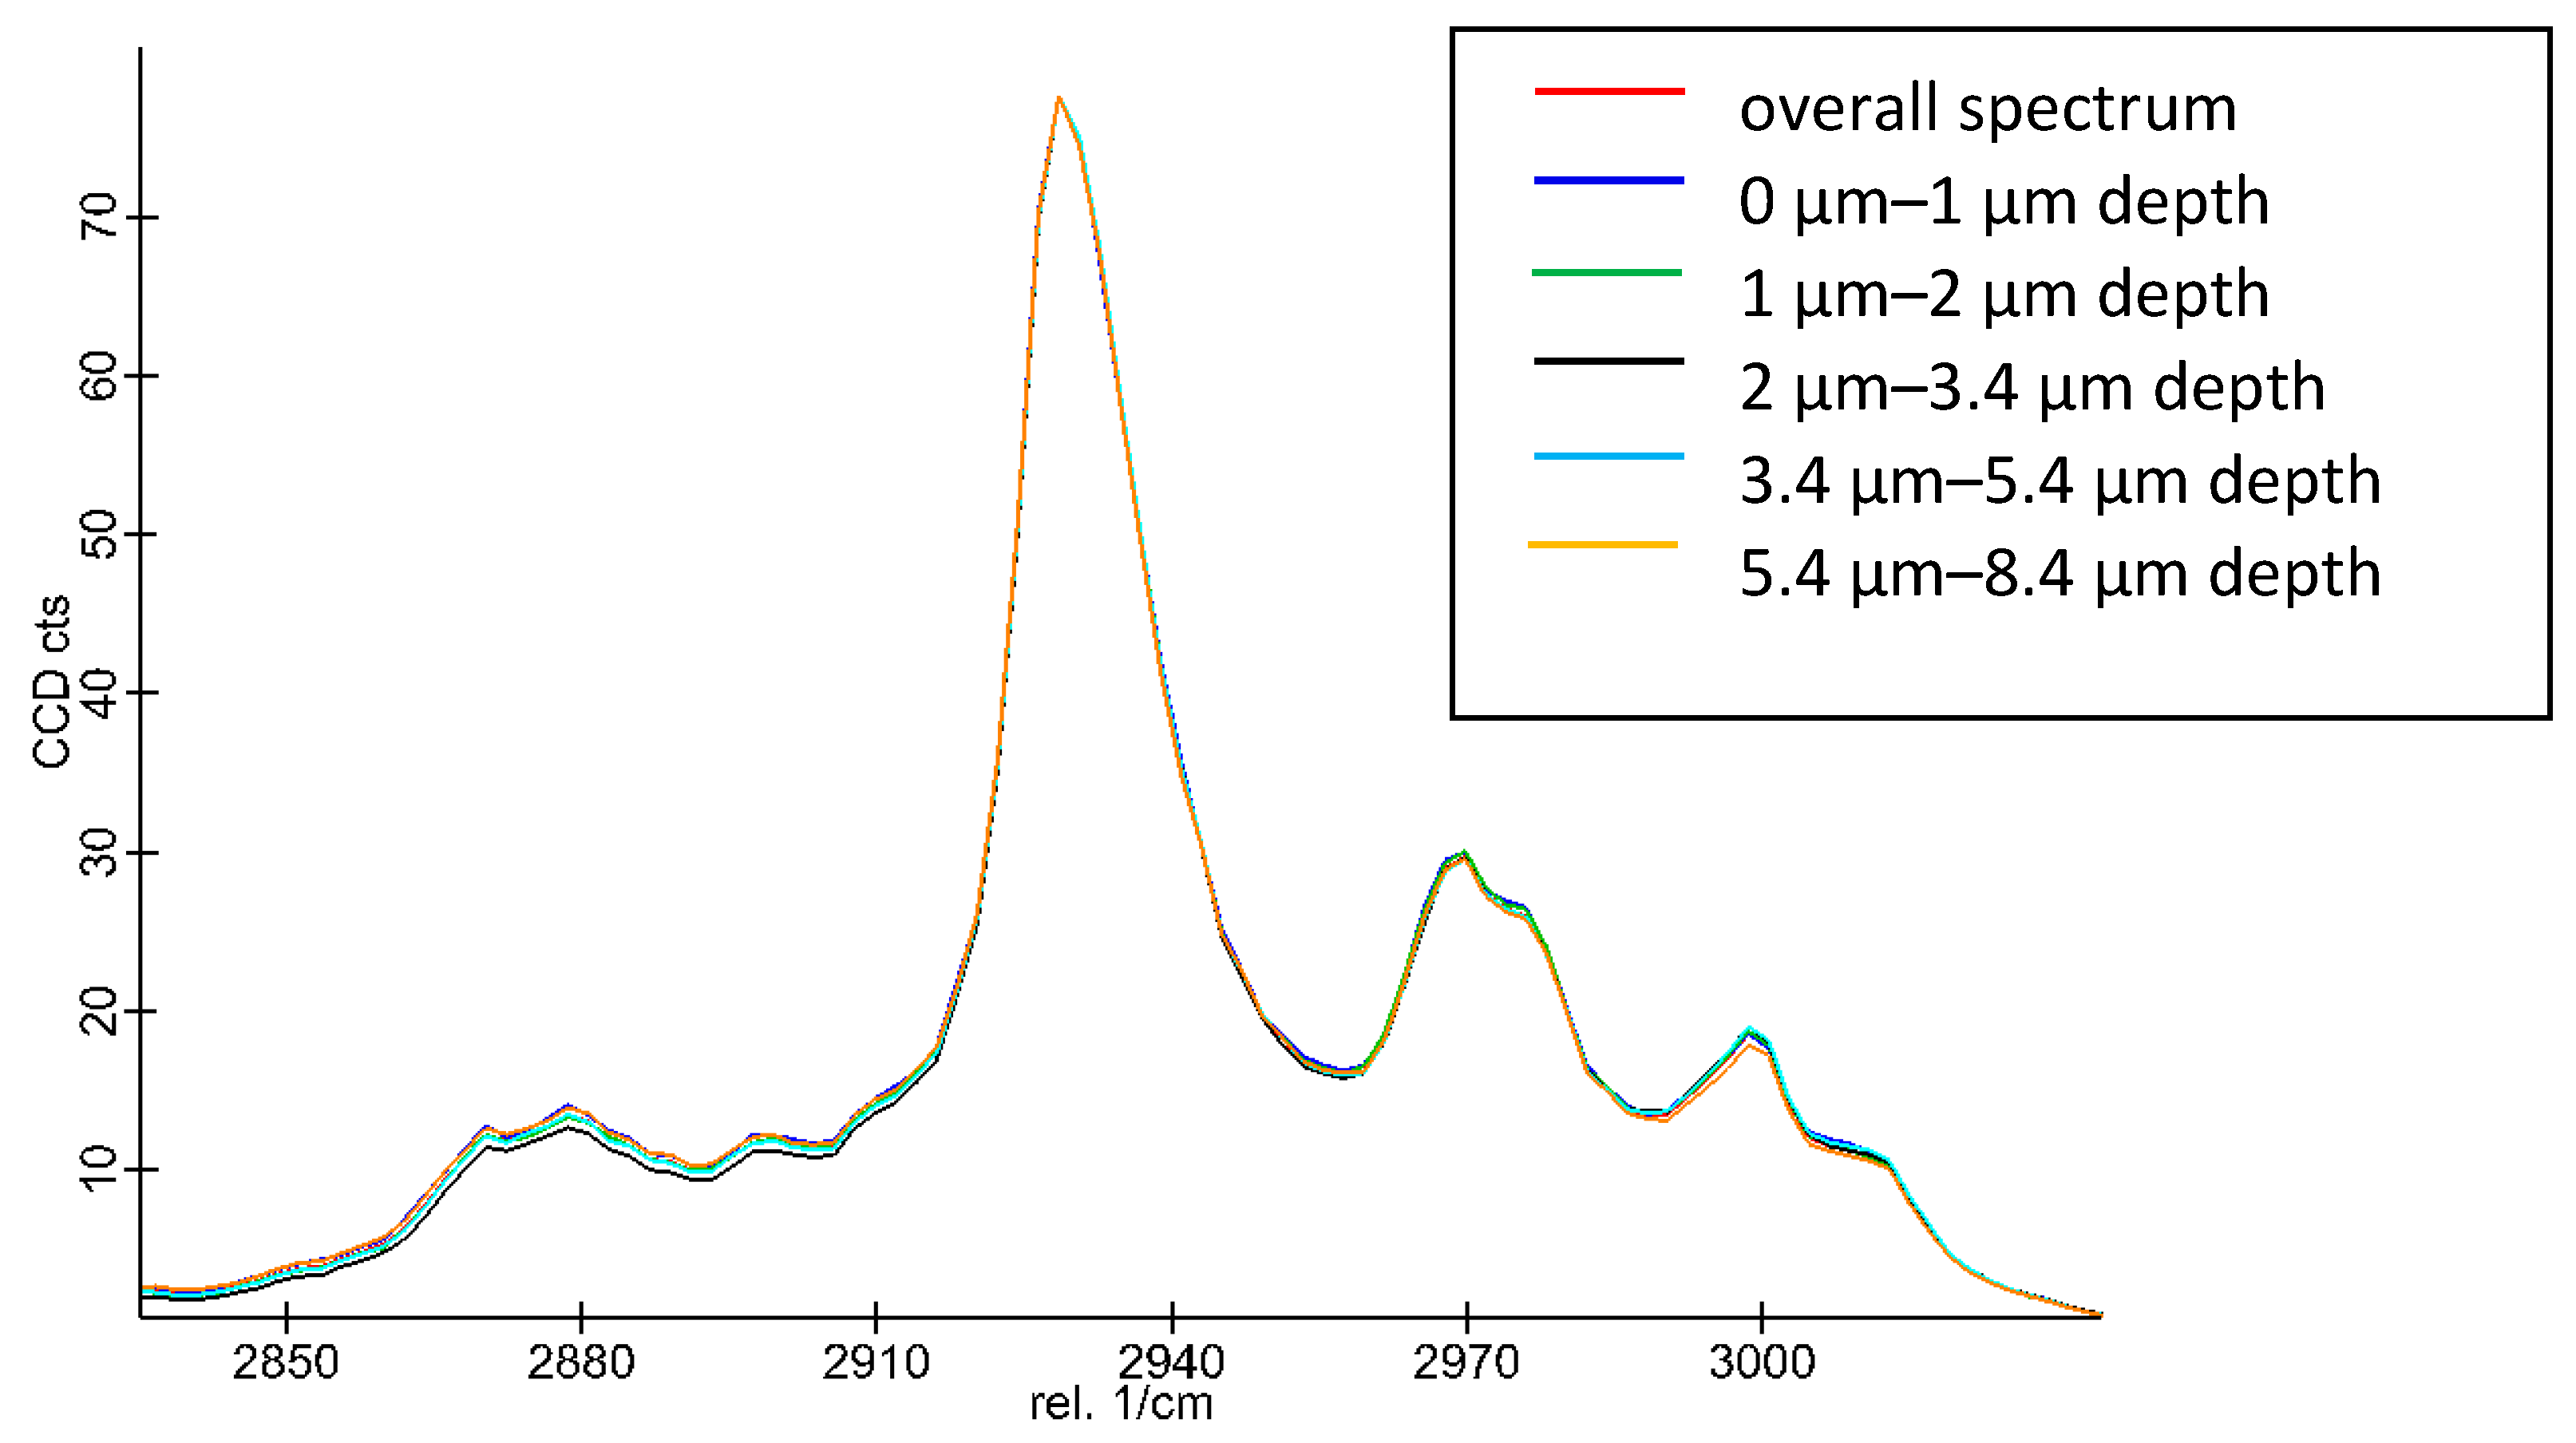
2.2.14. Raman Spectroscopy
3. Results and Discussion
3.1. Melting and Crystallisation Temperature
3.2. Decomposition
3.3. Melt Flow Rate
3.4. Mechanical Properties: Tensile Strength, Elongation at Break, Elastic Modulus
3.5. Bond Strength of Pure and Plasticised PHBV on Paper
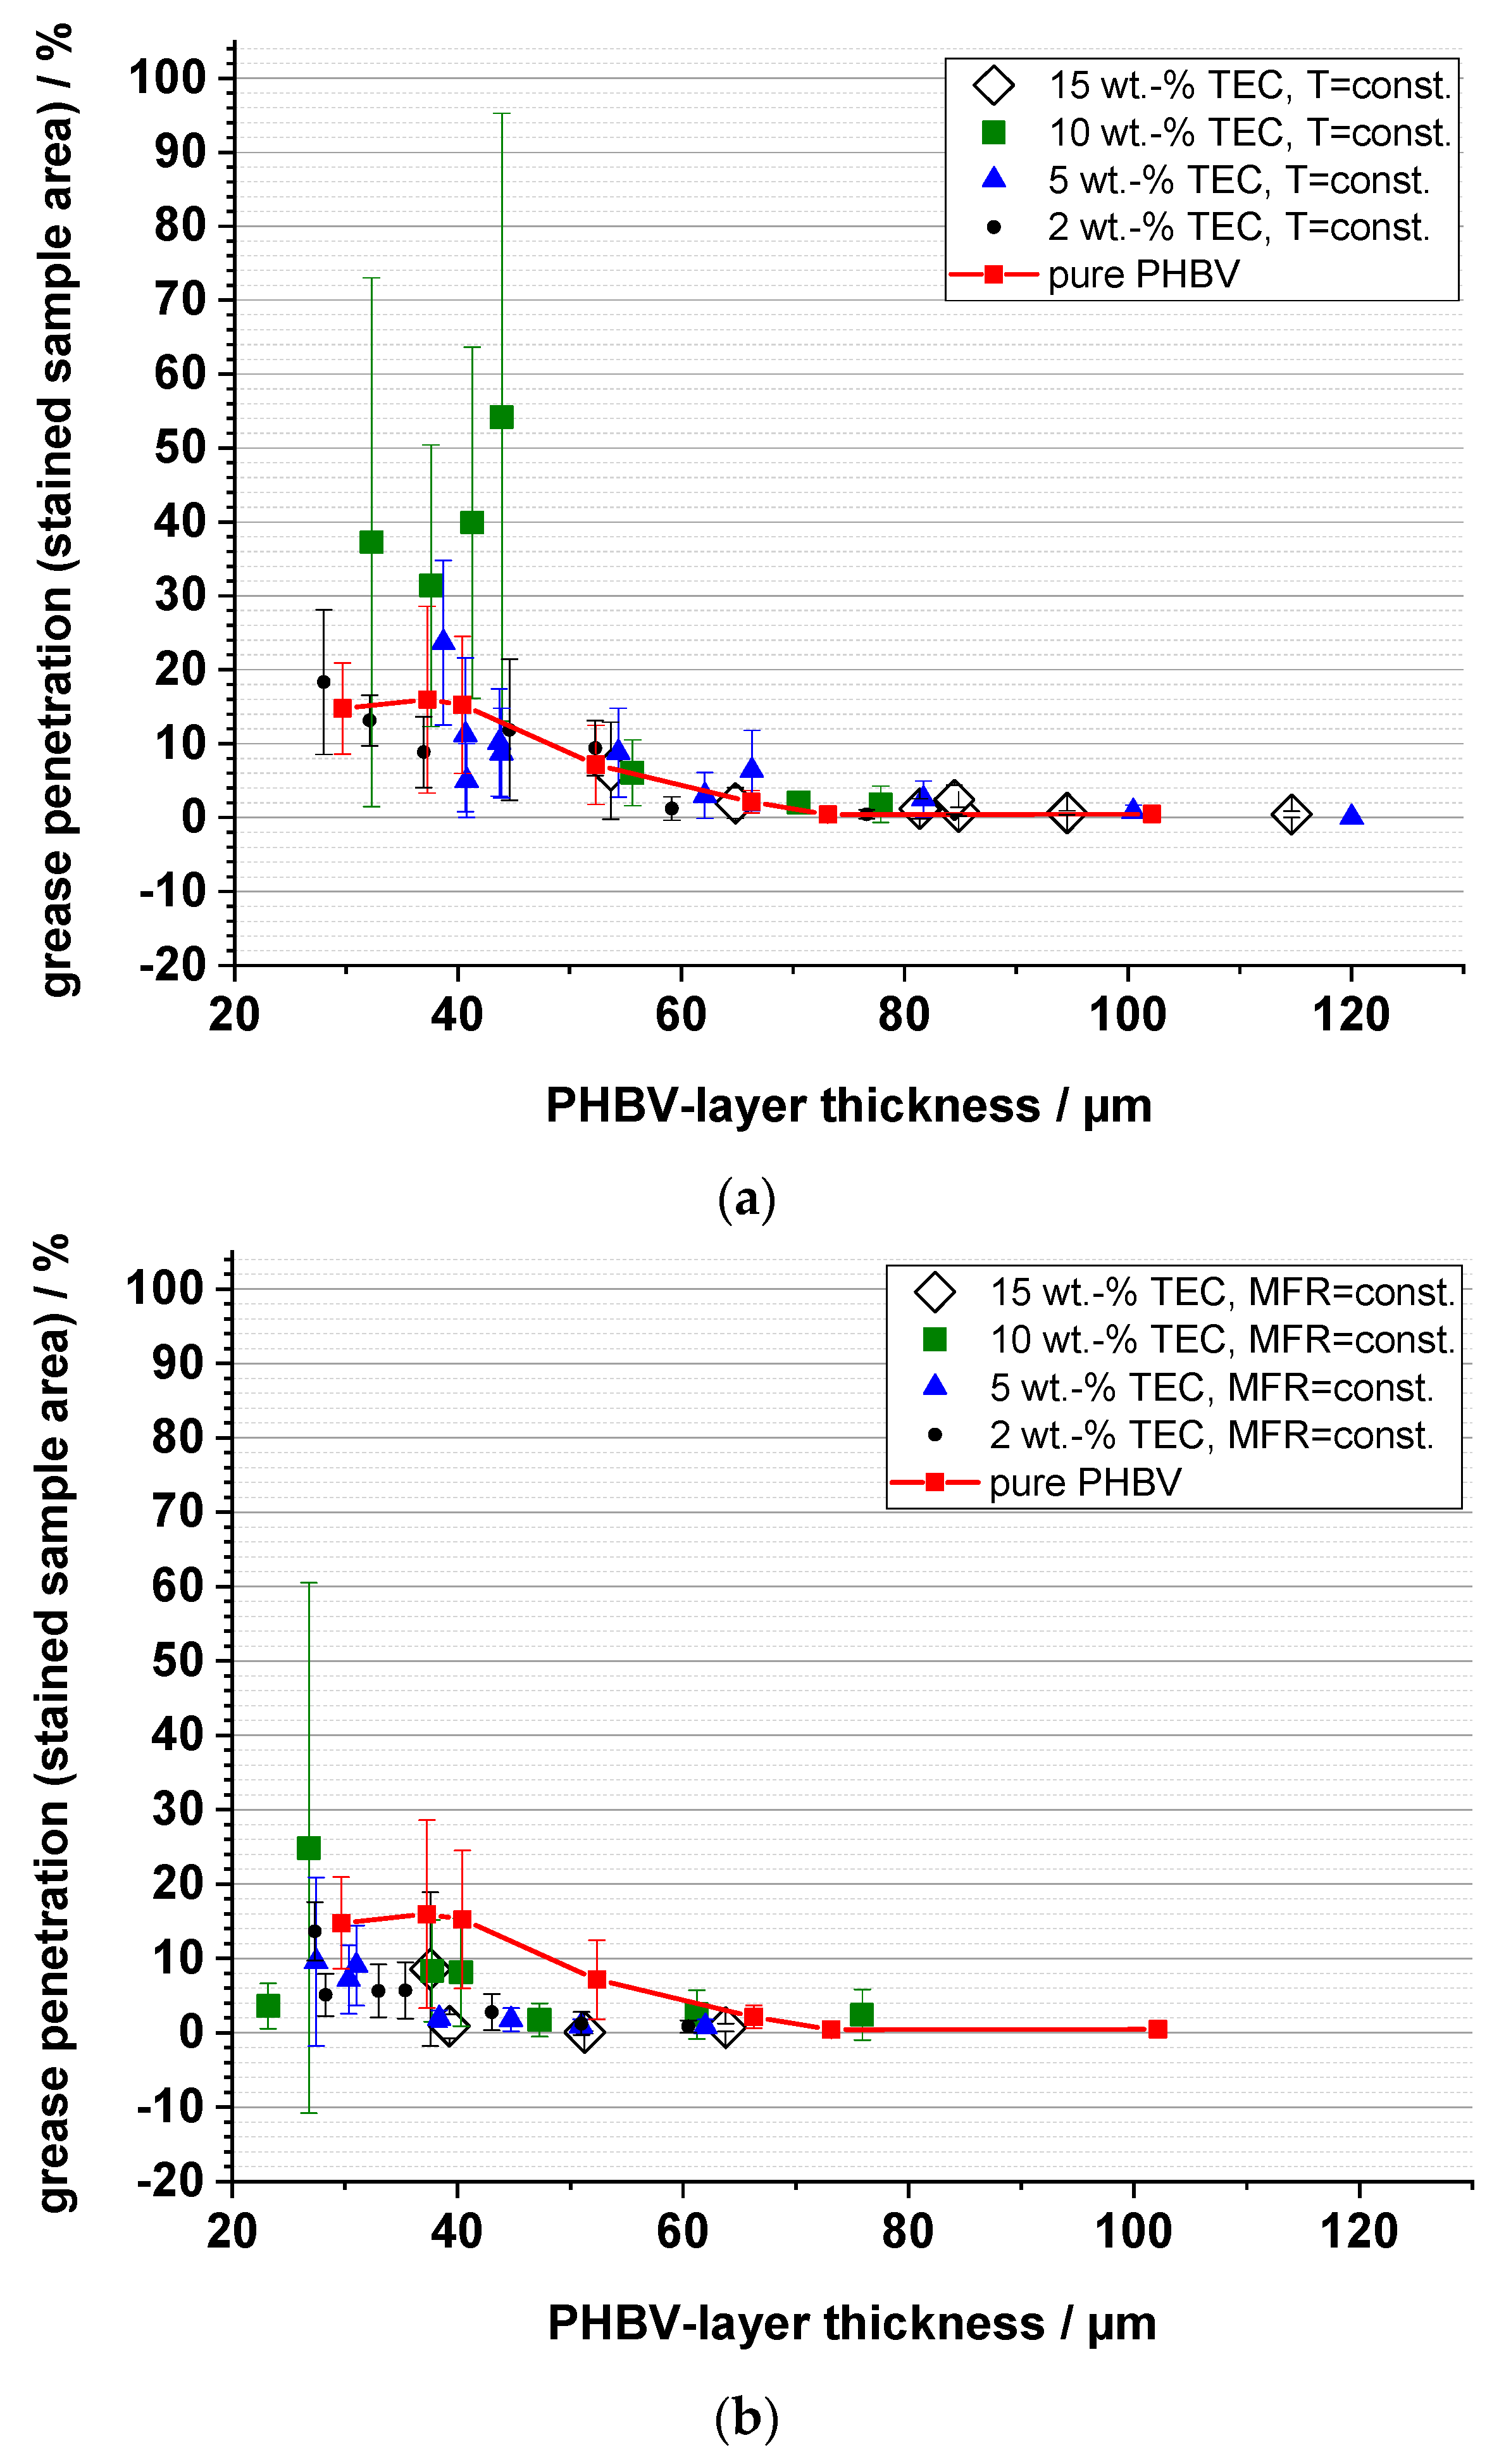
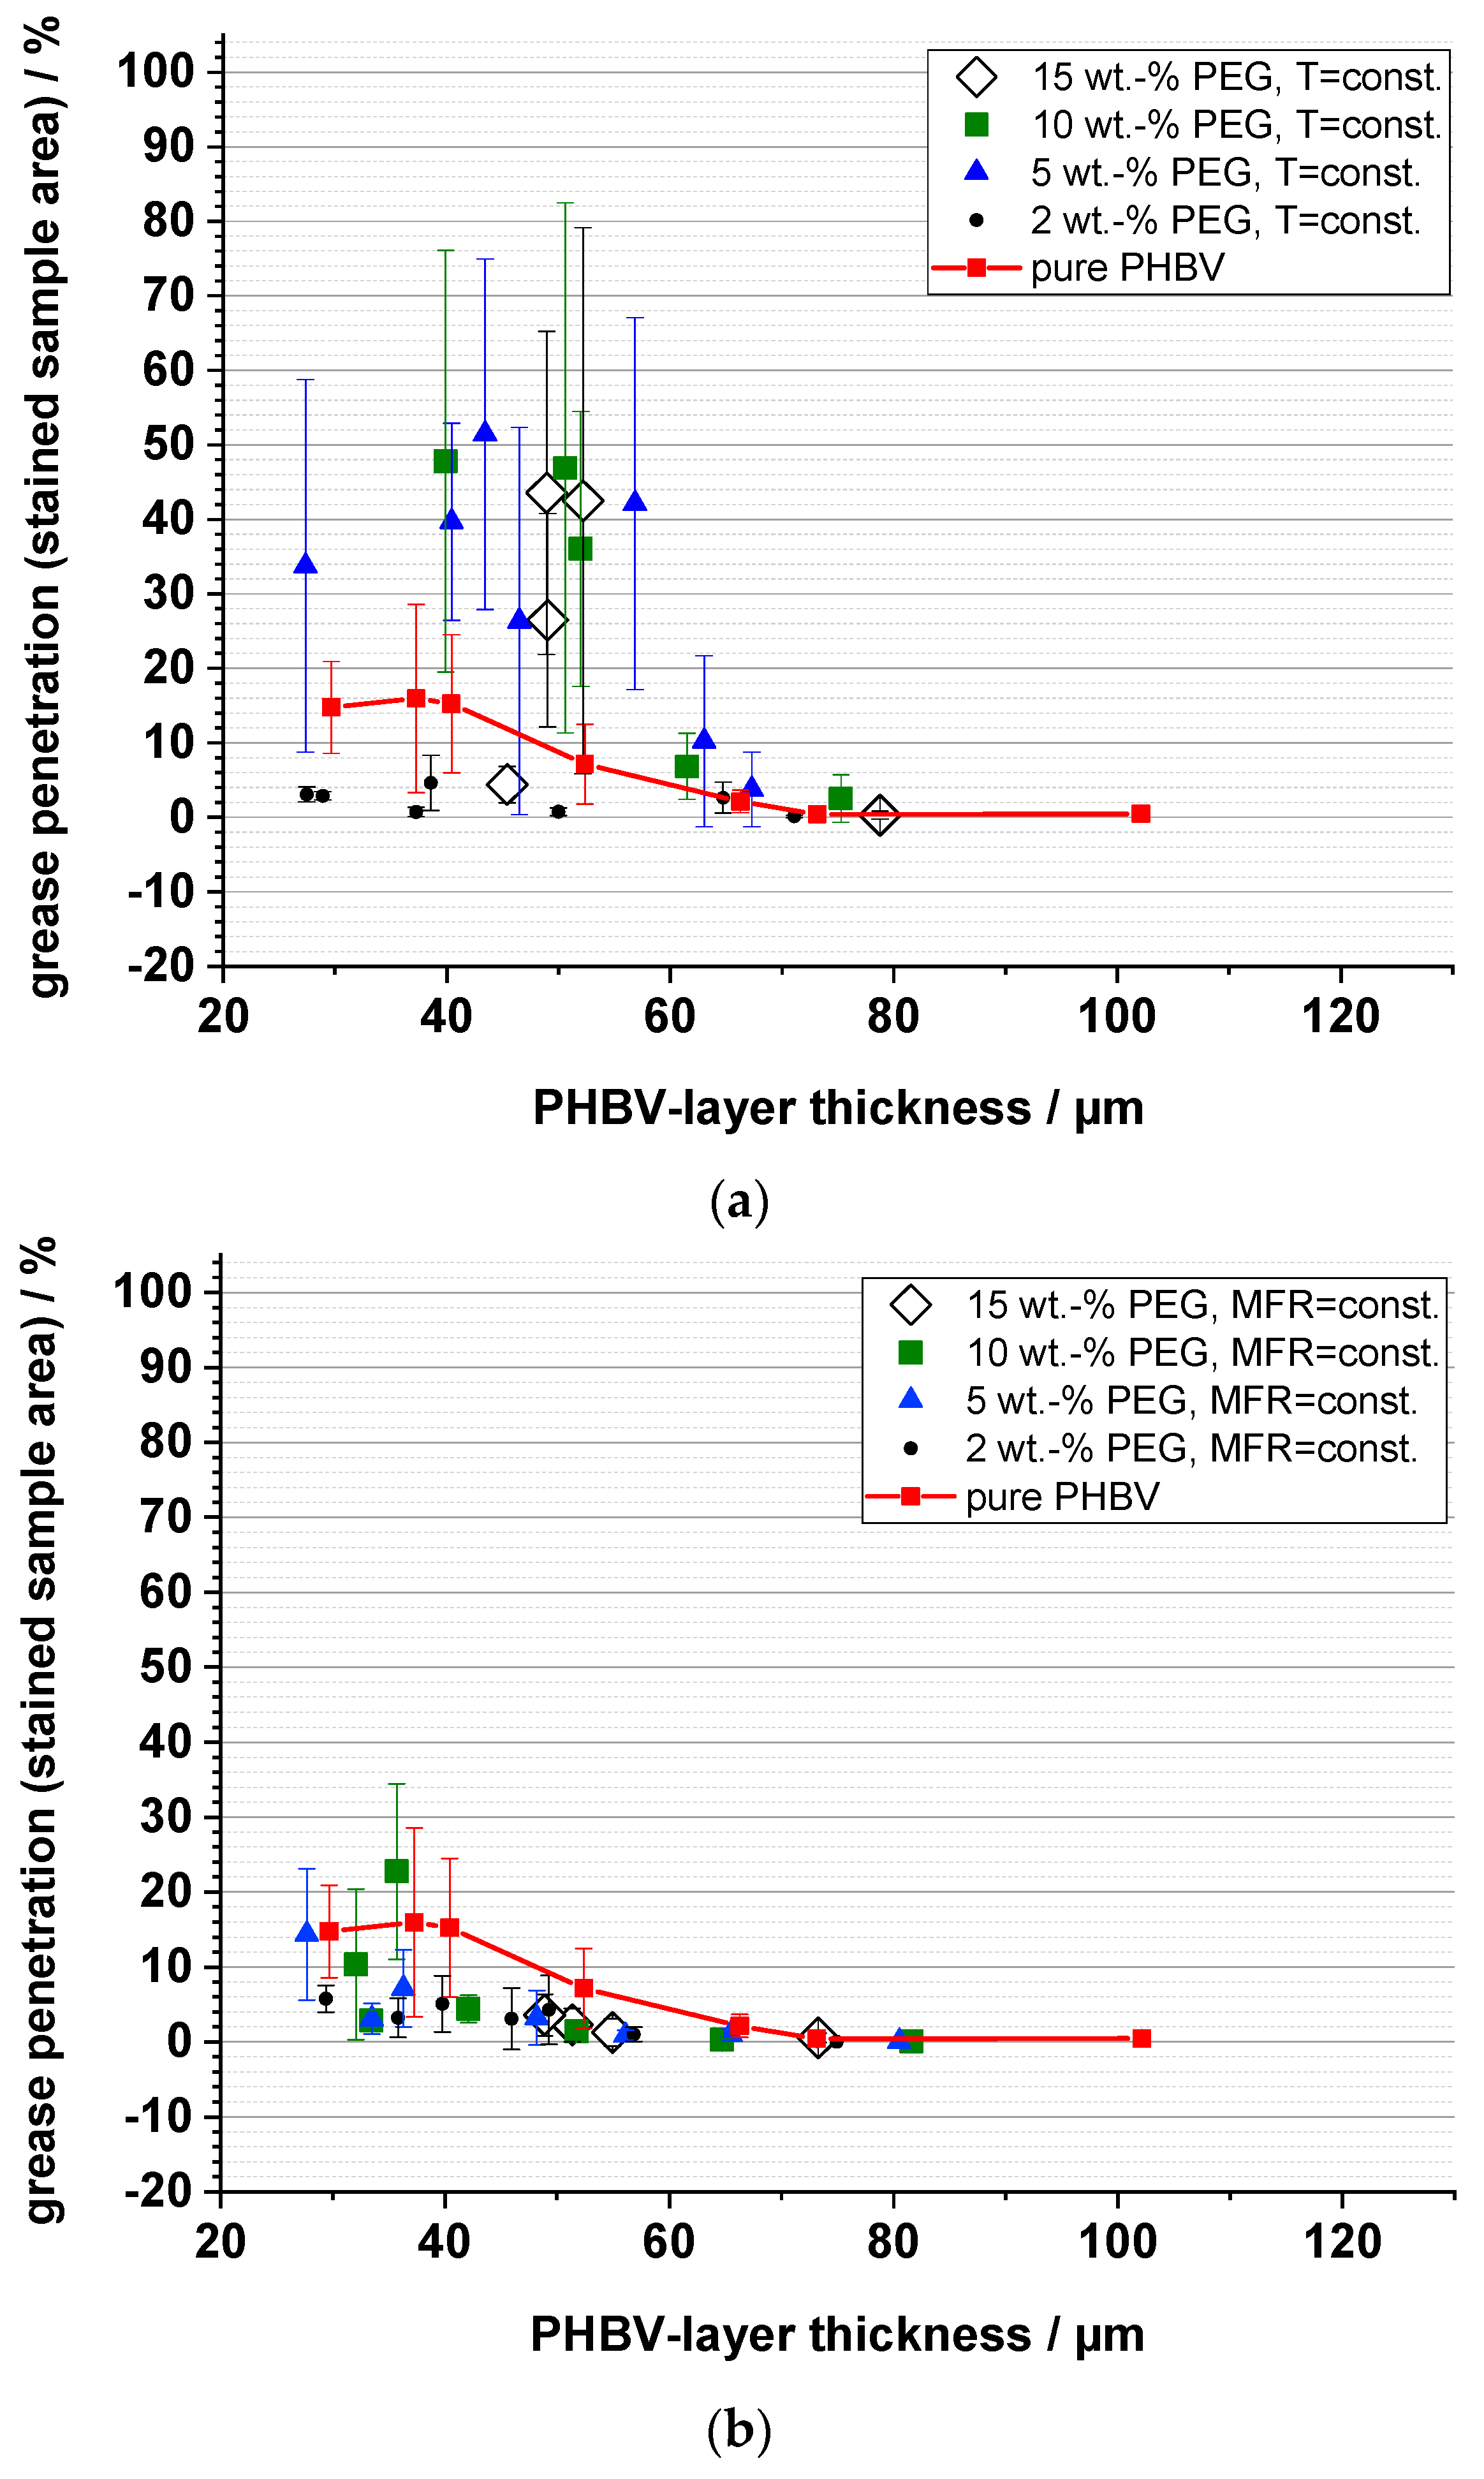
3.6. Grease Barrier (Staining)
3.7. Surface Roughness
3.8. Microscopic Analysis
4. Conclusions
Supplementary Materials
Author Contributions
Funding
Acknowledgments
Conflicts of Interest
References
- Anderson, A.J.; Dawes, E.A. Occurrence, metabolism, metabolic role, and industrial use of bacterial polyhydroxyalkanoates. Microbiol. Rev. 1990, 54, 450–472. [Google Scholar] [PubMed]
- Bugnicourt, E.; Cinelli, P.; Lazzeri, A.; Alvarez, V. Polyhydroxyalkanoate (PHA): Review of synthesis, characteristics, processing and potential applications in packaging. Express Polym. Lett. 2014, 8, 791–808. [Google Scholar] [CrossRef] [Green Version]
- Khanna, S.; Srivastava, A.K. Recent advances in microbial polyhydroxyalkanoates. Process Biochem. 2005, 40, 607–619. [Google Scholar] [CrossRef]
- Lee, S.Y. Plastic bacteria? Progress and prospects for polyhydroxyalkanoate production in bacteria. Trends Biotechnol. 1996, 14, 431–438. [Google Scholar] [CrossRef]
- Byrom, D. Polymer synthesis by microorganisms: Technology and economics. Trends Biotechnol. 1987, 5, 246–250. [Google Scholar] [CrossRef]
- Fidler, S.; Dennis, D. Polyhydroxyalkanoate production in recombinant escherichia coli. FEMS Microbiol. Rev. 1992, 9, 231–235. [Google Scholar] [CrossRef] [PubMed]
- Wallen, L.L.; Rohwedder, W.K. Poly-.Beta.-hydroxyalkanoate from activated sludge. Environ. Sci. Technol. 1974, 8, 576–579. [Google Scholar] [CrossRef]
- Sudesh, K.; Abe, H.; Doi, Y. Synthesis, structure and properties of polyhydroxyalkanoates: Biological polyesters. Prog. Polym.Sci. 2000, 25, 1503–1555. [Google Scholar] [CrossRef]
- Poirier, Y.; Nawrath, C.; Somerville, C. Production of polhydroxyalkanoates, a family of biodegradable plastics and elastomers, in bacteria and plants. Nat. Publ. Group 1995, 13, 142–150. [Google Scholar]
- Endres, S.R. Technische Biopolymere—Rahmenbedingungen, Marktsituation, Herstellung, Aufbau und Eigenschaften; Carl Hanser Verlag: München, Germany, 2009. [Google Scholar]
- Lemoigne, M. Produits de deshydration et de polymerisation de l'acide β= oxybutyrique. Bull. Soc. Chim. Biol. 1926, 8, 770–782. [Google Scholar]
- Barham, P.J.; Keller, A. The relationship between microstructure and mode of fracture in polyhydroxybutyrate. J. Polym. Sci. Polym. Phys. Ed. 1986, 24, 69–77. [Google Scholar] [CrossRef]
- Choi, J.I.; Lee, S.Y. Process analysis and economic evaluation for poly (3-hydroxybutyrate) production by fermentation. Bioprocess Eng. 1997, 17, 335–342. [Google Scholar] [CrossRef]
- Yamane, T. Yield of poly-D(-)-3-hydroxybutyrate from various carbon sources: A theoretical study. Biotechnol. Bioeng. 1993, 41, 165–170. [Google Scholar] [CrossRef] [PubMed]
- Kim, D.Y.; Kim, Y.B.; Rhee, Y.H. Evaluation of various carbon substrates for the biosynthesis of polyhydroxyalkanoates bearing functional groups by pseudomonas putida. Int. J.Biol. Macromol. 2000, 28, 23–29. [Google Scholar] [CrossRef]
- Grothe, E.; Moo-Young, M.; Chisti, Y. Fermentation optimization for the production of poly (β-hydroxybutyric acid) microbial thermoplastic. Enzym. Microb. Technol. 1999, 25, 132–141. [Google Scholar] [CrossRef]
- Holmes, P.A. Applications of PHB—A microbially produced biodegradable thermoplastic. Phys. Technol. 1985, 16, 32–36. [Google Scholar] [CrossRef]
- Laycock, B.; Halley, P.; Pratt, S.; Werker, A.; Lant, P. The chemomechanical properties of microbial polyhydroxyalkanoates. Prog. Polym. Sci. 2014, 39, 397–442. [Google Scholar] [CrossRef]
- Renstad, R.; Karlsson, S.; Albertsson, A.C. Influence of processing parameters on the molecular weight and mechanical properties of poly(3-hydroxybutyrate-co-3-hydroxyvalerate). Polym. Degrad. Stab. 1996, 57, 331–338. [Google Scholar] [CrossRef]
- Schmid, M.; Prinz, T.K.; Stäbler, A.; Sängerlaub, S. Effect of Sodium Sulfite, Sodium Dodecyl Sulfate, and Urea on the Molecular Interactions and Properties of Whey Protein Isolate Based Film. Front. Chem. 2017, 49, 1–15. [Google Scholar] [CrossRef]
- Choi, J.S.; Park, W.H. Effect of biodegradable plasticizers on thermal and mechanical properties of poly(3-hydroxybutyrate). Polym. Test. 2004, 23, 455–460. [Google Scholar] [CrossRef]
- Rodrigues, J.A.F.R.; Parra, D.; Lugao, A. Crystallization on films of phb/peg blends. J. Therm. Anal. Calorim. 2005, 79, 379–381. [Google Scholar] [CrossRef]
- Parra, D.F.; Fusaro, J.; Gaboardi, F.; Rosa, D.S. Influence of poly (ethylene glycol) on the thermal, mechanical, morphological, physical–chemical and biodegradation properties of poly (3-hydroxybutyrate). Polym. Degrad.Stab. 2006, 91, 1954–1959. [Google Scholar] [CrossRef]
- Pérez Amaro, L. High performance compostable biocomposites based on bacterial polyesters suitable for injection molding and blow extrusion. Chem. Biochem. Eng. Q. 2015, 29, 261–274. [Google Scholar] [CrossRef]
- Moreira Catoni, S.E.; Trindade, K.N.; Gomes, C.A.T.; Pezzin, A.P.T.; Soldi, V. Influence of poly(Ethylene grycol)-(PEG) on the properties of influence of poly(3-hydroxybutyrate-co-3-hydroxyvalerate)-PHBV. Polímeros Ciência e Tecnologia 2013, 23, 320–325. [Google Scholar] [CrossRef]
- Bonnet, M. Kunststoffe in der Ingenieuranwendung: Verstehen und Zuverlässig Auswählen; Vieweg Teubner Verlag: Wiesbaden, Germany, 2009. [Google Scholar]
- Jost, V.; Langowski, H.C. Effect of different plasticisers on the mechanical and barrier properties of extruded cast phbv films. Eur. Polym. J. 2015, 68, 302–312. [Google Scholar] [CrossRef]
- Kuusipalo, J. Phb/v in extrusion coating of paper and paperboard—Part I: Study of functional properties. J. Polym. Environ. 2000, 8, 39–47. [Google Scholar] [CrossRef]
- Kuusipalo, J. Phb/v in extrusion coating of paper and Paperboard—Study of functional properties part II. J. Polym. Environ. 2000, 8, 49–57. [Google Scholar] [CrossRef]
- Watson, G.; Jones, N. The biodegradation of polyethylene glycols by sewage bacteria. Water Res. 1977, 11, 95–100. [Google Scholar] [CrossRef]
- Bernhard, M.; Eubeler, J.P.; Zok, S.; Knepper, T.P. Aerobic biodegradation of polyethylene glycols of different molecular weights in wastewater and seawater. Water Res. 2008, 42, 4791–4801. [Google Scholar] [CrossRef]
- Barham, P.J.; Keller, A.; Otun, E.L. Crystallization and morphology of a bacterial thermoplastic: Poly-3-hyd roxybutyrate. J. Mater. Sci. 1984, 19, 2781–2794. [Google Scholar] [CrossRef]
- DIN, D.I.F.N. Din en iso 527-1: Kunststoff - bestimmung der zugeigenschaften-teil 1: Allgemeine grundsätze beuth verlag gmbh; Beuth Verlag: Berlin, Germany, 2012. [Google Scholar]
- Jost, V.; Miesbauer, O. Effect of different biopolymers and polymers on the mechanical and permeation properties of extruded phbv cast films. J. Appl. Polym.Sci. 2018, 135. [Google Scholar] [CrossRef]
- Kurusu, R.S.; Siliki, C.A.; David, É.; Demarquette, N.R.; Gauthier, C.; Chenal, J.M. Incorporation of plasticizers in sugarcane-based poly(3-hydroxybutyrate)(phb): Changes in microstructure and properties through ageing and annealing. Ind. Crops Prod. 2015, 72, 166–174. [Google Scholar] [CrossRef]
- Finocchio, E.; Cristiani, C.; Dotelli, G.; Stampino, P.G.; Zampori, L. Thermal evolution of PEG-based and BRIJ-based hybrid organo-inorganic materials. FT-IR studies. VIB SPECTROSC 2014, 71, 47–56. [Google Scholar] [CrossRef]
- Chiellini, E.; Grillo Fernandes, E.; Pietrini, M.; Solaro, R. Factorial design in optimization of phas processing. Macromol. Symp. 2003, 197, 45–56. [Google Scholar] [CrossRef]
- Modi, S.; Koelling, K.; Vodovotz, Y. Assessment of phb with varying hydroxyvalerate content for potential packaging applications. Eur. Polym. J. 2011, 47, 179–186. [Google Scholar] [CrossRef]
- Liao, Q.; Noda, I.; Frank, C.W. Melt viscoelasticity of biodegradable poly(3-hydroxybutyrate-co-3-hydroxyhexanoate) copolymers. Polymer 2009, 50, 6139–6148. [Google Scholar] [CrossRef]
- Jost, V. Packaging related properties of commercially available biopolymers – an overview of the status quo. Express Polym. Lett. 2018, 12, 429–435. [Google Scholar] [CrossRef]
- Da Silva, L.F.M.; Öchsner, A.; Adams, R.D. Handbook of Adhesion Technology; Springer: Berlin/Heidelberg, Germany, 2011. [Google Scholar]
- Sängerlaub, S.; Brüggemann, M.; Rodler, N.; Bauer, D. Extrusion coating of paper with phbv-an alternative to polyolefins? Coat. Int. 2019, 52, 11–15. [Google Scholar]







| Plasticiser | Concentration/wt.% | Temperature Profile/°C | |
|---|---|---|---|
| no plasticiser | 0 | constant temperature; constant MFR of 20.65 cm3/10 min | 40-155-185-185-185-185 |
| TEC | 2, 5, 10, 15 | constant temperature | 40-155-185-185-185-185 |
| TEC | 2 | constant MFR of 20.65 cm3/10 min | 40-155-180-180-180-180 |
| TEC | 5 | constant MFR of 20.65 cm3/10 min | 40-155-179-179-179-179 |
| TEC | 10 | constant MFR of 20.65 cm3/10 min | 40-155-177-177-177-177 |
| TEC | 15 | constant MFR of 20.65 cm3/10 min | 40-155-176-176-176-176 |
| PEG | 2, 5, 10, 15 | constant temperature | 40-155-185-185-185-185 |
| PEG | 2 | constant MFR of 20.65 cm3/10 min | 40-155-182-182-182-182 |
| PEG | 5 | constant MFR of 20.65 cm3/10 min | 40-155-180-180-180-180 |
| PEG | 10 | constant MFR of 20.65 cm3/10 min | 40-155-177-177-177-177 |
| PEG | 15 | constant MFR of 20.65 cm3/10 min | 40-155-176-176-176-176 |
| Plasticiser | Concentration/wt.% | Onset Temperature/°C |
|---|---|---|
| no plasticiser | 0 | 300 |
| TEC | 2 | 257 |
| TEC | 5 | 261 |
| TEC | 10 | 264 |
| TEC | 15 | 268 |
| PEG | 2 | 209 |
| PEG | 5 | 171 |
| PEG | 10 | n.a. |
| PEG | 15 | 292 |
| Plasticiser | Concentration/wt.% | Temperature/°C |
|---|---|---|
| no plasticiser | 0 | 185 |
| TEC | 2 | 180 |
| TEC | 5 | 179 |
| TEC | 10 | 177 |
| TEC | 15 | 176 |
| PEG | 2 | 182 |
| PEG | 5 | 180 |
| PEG | 10 | 177 |
| PEG | 15 | 176 |
| 3D-View (20 × 20) µm2 |  |  | |
| Top View (20 × 20) µm2 | 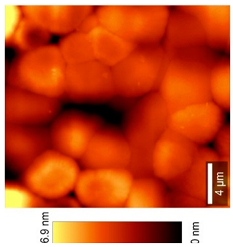 | 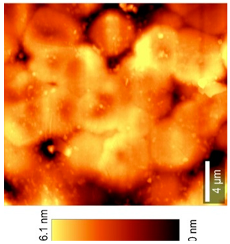 | |
| 3D-View (50 × 50) µm2 | 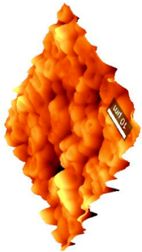 | 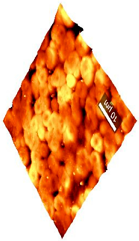 | |
| Top View (50 × 50) µm2 | 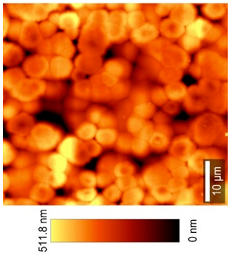 | 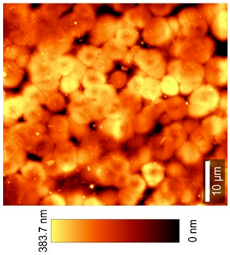 | |
| Sample | pure PHBV | 2 wt.% TEC, MFR = const. | |
| 3D-View (20 × 20) µm2 | 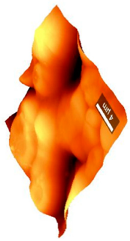 |  | 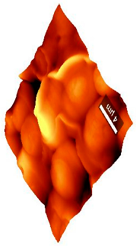 |
| Top View (20 × 20) µm2 | 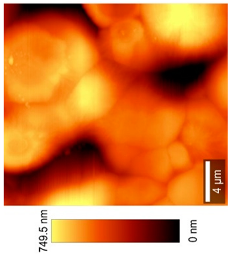 | 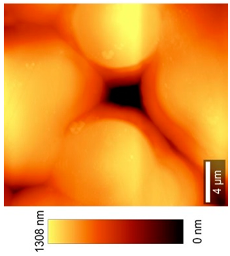 | 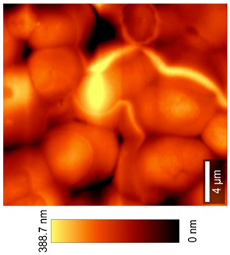 |
| 3D-View (50 × 50) µm2 |  | 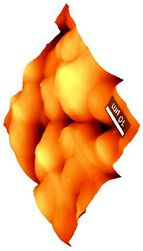 |  |
| Top View (50 × 50) µm2 | 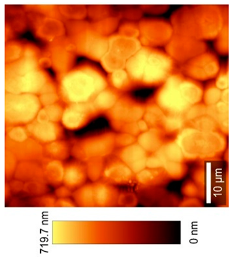 |  | 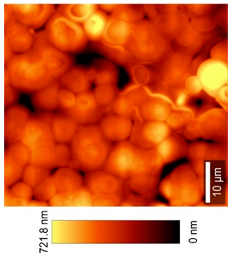 |
| Sample | 5 wt.% TEC, MFR = const. | 10 wt.% TEC, MFR = const. | 15 wt.% TEC, MFR = const. |
| 500 × magnification |  |  | |
| Histogram of Size Distribution | 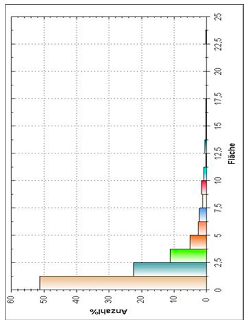 | 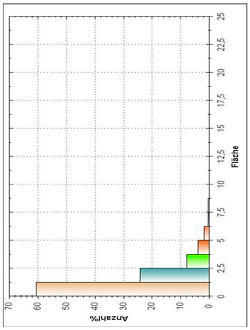 | |
| 200 × Magnification | 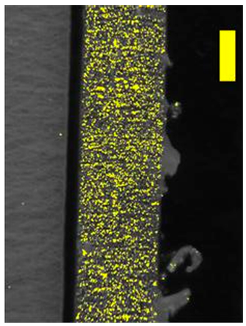 | 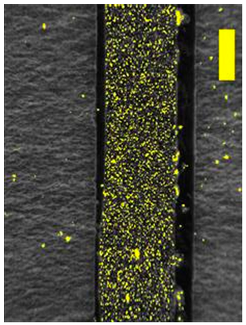 | |
| Sample | pure PHBV | 2 wt.% TEC, MFR = const. | |
| 500 × Magnification | 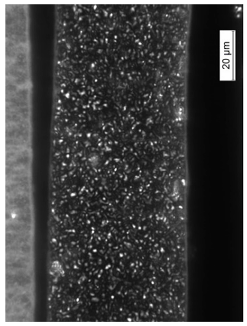 | 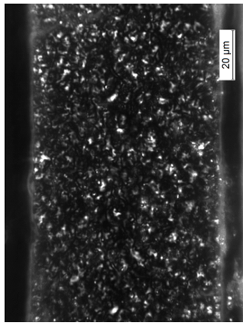 | 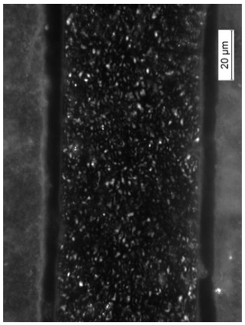 |
| Histogram of Size Distribution | 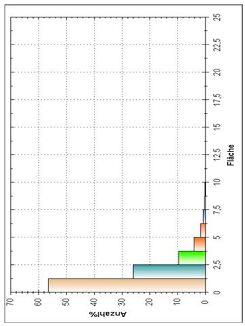 | 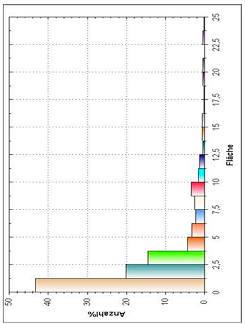 |  |
| 200 × Magnification | 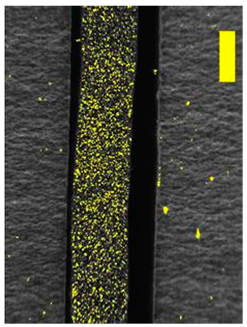 | 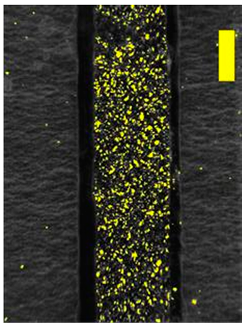 | 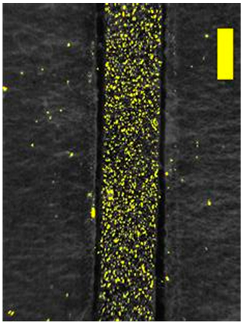 |
| Sample | 5 wt.% TEC, MFR = const. | 10 wt.% TEC, MFR = const. | 15 wt.% TEC, MFR = const. |
| Magnification | |||
|---|---|---|---|
| ×900–×1000 | ×500 | ×200 | |
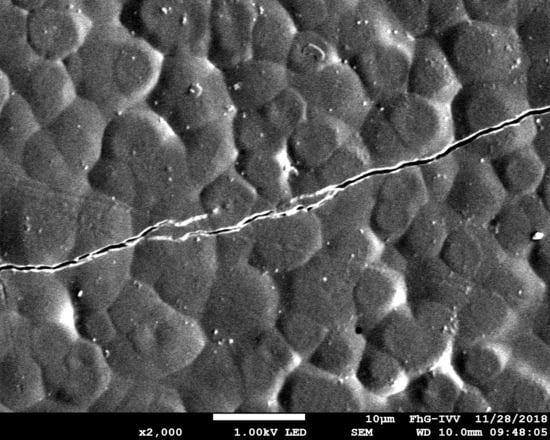
| Pure PHBV | 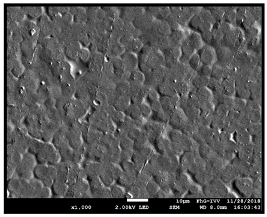 | 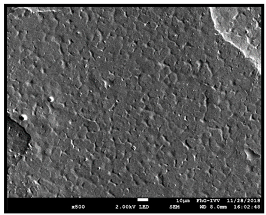 |  |
| 2 wt.% TEC | 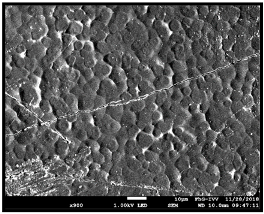 |  | 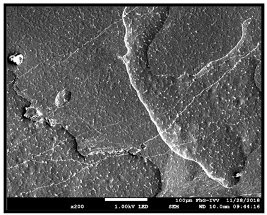 |
| 10 wt.% TEC | 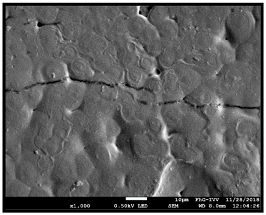 |  | 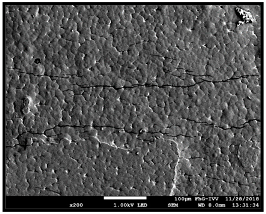 |
© 2019 by the authors. Licensee MDPI, Basel, Switzerland. This article is an open access article distributed under the terms and conditions of the Creative Commons Attribution (CC BY) license (http://creativecommons.org/licenses/by/4.0/).
Share and Cite
Sängerlaub, S.; Brüggemann, M.; Rodler, N.; Jost, V.; Bauer, K.D. Extrusion Coating of Paper with Poly(3-hydroxybutyrate-co-3-hydroxyvalerate) (PHBV)—Packaging Related Functional Properties. Coatings 2019, 9, 457. https://doi.org/10.3390/coatings9070457
Sängerlaub S, Brüggemann M, Rodler N, Jost V, Bauer KD. Extrusion Coating of Paper with Poly(3-hydroxybutyrate-co-3-hydroxyvalerate) (PHBV)—Packaging Related Functional Properties. Coatings. 2019; 9(7):457. https://doi.org/10.3390/coatings9070457
Chicago/Turabian StyleSängerlaub, Sven, Marleen Brüggemann, Norbert Rodler, Verena Jost, and Klaus Dieter Bauer. 2019. "Extrusion Coating of Paper with Poly(3-hydroxybutyrate-co-3-hydroxyvalerate) (PHBV)—Packaging Related Functional Properties" Coatings 9, no. 7: 457. https://doi.org/10.3390/coatings9070457
APA StyleSängerlaub, S., Brüggemann, M., Rodler, N., Jost, V., & Bauer, K. D. (2019). Extrusion Coating of Paper with Poly(3-hydroxybutyrate-co-3-hydroxyvalerate) (PHBV)—Packaging Related Functional Properties. Coatings, 9(7), 457. https://doi.org/10.3390/coatings9070457


