Article

Thermal Stability of YSZ Coatings Deposited by Plasma Spray–Physical Vapor Deposition

1
The Key Laboratory of Inorganic Coating Materials CAS, Shanghai Institute of Ceramics, Chinese Academy of Science, Shanghai 201899, China
2
Center of Materials Science and Optoelectronics Engineering, University of Chinese Academy of Sciences, Beijing 100049, China
*
Authors to whom correspondence should be addressed.
Coatings 2019, 9(8), 464; https://doi.org/10.3390/coatings9080464
Submission received: 18 April 2019 / Revised: 19 July 2019 / Accepted: 22 July 2019 / Published: 24 July 2019
(This article belongs to the Special Issue Science and Technology of Thermal Barrier Coatings)

Abstract

:
The plasma spray–physical vapor deposition (PS–PVD) process has received considerable attention due to its non-line of sight deposition ability, high deposition rates, and cost efficiency. Compared with electron beam–physical vapor deposition (EB–PVD), PS–PVD can also prepare thermal barrier coatings (TBCs) with columnar microstructures. In this paper, yttria-stabilized zirconia (YSZ) coatings were fabricated by PS–PVD. Results showed that the as-deposited coating presented a typical columnar structure and was mainly composed of metastable tetragonal (t′-ZrO2) phase. With thermal exposure, the initial t′ phase of YSZ evolved gradually into monoclinic (m-ZrO2) phase. Significant increase in hardness (H) and the Young’s modulus (E) of the coating was attributed to the sintering effect of the coating during the thermal exposure, dependent on exposure temperature and time. However, the values of H and E decreased in the coatings thermally treated at 1300–1500 °C for 24 h, which is mainly affected by the formation of m-ZrO2 phase.

1. Introduction

In recent years, to improve the service temperature of the hot section of an aircraft engine, besides cooling gas film, thermal barrier coatings (TBCs) consisting of an oxidation-resistant metallic bond coat and a thermally insulating ceramic topcoat of yttria-stabilized zirconia (YSZ) have been applied due to their low thermal conductivity and high thermal expansion coefficient [1,2,3,4]. At present, air plasma spraying (APS) and electron beam–physical vapor deposition (EB-PVD) are the two main technologies that are used for TBC deposition [5]. However, both of the above technologies exhibit limitations. YSZ coatings prepared by the APS process have a typical layered microstructure with a large number of interfaces, micro-cracks and pores, which contribute to low thermal conductivity and poor thermal shock resistance [6]. Different from the APS case, TBCs with super strain tolerance and improved spallation lifetime with high thermal conductivity can be obtained through the EB–PVD process. This is because of the columnar microstructure with an inter-columnar gap that is perpendicular to the top-coat/bond-coat interface [7,8].
To meet the increasing temperature demands of engines, coatings with better thermal insulation and high strain tolerance are preferred. Recently, many efforts have been devoted to investigating plasma spray–physical vapor deposition (PS–PVD) TBCs with various microstructures, including dense coatings, PVD-like columnar coatings, nano-sized solid clusters columnar coatings (quasi-PVD) and mixed microstructure coatings [9,10,11,12,13]. As we know, PS–PVD combines the advantages of APS (high deposition rate and cost efficiency) and EB–PVD (the ability to produce columnar structured coatings). TBCs with the initially favorable columnar microstructure can be prepared by PS–PVD, which combines the high thermal insulating property of the APS coatings and the high strain tolerance of the EB–PVD coatings [9,10,11]. Therefore, many existing results show that the PS–PVD process has the promising potential to fabricate durable YSZ coatings.
It is noted that YSZ TBCs must be exposed to high temperature during harsh service and their thermal stability is a key factor for evaluating the performance of the coatings. As a consequence, the ceramic top-coat may be exposed to high temperatures for a long time, which has great influence on the phase composition, microstructure and mechanical properties. It has been reported that thermal insulation ability and strain tolerance of the as-sprayed TBCs dramatically decreased upon annealing at high temperature because of the micro-cracks and pores healing during the sintering process [14,15,16]. The initial metastable tetragonal (t′-ZrO2) phase is the main phase of the as-sprayed TBCs, which is believed to be a direct consequence of both the slow diffusion rate of Y3+ ions and a small driving force [17]. The t′-ZrO2 phase could toughen the ceramic by re-orienting its c-axis in crystal cells and absorbing fracture energy to increase the resistance to cracking [18]. The t′-ZrO2 phase is not the equilibrium phase, and transforms to equilibrium tetragonal (t-ZrO2) and cubic (c-ZrO2) phase at high temperature. Upon further cooling, the newly precipitated t-ZrO2 will transform to monoclinic (m-ZrO2) phase. Moreover, the T/M phase transformation will cause cracking due to the huge volume change (approximately 5%) caused by the large density difference between T and M phases [19]. For these reasons, it is necessary to qualitatively analyze the phase and microstructural stability at high temperature and their relation to mechanical properties. However, research on the relationship between phase degradation and properties in PS–PVD YSZ TBCs at high temperature is rarely reported. Therefore, in the current work, with the aim of studying the durability of the PS–PVD coatings, the effect of exposure time and temperature on the high-temperature stability of PS–PVD YSZ coatings will be evaluated. Thermal stability is investigated through the evolution of phase composition, microstructure, and mechanical properties under various temperatures and times. This basic research might provide some useful insight for beneficial adjustments and further improvements to the performance of PS–PVD YSZ TBCs.

2. Materials and Methods

2.1. Preparation and Heat Treatment of PS–PVD Coating

The as-deposited YSZ coatings with a thickness of about 310 μm were fabricated on polished graphite substrates (50 mm in length, 10 mm in width, and 10 mm in thickness) using a PS–PVD system (Oerlikon Metco, Wohlen, Switzerland) using an O3CP-type plasma gun with a 60CD powder feeder. An agglomerated ZrO2–(6–8 wt.%) Y2O3 powder (YSZ, Metco 6700) was used as feedstock; the particle size range was 5–22 μm. Prior to depositing the TBC, the polished graphite substrates were preheated by plasma flame flow. The detailed spraying parameters are listed in Table 1.
The free-standing samples used for thermal aging treatment were stripped from graphite substrates through the mismatch between the expansion coefficients of the substrate and coating. Free-standing YSZ coatings were isothermally heat-treated in a high-temperature chamber furnace (HTK 20/17, ThermConcept, Bremen, Germany) at 1200–1600 °C for 24 h and at 1550 °C for 20–100 h, respectively. Free-standing YSZ coating samples were put in a furnace and heated at about 10 °C/min to the target temperature, followed by holding for the selected time. Then, the samples were cooled naturally in the furnace to room temperature. All of the free-standing coating samples were placed in vacuum with epoxy, cut to supply the observation of the cross-sections, and finely polished by routine metallographic methods.

2.2. Coating Characterization

X-ray diffraction (XRD) and Raman spectroscopy (RS) were used to characterize the phase composition of the as-deposited and isothermally heated coating samples. XRD measurements were performed on the X-ray diffractometer (D/Max 2550 V, Rigaku, Tokyo, Japan) operating in the reflection mode with Cu-Kα radiation (40 kV, 100 mA), using a step scan mode with the step of 0.02° (2θ) and 1 s per step. A Raman microscope system (Invia, Renishaw, Glouchestershire, UK) was used to record Raman spectra at the room temperature with a 532 nm laser excitation. Microstructures and grain size of the heat-treated samples together with the as-deposited coating samples were characterized by a scanning electron microscope (SEM, MIRA3 LM, TESCAN, Brno, Czech Republic) in backscattered electron image mode. A rectangular intercept method on secondary electron images which recorded the fracture surfaces of the coatings was used for measuring the grain size of the coatings. The average grain size, D, was then given by:
D = 4 A π ( n i + n o 2 )
where A is the rectangle area, ni and no are the grain numbers in the rectangle and on the rectangular boundary, respectively [20]. The number and magnification of the as-sprayed coating micrographs employed for grain size measurements were 10 and 100,000 times, those of the coatings which were heat-treated in air were 10 and 10,000 times. Hardness (H) and Young’s Modulus (E) of all coatings were measured on the cross-section before and after thermal treatment through a G-200 nanoindenter (Agilent Technologies, Oak Ridge, TN, USA) equipped with a Berkovich indenter. Specific test schemes are listed in the literature [21].

3. Results and Discussion

3.1. Microstructure

The microstructure of the as-deposited PS–PVD coatings with the fracture surface and polished cross-section are shown in Figure 1. The PS–PVD coatings exhibited a distinctive microstructure with relatively independent columns perpendicular to the coating surface. Additionally, a lot of nanoparticles (2 μm on average size) were observed, which were an accumulation of unmelted and partially melted feedstock powder particles at long spray distance due to the plasma jet’s heating capability [22]. The columnar structure can provide a high strain tolerance due to the gaps between the columns, which is similar to the EB–PVD coatings [23].
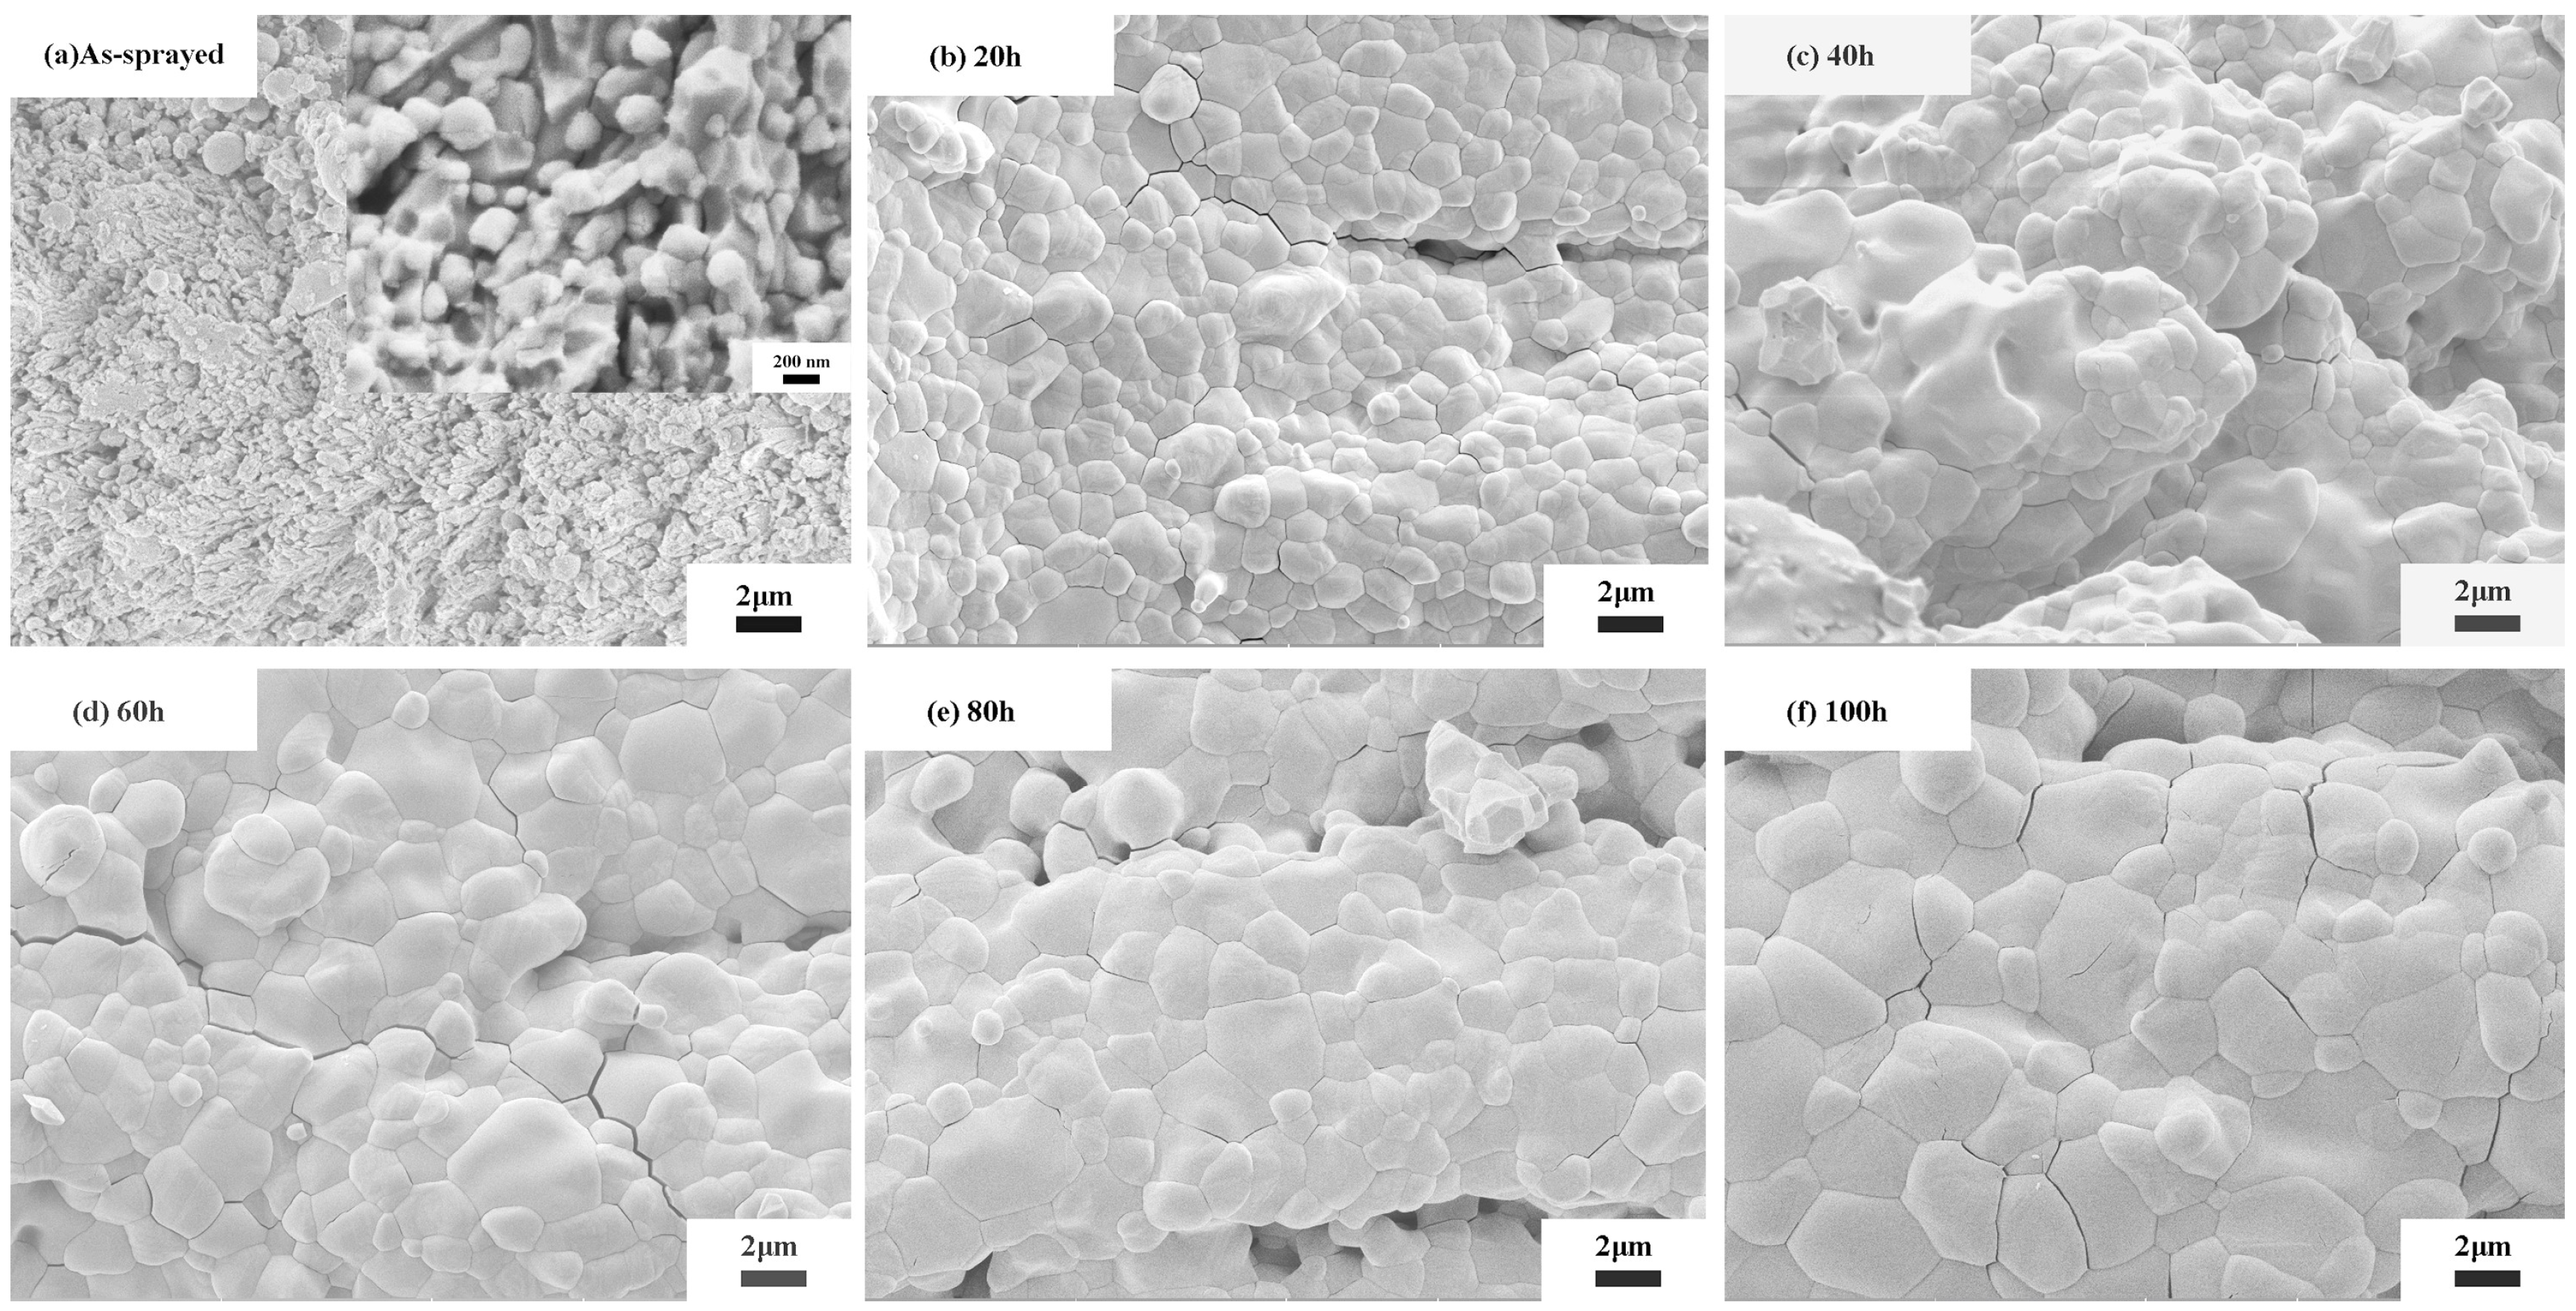
Figure 2 and Figure 3 are the SEM diagrams of grain growth of PS–PVD columnar coatings, which were heat-treated in air at 1200–1600 °C for 24 h and at 1550 °C for 20–100 h, respectively. An apparent increasing trend in grain size can be observed with increasing heat-treatment temperature and time from Figure 2 and Figure 3. It can be seen that the grain size of as-deposited columnar coating is very fine, and is about 100 nm. After 1500 °C/24 h or 1550 °C/20 h, the grains grew obviously, and a clear crystal boundary was formed between the grains. Figure 2 shows that the grain growth rate improves significantly with increasing heat-treatment temperature. The grain growth was fast at high temperature, while it was slow at low temperature, indicating that the effect of temperature on grain growth rate was very obvious. Figure 3 shows the grain growth was quick during the initial stage and slower after 20 h. It can be deduced that the temperature dominated the grain growth of YSZ columnar coatings, rather than heating duration.
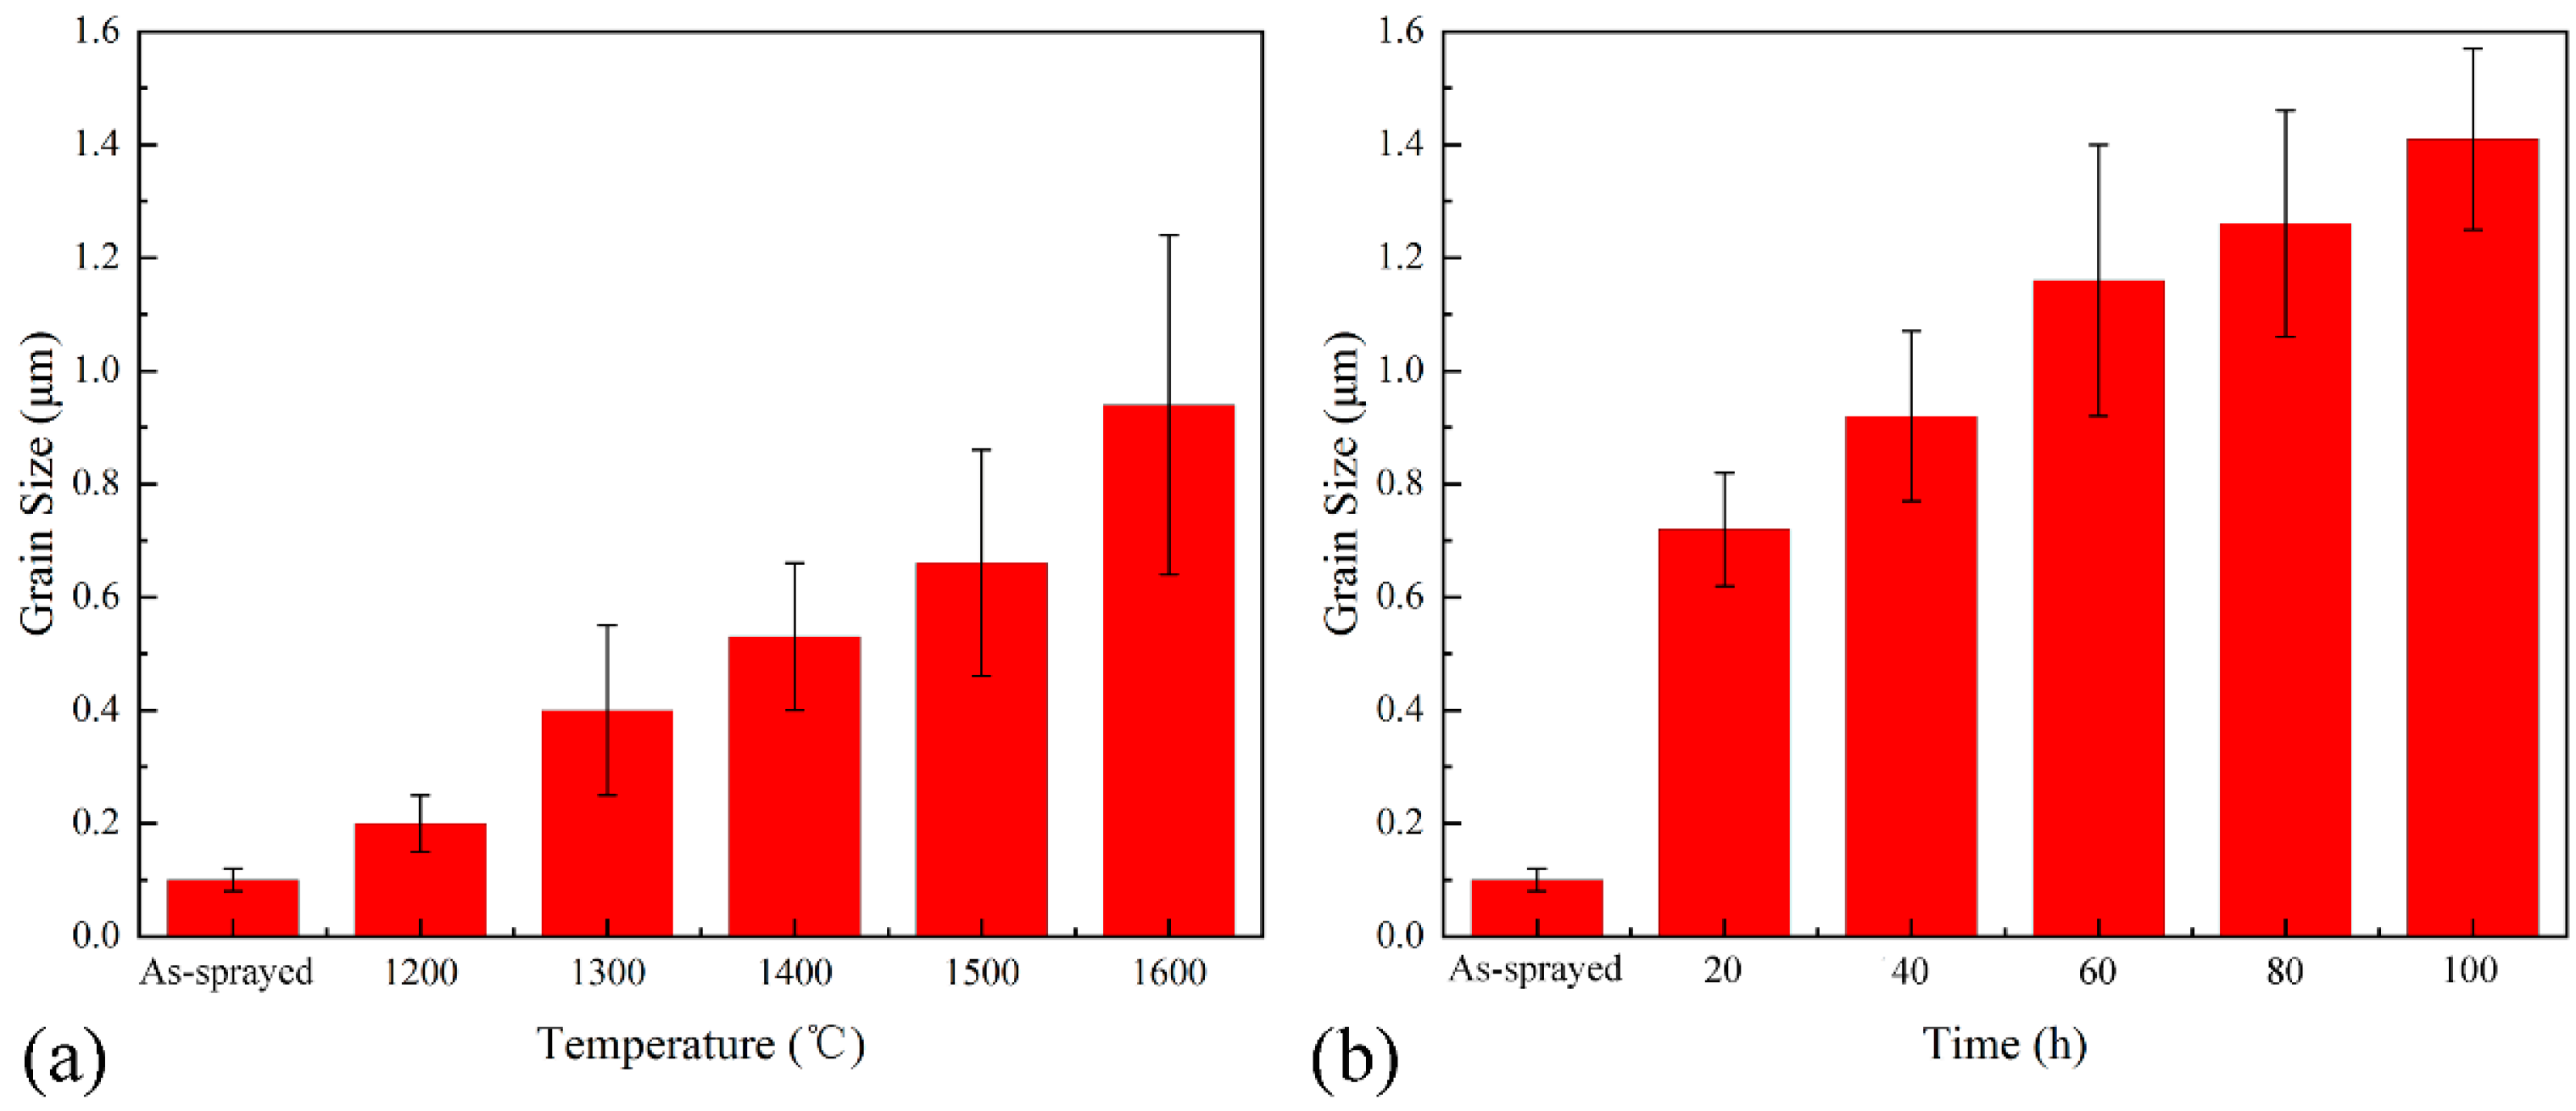
For a more intuitive description of grain change, grain size measured by image analysis is plotted in Figure 4. The average grain size increased up to 0.94 ± 0.3 μm after 1600 °C/24 h heat-treatment, which was about 9.4 times larger than that of the as-deposited coatings. After 1550 °C/100 h heat-treatment, the average grain size grew up to 1.41 ± 0.16 μm, which was about 14 times larger than that of the as-deposited coatings. According to thermodynamic conditions, the larger the grain size, the smaller the total grain boundary surface area and the lower the total surface energy. Because grain coarsening can reduce surface energy and bring the material into a more stable state with low free energy, grain growth was a spontaneous change. To realize this change, it is necessary for the atoms to have strong diffusion ability to complete the grain boundary migration when the grains grew. The higher heating temperature is enabling this ability.
The polished cross-sections of the PS–PVD coatings after heat treatment at various temperatures for 24 h and at 1550 °C for different times were inspected via SEM to characterize the microstructure evolution process. The micrographs of the PS–PVD coatings are shown in Figure 5 and Figure 6. There were significant differences between the as-deposited coatings and the heat-treated coatings. Large gaps existed between the columnar features in the as-deposited coatings, and those gaps became narrower after heat treatment. Particles at the edge of the columns were in contact with each other, and sintered together during the heat treatment. The nanoparticles between the columns promoted the diffusion between adjacent columns. Compared with the as-deposited YSZ coating, the feather-like structure disappeared, the columns became smooth, the grain size coarsened, and the fine grains of the feather-like structure disappeared because of strong diffusion at high temperature. In addition, micro pores were not observed in the as-deposited columns until these columns underwent high-temperature annealing at 1200–1600 °C with an exposure time from 20 to 100 h. The formation mechanism of micro pores may be the aggregation of vacancies in columns during high-temperature annealing [24]. Vacancy aggregation led to the collapse of the lattice and the formation of pores, which led to the decrease of vacancy concentration in the crystal. To maintain the equilibrium concentration of vacancies in the crystal, new vacancies will be generated. Vacancy proliferation and vacancy aggregation promoted each other. The formation of vacancy clusters made the atoms near the grain boundary diffuse.

3.2. Phase Transformation

To further understand the thermally induced morphological and composition evolution of the PS–PVD YSZ coatings, Raman spectroscopy (RS) was used to detect the phase compositions. Five bands at 147, 267, 322, 463 and 642 cm−1 correspond to the Raman-active modes of tetragonal phase, while the peaks at 178, 189, 221, 308, 334, 346, 382, 476,503, 539, 559, 615 and 637 cm−1 are the characteristic bands of monoclinic phase [25,26]. Figure 7, Figure 8 and Figure 9 show the XRD patterns and Raman spectra of the coatings. The results indicate that the main phase of the as-deposited coatings was t-ZrO2, which indicates that the coating was mainly formed by vapor mixture of zirconia and yttrium oxide. Figure 8 shows that t-ZrO2 of the as-sprayed coating is the non-transformable metastable phase (t′-ZrO2). A small quantity of m-ZrO2 also existed in the as-deposited YSZ coatings. As the feedstock powder is an agglomeration of monoclinic zirconia and cubic yttria (not pre-alloyed yttria-stabilized zirconia), it is inferred that there were some unmelted or unevaporated feedstock powder particles directly incorporated and solidified in the coating [22]. The results show that t-ZrO2 and m-ZrO2 coexisted in the YSZ coatings after high-temperature exposure. This indicates that temperature played the most important role in the extent of the phase transformation. At 1550 °C, the phase transformation from t-ZrO2 to m-ZrO2 occurred over a short period of time, indicating that the temperature was a stronger promoter of phase transformation than time.

3.3. Mechanical Properties

After high-temperature heat treatment, the microstructure, including grain size, cracks and pores, of the YSZ coatings changed significantly, and the mechanical properties of the YSZ coatings also changed accordingly. Hardness (H) and Young’s Modulus (E) are very important mechanical properties for YSZ coatings under long-term service conditions at high temperature. Previous studies in TBCs have reported that the Young’s modulus measured on the cross-section was 1.3 times higher than that on the plan-section [27]. Because PS–PVD coatings have a typical columnar microstructure, the mechanical properties measured on the surface and cross-section are not the same, so the nanoindentation method under identical conditions was used to measure the variation of H and E on the polished cross-section of the coating.
As shown in Figure 10a, the average H and E values of the coating before thermal exposure were 6.7 ± 1.6 GPa and 95.5 ± 13.7 GPa, respectively. In the process of variable temperature and constant time (24 h) heat treatment, H increased obviously up to 1300 °C, and then decreased with further temperature enhancement. The highest H value of the coatings was 15.6 ± 1.0 GPa, after heat treatment in air at 1300 °C for 24h, which was increased by 133% compared to the as-deposited coating. In addition, there was then a continuous decrease of H value until 1500 °C; after that, a constant average H value can be observed with further increase of the heat treatment temperature. Concerning E results, the E value of the YSZ coating increased significantly to a maximum of 203.8 ± 22.7 GPa, about 113% higher than that of the as-deposited coating, and then the E value gradually decreased to a constant value. Figure 10b shows the measured H and E values as a function of exposure time for PS–PVD coatings before and after heat treatment at 1550 °C. The H and E values increased first and then remained stable. The H and E values of the coating after being heat-treated at 1550 °C for 60 h reached maximum values of 11.1 ± 1.7 GPa and 188.4 ± 19.3 GPa, respectively, representing increases by approximately 66% and 97%, respectively, compared to the as-deposited coating. Similar trends of the H and E values of coatings have been reported previously; in particular, Zhao et al. found that in axial suspension plasma spraying (ASPS) YSZ TBCs, the mechanical properties firstly increased significantly with sintering, and then decreased with prolonged thermal aging time, which was caused by a t-ZrO2 → m-ZrO2 phase transformation after thermal exposure at 1550 °C for 60 h [21]. Sintering can increase the H and E values due to thermal exposure, which has been reported for APS, ASPS and EB–PVD coatings [27,28,29]. For example, Zhao et al. showed that the H and E values of ASPS TBCs increased by about 50% and 44% on the cross-section after 1300 °C/24 h exposure in air [21]. An early study on a plasma-sprayed TBC also reported that the E value of the ceramic coating increased after exposure, which was attributed to the healing of pores and grain growth and the improvement in bonding and coherence across the splat boundary during exposure at high temperature as a result of the sintering effect [30]. In the present study, the microstructure evolution of PS–PVD TBCs after heat treatment from 1200 to 1600 °C for 24 h and at 1550 °C for 20–100 h is similar to the above-mentioned studies.
Figure 2, Figure 3, Figure 5 and Figure 6 schematically show that grain growth and the closer contact between single columns after thermal exposure lead to a stiffer structure, and thus should create a higher hardness and Young’s modulus, resulting from the sintering effect of PS–PVD TBCs during thermal exposure. The sintering effect during the first 20 or 24 h was much more important, especially at 1300 °C, than the later stage of heat treatment, producing a sharp increase in the mechanical properties. The theoretical equation between porosity and Young’s modulus (E) in porous material can be given as follows:
E = E 0 exp [ ( b p + c p 2 ) ]
where p, E and E0 are the porosity, and the Young’s modulus of porous material and dense material, respectively. The terms b and c are empirical values depending on pore morphology [31]. The above formula illustrates that the Young’s modulus of porous material decreases with increasing porosity. Therefore, the E value of the YSZ coating after heat treatment at 1300 °C/24 h reached the highest point due to its having the lowest porosity. Previous literature has reported that the phase transformation from t-ZrO2 to m-ZrO2 will cause cracking due to the huge volume change (approximately 5%) [19]. In combination with Figure 5, Figure 7 and Figure 9, lots of pores and cracks formed between the grain boundaries with increasing exposure temperature for 24 h caused by the formation and accumulation of m-ZrO2 phase. Thus, it is reasonable to conclude that the initial increase in the measured hardness and Young’s modulus were attributable to a stiffer structure induced by sintering after thermal exposure, and the mechanical properties decreased obviously due to the m-ZrO2 phase formation accompanied by volume expansion and micro cracks formation.

4. Conclusions

The microstructure, phase transformation and mechanical properties of PS–PVD YSZ TBCs have been examined before and after exposure at 1200–1600 °C for 24 h and at 1550 °C for 20–100 h in air. PS–PVD TBCs showed a typical columnar structure with porosity between the individual columns before thermal exposure. Conclusions are summarized as follows:
  • After thermal exposure, the columnar structure degraded and micro pores were generated in the columns, resulting in a close contact of columns as a result of sintering effect.
  • After high-temperature exposure for a long time, the initial t-ZrO2 phase of PS–PVD YSZ TBCs evolved gradually into m-ZrO2 and cracks form between the grain boundaries with increasing exposure temperature caused by the formation and accumulation of m-ZrO2 phase.
  • The significant improvement of hardness and Young’s modulus of the coatings were attributed to a stiffer structure caused by the sintering effect during the thermal exposure at 1200–1300 °C for 24 h and 1550 °C for 20–100 h. For coatings exposed at different temperatures for 24 h, the hardness and Young’s modulus decreased in the range of 1300–1500 °C, which is caused by the generation of micro cracks accompanied with the formation of m-ZrO2 phase.

Author Contributions

Conceptualization, Z.C. and S.T.; Data Curation, Z.C., X.Z., H.Z., Y.Z. and J.N.; Formal Analysis, Z.C. and F.S.; Writing—Original Draft Preparation, Z.C.; Writing—Review & Editing, J.Y. and S.T.

Funding

This research was funded by Fundamental Research of Aero-engine and Combustion Gas Turbine Major Special Project (No. 2017-VI-0010-0082), National Natural Science Foundation of China (NSFC) (No. 51701235), Science and Technology Innovation of Shanghai (No. 18511108702) and Natural Science Foundation of Shanghai (No. 17ZR1412200).

Conflicts of Interest

The authors declare no conflict of interest.

References

  1. Padture, N.P.; Gell, M.; Jordan, E.H. Thermal barrier coatings for gas-turbine engine applications. Science 2002, 296, 280–284. [Google Scholar] [CrossRef] [PubMed]
  2. Ganvir, A.; Markocsan, N.; Joshi, S. Influence of isothermal heat treatment on porosity and crystallite size in axial suspension plasma sprayed thermal barrier coatings for gas turbine applications. Coatings 2017, 7, 4. [Google Scholar] [CrossRef]
  3. Parks, W.P.; Hoffman, E.E.; Lee, W.Y.; Wright, I.G. Thermal barrier coatings issues in advanced land-based gas turbines. J. Therm. Spray Technol. 1997, 6, 187–192. [Google Scholar] [CrossRef] [Green Version]
  4. Smialek, J.L.; Miller, R.A. Revisiting the birth of 7YSZ thermal barrier coatings: Stephan Stecura . Coatings 2018, 8, 225. [Google Scholar] [CrossRef]
  5. Montavon, G. Recent developments in thermal spraying for improved coating characteristics and new applications/process controls and spray processes. High Temp. Mater. Process. 2004, 8, 45–93. [Google Scholar] [CrossRef]
  6. Hass, D.D.; Slifka, A.J.; Wadley, H.N.G. Low thermal conductivity vapor deposited zirconia microstructures. Acta Mater. 2001, 49, 973–983. [Google Scholar] [CrossRef]
  7. Peichl, A.; Beck, T.; Vohringer, O. Behaviour of an EB–PVD thermal barrier coating system under thermal-mechanical fatigue loading. Surf. Coat. Technol. 2003, 162, 113–118. [Google Scholar] [CrossRef]
  8. Schulz, U.; Menzebach, M.; Leyens, C.; Yang, Y.Q. Influence of substrate material on oxidation behavior and cyclic lifetime of EB–PVD TBC systems. Surf. Coat. Technol. 2001, 146, 117–123. [Google Scholar] [CrossRef]
  9. Rezanka, S.; Mauer, G.; Vaßen, R. Improved thermal cycling durability of thermal barrier coatings manufactured by PS–PVD. J. Therm. Spray Technol. 2013, 23, 182–189. [Google Scholar] [CrossRef]
  10. Mauer, G.; Hospach, A.; Vaßen, R. Process development and coating characteristics of plasma spray-PVD. Surf. Coat. Technol. 2013, 220, 219–224. [Google Scholar] [CrossRef]
  11. Mauer, G.; Vaßen, R. Plasma spray–PVD: Plasma characteristics and impact on coating properties. J. Phys. Conf. Ser. 2012, 406, 012005. [Google Scholar] [CrossRef]
  12. Hospach, A.; Mauer, G.; Vaßen, R.; Stöver, D. Characteristics of ceramic coatings made by thin film low pressure plasma spraying (LPPS–TF). J. Therm. Spray Technol. 2012, 21, 435–440. [Google Scholar] [CrossRef]
  13. Hospach, A.; Mauer, G.; Vaßen, R.; Stöver, D. Columnar-structured thermal barrier coatings (TBCs) by thin film low-pressure plasma spraying (LPPS–TF). J. Therm. Spray Technol. 2010, 20, 116–120. [Google Scholar] [CrossRef]
  14. Paul, S.; Cipitria, A.; Tsipas, S.A.; Clyne, T.W. Sintering characteristics of plasma sprayed zirconia coatings containing different stabilisers. Surf. Coat. Technol. 2009, 203, 1069–1074. [Google Scholar] [CrossRef]
  15. Choi, S.R.; Zhu, D.M.; Miller, R.A. Effect of sintering on mechanical properties of plasma-sprayed zirconia-based thermal barrier coatings. J. Am. Ceram. Soc. 2005, 88, 2859–2867. [Google Scholar] [CrossRef]
  16. Zhu, D.M.; Miller, R.A. Sintering and creep behavior of plasma-sprayed zirconia- and hafnia-based thermal barrier coatings. Surf. Coat. Technol. 1998, 108, 114–120. [Google Scholar] [CrossRef]
  17. Clarke, D.R.; Levi, C.G. Materials design for the next generation thermal barrier coatings. Annu. Rev. Mater. Res. 2003, 33, 383–417. [Google Scholar] [CrossRef]
  18. Ren, X.; Pan, W. Mechanical properties of high-temperature-degraded yttria-stabilized zirconia. Acta Mater. 2014, 69, 397–406. [Google Scholar] [CrossRef]
  19. Chevalier, J.; Gremillard, L.; Virkar, A.V.; Clarke, D.R. The tetragonal-monoclinic transformation in zirconia: Lessons learned and future trends. J. Am. Ceram. Soc. 2009, 92, 1901–1920. [Google Scholar] [CrossRef]
  20. Luo, J.; Adak, S.; Stevens, R. Microstructure evolution and grain growth in the sintering of 3Y-TZP ceramics. J. Mater. Sci. 1998, 33, 5301–5309. [Google Scholar] [CrossRef]
  21. Zhao, Y.; Wang, L.; Yang, J.; Li, D.; Zhong, X.; Zhao, H.; Shao, F.; Tao, S. Thermal aging behavior of axial suspension plasma-sprayed yttria-stabilized zirconia (YSZ) thermal barrier coatings. J. Therm. Spray Technol. 2015, 24, 338–347. [Google Scholar] [CrossRef]
  22. He, W.; Mauer, G.; Gindrat, M.; Wäger, R.; Vaßen, R. Investigations on the nature of ceramic deposits in plasma spray–physical vapor deposition. J. Therm. Spray Technol. 2016, 26, 83–92. [Google Scholar] [CrossRef]
  23. Kulkarni, A.; Goland, A.; Herman, H.; Allen, A.J.; Dobbins, T.; DeCarlo, F.; Ilavsky, J.; Long, G.G.; Fang, S.; Lawton, P. Advanced neutron and X-ray techniques for insights into the microstructure of EB–PVD thermal barrier coatings. Mater. Sci. Eng. A 2006, 426, 43–52. [Google Scholar] [CrossRef]
  24. Dalach, P.; Ellis, D.E.; van de Walle, A. First-principles thermodynamic modeling of atomic ordering in yttria-stabilized zirconia. Phys. Rev. B 2010, 82, 144117. [Google Scholar] [CrossRef]
  25. Huang, W.; Yang, J.; Wang, C.; Zou, B.; Meng, X.; Wang, Y.; Cao, X.; Wang, Z. Effects of Zr/Ce molar ratio and water content on thermal stability and structure of ZrO2–CeO2 mixed oxides prepared via sol–gel process. Mater. Res. Bull 2012, 47, 2349–2356. [Google Scholar] [CrossRef]
  26. Stefanic, G.; Music, S.; Popovic, S.; Sekulic, A. FT-IR and laser Raman spectroscopic investigation of the formation and stability of low temperature t-ZrO2. J. Mol. Struct. 1997, 408, 391–394. [Google Scholar] [CrossRef]
  27. Guo, S. Young’s moduli of zirconia top-coat and thermally grown oxide in a plasma-sprayed thermal barrier coating system. Scripta Mater. 2004, 50, 1401–1406. [Google Scholar] [CrossRef]
  28. Guo, S.Q.; Kagawa, Y. Effect of thermal exposure on hardness and Young’s modulus of EB–PVD yttria-partially-stabilized zirconia thermal barrier coatings. Ceram. Int. 2006, 32, 263–270. [Google Scholar] [CrossRef]
  29. Zotov, N.; Bartsch, M.; Eggeler, G. Thermal barrier coating systems—Analysis of nanoindentation curves. Surf. Coat. Technol. 2009, 203, 2064–2072. [Google Scholar] [CrossRef]
  30. Thompson, J.A.; Clyne, T.W. The effect of heat treatment on the stiffness of zirconia top coats in plasma-sprayed TBCs. Acta Mater. 2001, 49, 1565–1575. [Google Scholar] [CrossRef]
  31. Jang, B.K.; Matsubara, H. Influence of porosity on hardness and Young’s modulus of nanoporous EB–PVD TBCs by nanoindentation. Mater. Lett. 2005, 59, 3462–3466. [Google Scholar] [CrossRef]
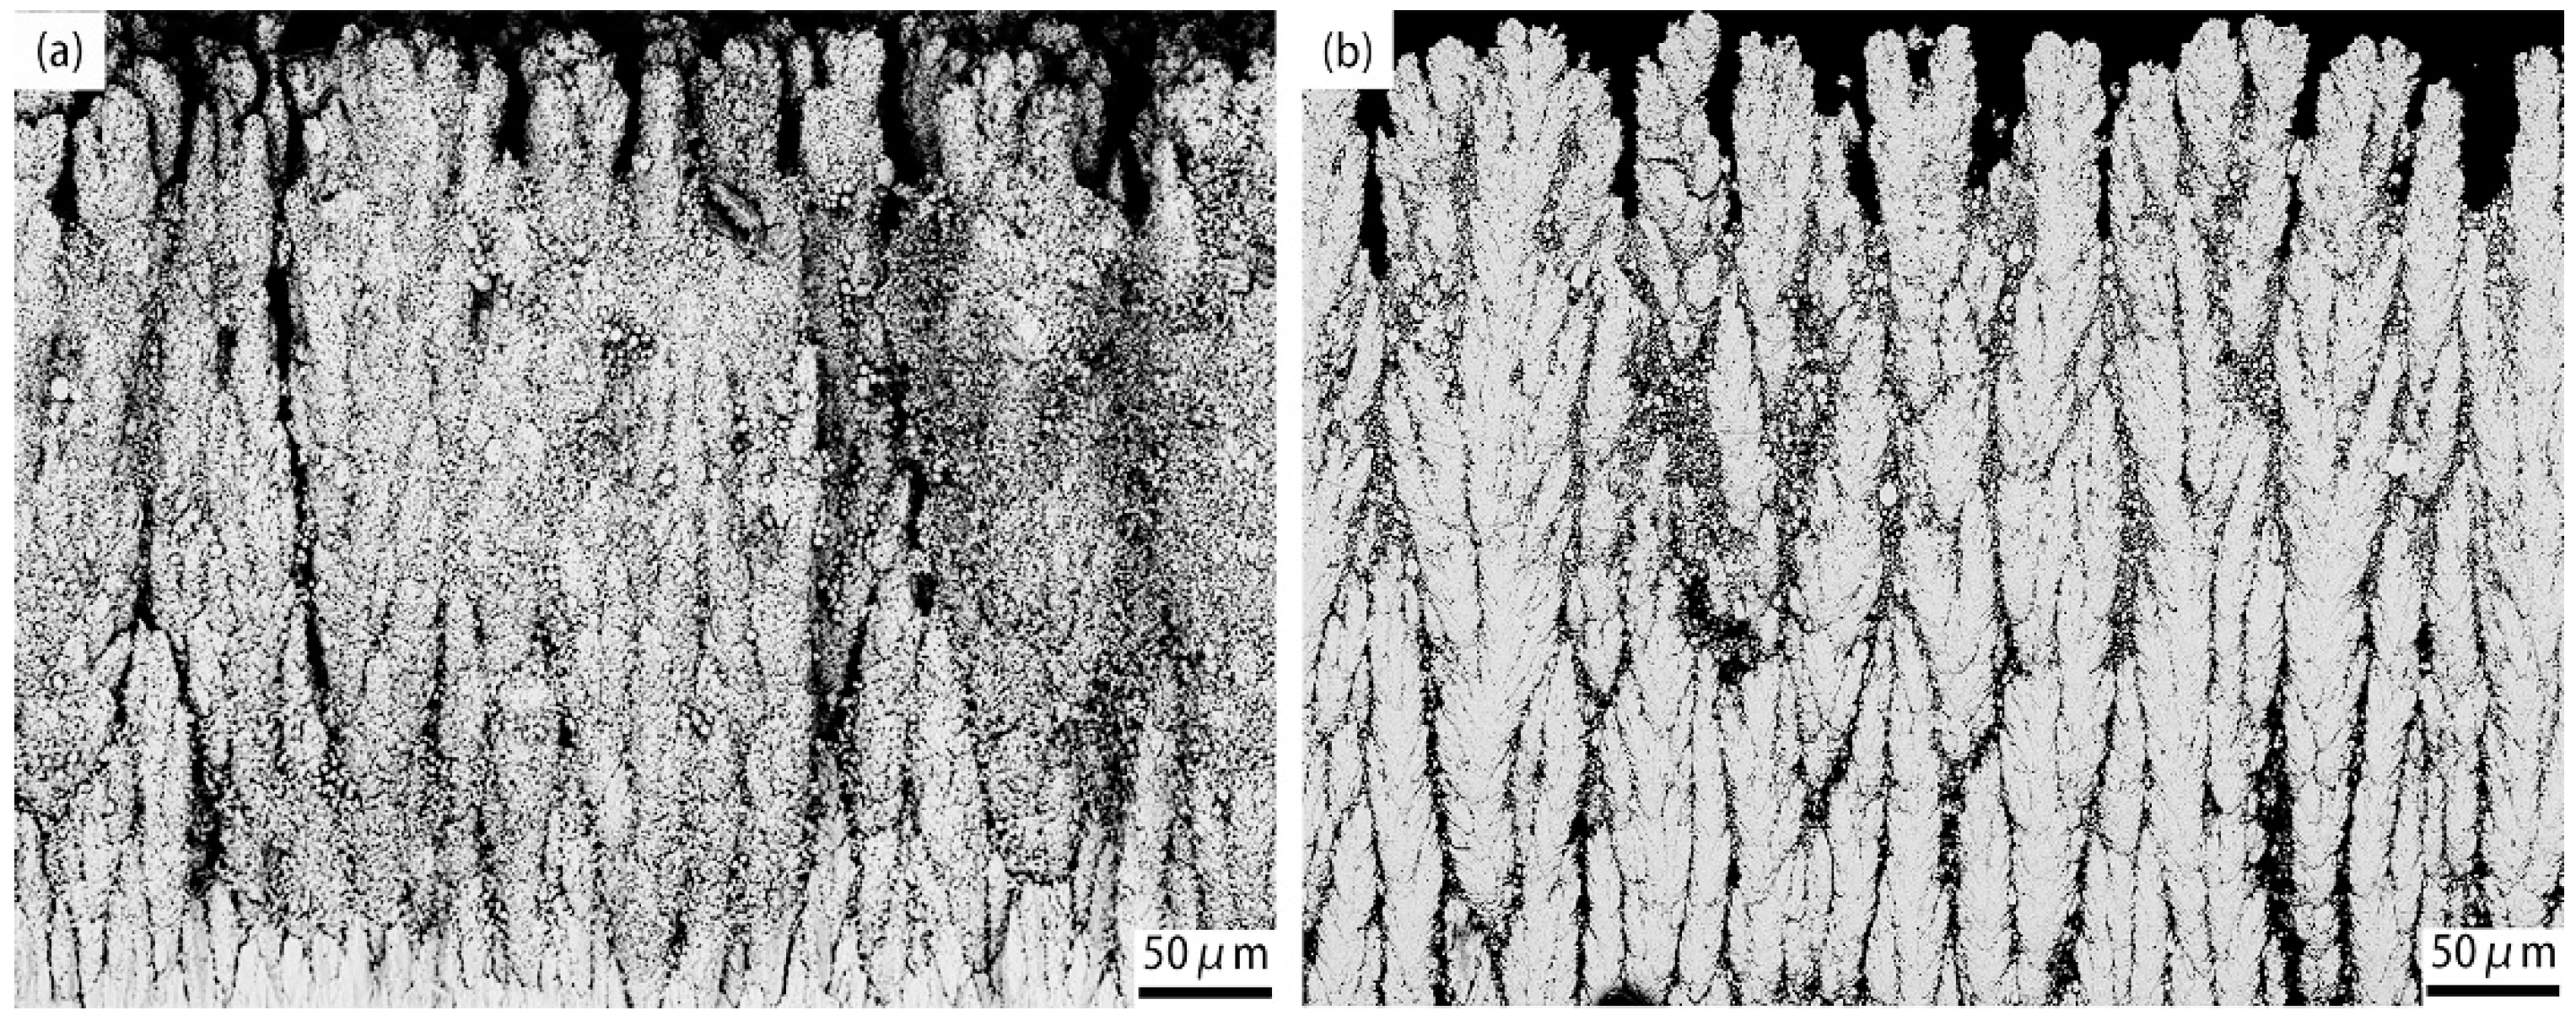
Figure 1. SEM micrographs of the as-sprayed PS–PVD TBCs: (a) fracture surface; (b) polished cross-section.
Coatings 09 00464 g001
Figure 2. SEM micrographs of fracture surface of PS–PVD TBCs as a function of temperature: (a) as-sprayed; (b) 1200 °C; (c) 1300 °C; (d) 1400 °C; (e) 1500 °C; (f) 1600 °C.
Coatings 09 00464 g002
Figure 3. SEM micrographs of fracture surface of PS–PVD TBCs as a function of time: (a) as-sprayed; (b) 20 h; (c) 40 h; (d) 60 h; (e) 80 h; (f) 100 h.
Coatings 09 00464 g003
Figure 4. Grain size of the as-sprayed coating and heat-treated coatings: (a) samples after heat-treatment for 24 h at different temperatures; (b) samples after heat-treatment at 1550 °C for different times.
Coatings 09 00464 g004
Figure 5. SEM micrographs of polished cross-sections of PS–PVD coatings as a function of temperature: (a) as-sprayed; (b) 1200 °C; (c) 1300 °C; (d) 1400 °C; (e) 1500 °C; and (f) 1600 °C.
Coatings 09 00464 g005
Figure 6. SEM micrographs of polished cross-sections of PS–PVD coatings as a function of time: (a) as-sprayed; (b) 20 h; (c) 40 h; (d) 60 h; (e) 80 h; and (f) 100 h.
Coatings 09 00464 g006
Figure 7. XRD patterns of the as-sprayed coating and heat-treated coatings: (a) samples after heat-treatment for 24 h at different temperatures; (b) samples after heat-treatment at 1550 °C for different times.
Coatings 09 00464 g007
Figure 8. XRD patterns of the as-sprayed coating with 2θ between 72° and 76°.
Coatings 09 00464 g008
Figure 9. Raman spectra of the as-sprayed coating and heat-treated coatings: (a) samples after heat-treatment for 24 h at different temperatures; (b) samples after heat-treatment at 1550 °C for different times.
Coatings 09 00464 g009
Figure 10. Hardness and Young’s modulus of the as-sprayed coating and the heat-treated coatings: (a) samples after heat-treatment for 24 h at different temperatures; (b) samples after heat-treatment at 1550 °C for different times.
Coatings 09 00464 g010
Table 1. Spray parameters for YSZ coatings by PS–PVD.
ItemsPreheating ParametersCoating Parameters
Plasma gas flow rate (slpm)Ar: 50, He: 110Ar: 35, He: 60
Power (kW)64130
Current (A)14002600
Feed rate (g/min)5
Spray distance (mm)800900
Oxygen flow rate (splm)2
Carrier gas (slpm)Ar: 6Ar: 8