Review

Overcoming Challenges and Limitations Regarding the Atomic Force Microscopy Imaging and Mechanical Characterization of Nanofibers

by
Stylianos Vasileios Kontomaris
1,2,*,
Andreas Stylianou
3,
Georgios Chliveros
1 and
Anna Malamou
4
1
Faculty of Engineering and Architecture, Metropolitan College, 15125 Athens, Greece
2
BioNanoTec Co., Ltd., Nicosia 2043, Cyprus
3
School of Sciences, European University Cyprus, Nicosia 2404, Cyprus
4
Independent Power Transmission Operator S.A. (IPTO), 10443 Athens, Greece
*
Author to whom correspondence should be addressed.
Fibers 2023, 11(10), 83; https://doi.org/10.3390/fib11100083
Submission received: 5 September 2023 / Revised: 25 September 2023 / Accepted: 5 October 2023 / Published: 9 October 2023
(This article belongs to the Special Issue Nanofibers: Biomedical Applications)

Abstract

:
Atomic force microscopy (AFM) is a powerful tool that enables imaging and nanomechanical properties characterization of biological materials. Nanofibers are the structural units of many biological systems and their role in the development of advanced biomaterials is crucial. AFM methods have proven to be effective towards the characterization of fibers with respect to biological and bioengineering applications at the nanoscale. However, both the topographical and mechanical properties’ nanocharacterizations of single fibers using AFM are challenging procedures. In particular, regarding imaging procedures, significant artifacts may arise from tip convolution effects. The geometrical characteristics of the AFM tip and the nanofibers, and the fact that they have similar magnitudes, may lead to significant errors regarding the topographical imaging. In addition, the determination of the mechanical properties of nanofibers is also challenging due to their small dimensions and heterogeneity (i.e., the elastic half-space assumption is not valid in most cases). This review elucidates the origins of errors in characterizing individual nanofibers, while also providing strategies to address limitations in experimental procedures and data processing.

1. Introduction

Atomic force microscopy (AFM) is a high-resolution imaging technique in nanotechnology and materials science, enabling visualization and manipulation of atomic and molecular surfaces [1,2,3,4]. Operating as a type of scanning probe microscopy, AFM provides intricate data on surface topography [5], roughness [6], and mechanical properties [7,8]. AFM utilizes a small, sharp probe attached to the end of a cantilever to scan samples, interacting through forces such as van der Waals, electrostatics, and chemical bonds [9]. As the probe traverses, vertical movement due to interaction forces generates topographic images. With contact, tapping, and non-contact modes, AFM offers versatility; contact maintains touch, tapping involves oscillation, and non-contact hovers slightly above the surface, measuring attractive forces [9]. AFM’s outstanding spatial resolution enables atomic-level visualizations, surpassing optical microscopes’ limits.
AFM finds applications in various fields, including biology and medicine [10], materials science [11], and physics [12]. It is even used to study individual molecules and their interactions [13,14]. In addition to imaging, AFM aids in nanomanipulation [14] and in determining the mechanical properties of single molecules [15] and nanofibers [16,17,18,19,20]. The determination of the mechanical and structural properties of individual nanofibers is crucial. A notable example highlighting their significance is the case of collagen. Collagens are the most abundant proteins in mammals [21,22,23,24,25,26]. Within the human body, approximately 28 distinct types of collagens exist, with significant focus placed on fibrillar collagens, particularly collagen type I [27,28]. Collagen type I stands as a predominant protein within the extracellular matrix [29], marked by distinctive attributes like self-assembly, biocompatibility, biodegradability, and non-toxicity [30].
Another example is a cellulose nanofibril, which is the fundamental unit of almost all types of natural fibers playing a significant role in shaping their mechanical properties [20]. Cellulose, a renewable biopolymer found abundantly in plant cell walls and bacteria, represents a promising alternative to petroleum-based resources [31,32,33]. Nanocellulose can be described as cellulose where at least one dimension (length, diameter, or height) falls within the nanoscale [34]. Among the various categories of nanocellulose, cellulose nanofibrils (CNFs) have consistently captivated researchers because of their exceptional properties. These properties encompass a substantial specific surface area, remarkable stiffness and strength, low weight, strong biocompatibility, and facile film-forming abilities [31,35]. In addition, an intriguing protein complex in the fibrous form is the amyloid fibril [36]. Numerous researchers have directed their attention towards the self-assembly of amyloid peptides and proteins at interfaces, providing valuable insights into understanding the mechanisms underlying certain neurodegenerative diseases [37]. The generation of fibrous particles is linked to various particular disorders (e.g., Alzheimer’s disease (AD) [38,39]).
Moreover, a significant focus has recently emerged in exploring methods for fabricating nanofibers from various materials through the utilization of electrospinning. The building blocks of many human organs and tissues have structural similarities with nanofibers, which is advantageous for the use of electrospun nanofibers in repairing human tissues and organs [40]. Many materials used in electrospinning exhibit favorable biocompatibility and degradability properties, rendering them suitable for use as carriers for drugs [40]. Electrospun nanofibers offer promising opportunities in the fields of tissue repair [41,42], biological dressings [43,44], controlled drug release [40,45,46], and enzyme immobilization [40].
As already presented in previous paragraphs, the exploration of nanofiber properties is crucial in various fields such as biology, medicine, bioengineering, and materials science. A strong tool for the determination of nanofibers’ properties is AFM. AFM’s capabilities encompass visualizing nanofibrils with remarkable precision, unravelling their surface morphology and mechanical properties [47]. The dynamic interplay between the AFM tip and nanofibrils is unveiled through force spectroscopy, offering insights into their adhesive forces, and elasticity [48]. Although there are advantages, significant issues arise when using an AFM for imaging surfaces with features that are comparable to or smaller than the mean radius of curvature of the probing tip [49]. Therefore, a primary constraint of AFM lies in its lateral resolution, stemming from the finite size of the probe tip [50,51]. If the tip and the scanned motifs are of a similar size, the width measurements experience a significant overestimation, leading to an inability to accurately resolve the shape of the motifs [50]. This phenomenon is referred to as tip convolution, and the process of determining the actual dimensions of surface objects is known as tip deconvolution [51,52,53,54]. It is worth noting that special attention has been given for the accurate topographical characterization of nanosized materials [55,56,57,58] and cylindrical-shaped samples due to the applications related to nanofibrils [59].
In addition, the mechanical characterization of nanofibers (i.e., transverse and axial modulus) is also a challenging procedure. A significant source of errors is related to the contact mechanics models used for calculating the Young’s modulus of materials [60]. In particular, it is challenging to experimentally determine the indenter shape and size [60,61], especially for nanoindentation tests. This can lead to the possibility of choosing an inappropriate model for data processing. For example, in many cases where pyramidal indenters are used, Sneddon’s model considers the tip as a perfect cone [4]. However, it is important to note that the shape of the AFM tip may vary significantly [62]. In addition, the contact mechanics models used for calculating Young’s modulus are highly dependent on the dimensions of the indenter [4]. Therefore, even if the correct model is employed for data processing, uncertainties associated with the dimensions of the tip can exert a significant influence on the results, such as errors in contact area determination [63,64]. Another source of errors is associated with the size and shape of the tested sample. For instance, when the radii of nanofibers are similar to the AFM tip radius, the assumption of an elastic half space is no longer valid. It is worth noting that in the literature, the Young’s moduli of collagen nanofibrils present a wide range of values. Specifically, for dry collagen fibrils type I, the Young’s modulus is calculated to be within the range of 1–10 GPa [17,19,21,65]. The reasons for these results are linked to the conditions under which the experiments were conducted (e.g., dehydration state) [16], as well as errors in data processing [66]. Additionally, the mechanical heterogeneity of biological structures [4,67,68] can lead to significant errors in the mechanical characterization at the nanoscale.
This review concentrates on the characterization of nanofibers for biomedical applications using AFM. The first objective is to clearly elucidate any artifacts associated with AFM imaging and offer corresponding solutions. The analysis of the tip convolution effect is conducted, and straightforward methods to mitigate the resultant error are presented. Subsequently, techniques for the mechanical nanocharacterization of individual nanofibers are presented. Special attention is given to the AFM nanoindentation method, which is the leading method for the mechanical characterization at the nanoscale [4,10,21]. As already mentioned, measuring the mechanical properties of nanoscale fibers presents a challenging task due to the invalidation of the assumption of an elastic half space. Hence, adjustments to equations derived from Hertzian mechanics become necessary, specifically in the form of ‘correction factors’ applied to traditional equations of contact mechanics. The appropriate corrections are presented for both purely elastic and elastic–plastic contact. Additionally, a quantitative analysis of the errors incurred when assuming the fibril as an elastic half space is provided. The effects of the relative dimensions of the tip and the fibril on the errors in Young’s modulus calculations are presented in detail.
It is also noteworthy that achieving an accurate mechanical characterization of fibers necessitates the precise determination of their radius. Hence, the tip convolution effect constitutes a significant source of error in the determination of the Young’s modulus for nanofibers. Examples demonstrating the extent of errors in calculating Young’s modulus under the influence of tip convolution effects are also provided. In addition to the AFM nanoindentation method, several alternatives for characterizing mechanical properties at the nanoscale are presented and discussed. Furthermore, it is worth noting that biological structures and biomaterials at the nanoscale often exhibit high mechanical heterogeneity. Therefore, the classic Hertzian equations are extended to account for these cases.
In summary, this review paper discusses the challenges and limitations associated with the accurate nanocharacterization of nanofibers, and it provides suggestions for mitigating errors arising from data processing.

2. AFM Imaging Artifacts

The most extensively used methods for nanoscale imaging using AFM are the contact mode and the tapping mode [10]. In contact mode, a sharp tip attached to a cantilever is brought into physical contact with the sample surface, allowing the interaction between the tip and the surface to provide information about the surface topography and properties [69]. In contact mode, the goal is to maintain a consistent force between the tip and the sample surface as the tip scans across the surface. This force is usually in the range of nanonewtons and ensures that the tip remains in contact with the surface [10]. Tapping mode is designed to minimize the interaction forces between the AFM tip and the sample surface, making it particularly useful for imaging delicate samples or surfaces that are sensitive to contact forces [10]. Instead of maintaining continuous physical contact with the surface, the tip is made to oscillate at its resonant frequency [9]. This oscillation is typically in the range of a few hundred kilohertz [70]. As the cantilever oscillates, the tip alternately approaches and retracts from the sample surface during each oscillation cycle [10]. The tip only makes momentary, intermittent contact with the surface during its downward swing, resulting in reduced interaction forces compared to continuous contact modes [71]. The tapping mode offers numerous advantages when contrasted with the constant contact mode [72]. To begin with, the tapping mode has the capability to mitigate the impacts of adhesion and friction [71]. Moreover, it contributes to the enhancement of repeatability and resolution in imaging [71]. These benefits make the tapping mode a preferable option for various applications (e.g., tapping mode is considered to be more appropriate for imaging soft biological samples because it reduces the possibility of damaging the sample [10]).
Despite the precise method used for data processing, significant errors may be induced in the surface topography [73,74]. Convolution effects in AFM arise from the finite dimensions of the probe, which determine the extension of the surface area interacting with the tip [74]. Several articles have addressed the process of reconstructing the true surface based on measured images that have undergone distortion due to tip convolution [74]. Reiss et al. introduced groundbreaking research in this domain, in which they discussed the impact of tip size on scanning probe images [75]. Keller formulated a reconstruction approach using Legendre transforms. This technique allows the estimation of the actual sample surface from distorted images through the deconvolution of the tip effect [76]. Another method, introduced by Villarrubia, is based on the principles of mathematical morphology [77,78]. This formalism is a branch of set theory dealing with unions and intersections of sets and their translations, which provides a precise language for problems related to convolution effects [74,77,78]. In this approach, the tip and the sample are represented as a complete set of peaks. Therefore, this formalism can be applied to any type of tip and sample, with the resolution of the method determined with the number of peaks forming each set. Nevertheless, techniques based on mathematical morphology face limitations due to the significant time intervals required using reconstruction algorithms. Additionally, obtaining quantitative data from distorted images mandates extensive information about both the tip and the sample. On the other hand, applying mathematical morphology to the tip convolution problem is not easy. The phenomenon occurring during the scan demands an advanced mathematical background. Due to these factors, convolution effects are frequently addressed with the presumption that surface features exhibit a recognizable symmetrical form. Approaches of this nature rely on geometric evaluations in which both the tip and surface configurations are approximated using analytical functions, such as circles or parabolas [79,80,81,82]. In this way, the lateral resolution and the real size of surface features can be estimated from distorted AFM images. Nevertheless, certain complexities may arise from the problem’s simplification, as achieving true surface reconstruction is challenging in practical scenarios, even when considering spherical shapes [83,84]. Possessing equivalent adaptability to the mathematical morphology framework, yet not requiring an extensive mathematical background, Canet-Ferrer et al. introduced a straightforward algorithm to reconstruct AFM images [74]. This algorithm is adept at emulating convolution effects during the scanning process of any type of AFM tip, applicable across a broad spectrum of nanostructures encompassing varied sizes and shapes [74].
As already mentioned, artifacts arising from the tip convolution effects consistently impact AFM images, leading to a reduction in the lateral resolution. When imaging nanofibers, the AFM tip radius is of a similar order of magnitude to the radius of the nanofiber, leading to notable errors in topographical images. To provide a brief explanation of the artifacts that result from AFM imaging, let us consider the case of scanning a surface using a pyramidal AFM tip (pyramidal tips are typically employed for accurate imaging at the nanoscale). In most cases, pyramidal tips are treated as sphero-conical indenters [85]. The reason is that only the tip apex comes into contact with the sample. For example, the MLCT tips constructed by Bruker are pyramidal tips with a rounded tip apex and a nominal radius of 20 nm. The sphero-conical model is presented in Figure 1a. To calculate the angle φ in Figure 1a, the procedure presented in [85] can be used. In Figure 1b, the interaction between an AFM tip and a cylindrical-shaped sample (i.e., a nanofiber) is presented. The tip radius is assumed to be similar to that of the nanofiber. The red dotted line presents ‘what is being recorded’ using the AFM tip. In particular, the recorded fiber appears to have a significantly larger radius compared to the actual one. The reason for this error is a result of the simple geometry of the interaction between a sphere and a cylinder. The simplest method to determine the accurate dimensions of nanosized materials was presented by Canet-Ferrer et al. and is based on straightforward geometrical relationships [74,86,87]. Regarding the topographical images of nanofibers, two cases should be examined. The first one is the case in which the tip radius is smaller than the ‘height (H)’ of the nanofiber (i.e., r t i p < H ). This case is presented in Figure 1c. The tip to face angle φ in Figure 1c equals to the cone’s half angle in Figure 1a. The second one is the case for which r t i p > H (Figure 1d). At this point, it is important to introduce the magnitudes h e f f and w e f f   referred to as effective height and effective width, respectively. These magnitudes are different compared to the fiber’s height ( H ) and width ( w ) for rounded objects (the equality, i.e., h e f f = H and w e f f = w holds only for rectangular-shaped objects) [74]. The value of h e f f indicates the height in which point C is placed (i.e., point C is the contact point between the tip and the fiber), and it can be correlated with the effective contact area between the tip and the sample [74]. Similarly, w e f f (which is the distance between points C and C’ (Figure 1c)) determines the effective area of interaction between the tip and the object in an analogous manner.
In addition, w e x p is the ‘expected value’ (i.e., w e x p   is the width that is being measured using AFM). Thus, the convolution error results in C . E . = w e x p w . To calculate the convolution error, simple equations have been previously derived [74].
For round objects and for r t i p < H ,
w e x p w e f f = 2 Δ + r t i p
In Equation (1), Δ equals to
Δ = ( h e f f r t i p ) tan φ
For round objects and for r t i p > H ,
w e x p w e f f = 2 Δ
In Equation (3), Δ equals to
Δ = r t i p cos s i n 1 r t i p h e f f r t i p
At this point, it is significant to note once again that Equations (1)–(4) lead to the calculation of w e x p w e f f   and for rounded objects, w e f f w (Relationships (1)–(4) result in C . E . = w e x p w for rectangular-shaped objects as already mentioned). However, as shown in [74], the difference in convolution error is small assuming a square and a circumference of the same height. Equations (1)–(4) unveil that, regardless of the shape of the object, if C (the point of contact between the tip and the sample) is positioned along the linear side portion of the tip (Figure 1c), the convolution error is predominantly influenced by φ and r t i p .
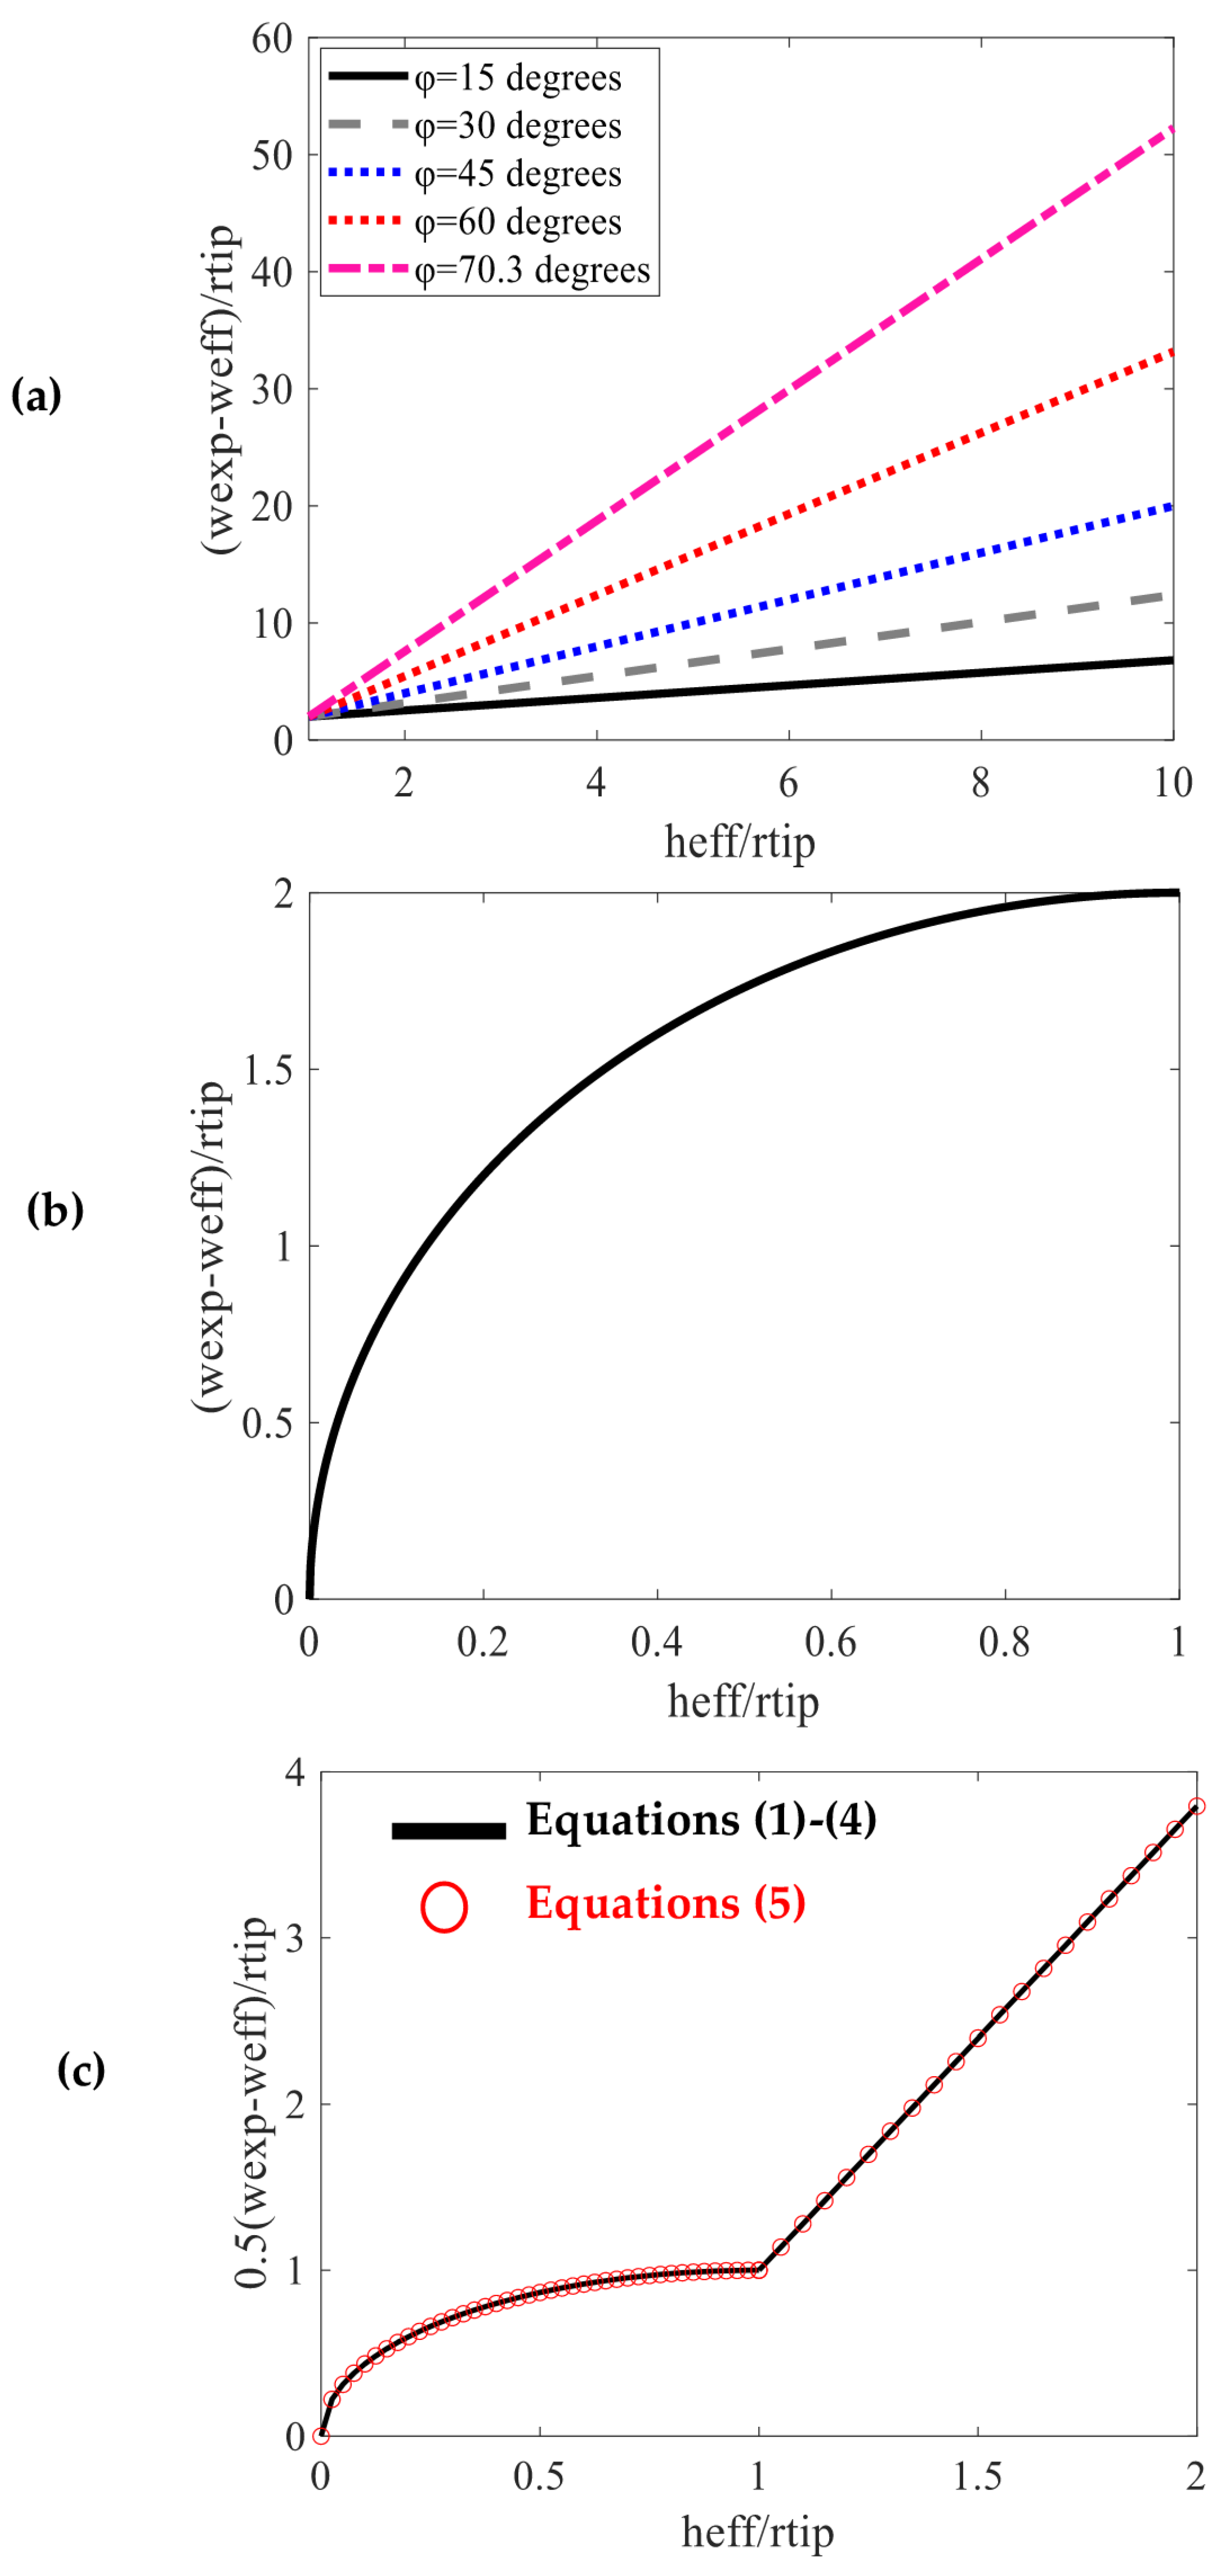
In Figure 2a, the ( w e x p w e f f ) / r t i p = f h e f f / r t i p function is presented for various tip to face angles ( φ = 15 ° , 30 ° ,   45 ° ,   60 ° ,   and   70.3 ° ). The case φ = 70.3 ° is the case of the equivalent conical geometry of a Berkovich tip (this tip is used in many cases for indentation experiments as it will be presented in the next section). An interesting example is presented as follows. Assuming that h e f f r t i p ,     Δ 0 . Thus, w e x p w e f f = 2 r t i p (this case is represented in Figure 2a with the point of intersection between all linear curves and the vertical axis). If r t i p 10   nm , w e x p w e f f = 20   nm (hence, if w w e f f 10   nm , w e x p 30   nm , which is three times bigger compared to the real value). In addition, as shown in Figure 2a, the extent of convolution error primarily relies on φ for objects with H r t i p . In such cases, where the object’s height significantly exceeds the tip’s radius, the tip engages the object along its linear side section. Conversely, as the height H decreases, the impact of r t i p becomes more pronounced, gradually rendering the influence of φ negligible. The impact of shape is consistently more significant in situations involving larger objects. For objects whose sizes are similar with r t i p , convolution effects are distinctly around 2 r t i p , and they tend to exhibit minimal reliance on the specific shape in most cases (point of intersection between linear curves and the vertical axis on Figure 2a). Thus, it can be concluded that the experimental error can be approximated without necessitating an intricate understanding of the object’s precise shape. This is because, for objects with substantial disparities in shape, such as squares and circles, comparable convolution errors are encountered. On the other hand, if C (i.e., the point of contact) is situated beneath the rounded end of the tip, the convolution error is solely dependent on r t i p , considering a fixed H value (Figure 2b). For example, assuming that r t i p = 10   nm and H h e f f = 5   nm , w e x p w e f f w e x p w 17   nm . Thus, w 5   nm and w e x p 12   nm .
The validity of the simple geometrical approach (Equations (1)–(4)) depends on the sample’s shape. For rectangular or round shapes, they provide accurate results. For exotic geometries, specialized algorithms have also been developed [74]. This is because the algorithms allow for the representation of the surface motifs as they are, without approaching any mathematical expression. However, this is not the case studied in this paper, which focuses on the topography of nanofibers. It should also be noted that similar geometrical considerations for determining the tip’s convolution error in the case of nanofibers are also presented in [88]. The equations to calculate the convolution error are presented as follows:
1 2 w e x p w = r t i p 2 r t i p H 2 ,   for   H r t i p 1 2 w e x p w = r t i p + H r t i p s i n φ s i n 90 ° φ ,   for   H > r t i p
For example, if r t i p = H , Equation (5) results in w e x p w = 2 r t i p as expected. The diagram of 1 2 w e x p w with respect to the fibril’s height is also presented for the case of r t i p = 8   nm and the cone’s half angle φ = 20 ° in [88]. We also provided the 1 2 w e x p w r t i p = f h e f f r t i p functions for φ = 70.3 ° using Equations (1)–(5) for comparison (in the domain 0 h e f f r t i p 2 ). The results are identical. It was assumed that H h e f f .
It must also be noted that the spatial mapping of magnetic domains on a sample surface can be performed using Magnetic Force Microscopy (MFM) [89]. In its standard configuration, the MFM technique utilizes a probe coated with magnetic material to scan a sample using the non-contact or dynamic mode of atomic force microscopy (AFM) [89]. This approach entails monitoring the sample’s surface features, where the probe comes into direct contact with the sample. Subsequently, a series of scans are conducted at different lift heights (z) above the topographical surface, enabling the detection of long-range magnetic forces between the MFM probe and the magnetic domains on the sample [90]. MFM was initially designed for characterizing and studying inorganic materials like magnetostrictive films or IC components [90]. However, certain biological [91] and organic/inorganic [92] films, and even individual proteins [93], can demonstrate magnetic properties. As a result, MFM has emerged as a viable choice for their characterization. As an example, the assessment of iron deficiency in the human body typically relies on the measurement of ferritin protein levels [94]. It is important to note that MFM is not artifact-free [95,96,97]. Previous studies on an MFM analysis of biological materials have revealed a significant challenge, namely, the potential contamination of the signal due to artifacts arising from topographical cross-talk. This has been demonstrated in samples comprising solid-state materials or nanoparticles [89]. To improve the efficiency of MFM, the effect of increasing scan rate has been previously explored [89]. It was demonstrated that MFM images of tissue sections may exhibit contamination from artifacts caused by topographical cross-talk, particularly at elevated scan rates. These anomalies were noted both in rodent spleen samples and in sections of brain tissue extracted from Alzheimer’s Disease patients [89]. It is also worth noting that traditional MFM necessitates multiple scans of the samples, is susceptible to various artifacts, and has constraints in its capacity for multimodal imaging or imaging in a fluid environment [98]. For this purpose, Indirect Magnetic Force Microscopy (ID-MFM) has been developed, as it enables the magnetic mapping of iron deposits in cells and tissue sections without the risk of probe contamination [98].

3. Determining the Mechanical Properties of Nanofibers Using AFM

3.1. A Brief Overview of AFM Nanoindentation Method

The leading method for determining the mechanical properties of nanofibers is the AFM nanoindentation method [99,100]. To apply this method, an experiment on a reference stiff material that is not being deformed by the AFM tip is first required [99]. In this case, the piezo-driven movement of the material relative to the tip is equal to the displacement of the tip. Thus, the graph ‘applied force with respect to the piezo-displacement’ is linear [99]. Subsequently, the procedure is repeated to the sample of interest. The indentation depth h for each applied force F value can be easily calculated by subtracting the piezo-displacement for the hard reference material z s t i f f from the piezo-displacement for the soft material z s o f t , i.e., h = z s o f t z s t i f f . Thus, using the F   and   h data, a force–indentation curve can easily be plotted. Subsequently, the force–indentation data are fitted to an appropriate model of contact mechanics and the sample’s Young’s modulus is determined as a fitting parameter.

3.2. Calibration of Probe Parameters

Accurate quantitative measurements necessitate the calibration of probe parameters. The force applied to the sample can be determined using Hooke’s law, which relates it to the deflection of the cantilever. This relationship involves the cantilever’s spring constant (k), deflection sensitivity (which converts the cantilever’s deflection from volts to nanometers), and the measured cantilever’s deflection (in volts) [101].
The deflection (Δz) is directly measured with the system’s position-sensitive split photodiode detector [101]. To perform sensitivity calibration, which establishes the relationship between cantilever deflection and the voltage signal of the laser detection system, it is essential to generate a force-versus-distance curve on a clean, rigid surface, such as mica or glass [101]. Subsequently, the deflection sensitivity (Δz per volt of the laser detection system) is determined by simply placing two cursors on the contact region of this force-versus-distance curve [101]. Calibration of the spring constant is achieved using the thermal noise method [101]. Additionally, aside from the aforementioned techniques, other innovative and precise methods, such as the “Standardized Nanomechanical Atomic Force Microscopy Procedure (SNAP),” can also be employed [102].

3.3. Elastic Contact

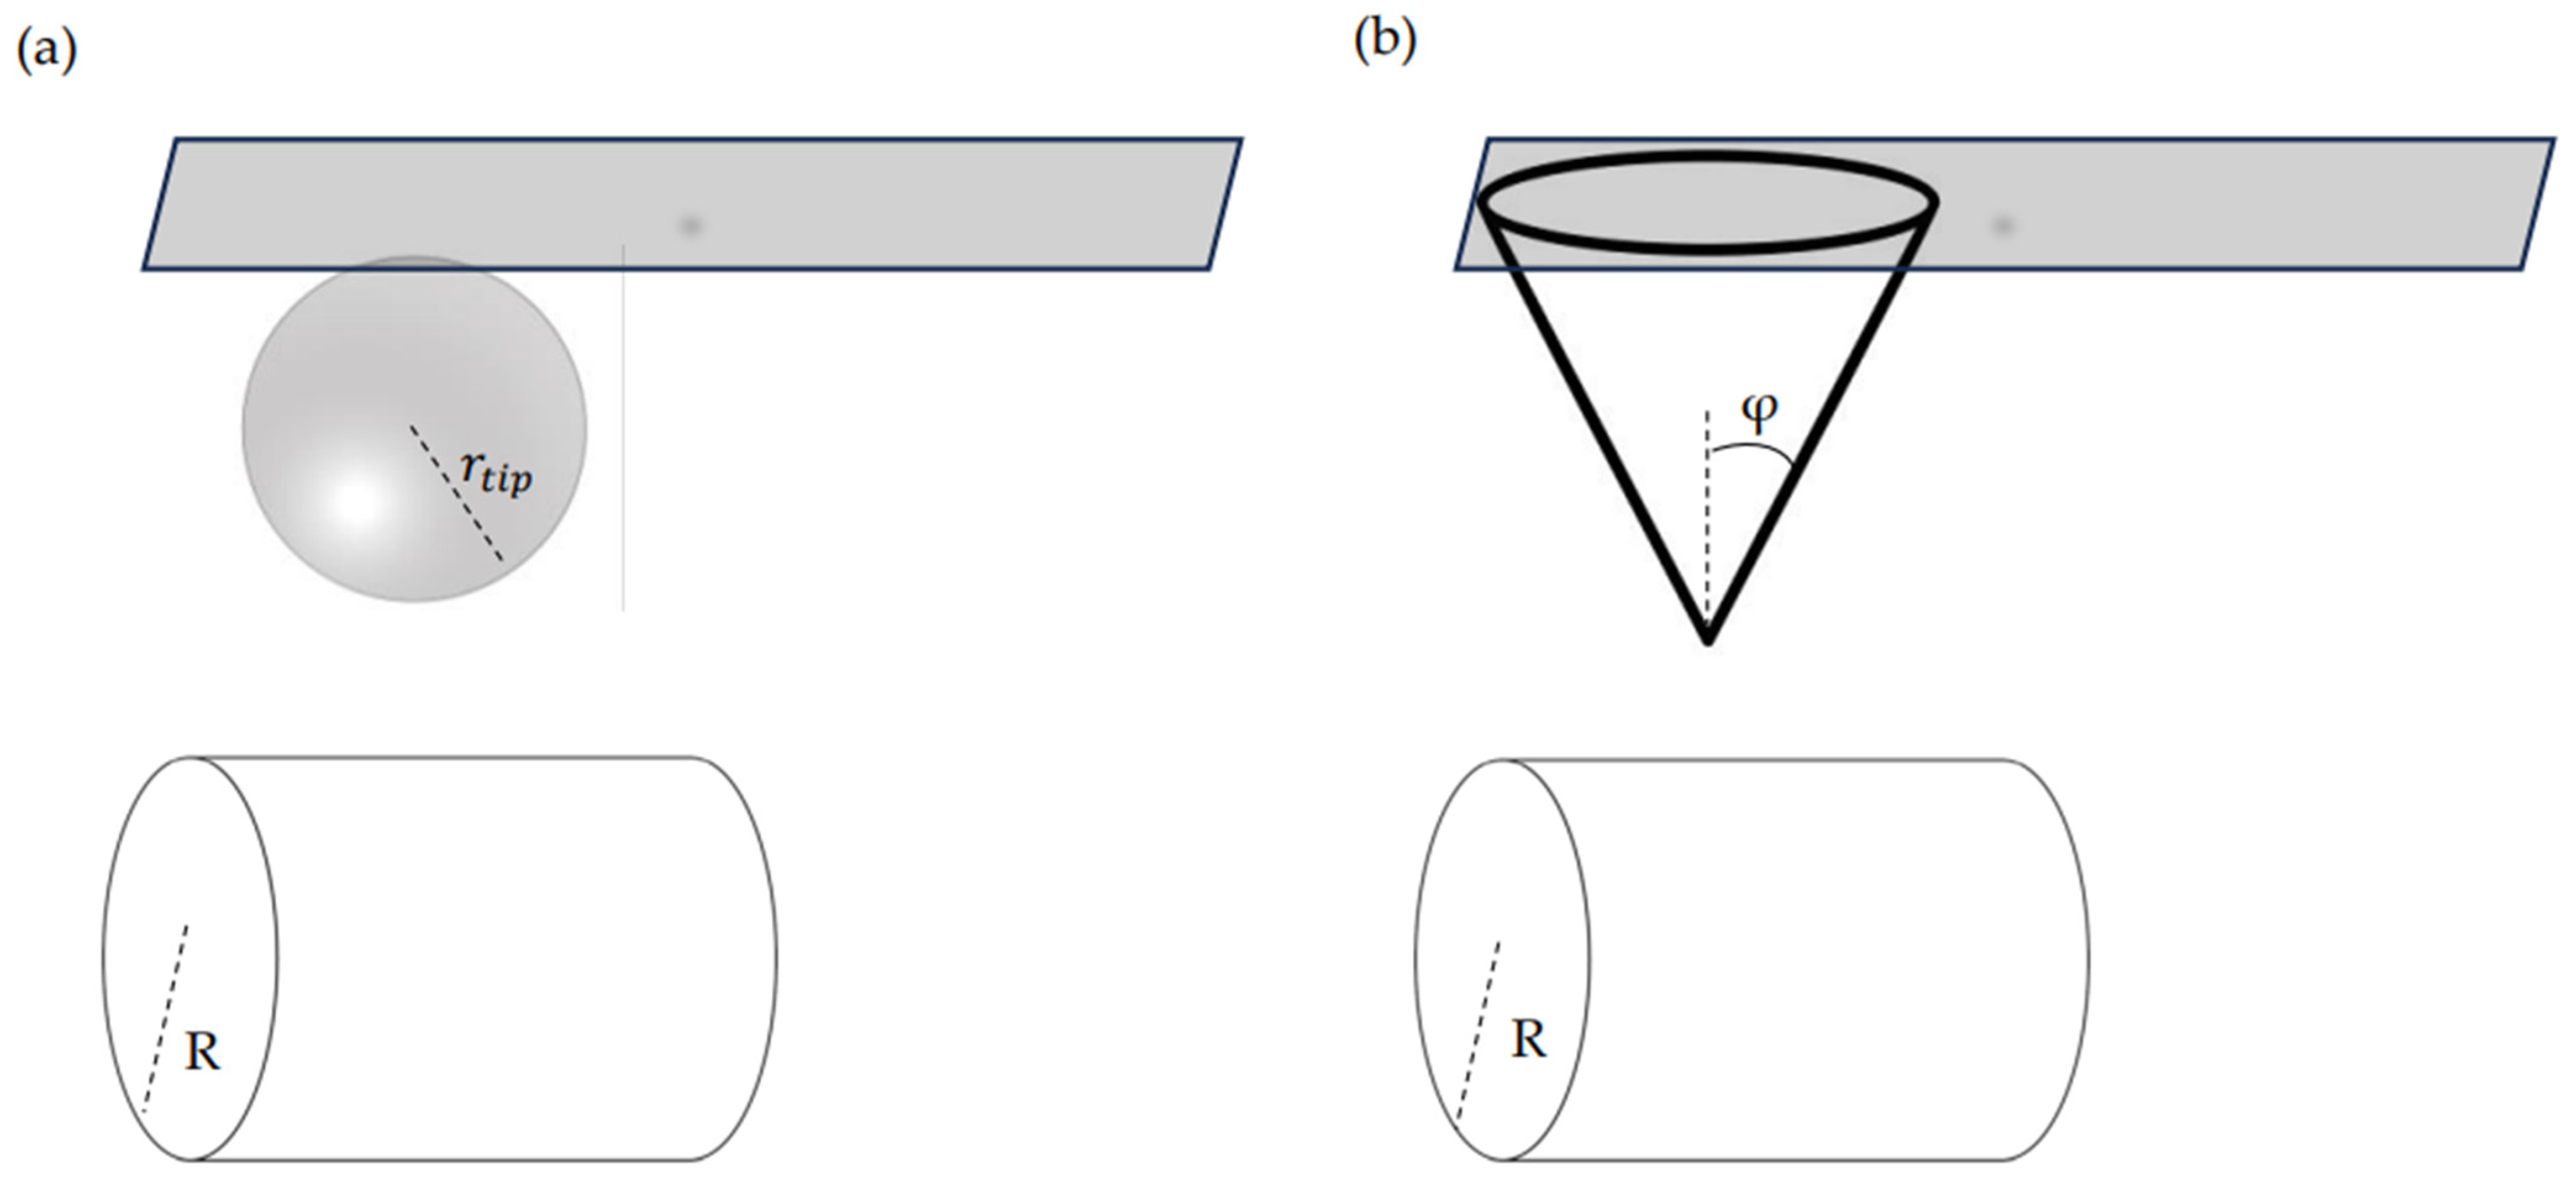
The AFM indentation on a nanofiber can be modelled as the interaction of a rigid sphere with a cylinder (Figure 3a). Assuming that the sphere is made from a material that is orders of magnitude stiffer than the cylinder (this assumption is valid when testing biological materials), the equation that relates the applied force ( F ) to the indentation depth ( h ) is provided as follows [103]:
F = 4 3 E 1 v 2 r t i p 1 / 2 h 3 / 2 1 Z
In Equation (6), E   and   v are the Young’s modulus and Poisson’s ratio of the cylinder, respectively, r t i p is the radius of the sphere (i.e., the radius of the AFM tip), and Z is a correction factor that is defined as follows [103,104]:
Z = 2 k 2 π K 3 k K k E k 1 / 2
In Equation (7), k = 1 A B 2 , where A   and     B are the semi-axes of the contact ellipse between the sphere and the cylinder, K k = 0 1 d x 1 x 2 1 k 2 x 2 is the complete elliptic integral of the first kind, and E k = 0 1 1 k 2 x 2 1 x 2 d x is the complete elliptic integral of the second kind [103,104]. The ratio of the sphere’s to the cylinder’s radius r t i p R equals to the following [103,104]:
r t i p R = E k 1 k 2 K k 1 k 2 K k E k 1
Previous studies [103] showed that the correction factor Z can be approximated with the following function:
Z = a r t i p R 2 + b r t i p R + c
In Equation (9), a , b , and   c   are constants that equal to a = 0.046 , b = 0.223 , and c = 1.002 . If the classic Hertzian equation F = 4 3 E 1 v 2 r t i p 1 / 2 h 3 / 2 is used instead of Equation (6), the error is significant for big r t i p / R ratios. For example, if r t i p R = 1 , the error regarding the Young’s modulus calculation will be approximately 15%. Another simple approach that is widely used in the literature is the following [99,105]:
F = 4 3 E 1 v 2 r e f f . 1 / 2 h 3 / 2
In Equation (10), r e f f . = r t i p 2 R r t i p + R . Equation (10) results in almost identical results as Equation (6) [99,105].

3.4. Elastic–Plastic Contact

In the case of elastic–plastic contact, the Oliver and Pharr method is the gold standard technique for the determination of the mechanical properties of the material of interest [11,106]. However, for the case of the interaction between a pyramidal indenter and a nanofibril, modifications are required since the Oliver–Pharr method was initially derived for the elastic–plastic contact of an indenter with an elastic half space [106]. The basic steps of the method are provided as follows. Firstly, the unloading-force–indentation data should be fitted to a power-law equation of the following form [11,106,107]:
F = K h h f m
In Equation (11), K   and     m are fitting constants, where 1 m 2 [106]. In addition, h f is the final depth (i.e., the permanent depth of penetration after the indenter is fully unloaded) [11,106].
The depth at which contact is made between an indenter and an elastic half space during indentation is contact depth and is provided below [106,107]:
h c = h m a x ε F m a x S
In Equation (12), h m a x is the maximum indentation depth, F m a x is the maximum applied force on the sample, S is the contact stiffness at the maximum indentation depth (i.e., S = d F d h h m a x ), and ε is a constant that depends on the exponent m [106,107]:
ε = m 1 2 Γ m 2 m 1 π 1 2 Γ 1 2 m 1 m 1
In Equation (13), Γ is the gamma function. When using a pyramidal indenter, usually an ‘equivalent conical indenter’ is considered to facilitate the analysis. The method for the determination of the equivalent cone’s half angle is based on a cone that gives the same depth-to-area relationship and is presented in [85,108]. In case of a Berkovich tip, φ = 70.3 ° [106]. Thus, the projected area at contact depth assuming that the material can be approximated to an elastic half space is
A f l a t = π h c 2 tan φ
Subsequently, the Young’s modulus is calculated using the following equation:
E f l a t = π 2 β 1 v 2 S A f l a t
In Equation (15), β is a correction factor that depends on the indenter’s geometry ( 1.0226 < β < 1.085 ) [21]. However, when indenting a nanofiber, the elastic half space assumption is not valid. Therefore, it is significant to also account for the cylindrical shape of the fiber. McAllister et al. derived an equation that relates the contact depth in the case of indenting an elastic half space ( h c ) with the contact depth in the case of a radial indentation of a cylinder with radius R ( h c ) [109]:
h c h c = c o s 2 φ 1 R h c + R h c 2 + 2 R h c t a n 2 φ t a n 2 φ 1 / 2
When indenting a cylinder, the projected area at contact depth is an ellipse (not a circle); therefore,
A e l l i p s e = π α c a c
In Equation (17), α c is the major elliptical radius ( α c = h c tan φ ) and a c is the minor elliptical radius ( a c = h c tan φ ). Thus,
A e l l i p s e = π h c h c tan φ
By dividing Equations (14) and (18), it is concluded that
A e l l i p s e A f l a t = h c h c = c o s 2 φ 1 R h c + R h c 2 + 2 R h c t a n 2 φ t a n 2 φ 1 / 2
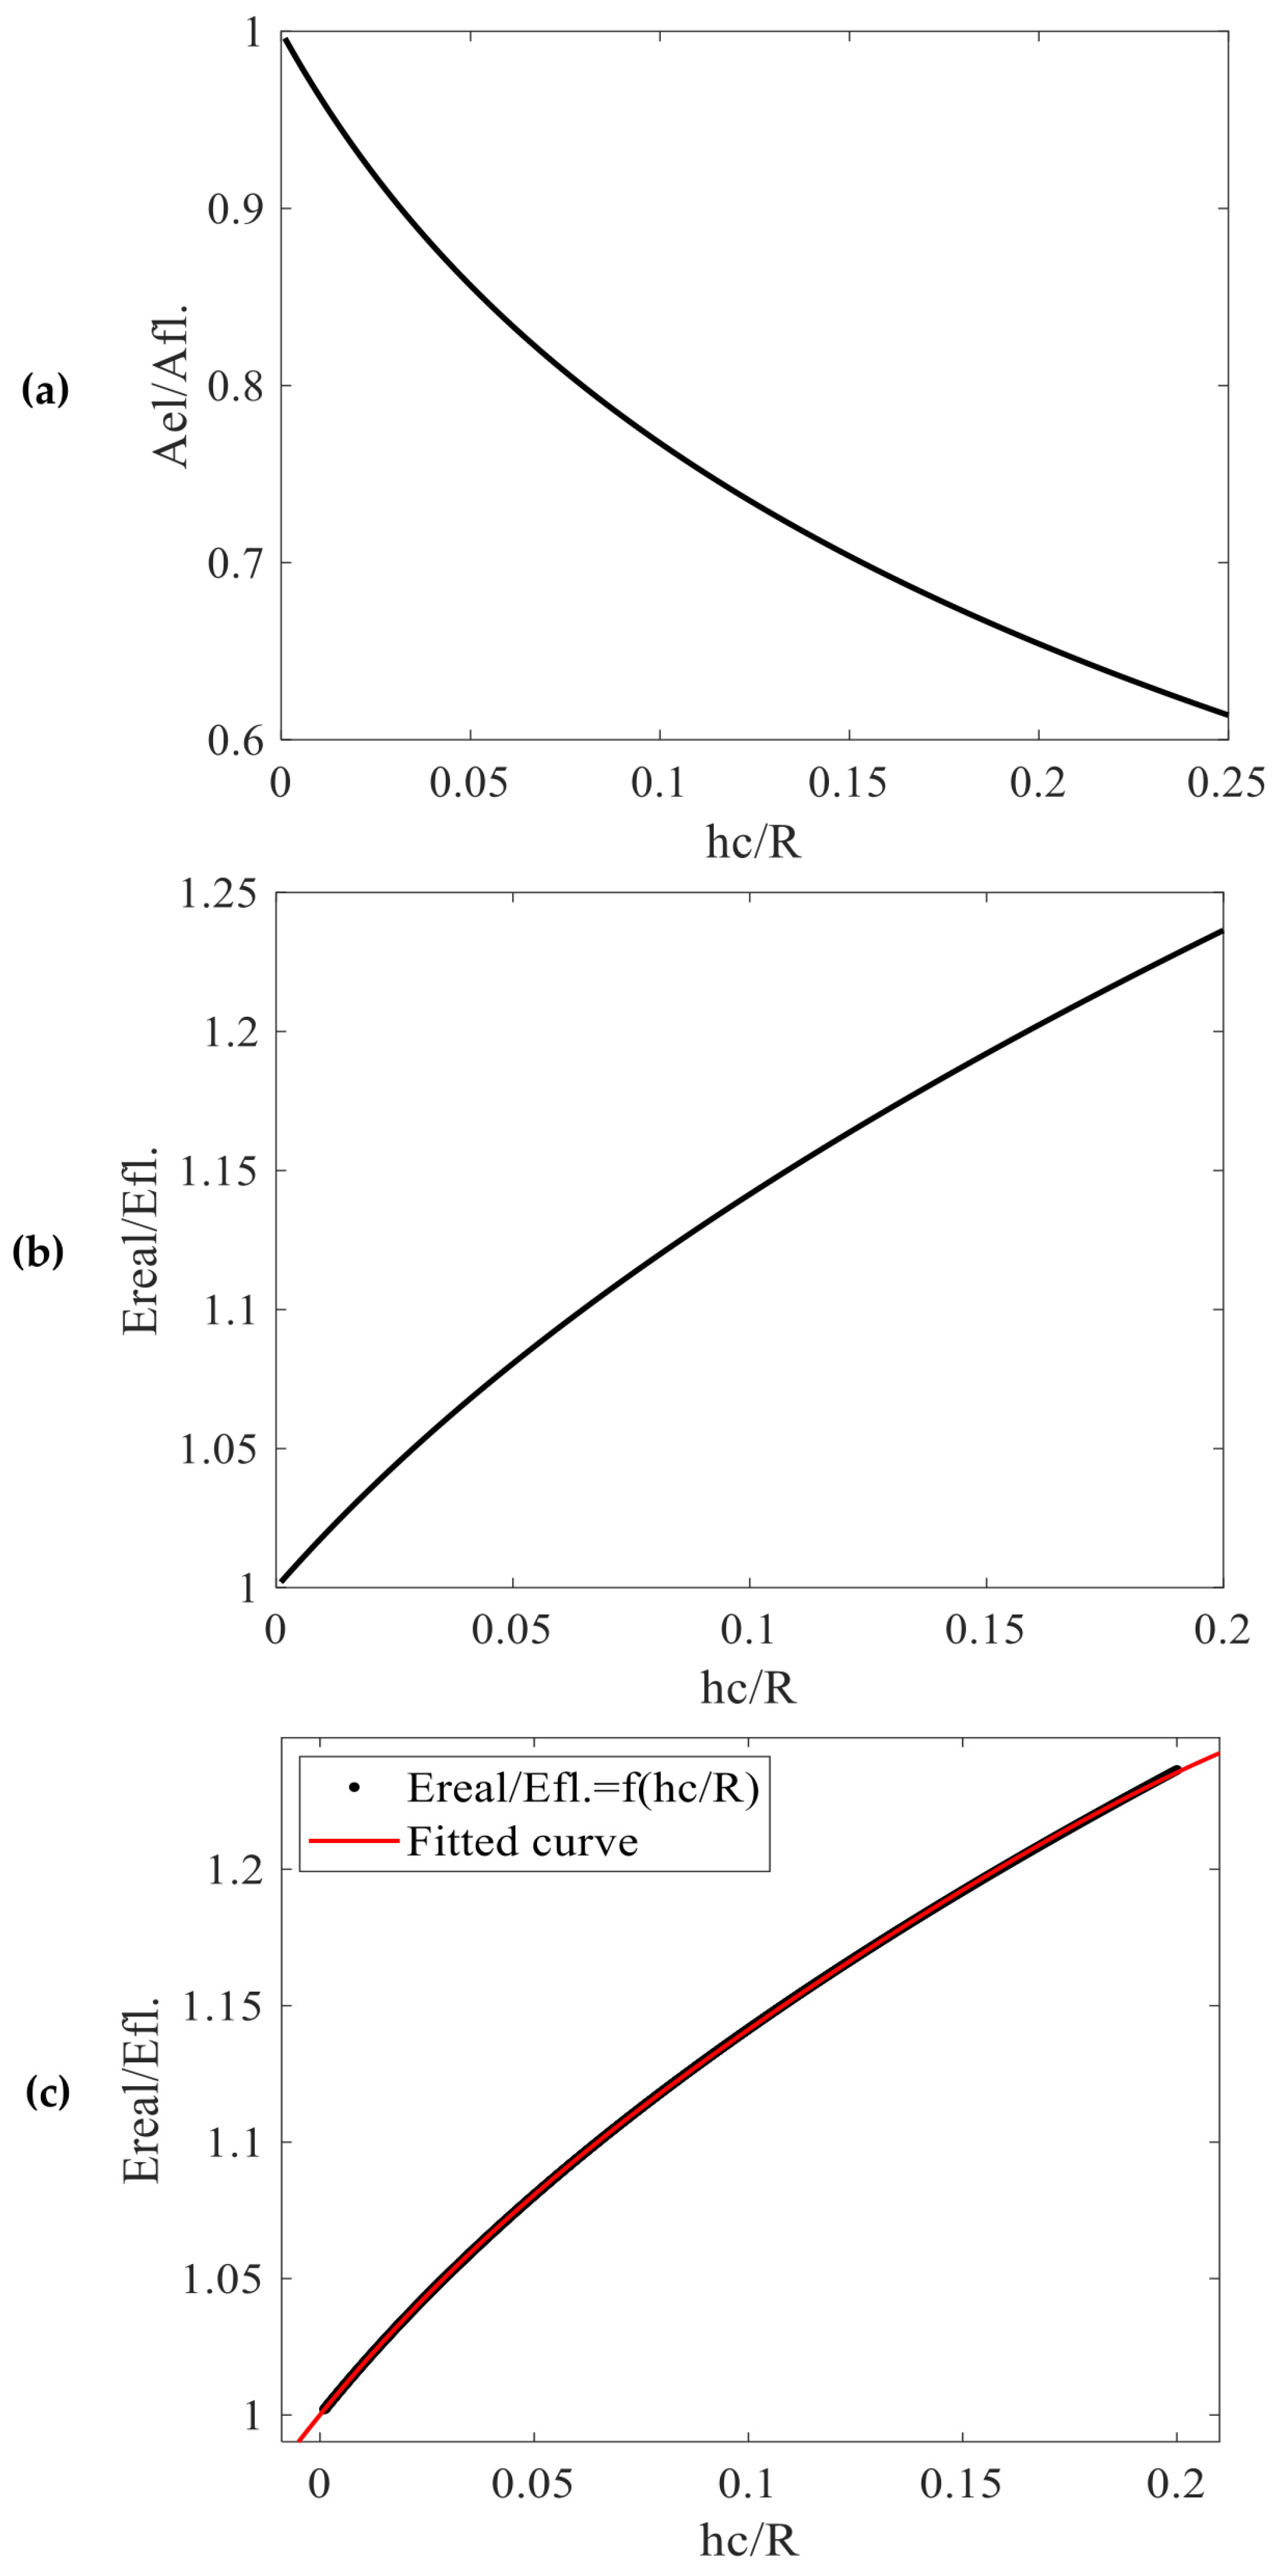
The A e l l i p s e A f l a t = f h c R function for the domain 0 h c R 0.2 , when using a Berkovic indenter (i.e., φ = 70.3 ° ), is presented in Figure 4a.
Thus, the equation that relates the Young’s modulus E f l a t , when indenting an elastic half space, to the real Young’s modulus E r e a l when indenting a fiber should be the following [109]:
E r e a l E f l a t = A f l a t A e l l i p s e 1 / 2
The E r e a l E f l a t = f h c R function for the domain 0 h c R 0.2 , when using a Berkovic indenter, is presented in Figure 4b. It is important to note that for big indentation depths, the error, if assuming the fiber as an elastic half space, can exceed 20% (as presented in Figure 4b). To facilitate the analysis, the E r e a l E f l a t = f h c R data were fitted to a fourth-degree polynomial curve (the R-squared coefficient was equal to 1.0000) to derive a simple equation that relates E r e a l with E f l a t :
E r e a l E f l a t = c 4 h c R 4 + c 3 h c R 3 + c 2 h c R 2 + c 1 h c R + c 0
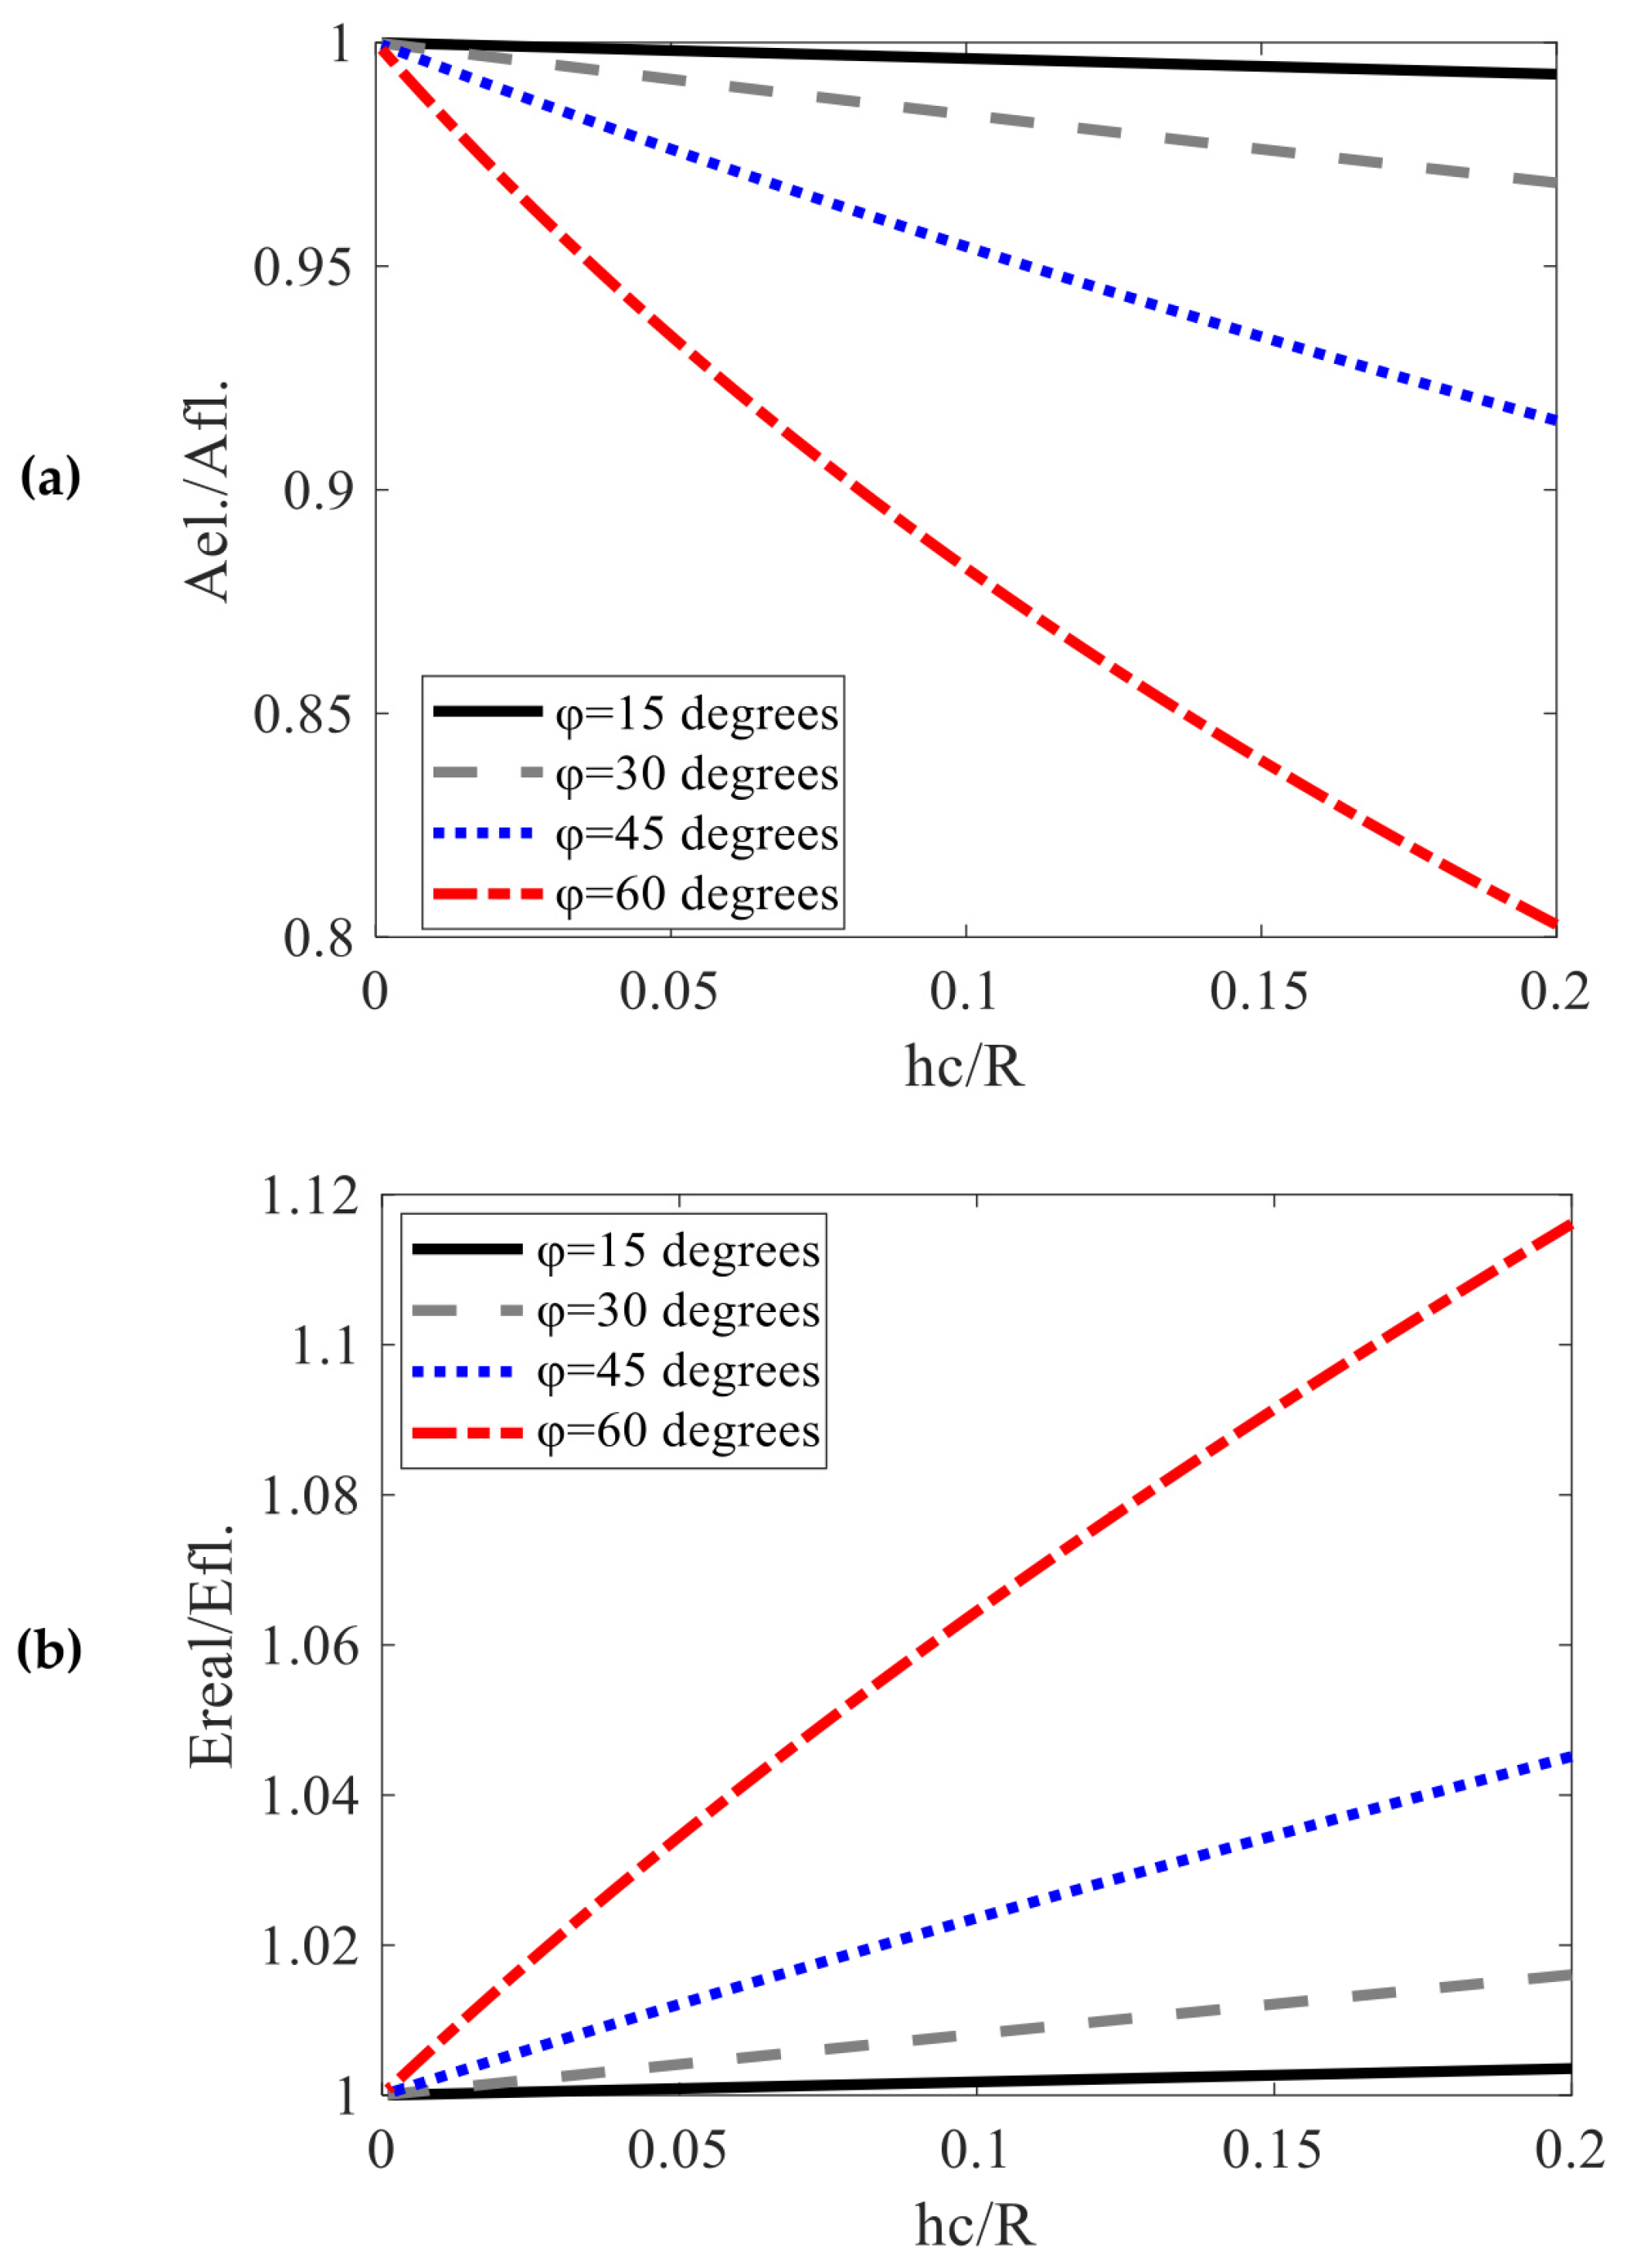
The fitting coefficients resulted in c 4 = 61.47 ,     c 3 = 32.63 ,     c 2 = 7.835 ,     c 1 = 1.931 ,   and   c 0 = 1 . For example, assuming that h c R = 0.2 , Equation (21) results in E r e a l E f l a t = 1.2364 . This result indicates that the real Young’s modulus value is 23.64% bigger compared to the one that is calculated using Equation (15). The fitted curve is presented in Figure 4c. In addition, the A e l l i p s e A f l a t = f h c R data and the E r e a l E f l a t = f h c R data are also presented in Figure 5 for indenters with a variety of an equivalent cone’s half angles. An interesting result is that the error resulting from Equation (15) depends greatly on the equivalent cone’s half angle.
For small angles, the error is relatively small. For example, assuming that φ = 15 ° and h c R = 0.2 , the ratio E r e a l E f l a t becomes 1.0036 (the error in this case is only 0.36%). Thus, for pyramidal indenters that can be modelled with cones with small half angles, Equation (15) provides accurate results. In addition, for small indentation depths compared to the fiber’s radius, Equation (15) is accurate even if the equivalent cone’s half angle is big. For example, assuming that φ = 70.3 ° and h c R = 0.01 , E r e a l E f l a t = 1.0186 (the error equals to 1.86%).
The same approach can also be performed using a spherical indenter. In this case, the h c h c ratio results in the following [109]:
h c h c = 1 R h c + R 2 + R r t i p R h c r t i p h c + h c 2 2 R h c + r t i p h c h c 2
In Equation (22), r t i p is the indenter’s radius. The contact radius assuming an indentation on an elastic half space is
a c = h c 2 r t i p h c
In the case of indenting a cylinder,
a c = h c 2 r t i p h c
Then, the area correction ratio is given as follows [109]:
A e l l i p s e A f l a t = a c a c = h c 2 r t i p h c h c 2 r t i p h c 1 / 2
The correction in Young’s modulus can be performed using Equation (20). For small indentation depths compared to the tip radius ( h r t i p ) , h c = h m a x / 2 [110] and Equation (25) becomes
A e l l i p s e A f l a t = a c a c = h c h c 1 / 2
An example is provided as follows. Assume that r t i p = 5   nm ,     R = 10   nm , and h m a x = 1   nm . Considering that h c h m a x / 2 , Equation (22) is written as follows:
h c h c = 1 2 R h m a x + R 2 + R r t i p R h m a x 2 r t i p h m a x 2 + h m a x 2     8 R h m a x 2 + r t i p h m a x 2 h m a x 2     4 = 0.6724
Thus, using Equation (26), A e l l i p s e A f l a t = 0.82 . Finally, using Equation (20), E r e a l E f l a t = 1.1043 . This result yields that there is a 10.43% error if using Equation (15). For example, Wenger et al. [107] used Equation (15) for calculating the Young’s modulus of collagen fibrils type I from rat tail tendons. In their case, 2   nm h m a x 4   nm , r t i p = 20   nm , and 25   nm   R 100   nm . Assuming, for example, that h m a x = 3   nm and R = 50   nm , Equation (22) results in h c h c = 0.8426 . Thus, Equation (20) gives E r e a l E f l a t = 1.0894 (i.e., 8.94% error).

3.5. Other Methods

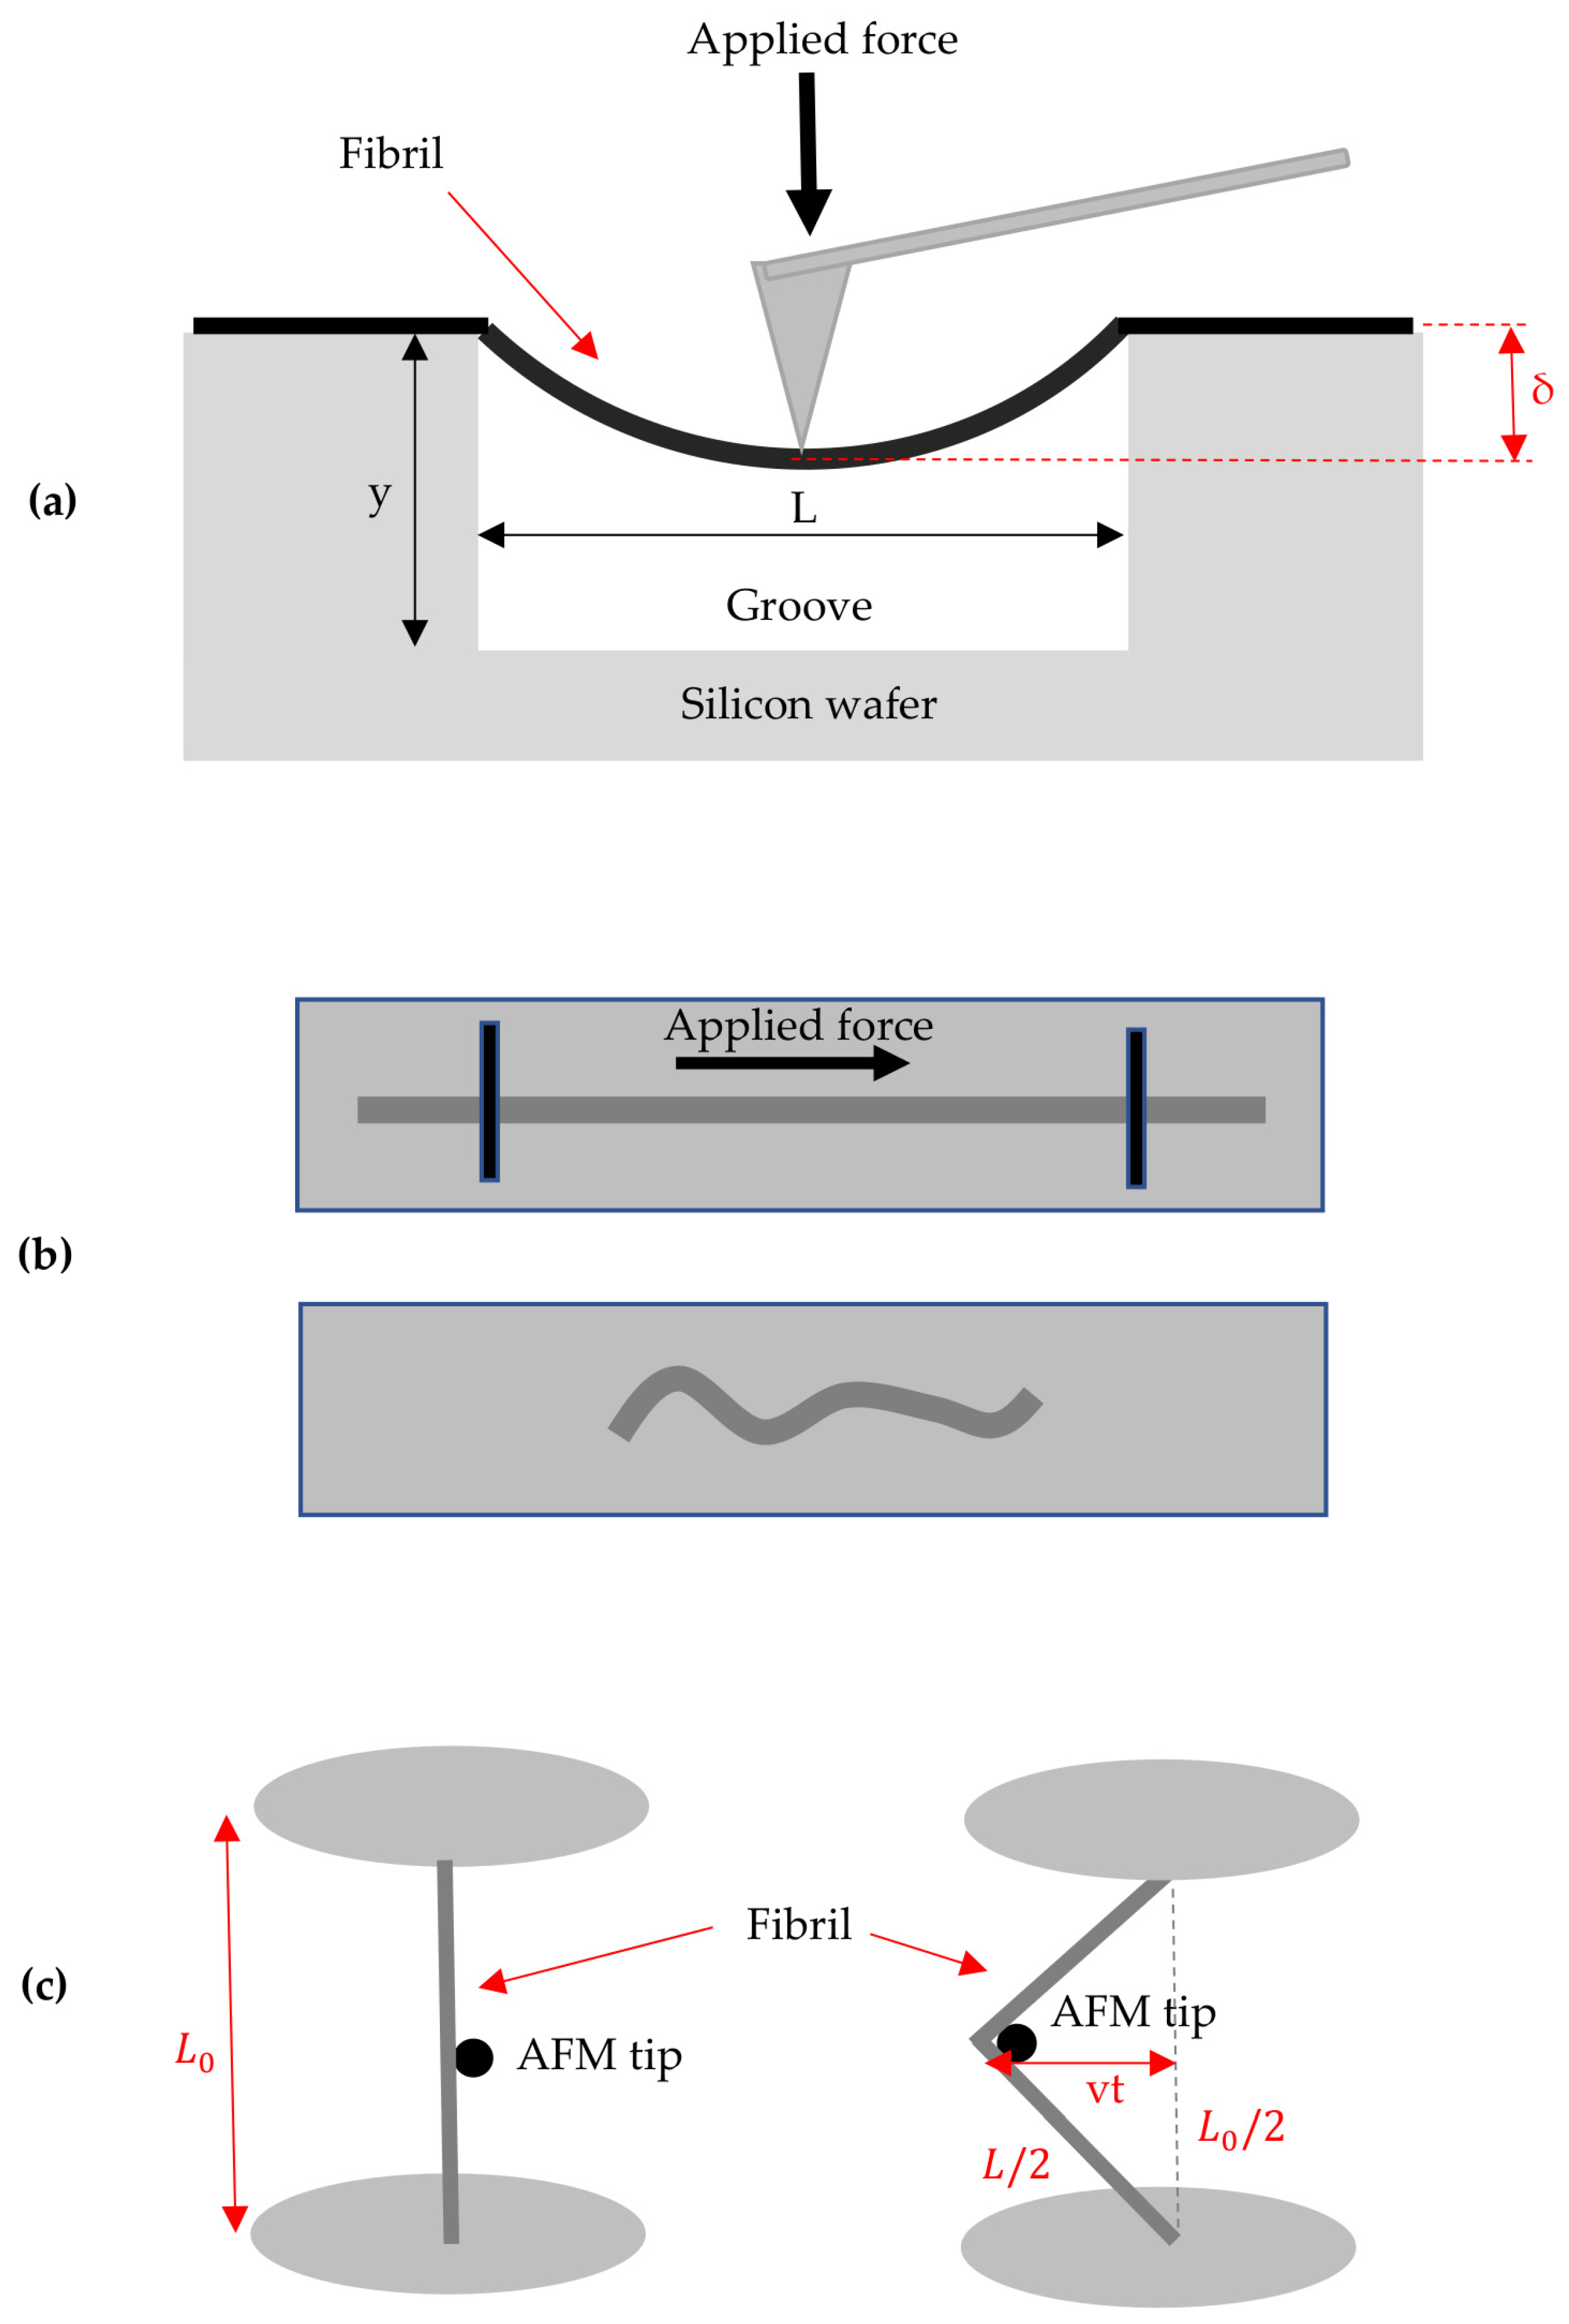
Apart from the AFM nanoindentation method, several other approaches have also been used in the literature for the determination of the mechanical properties of individual fibers. Cheng and Wang determined the elastic modulus of single cellulose fibrils using the experimental setup presented in Figure 6a (three-point bending tests) [111]. The experiment involved suspending fibrils and utilizing an AFM cantilever tip to exert a minor force either at the midpoint ( L / 2 ) of the fibrils’ lengths or at positions a quarter ( L / 4 ) of the distance from one of their ends [111,112]. The silicon wafer in which the fibril is placed has a groove with width L and depth y . Obtaining the deflection of the fibril (denoted as “ δ ”) is the most important procedure in the process (Figure 6a). The sample deflection was determined by calculating the difference in cantilever deflections between the tips loaded onto the fibril positioned over a groove and those loaded onto the reference (like a silicon wafer substrate) [111].
When a force, denoted as F , is exerted at position x along the fiber axis, resulting in deformation δ , the ratio F x / δ is the stiffness of the fiber at the respective position [47]. For a simply supported beam [47],
F x δ = 3 L 0 E I L 0 x 2 x 2
In the case of a double-clamped beam [47],
F x δ = 3 L 0 3 E I L 0 x 3 x 3
In Equations (28) and (29), L 0 represents the initial length of the suspended segment, E is the axial Young’s modulus, and I denotes the area moment of inertia. For cylindrical fibers with a radius R, the area moment of inertia   I can be calculated as I = π R 4 4 . Several applications of this method can be found in [113,114,115,116].
In most of the cases of three-point bending studies, fibers are assumed to be double-clamped due to sufficient fiber–substrate adhesion [117,118] or double-clamped conditions are enforced with additional experimental measures [119,120]. When applying a force F c at the midpoint of the segment ( x = L 0 / 2 ), Equation (29) is simplified to
F L 0 2 = F c = 192 E I L 0 3 δ
In addition, a recently introduced method involves evaluating the tensile modulus of collagen fibrils [121]. In this approach, fibrils were placed onto a pre-stretched foil. Following this, the foil was allowed to relax while still holding the attached fibrils (Figure 6b). The tensile modulus can be ascertained through AFM imaging by analyzing the buckling wavelength and radius of each fibril. Specifically, the wavelength (represented as k = 2π/λ) of the buckling pattern can be derived from two closely related equations, as outlined below [121].
For in-plane buckling [122],
E b u c k l i n g I E ¯ s 1 / 4 k = 2 π 1 1 v s γ ln k R 3 v s 1 v s 2 γ 2 ln k R 2 1 / 4
For out-of-plane buckling [123],
E b u c k l i n g I E ¯ s 1 / 4 k = 2 π 1 γ ln k R 3 2 γ 2 ln k R 2 1 / 4
Equations (31) and (32) can be accurately used for a beam with a cylindrical shape with radius R . E b u c k l i n g is the beam’s tensile modulus and E ¯ s = E 1 v s 2 is the reduced modulus of the substrate ( E   and     v s is the Young’s modulus and the Poisson ratio of the substrate, respectively, I = π 4 R 4 , and γ = 0.577 is the Euler’s constant).
To conclude, the application of the buckling phenomenon under a load offers a means to deduce the tensile modulus of nanometer-scale fibrils using basic AFM topography images.
An atomic force microscopy (AFM)-based method for tensile manipulation and subsequent nanoscale structural assessment of single collagen fibrils was recently presented by Quigley et al. [124]. The experimental setup is presented in Figure 6c. The geometric approximation of the fibril strain as a function of elongation time ( t ), stage speed ( v ), and segment length is presented below [124]:
ε = L L 0 L 0 = 1 + 4 v t L 0 2 1
In Equation (33), L 0 is the initial length of the fibril and L is the length at an arbitrary moment t.

4. Discussion

In this review paper, the fundamental methods for accurately measuring the dimensions and mechanical properties of nanofibers were presented. The tip convolution effects are a major source of error regarding the AFM topography images. For example, considering the case that the height of the nanofiber equals to the tip radius, w e x p w 2 r t i p . For example, if r t i p = H = 10   nm , w e x p w 20   nm and w e x p = 30   nm . On the contrary, the diameter of the nanofiber will be approximately equal to w = 10   nm . This is a ~300% error. These significant errors also greatly affect the mechanical properties determination. For example, consider the case of a purely elastic contact between a spherical tip and the nanofiber, using the magnitudes discussed above (i.e., the case in which r t i p = H = 10   nm ). Also using Equation (9), and also assuming that the accurate dimensions of the nanofiber are known (i.e., w = 10   nm ; thus, the radius of the nanofiber approximately equals to R = 5   nm ), it is concluded that
Z = a r t i p R 2 + b r t i p R + c = 1.264
The Young’s modulus is then calculated by fitting the data to a simple equation of the form
F = λ h 3 / 2
In Equation (34), λ equals to the following (see also Equation (6)):
λ = 4 3 E 1 v 2 r t i p 1 / 2 h 3 / 2 1 Z
However, due to the tip convolution effect, the measured radius of the nanofiber will be R 15   nm . In this case,
Z = a r t i p R 2 + b r t i p R + c = 1.13
Therefore,
λ = 4 3 E 1 v 2 r t i p 1 / 2 h 3 / 2 1 Z
Using Equations (35) and (36), it is concluded that
E Z = E Z
Thus, the error in the Young’s modulus determination will be equal to
E E E 100 % = 1 Z Z = 10.6 %
A similar analysis can be readily performed for other values of a nanofiber’s height and tip’s radius and also for elastic–plastic contact. Consider, for example, an elastic–plastic conical indentation on a nanofiber. Assume that h c R = 0.1 . Using Equation (21), it is concluded that
E r e a l E f l a t = c 4 h c R 4 + c 3 h c R 3 + c 2 h c R 2 + c 1 h c R + c 0 = 1.14
However, due to the tip convolution effect, h c R = 0.1 / 3 . Thus,
E r e a l E f l a t = c 4 h c R 4 + c 3 h c R 3 + c 2 h c R 2 + c 1 h c R + c 0 = 1.06
The error in this case regarding the Young’s modulus calculations is approximately 7%. It is important to also note that the accurate knowledge of a nanofiber’s radius is mandatory, regardless of the method that is being used for the determination of the mechanical properties as shown with Equations (28)–(32).
Another significant factor to take into consideration is the heterogeneity of nanofibers in AFM nanoindentation experiments (i.e., the dependence of the Young’s modulus from the indentation depth). Assume the elastic contact of a rigid spherical indenter with a nanofiber for small indentation depths. The contact stiffness is calculated as follows [125]:
S y = d F d y = 2 E y r c y 1 v 2 = 2 E y r t i p y 1 v 2 1 Z
In Equation (40), Z is given with Equation (9) and depends on the r t i p R ratio. In addition, r c is the contact radius of the equivalent circular projected contact area (the projected area at contact depth is an ellipse, as already mentioned) [125]. The force applied on the sample can be calculated as follows [125]:
F = 0 h S y d y = 2 r t i p Z 1 v 2 0 h E y y 1 / 2 d y
By changing variable y 3 / 2 = u ,   d u = 3 2 y 1 / 2 d y [125], and Equation (41) is written as follows:
F = 0 h S y d y = 4 r t i p 3 Z 1 v 2 0 h 3 / 2 E u 2 / 3 d u
However, as also shown in [125], the integral of Equation (42) equals to the area under the E u 2 / 3 = f u graph:
0 h 3 / 2 E u 2 / 3 d u = E 1 Δ u + E 2 Δ u + + E N Δ u
In addition, the average value of the function E u 2 / 3 is provided below:
E ¯ u 2 / 3 = E 1 Δ u + E 2 Δ u + + E N Δ u N Δ u = E ¯
Therefore [125],
0 h 3 / 2 E u 2 / 3 d u = E ¯ u 2 / 3 N Δ u = E ¯ h 3 / 2
By substituting Equation (45) in Equation (42), it is concluded that
F = 4 r t i p E ¯ 3 Z 1 v 2 h 3 / 2  
Thus, the same equation can be used in this case; however, the calculated magnitude is the average Young’s modulus for a specific domain. It should also be noted that the analysis presented in [125] was derived for indenting a heterogeneous half space. However, it can be easily extended for heterogeneous cylindrical samples since the factor Z depends only on the r t i p R ratio (see also Equation (9)). In addition, the same analysis can also be applied for different geometries of the indenter [126].
Also, it is important to note that apart from being heterogeneous, fibers are usually anisotropic. Therefore, only the transverse elastic modulus (not the axial modulus) is accessible through nanoindentation. Furthermore, in the case of adhesion between the tip and the sample, the DMT model, which is based on the Hertz model that yet includes a description of adhesion, should be used [127,128,129,130,131,132]. However, a sphere–plane geometry is standard in these works, so the appropriate modifications as shown in this paper are required to account for the cylindrical shape of the nanofiber.
The analysis presented in this review contributes to explaining the wide range of Young’s modulus values observed in experiments on nanofibers as reported in the literature (a characteristic example is the broad range of Young’s modulus values for collagen fibrils type I [16,17,18,19,20,21,99,107]). As demonstrated in this review, the results are notably influenced by various methods of data processing (such as the improper application of contact mechanics models) and by the tip convolution effect. The force–indentation data lead to different Young’s modulus values depending on the assumptions made about the dimensions and geometry of both the tip and the sample. In addition, due to the heterogeneity of biomaterials and biological materials at the nanoscale, it is crucial to emphasize the analysis presented with Equations (40)–(46), as the maximum indentation depth influences the calculated Young’s modulus. Therefore, this review represents a significant stride toward obtaining precise and reproducible results when testing collagen fibrils using AFM.
However, there are still several limitations that persist. Equations (1)–(5), which are commonly used to address the AFM tip convolution effect, were derived under the assumption of an object with a rectangular shape. However, the errors when assuming a perfect cylindrical shape are small [74]. Nevertheless, the fundamental issue is that in many cases, the nanofibers are not accurately represented with a perfect cylindrical shape. The consideration of precise geometries demands specialized algorithms, thereby increasing the complexity [74]. The same constraints apply to the determination of Young’s modulus. The assumption of a perfect cylinder is not universally applicable (e.g., the case of collagen fibrils in which the collagen molecules are packed in a quarter-staggered fashion so as to form the D-band periodicity, which is a repeating banding pattern of about 67 nm) [99]. Nevertheless, analytical models for arbitrary non-symmetric geometries have not yet been developed. Another limitation is associated with the heterogeneity of the nanofiber. It is important to note that the model presented with Equations (40)–(46) is valid under the assumption of the sample being a large sum of homogeneous slices [125]. The mechanical properties of the slices that are in contact should be similar; however, this assumption holds true in most cases for biological materials [125]. Lastly, with regard to the AFM nanoindentation method, it is also important to mention the substrate effect [133,134]. According to Buckle’s rule, the maximum indentation depth cannot exceed 5–10% of the sample’s thickness [133,134]. For cases in which the substrate affects the results, the correction factors presented in [85,135] should also be applied.
It is also worth noting that the primary objective for future research is the accurate 3D mechanical characterization of nanofibers with high mechanical heterogeneity, anisotropy, and a non-perfect cylindrical shape (e.g., collagen). By employing this approach, the internal mechanical patterns within each nanofiber will be revealed, potentially leading to significant findings applicable in medical processes, such as the diagnosis of various diseases.

5. Conclusions

In this paper, we presented and discussed the methods and fundamental sources of error when characterizing nanofibers using AFM. Concerning AFM imaging, the tip convolution effect significantly leads to an overestimation of nanofiber diameter. However, the real fiber diameter can be calculated using Equations (1)–(4) or (5), which were derived using elementary geometry. Although these equations were originally derived for imaging rectangular objects, they provide accurate results for cylindrical objects, such as fibers.
The mechanical properties of nanofibers are typically determined using AFM through the nanoindentation method. A significant source of error in both elastic and elastic–plastic contact cases is the assumption that the fiber behaves as an elastic half space. Hence, the relevant equations for determining the Young’s modulus of the nanofiber are Equation (6) for the elastic contact between a spherical indenter and a fiber, Equations (19)–(21) for elastic–plastic conical indentations, and Equations (20), (22), and (25) for elastic–plastic spherical indentations. It is also significant to note that even when using the equations mentioned above, significant errors regarding the Young’s modulus calculations may also arise due to the AFM tip convolution effect. Hence, besides achieving accurate nanofiber imaging, it is also crucial to minimize tip convolution effects since errors in fiber radius can affect the determination of mechanical properties. This remains valid even when employing other methods for mechanical nanocharacterization (Equations (28)–(32)).
In addition, nanofibers are also heterogeneous; their mechanical properties depend on the indentation depth. However, it was demonstrated that the same data processing analysis applies in this scenario as well (Equations (40)–(46)). In other words, the data can be fitted to the appropriate model of contact mechanics. However, in this case, the calculated parameter is the average Young’s modulus for a specific domain. Using this approach, the depth-dependent mechanical properties of individual nanofibers can easily be determined.
In conclusion, AFM provides numerous opportunities for precise nanoscale fiber characterization. Nonetheless, errors can occur due to the AFM tip convolution effect and the use of inappropriate contact mechanics models during data processing. In this review, we delve into the sources of errors in the characterization of nanofibrils for biomedical applications when utilizing AFM methods. Additionally, we present methods to overcome limitations in AFM experimental procedures and data processing. This facilitates the precise AFM characterization of individual nanofibers. It is worth noting that the methods used for imaging and mechanical characterization, as well as the associated errors arising from tip convolution effects and the misrepresentation of the sample’s shape (i.e., assuming an elastic half space instead of a cylindrical sample), were critically evaluated, and relevant examples were provided. These data will be of significant assistance to researchers in the field, enabling them to quickly assess the validity of a specific approximation in both imaging and mechanical property determination.

Author Contributions

Conceptualization, S.V.K.; methodology, S.V.K.; investigation, resources, S.V.K., A.S., G.C. and A.M.; writing—original draft preparation, S.V.K., A.S., G.C. and A.M.; writing—review and editing, S.V.K., A.S., G.C. and A.M. All authors have read and agreed to the published version of the manuscript.

Funding

This research received no external funding.

Data Availability Statement

Non applicable.

Conflicts of Interest

The authors declare no conflict of interest.

References

  1. Binnig, G.; Quate, C.F.; Gerber, C. Atomic force microscope. Phys. Rev. Lett. 1986, 56, 930–933. [Google Scholar] [CrossRef] [PubMed]
  2. Amabili, M.; Asgari, M.; Breslavsky, I.D.; Franchini, G.; Giovanniello, F.; Holzapfel, G.A. Microstructural and mechanical characterization of the layers of human descending thoracic aortas. Acta Biomater. 2021, 134, 401–421. [Google Scholar] [CrossRef] [PubMed]
  3. Kandapal, S.; Xu, B. Atomic Force Microscopy as a Tool to Study Transport Phenomena in Biological Systems. Processes 2023, 11, 2430. [Google Scholar] [CrossRef]
  4. Krieg, M.; Fläschner, G.; Alsteens, D.; Gaub, B.M.; Roos, W.H.; Wuite, G.J.L.; Gaub, H.E.; Gerber, C.; Dufrêne, Y.F.; Müller, D.J. Atomic force microscopy-based mechanobiology. Nat. Rev. Phys. 2019, 1, 41–57. [Google Scholar] [CrossRef]
  5. Bîrleanu, C.; Pustan, M.; Șerdean, F.; Merie, V. AFM Nanotribomechanical Characterization of Thin Films for MEMS Applications. Micromachines 2021, 13, 23. [Google Scholar] [CrossRef] [PubMed]
  6. Joshi, J.; Homburg, S.V.; Ehrmann, A. Atomic Force Microscopy (AFM) on Biopolymers and Hydrogels for Biotechnological Applications-Possibilities and Limits. Polymers 2022, 21, 1267. [Google Scholar] [CrossRef] [PubMed]
  7. Lekka, M. Discrimination between Normal and Cancerous Cells Using AFM. BioNanoScience 2016, 6, 65–80. [Google Scholar] [CrossRef] [PubMed]
  8. Ding, Y.; Wang, J.; Xu, G.K.; Wang, G.F. Are elastic moduli of biological cells depth dependent or not? Another explanation using a contact mechanics model with surface tension. Soft Matter 2018, 14, 7534–7541. [Google Scholar] [CrossRef]
  9. Kontomaris, S.V.; Stylianou, A. Atomic force microscopy for university students: Applications in biomaterials. Eur. J. Phys. 2017, 38, 033003. [Google Scholar] [CrossRef]
  10. Stylianou, A.; Kontomaris, S.V.; Grant, C.; Alexandratou, E. Atomic Force Microscopy on Biological Materials Related to Pathological Conditions. Scanning 2019, 2019, 8452851. [Google Scholar] [CrossRef]
  11. Oliver, W.C.; Pharr, G.M. An improved technique for determining hardness and elastic modulus using load and displacement sensing indentation experiments. J. Mater. Res. 1992, 7, 1564–1583. [Google Scholar] [CrossRef]
  12. Bunch, J.S.; Rhodin, T.N.; McEuen, P.L. Noncontact-AFM imaging of molecular surfaces using single-wall carbon nanotube technology. Nanotechnology 2004, 15, S762004. [Google Scholar] [CrossRef]
  13. de Pablo, P.J. Atomic force microscopy of virus shells. Semin. Cell Dev. Biol. 2018, 73, 199–208. [Google Scholar] [CrossRef]
  14. Heath, G.R.; Kots, E.; Robertson, J.L.; Lansky, S.; Khelashvili, G.; Weinstein, H.; Scheuring, S. Localization atomic force microscopy. Nature 2021, 594, 385–390. [Google Scholar] [CrossRef] [PubMed]
  15. Mateu, M.G. Mechanical properties of viruses analyzed by atomic force microscopy: A virological perspective. Virus Res. 2012, 168, 1–22. [Google Scholar] [CrossRef] [PubMed]
  16. Grant, C.A.; Brockwell, D.J.; Radford, S.E.; Thomson, N.H. Effects of hydration on the mechanical response of individual collagen fibrils. Appl. Phys. Lett. 2008, 92, 233902. [Google Scholar] [CrossRef]
  17. Heim, A.J.; Matthews, W.G.; Koob, T.J. Determination of the elastic modulus of native collagen fibrils via radial indentation. Appl. Phys. Lett. 2006, 89, 181902. [Google Scholar] [CrossRef]
  18. Papi, M.; Paoletti, P.; Geraghty, B.; Akhtar, R. Nanoscale characterization of the biomechanical properties of collagen fibrils in the sclera. Appl. Phys. Lett. 2014, 104, 103703. [Google Scholar] [CrossRef]
  19. Yadavalli, V.K.; Svintradze, D.V.; Pidaparti, R.M. Nanoscale measurements of the assembly of collagen to fibrils. Int. J. Biol. Macromol. 2010, 46, 458–464. [Google Scholar] [CrossRef]
  20. Parvej, M.S.; Wang, X.; Jiang, L. AFM based nanomechanical characterization of cellulose nanofibril. J. Compos. Mater. 2020, 54, 4487–4493. [Google Scholar] [CrossRef]
  21. Andriotis, O.G.; Manuyakorn, W.; Zekonyte, J.; Katsamenis, O.L.; Fabri, S.; Howarth, P.H.; Davies, D.E.; Thurner, P.J. Nanomechanical assessment of human and murine collagen fibrils via atomic force microscopy cantilever-based nanoindentation. J. Mech. Behav. Biomed. Mater. 2014, 39, 9–26. [Google Scholar] [CrossRef] [PubMed]
  22. Ottani, V.; Martini, D.; Franchi, M.; Ruggeri, A.; Raspanti, M. Hierarchical structures in fibrillar collagens. Micron 2002, 33, 587–596. [Google Scholar] [CrossRef] [PubMed]
  23. Fratzl, P.; Weinkamer, R. Nature’s hierarchical materials. Prog. Mater. Sci. 2007, 52, 1263–1334. [Google Scholar] [CrossRef]
  24. Vashishth, D. Hierarchy of bone microdamage at multiple length scales. Int. J. Fatigue 2007, 29, 1024–1033. [Google Scholar] [CrossRef] [PubMed]
  25. Bechtle, S.; Ang, S.F.; Schneider, G.A. On the mechanical properties of hierarchically structured biological materials. Biomaterials 2010, 31, 6378–6385. [Google Scholar] [CrossRef] [PubMed]
  26. Gautieri, A.; Vesentini, S.; Redaelli, A.; Buehler, M.J. Hierarchical Structure and Nanomechanics of Collagen Microfibrils from the Atomistic Scale Up. Nano Lett. 2011, 11, 757–766. [Google Scholar] [CrossRef] [PubMed]
  27. Hulmes, D.J.S. Collagen Diversity, Synthesis and Assembly Collagen; Springer: Boston, MA, USA, 2008; pp. 15–47. [Google Scholar]
  28. Kadler, K.E.; Baldock, C.; Bella, J.; Boot-Handford, R.P. Collagens at a glance. J. Cell Sci. 2007, 120, 1955–1958. [Google Scholar] [CrossRef] [PubMed]
  29. Fratzl, P. Collagen Structure and Mechanics; Springer: New York, NY, USA, 2008. [Google Scholar]
  30. Hasirci, V.A.S.I.F.; Vrana, E.; Zorlutuna, P.; Ndreu, A.; Yilgor, P.I.N.A.R.; Basmanav, F.B.; Aydin, E.R.K.İ.N. Nanobiomaterials: A review of the existing science and technology, and new approaches. J. Biomater. Sci. Polym. Ed. 2006, 17, 1241–1268. [Google Scholar] [CrossRef]
  31. Zeng, J.; Zeng, Z.; Cheng, Z.; Wang, Y.; Wang, X.; Wang, B.; Gao, W. Cellulose nanofibrils manufactured by various methods with application as paper strength additives. Sci. Rep. 2021, 11, 11918. [Google Scholar] [CrossRef]
  32. Thomas, B.; Raj, M.C.; Joy, J.; Moores, A.; Drisko, G.L.; Sanchez, C. Nanocellulose, a versatile green platform: From biosources to materials and their applications. Chem. Rev. 2018, 118, 11575–11625. [Google Scholar] [CrossRef]
  33. Shimizu, M.; Saito, T.; Fukuzumi, H.; Isogai, A. Hydrophobic, ductile, and transparent nanocellulose films with quaternary alkylammonium carboxylates on nanofibril surfaces. Biomacromolecules 2014, 15, 4320–4325. [Google Scholar] [CrossRef] [PubMed]
  34. Li, F.; Mascheroni, E.; Piergiovanni, L. The potential of nanocellulose in the packaging field: A review. Packag. Technol. Sci. 2015, 28, 475–508. [Google Scholar] [CrossRef]
  35. Jin, H.; Kettunen, M.; Laiho, A.; Pynnönen, H.; Paltakari, J.; Marmur, A.; Ikkala, O.; Ras, R.H.A. Superhydrophobic and superoleophobic nanocellulose aerogel membranes as bioinspired cargo carriers on water and oil. Langmuir 2011, 27, 1930–1934. [Google Scholar] [CrossRef] [PubMed]
  36. Adamcik, J.; Mezzenga, R. Study of amyloid fibrils via atomic force microscopy. Curr. Opin. Colloid. Interface 2012, 17, 369–376. [Google Scholar] [CrossRef]
  37. Lei, H.; Zhang, X.; Hu, J.; Zhang, Y. Self-assembly of amyloid-like peptides at interfaces investigated by atomic force microscopy. Sci. Adv. Mater. 2017, 9, 65–76. [Google Scholar] [CrossRef]
  38. Han, S.W.; Lee, T.H.; Kang, M.S.; Kim, H.J.; Shin, H.K. Probing amyloid β and the antibody interaction using atomic force microscopy. J. Nanosci. Nanotechnol. 2018, 18, 1410–1413. [Google Scholar] [CrossRef]
  39. Drolle, E.; Hane, F.; Lee, B.; Leonenko, Z. Atomic force microscopy to study molecular mechanisms of amyloid fibril formation and toxicity in Alzheimer’s disease. Drug Metab. Rev. 2014, 46, 207–223. [Google Scholar] [CrossRef]
  40. Sun, Y.; Cheng, S.; Lu, W.; Wang, Y.; Zhang, P.; Yao, Q. Electrospun fibers and their application in drug controlled release, biological dressings, tissue repair, and enzyme immobilization. RSC Adv. 2019, 9, 25712–25729. [Google Scholar] [CrossRef]
  41. Aragón, J.; Feoli, S.; Irusta, S.; Mendoza, G. Composite scaffold obtained by electro-hydrodynamic technique for infection prevention and treatment in bone repair. Int. J. Pharm. 2019, 557, 162–169. [Google Scholar] [CrossRef]
  42. Chou, S.; Wang, J.; Shang, L.; Akhtar, M.U.; Wang, Z.; Shi, B.; Feng, X.; Shan, A. Short, symmetric-helical peptides have narrow-spectrum activity with low resistance potential and high selectivity. Biomater. Sci. 2019, 7, 2394–2409. [Google Scholar] [CrossRef]
  43. Godakand, V.U.; Li, H.Y.; Alquezar, L.; Zhao, L.X.; Zhu, L.M.; de Silva, R.; de Silva, K.M.N.; Williams, G.R. Tunable drug release from blend poly(vinyl pyrrolidone)-ethyl cellulose nanofibers. Int. J. Pharm. 2019, 562, 172–179. [Google Scholar] [CrossRef] [PubMed]
  44. Chinatangkul, N.; Tubtimsri, S.; Panchapornpon, D.; Akkaramongkolporn, P.; Limmatvapirat, C.; Limmatvapirat, S. Design and characterisation of electrospun shellac-polyvinylpyrrolidone blended micro/nanofibres loaded with monolaurin for application in wound healing. Int. J. Pharm. 2019, 562, 258–270. [Google Scholar] [CrossRef] [PubMed]
  45. Bukhary, H.; Williams, G.R.; Orlu, M. Electrospun fixed dose formulations of amlodipine besylate and valsartan. Int. J. Pharm. 2018, 549, 446–455. [Google Scholar] [CrossRef] [PubMed]
  46. Wang, J.; Windbergs, M. Controlled dual drug release by coaxial electrospun fibers—Impact of the core fluid on drug encapsulation and release. Int. J. Pharm. 2019, 556, 363–371. [Google Scholar] [CrossRef] [PubMed]
  47. Neugirg, B.R.; Koebley, S.R.; Schniepp, H.C.; Fery, A. AFM-based mechanical characterization of single nanofibres. Nanoscale 2016, 8, 8414–8426. [Google Scholar] [CrossRef] [PubMed]
  48. Kontomaris, S.V. The Hertz Model in AFM Nanoindentation Experiments: Applications in Biological Samples and Biomaterials. Micro Nanosyst. 2018, 10, 11–22. [Google Scholar] [CrossRef]
  49. Gołek, F.; Mazur, P.; Ryszka, Z.; Zuber, S. AFM image artifacts. Appl. Surf. Sci. 2014, 304, 11–19. [Google Scholar] [CrossRef]
  50. Marques-Moros, F.; Forment-Aliaga, A.; Pinilla-Cienfuegos, E.; Canet-Ferrer, J. Mirror effect in atomic force microscopy profiles enables tip reconstruction. Sci. Rep. 2020, 10, 18911. [Google Scholar] [CrossRef]
  51. Chen, Z.; Luo, J.; Doudevski, I.; Erten, S.; Kim, S. Atomic force microscopy (AFM) analysis of an object larger and sharper than the AFM tip. Microsc. Microanal. 2019, 25, 1106–1111. [Google Scholar] [CrossRef]
  52. Fleischmann, C.; Paredis, K.; Melkonyan, D.; Vandervorst, W. Revealing the 3-dimensional shape of atom probe tips by atomic force microscopy. Ultramicroscopy 2018, 194, 221–226. [Google Scholar] [CrossRef]
  53. Kondratov, A.V.; Rogov, O.Y.; Gainutdinov, R.V. AFM reconstruction of complex-shaped chiral plasmonic nanostructures. Ultramicroscopy 2017, 181, 81–85. [Google Scholar] [CrossRef] [PubMed]
  54. Wang, C.; Fang, Y. Detection of tip convolution effects based on lateral force analysis. In Proceedings of the 2017 IEEE International Conference on Manipulation, Manufacturing and Measurement on the Nanoscale (3M-NANO), Shanghai, China, 7–11 August 2017; pp. 13–18. [Google Scholar]
  55. Lin, Y.C.; Komatsu, H.; Ma, J.; Axelsenb, P.H.; Fakhraai, Z. Quantitative analysis of amyloid polymorphism using height histograms to correct for tip convolution effects in atomic force microscopy imaging. RSC Adv. 2016, 6, 114286–114295. [Google Scholar] [CrossRef]
  56. Zhang, X.; Zhao, L.; Han, Z.; Xu, X.; Li, S.; Wu, A. A reconstruction method of AFM tip by using 2 µm lattice sample. Optoelectron. Lett. 2022, 18, 440–443. [Google Scholar] [CrossRef]
  57. Kim, S.; Moon, D.; Jeon, B.R.; Yeon, J.; Li, X.; Kim, S. Accurate Atomic-Scale Imaging of Two-Dimensional Lattices Using Atomic Force Microscopy in Ambient Conditions. Nanomaterials 2022, 12, 1542. [Google Scholar] [CrossRef] [PubMed]
  58. Eaton, P.; Batziou, K. Artifacts and Practical Issues in Atomic Force Microscopy. Methods Mol. Biol. 2019, 1886, 3–28. [Google Scholar] [PubMed]
  59. Shen, J.; Zhang, D.; Zhang, F.H.; Gan, Y. AFM tip-sample convolution effects for cylinder protrusions. Appl. Surf. Sci. 2017, 422, 482–491. [Google Scholar] [CrossRef]
  60. Díaz, S.R. On the propagation of methodological uncertainties in Depth Sensing Indentation data analysis: A brief and critical review. Mech. Res. Commun. 2020, 105, 103516. [Google Scholar] [CrossRef]
  61. Nguyen, Q.D.; Chung, K.H. Effect of tip shape on nanomechanical properties measurements using AFM. Ultramicroscopy 2019, 202, 1–9. [Google Scholar] [CrossRef]
  62. Kontomaris, S.V.; Malamou, A. The truncated cone effect in AFM nanoindentation on soft samples. Micro Nanosyst. 2023, 15, 153–158. [Google Scholar] [CrossRef]
  63. Guillonneau, G.; Wheeler, J.M.; Wehrs, J.; Philippe, L.; Baral, P.; Höppel, H.W.; Göken, M. Determination of the true projected contact area by in situ indentation testing. J. Mater. Res. 2019, 34, 2859–2868. [Google Scholar] [CrossRef]
  64. Jakes, J.E.; Stauffer, D. Contact area correction for surface tilt in pyramidal nanoindentation. J. Mater. Res. 2021, 36, 2189–2197. [Google Scholar] [CrossRef]
  65. Andriotis, O.G.; Elsayad, K.; Smart, D.E.; Nalbach, M.; Davies, D.E.; Thurner, P.J. Hydration and nanomechanical changes in collagen fibrils bearing advanced glycation end-products. Biomed. Opt. Express 2019, 10, 1841–1855. [Google Scholar] [CrossRef] [PubMed]
  66. Kontomaris, S.V.; Stylianou, A.; Nikita, K.S.; Malamou, A. A discussion regarding the application of the Hertz contact theory on biological samples in AFM nanoindentation experiments. Micro Nanosys. 2021, 13, 42–48. [Google Scholar] [CrossRef]
  67. Minary-Jolandan, M.; Yu, M.F. Nanomechanical heterogeneity in the gap and overlap regions of type I collagen fibrils with implications for bone heterogeneity. Biomacromolecules 2009, 10, 2565–2570. [Google Scholar] [CrossRef] [PubMed]
  68. Stylianou, A.; Kontomaris, S.V.; Yova, D. Assessing Collagen Nanoscale Thin Films Heterogeneity by AFM Multimode Imaging and Nanoindetation for NanoBioMedical Applications. Micro Nanosyst. 2014, 6, 95–102. [Google Scholar] [CrossRef]
  69. Allison, D.P.; Mortensen, N.P.; Sullivan, C.J.; Doktycz, M.J. Atomic force microscopy of biological samples. Wiley Interdiscip. Rev. Nanomed. Nanobiotechnol. 2010, 2, 618–634. [Google Scholar] [CrossRef] [PubMed]
  70. Rabe, U.; Kopycinska, M.; Hirsekorn, S.; Arnold, W. Evaluation of the contact resonance frequencies in atomic force microscopy as a method for surface characterization. Ultrasonics 2002, 40, 49–54. [Google Scholar] [CrossRef] [PubMed]
  71. Chena, Z.; Chenb, F.; Wang, D.; Zhou, L. Tapping modes in the Atomic Force Microscope model with Lennard-Jones force and slow-fast base motion. Chaos Solit. Fractals 2021, 144, 110696. [Google Scholar] [CrossRef]
  72. Dankowicz, H. Nonlinear dynamics as an essential tool for non-destructive characterization of soft nanostructures using tapping-mode atomic force microscopy. Phil. Trans. R. Soc. A 2006, 364, 3505–3520. [Google Scholar] [CrossRef]
  73. Bellotti, R.; Picotto, G.B.; Ribotta, L. AFM Measurements and Tip Characterization of Nanoparticles with Different Shapes. Nanomanuf. Metrol. 2022, 5, 127–138. [Google Scholar] [CrossRef]
  74. Canet-Ferrer, J.; Coronado, E.; Forment-Aliaga, A.; Pinilla-Cienfuegos, E. Correction of the tip convolution effects in the imaging of nanostructures studied through scanning force microscopy. Nanotechnology 2014, 25, 395703. [Google Scholar] [CrossRef] [PubMed]
  75. Reiss, G.; Schneider, F.; Vancea, J.; Hoffmann, H. Scanning tunneling microscopy on rough surfaces: Deconvolution of constant current images. Appl. Phys. Lett. 1990, 57, 867. [Google Scholar] [CrossRef]
  76. Keller, D. Reconstruction of STM and AFM images distorted by finite-size tips. Surf. Sci. 1991, 253, 353. [Google Scholar] [CrossRef]
  77. Villarubia, J.S. Morphological estimation of tip geometry for scanned probe microscopy. Surf. Sci. 1994, 321, 287. [Google Scholar] [CrossRef]
  78. Villarubia, J.S. Algorithms for scanned probe microscopy: Image simulation, surface reconstruction and tip estimation. J. Res. Natl. Inst. Stand. Technol. 1997, 102, 425. [Google Scholar] [CrossRef] [PubMed]
  79. Wang, W.; Niu, D.X.; Jiang, C.R.; Yang, X.J. The conductive properties of single DNA molecules studied by torsion tunneling atomic force microscopy. Nanotechnology 2013, 25, 025707. [Google Scholar] [CrossRef] [PubMed]
  80. Winzer, A.T.; Kraft, C.; Bhushan, S.; Stepanenko, V.; Tessmer, I. Correcting for AFM tip induced topography convolutions in protein–DNAsamples. Ultramicroscopy 2012, 121, 8. [Google Scholar] [CrossRef]
  81. Wang, C.; Itoh, H. Evaluation of errors in the measurement of surface roughness at high spatial frequency by atomic force microscopy on a thin film. J. Appl. Phys. 2012, 51, 08KB11. [Google Scholar] [CrossRef]
  82. Severin, N.; Dorn, M.; Kalachev, A.; Rabe, J.P. Replication of Single macromolecules with graphene. Nano Lett. 2011, 11, 2436. [Google Scholar] [CrossRef]
  83. Rodriguez, R.D.; Lacaze, E.; Jupille, J. Probing the probe: AFM tip-profiling via nanotemplates to determine Hamaker constants from phase–distance curves. Ultramicroscopy 2012, 121, 25. [Google Scholar] [CrossRef]
  84. Alle, M.J.; Hud, N.V.; Balooch, M.; Tench, R.J.; Siekhaus, W.J.; Balhorn, R. Tip-radius-induced artifacts in AFM images of protamine-complexed DNA fibers. Ultramicroscopy 1992, 42, 1095. [Google Scholar] [CrossRef] [PubMed]
  85. Kontomaris, S.V.; Malamou, A.; Stylianou, A. The Hertzian theory in AFM nanoindentation experiments regarding biological samples: Overcoming limitations in data processing. Micron 2022, 155, 103228. [Google Scholar] [CrossRef] [PubMed]
  86. Tsuji, T.; Tsuboi, K.; Yokota, S.; Tagawa, S.; Kondo, T. Characterization of an Amphiphilic Janus-Type Surface in the Cellulose Nanofibril Prepared by Aqueous Counter Collision. Biomacromolecules 2021, 22, 620–628. [Google Scholar] [CrossRef] [PubMed]
  87. Sambani, K.; Kontomaris, S.V.; Yova, D. Atomic Force Microscopy Imaging of Elastin Nanofibers Self-Assembly. Materials 2023, 16, 4313. [Google Scholar] [CrossRef] [PubMed]
  88. Mattos, B.D.; Tardy, B.L.; Rojas, O.J. Accounting for Substrate Interactions in the Measurement of the Dimensions of Cellulose Nanofibrils. Biomacromolecules 2019, 20, 2657–2665. [Google Scholar] [CrossRef] [PubMed]
  89. Walsh, K.J.; Shiflett, O.; Shah, S.; Renner, T.; Soulas, N.; Scharre, D.; McTigue, D.; Agarwal, G. Artifacts in magnetic force microscopy of histological sections. J. Magn. Magn. Mater. 2022, 564, 170116. [Google Scholar] [CrossRef]
  90. Vokoun, D.; Samal, S.; Stachiv, I. Magnetic Force Microscopy in Physics and Biomedical Applications. Magnetochemistry 2022, 8, 42. [Google Scholar] [CrossRef]
  91. Passeri, D.; Dong, C.; Angeloni, L.; Pantanella, F.; Natalizi, T.; Berlutti, F. Thickness Measurement of Soft Thin Films on Periodically Patterned Magnetic Substrates by Phase Difference Magnetic Force Microscopy. Ultramicroscopy 2014, 136, 96–106. [Google Scholar] [CrossRef]
  92. Newacheck, S.; Huynh, N.U.; Youssef, G. Colossal Crystal in P3HT:PCBM Blends for Enhanced Organic Magnetism. Cryst. Growth Des. 2021, 21, 5300–5305. [Google Scholar] [CrossRef]
  93. Nocera, T.M.; Zeng, Y.; Agarwal, G. Distinguishing Ferritin from Apoferritin Using Magnetic Force Microscopy. Nanotechnology 2014, 25, 461001. [Google Scholar] [CrossRef]
  94. Zhang, N.; Yu, X.; Xie, J.; Xu, H. New Insights into the Role of Ferritin in Iron Homeostasis and Neurodegenerative Diseases. Mol. Neurobiol. 2021, 58, 2812–2823. [Google Scholar] [CrossRef] [PubMed]
  95. Cinar, I.; Lacour, D.; Montaigne, F. Artifacts in magnetic force microscopy under in-plane applied magnetic field: Magnetic bubble as a case study. J. Magn. Magn. Mater. 2020, 500, 166296. [Google Scholar] [CrossRef]
  96. Angeloni, L.; Passeri, D.; Reggente, M.; Mantovani, D.; Rossi, M. Removal of electrostatic artifacts in magnetic force microscopy by controlled magnetization of the tip: Application to superparamagnetic nanoparticles. Sci. Rep. 2016, 6, 26293. [Google Scholar] [CrossRef] [PubMed]
  97. Ciuta, G.; Dumas-Bouchiat, F.; Dempsey, N.; Fruchart, O. Some aspects of Magnetic Force Microscopy of hard magnetic films. IEEE Trans. Magn. 2016, 52, 6500408. [Google Scholar] [CrossRef]
  98. Sifford, J.; Walsh, K.J.; Tong, S.; Bao, G.; Agarwal, G. Indirect magnetic force microscopy. Nanoscale Adv. 2019, 1, 2348. [Google Scholar] [CrossRef] [PubMed]
  99. Kontomaris, S.V.; Stylianou, A.; Malamou, A. Atomic Force Microscopy Nanoindentation Method on Collagen Fibrils. Materials 2022, 15, 2477. [Google Scholar] [CrossRef] [PubMed]
  100. Creasey, R.G.; Gibson, C.T.; Voelcker, N.H. Characterization of fiber-forming peptides and proteins by means of atomic force microscopy. Curr. Protein Pept. Sci. 2012, 13, 232–257. [Google Scholar] [CrossRef]
  101. Stylianou, A.; Gkretsi, V.; Patrickios, C.S.; Stylianopoulos, T. Exploring the Nano-Surface of Collagenous and Other Fibrotic Tissues with AFM. In Fibrosis: Methods and Protocols; Rittié, L., Ed.; Springer: New York, NY, USA, 2017; pp. 453–489. [Google Scholar]
  102. Schillers, H.; Rianna, C.; Schäpe, J.; Luque, T.; Doschke, H.; Wälte, M.; Uriarte, J.J.; Campillo, N.; Michanetzis, G.P.; Bobrowska, J.; et al. Standardized nanomechanical atomic force microscopy procedure (SNAP) for measuring soft and biological samples. Sci. Rep. 2017, 7, 5117. [Google Scholar] [CrossRef]
  103. Kontomaris, S.V.; Stylianou, A.; Malamou, A.; Stylianopoulos, T. A discussion regarding the approximation of cylindrical and spherical shaped samples as half spaces in AFM nanoindentation experiments. Mater. Res. Express 2018, 5, 085402. [Google Scholar] [CrossRef]
  104. Vojta, J.H.V.; Ilavsky, M. Penetration Behavior of the System Sphere-Cylinder. Polym. Eng. Sci. 1980, 20, 402–405. [Google Scholar]
  105. Kontomaris, S.V.; Malamou, A. An extension of the general nanoindentation equation regarding cylindrical—Shaped samples and a simplified model for the contact ellipse determination. Mater. Res. Express 2018, 5, 125403. [Google Scholar] [CrossRef]
  106. Oliver, W.C.; Pharr, G.M. Measurement of hardness and elastic modulus by instrumented indentation: Advances in understanding and refinements to methodology. J. Mater. Res. 2004, 19, 3–20. [Google Scholar] [CrossRef]
  107. Wenger, M.P.E.; Bozec, L.; Horton, M.A.; Mesquidaz, P. Mechanical properties of collagen fibrils. Biophys. J. 2007, 93, 1255–1263. [Google Scholar] [CrossRef] [PubMed]
  108. Bouzakis, K.D.; Pappa, M.; Maliaris, G.; Michailidis, N. Fast determination of parameters describing manufacturing imperfections and operation wear of nanoindenter tips. Surf. Coat. Technol. 2013, 215, 218–223. [Google Scholar] [CrossRef]
  109. McAllister, Q.P.; Gillespie, J.W.; VanLandingham, M.R. Nonlinear indentation of fibers. J. Mater. Res. 2012, 27, 197–213. [Google Scholar] [CrossRef]
  110. Kontomaris, S.V.; Malamou, A. Hertz model or Oliver & Pharr analysis? Tutorial regarding AFM nanoindentation experiments on biological samples. Mater. Res. Express 2020, 7, 033001. [Google Scholar]
  111. Cheng, Q.; Wang, S. A method for testing the elastic modulus of single cellulose fibrils via atomic force microscopy. Compos. Part A Appl. Sci. 2008, 39, 1838–1843. [Google Scholar] [CrossRef]
  112. Bazbouz, M.B.; Stylios, G.K. The tensile properties of electrospun nylon 6 single nanofibers. J. Polym. Sci. B Polym. Phys. 2010, 48, 1719–1731. [Google Scholar] [CrossRef]
  113. Kluge, D.; Singer, J.C.; Neubauer, J.W.; Abraham, F.; Schmidt, H.-W.; Fery, A. Influence of the Molecular Structure and Morphology of Self-Assembled 1,3,5-Benzenetrisamide Nanofibers on their Mechanical Properties. Small 2012, 8, 2563–2570. [Google Scholar] [CrossRef]
  114. Tanur, A.E.; Wang, J.; Reddy, A.L.; Lamont, D.N.; Yap, Y.K.; Walker, G.C. Diameter-dependent bending modulus of individual multiwall boron nitride nanotubes. J. Phys. Chem. B 2013, 117, 4618–4625. [Google Scholar] [CrossRef]
  115. Chen, Y.; Dorgan, B.L., Jr.; McIlroy, D.N.; Aston, D.E. On the importance of boundary conditions on nanomechanical bending behavior and elastic modulus determination of silver nanowires. J. Appl. Phys. 2006, 100, 10430. [Google Scholar] [CrossRef]
  116. Ling, X.Y.; Phang, I.Y.; Schonherr, H.; Reinhoudt, D.N.; Vancso, G.J.; Huskens, J. Freestanding 3D supramolecularparticle bridges: Fabrication and mechanical behavior. Small 2009, 5, 1428–1435. [Google Scholar] [CrossRef] [PubMed]
  117. Iwamoto, S.; Kai, W.; Isogai, A.; Iwata, T. Elastic modulus of single cellulose microfibrils from tunicate measured by atomic force microscopy. Biomacromolecules 2009, 10, 2571–2576. [Google Scholar] [CrossRef] [PubMed]
  118. Stachewicz, U.; Bailey, R.J.; Wang, W.; Barber, A.H. Size dependent mechanical properties of electrospun polymer fibers from a composite structure. Polymer 2012, 53, 5132–5137. [Google Scholar] [CrossRef]
  119. Wu, B.; Heidelberg, A.; Boland, J.J. Mechanical properties of ultrahigh-strength gold nanowires. Nat. Mater. 2005, 4, 525–529. [Google Scholar] [CrossRef]
  120. Tao, X.Y.; Dong, L.X.; Wang, X.N.; Zhang, W.K.; Nelson, B.J.; Li, X.D. B4C-nanowires/carbon-microfiber hybrid structures and composites from cotton T-shirts. Adv. Mater. 2010, 22, 2055–2059. [Google Scholar] [CrossRef] [PubMed]
  121. Gachon, E.; Mesquida, P. Mechanical properties of collagen fibrils determined by buckling analysis. Acta Biomater. 2022, 149, 60–68. [Google Scholar] [CrossRef]
  122. Xiao, J.; Ryu, S.Y.; Huang, Y.; Hwang, K.C.; Paik, U.; Rogers, J.A. Mechanics of nanowire/nanotube in-surface buckling on elastomeric substrates. Nanotechnology 2010, 21, 85708. [Google Scholar] [CrossRef]
  123. Khang, D.Y.; Xiao, J.; Kocabas, C.; MacLaren, S.; Banks, T.; Jiang, H.; Huang, Y.Y.; Rogers, J.A. Molecular scale buckling mechanics in individual aligned single-wall carbon nanotubes on elastomeric substrates. Nano. Lett. 2008, 8, 124–130. [Google Scholar] [CrossRef]
  124. Quigley, A.S.; Veres, S.P.; Kreplak, L. Bowstring Stretching and Quantitative Imaging of Single Collagen Fibrils via Atomic Force Microscopy. PLoS ONE 2016, 11, e0161951. [Google Scholar] [CrossRef]
  125. Kontomaris, S.V.; Stylianou, A.; Georgakopoulos, A.; Malamou, A. Is it mathematically correct to fit AFM data (obtained on biological materials) to equations arising from Hertzian mechanics? Micron 2023, 164, 103384. [Google Scholar] [CrossRef] [PubMed]
  126. Kontomaris, S.V.; Stylianou, A.; Chliveros, G.; Malamou, A. AFM Indentation on Highly Heterogeneous Materials Using Different Indenter Geometries. Appl. Mech. 2023, 4, 460–475. [Google Scholar] [CrossRef]
  127. Sweers, K.; Van Der Werf, K.; Bennink, M.; Subramaniam, V. Nanomechanical properties of α-synuclein amyloid fibrils: A comparative study by nanoindentation, harmonic force microscopy, and Peakforce QNM. Nanoscale Res. Lett. 2011, 6, 270. [Google Scholar] [CrossRef] [PubMed]
  128. Adamcik, J.; Berquand, A.; Mezzenga, R. Single-step direct measurement of amyloid fibrils stiffness by peak force quantitative nanomechanical atomic force microscopy. Appl. Phys. Lett. 2011, 98, 193701. [Google Scholar] [CrossRef]
  129. Adamcik, J.; Lara, C.; Usov, I.; Jeong, J.S.; Ruggeri, F.S.; Dietler, G.; Lashuel, H.A.; Hamley, I.W.; Mezzenga, R. Measurement of intrinsic properties of amyloid fibrils by the peak force QNM method. Nanoscale 2012, 4, 4426–4429. [Google Scholar] [CrossRef] [PubMed]
  130. Lamour, G.; Yip, C.K.; Li, H.; Gsponer, J. High Intrinsic Mechanical Flexibility of Mouse Prion Nanofibrils Revealed by Measurements of Axial and Radial Young’s Moduli. ACS Nano 2014, 8, 3851–3861. [Google Scholar] [CrossRef] [PubMed]
  131. Ruggeri, F.S.; Adamcik, J.; Jeong, J.S.; Lashuel, H.A.; Mezzenga, R.; Dietler, G. Influence of the β-sheet content on the mechanical properties of aggregates during amyloid fibrillization. Angew. Chem. Int. Ed. Engl. 2015, 54, 2462–2466. [Google Scholar] [CrossRef] [PubMed]
  132. Sweers, K.K.M.; van der Werf, K.O.; Bennink, M.L.; Subramaniam, V. Atomic force microscopy under controlled conditions reveals structure of C-terminal region of α-synuclein in amyloid fibrils. ACS Nano. 2012, 6, 5952–5960. [Google Scholar] [CrossRef]
  133. Persch, G.; Born, C.; Utesch, B. Nano-hardness investigations of thin films by an atomic force microscope. Microelectron. Eng. 1994, 24, 113–121. [Google Scholar] [CrossRef]
  134. Kontomaris, S.V.; Stylianou, A.; Nikita, K.S.; Malamou, A. Determination of the linear elastic regime in AFM nanoindentation experiments on cells. Mater. Res. Express 2019, 11, 115410. [Google Scholar] [CrossRef]
  135. Dimitriadis, E.K.; Horkay, F.; Maresca, J.; Kachar, B.; Chadwick, R.S. Determination of elastic moduli of thin layers of soft material using the atomic force microscope. Biophys. J. 2002, 82, 2798–2810. [Google Scholar] [CrossRef]
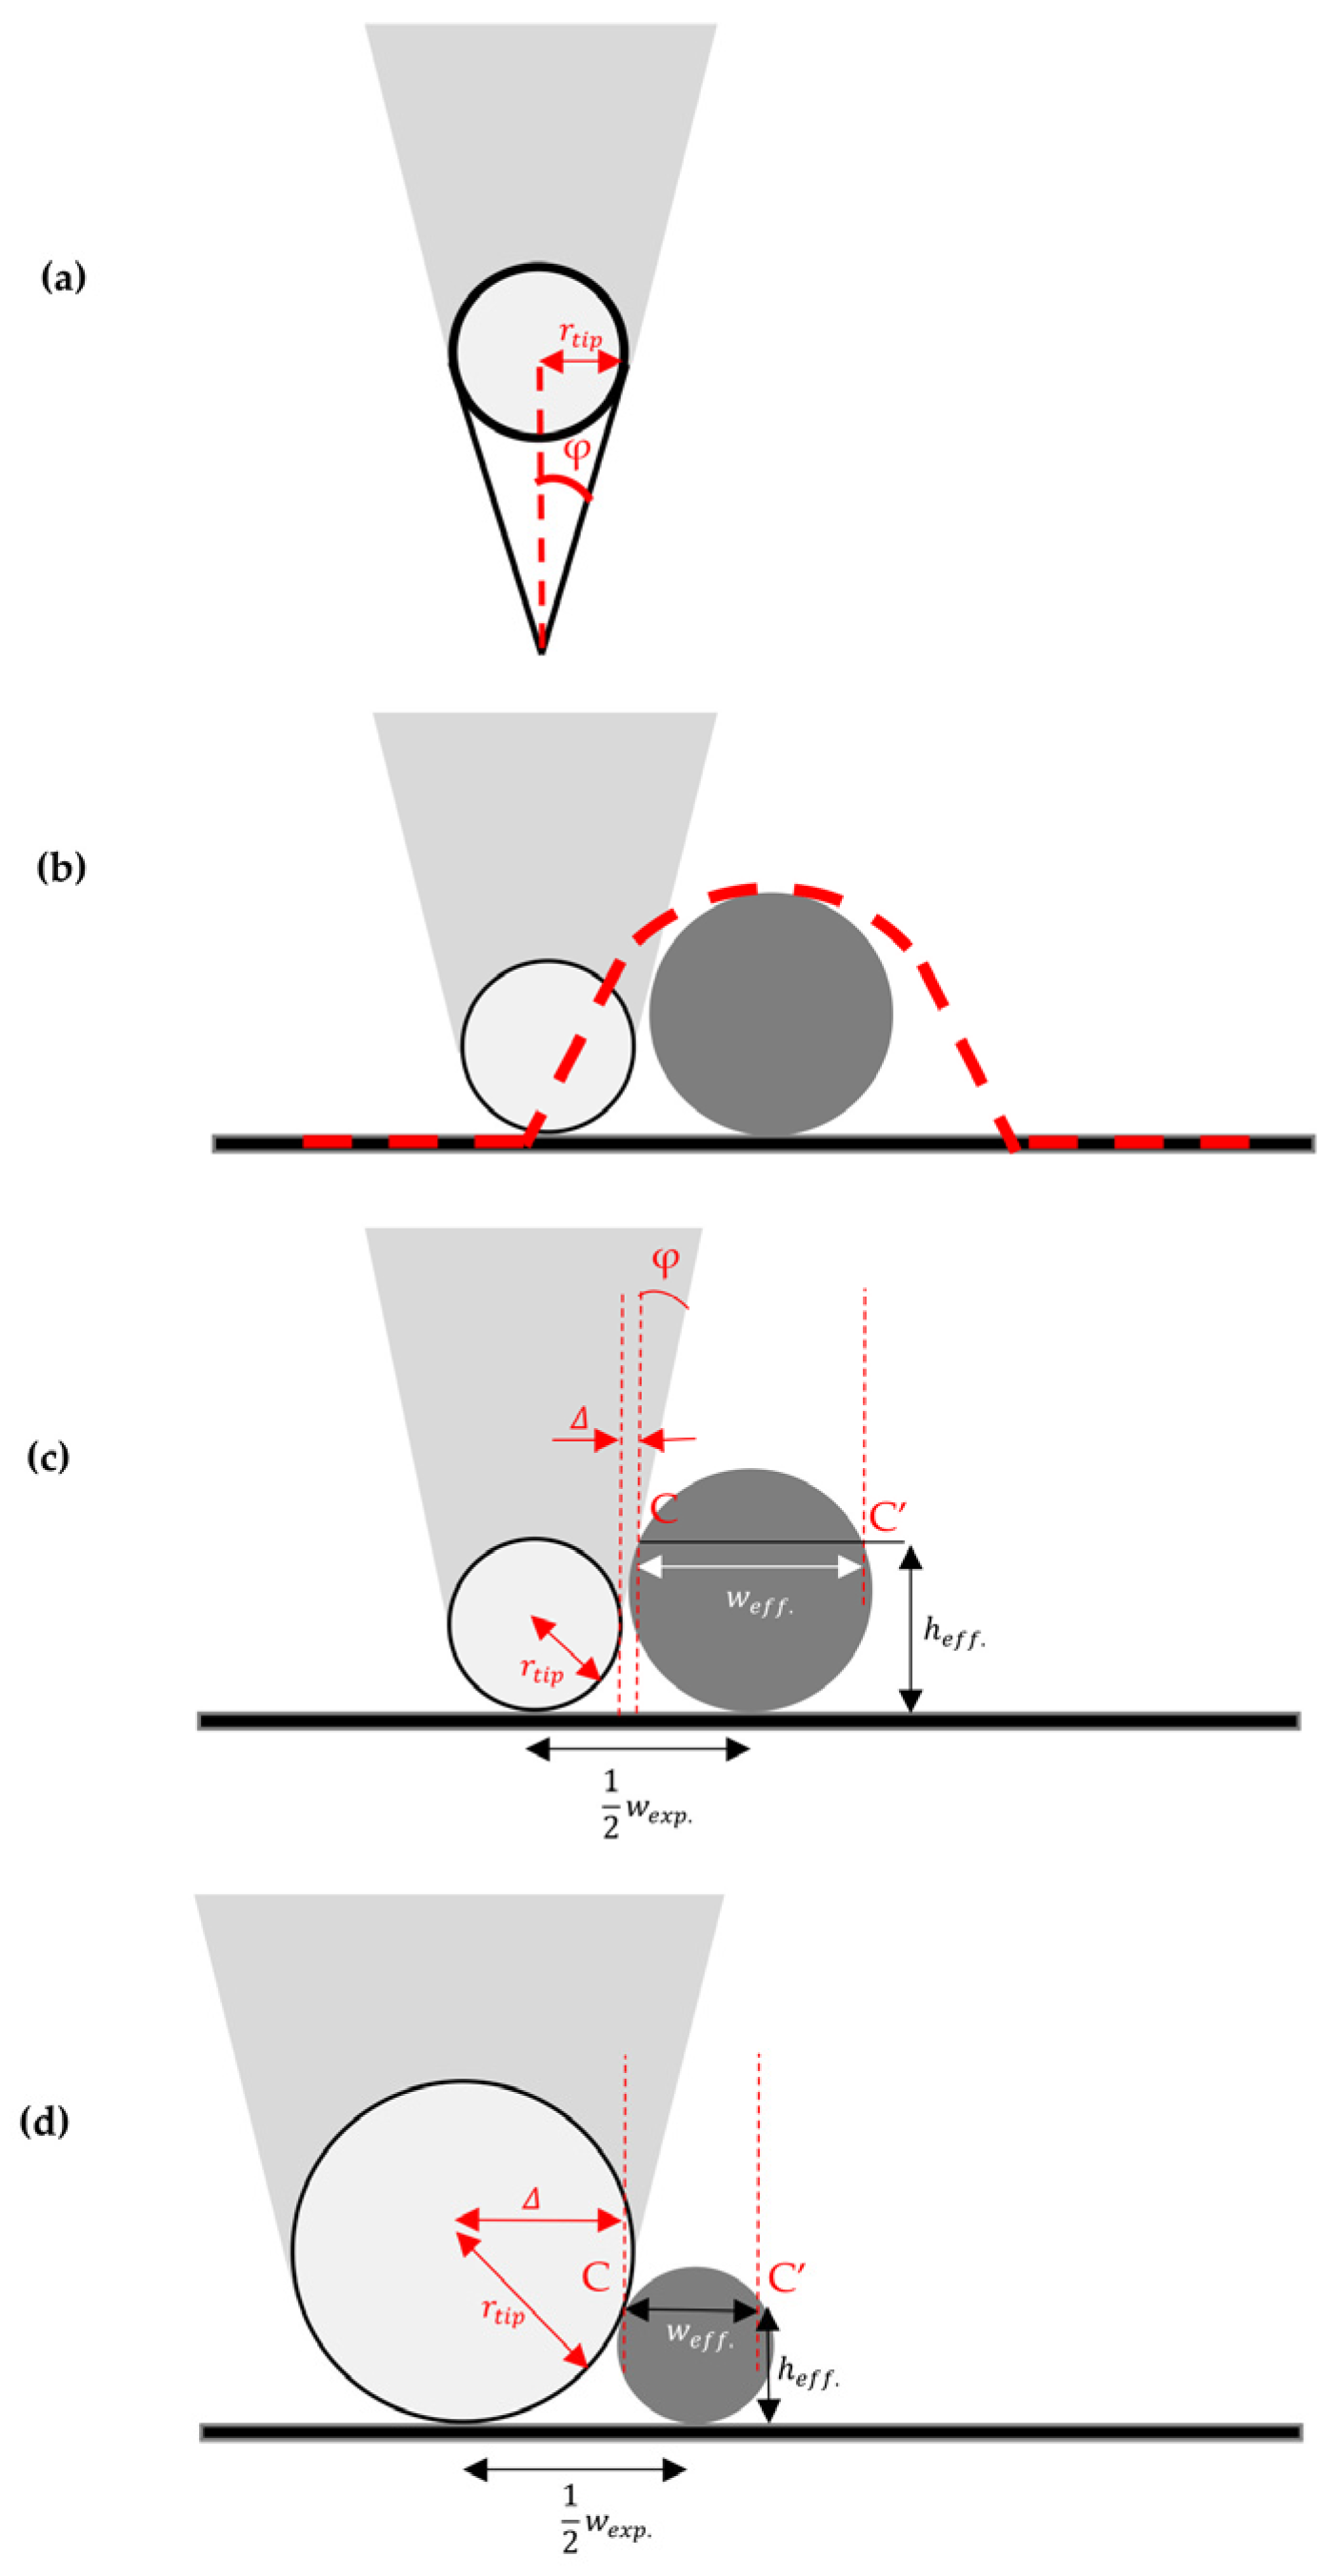
Figure 1. (a) A sphero-conical indenter. (b) A nanofiber is scanned using an AFM tip. The red dotted line presents ‘what is being recorded’ using the AFM tip. In particular, the recorded fiber appears to have a significantly larger radius compared to the actual one. (c) The interaction of the AFM tip with the fiber assuming that r t i p < H , and (d) assuming that r t i p > H (where H is the fibril’s height).
Fibers 11 00083 g001
Figure 2. (a) The ( w e x p w e f f ) / r t i p = f h e f f / r t i p function for different tip-to-face angles assuming that the point of contact between the tip and the sample is positioned along the linear side portion of the tip. The extent of convolution error primarily relies on φ for objects with H r t i p . For objects whose sizes are similar to r t i p , convolution effects are distinctly around 2 r t i p . (b) The ( w e x p w e f f ) / r t i p = f h e f f / r t i p function, if the point of contact is situated beneath the rounded end of the tip. In this case, the convolution error is solely dependent on r t i p , considering a fixed H value. (c) The 1 2 w e x p w r t i p = f h e f f r t i p functions for φ = 70.3 ° using Equations (1)–(5) for comparison.
Fibers 11 00083 g002
Figure 3. AFM nanoindentation experiments on a nanofiber with radius R using a (a) spherical indenter (with radius r t i p ) and using a (b) conical indenter (with cone’s half angle φ ).
Fibers 11 00083 g003
Figure 4. (a) The A e l l i p s e A f l a t = f h c R function for the domain 0 h c R 0.2 for the case of a Berkovic indenter ( φ = 70.3 ° ). (b) The E r e a l E f l a t = f h c R function for the same domain. (c) The data was fitted to a 4th-degree polynomial curve (Equation (21)).
Fibers 11 00083 g004
Figure 5. (a) The A e l l i p s e A f l a t = f h c R function for the domain 0 h c R 0.2 for the case of 4 different indenters ( φ = 15 ° ,   30 ° ,   45 ° ,   and   60 ° ). (b) The E r e a l E f l a t = f h c R function for the same domain and the same indenters.
Fibers 11 00083 g005
Figure 6. (a) The three-point bending test. (b) Evaluation of tensile modulus. (c) The geometric approximation of the fibril strain as a function of elongation time, stage speed, and segment length.
Fibers 11 00083 g006
Disclaimer/Publisher’s Note: The statements, opinions and data contained in all publications are solely those of the individual author(s) and contributor(s) and not of MDPI and/or the editor(s). MDPI and/or the editor(s) disclaim responsibility for any injury to people or property resulting from any ideas, methods, instructions or products referred to in the content.