Article

Modelling Pore Size Distribution Function of Twist-Texturized Yarns and Single-Jersey Knitted Fabrics

1
German Institutes of Textile and Fiber Research (DITF), 73770 Denkendorf, Germany
2
Institute of Chemical Process Engineering (ICVT), University of Stuttgart, 70199 Stuttgart, Germany
3
Institute for Textile and Fiber Technologies (ITFT), University of Stuttgart, 70569 Stuttgart, Germany
*
Authors to whom correspondence should be addressed.
Fibers 2025, 13(4), 48; https://doi.org/10.3390/fib13040048
Submission received: 8 March 2025 / Revised: 4 April 2025 / Accepted: 9 April 2025 / Published: 16 April 2025

Abstract

:
Pore sizes on the micrometre scale are a critical factor influencing the fluid transport properties of textiles. Consequently, the pore size distribution function is a desirable parameter in the design of textiles for technical applications. However, the experimental determination of pore size and its distribution can be challenging, costly, or impractical. Knitted fabrics offer a wide range of porosity and pore size distribution properties. While statistical models have shown reasonable accuracy in predicting pore size distributions in nonwovens and filter media, no equivalent model exists for twist-texturized yarns and single-jersey knitted fabrics. This study presents a hierarchical pore model for single-jersey fabrics. The model uses a log-normal distribution for the intra-yarn pores in the yarn and cylindrical pores for inter-yarn pores between the yarns in the fabric. With these two pore sizes, the model quantitatively characterises the porous structure of the fabric. Initial validation of the model for intra-yarn pores on four yarns of different fibre finenesses shows that the model can cover the influence of different fibre counts. For the validation on the fabric scale, two tomography datasets of single-jersey knitted fabrics show that the presented model can capture the effect of different fabric structures. A parameter study visualises the effects of both yarn and knitting parameters on the pore size distribution function of single-jersey knitted fabrics. The mean pore sizes of the fabrics are given. The results deepen the understanding of the porous properties of knitted fabrics and provide a valuable direction for structural fabric development on knitting machines.

1. Introduction

Textiles made from yarns are widely used in various technical applications due to their exceptional properties, which stem from their intricate fibrous structure. The fibrous structure has a certain hierarchy resulting from the construction of the fabrics from yarns, which themselves are made up of oriented fibres. In yarns, the main orientation of the fibres is given by the direction of the yarns. In the fabric, the main direction of the yarn is strongly dependent on the process technology used. In woven fabrics, the yarns lay mostly linearly arranged in warp and weft directions, while in knitted fabric, the yarns follow a meandering path. This difference in yarn orientation determines the porous properties, which lead, in the case of knitted fabrics, to utilization in applications where effective air, moisture, or thermal transport is essential.
Common yarns used in knitted garments are staple fibre yarns manufactured from natural fibres like cotton or wool or from man-made fibres like viscose or polyester. Staple fibre yarns are used because of their fibrousness and the resulting enhanced wearing comfort in the garment. Since the staple fibre spinning process is expensive and the strength of the short staple fibre yarn is limited, twist-texturized multifilament yarns (TTYs) are commonly used because of their lower manufacturing costs and higher strength. A comprehensive overview on the process and relevant parameters of TTY production can be found in the literature [1].
The processing of twist-texturized yarns in the knitting process potentially offers a broad variety of possibilities to adjust the pore properties of the textile in a defined way. This gives the knitted structure huge potential for high-performance garments or technical applications [2,3,4,5]. As porous properties play a crucial role in facilitating gas and liquid transport processes within all textile materials, a lot of research intends to determine the porosity of textiles and correlate transport properties with porosity [6,7]. Accordingly, for material development and optimisation, a fundamental understanding of porous properties of the structures is required.
The relative fraction of voids in a material to the overall volume is the material’s porosity. Qualitative properties of porous media describe whether the pores are open, closed, or blind, or, in geometrical terms, either cylindrical, spherical, or slit shaped [8]. In clothing applications, where fluid transport through the fabric is crucial, numerous comfort properties like air permeability and water vapour transport are well correlated with the fabric’s porosity [6,7,9]. In addition to the integral quantity of porosity, the pore width (or pore size) is used to characterise materials. Due to the inhomogeneous shape of the pores, it is often given as a theoretical value, e.g., a diameter of a representing cylinder or sphere. The determination of the borders of the pore is crucial. As materials rarely show only one single pore size, they usually show more or less broad, mono- or multimodal distributions. The distribution of the size of the pores in a material is then modelled by a pore size distribution function (PDF). Quantitative analysis of porous media is difficult, especially for soft structures like textiles, which change their geometry under mechanical stress.
For the experimental determination of the porosity, density-based approaches are the most straightforward. Volumes are calculated by dividing the weight of the structure by the material density [8]. For the quantification of pore size, the interaction of the structure with fluids is mostly used. Examples for fluid-based methods for examining the PDF equivalent pore radii of fabrics are the adsorption of water [10], the intrusion of mercury [11], the intrusion of mercury and water [12], or the method of porosimetry, which uses the difference in permeation of a dry and wet sample [13]. Radiation-based imaging techniques, such as light microscopy, X-ray microscopy, tomography, and magnetic resonance imaging, can be used to extract high-resolution geometric information from porous media. Before the spread of tomography techniques, stereology was a separate science concerned with analysing the structure of materials from sectional images [14]. Today, image processing tools such as PoreSpy [15] or proprietary software such as GeoDict are used for analysing digital image files. These software tools can be used to efficiently analyse 2D images and 3D models with regard to pore properties, such as shape, connectivity, porosity, pore size distribution, and internal surface area.
Several publications have analysed and described the influence of different parameters of the knitting process on the porosity of knitted fabrics, i.e., the yarn count and yarn type (e.g., cotton yarn [16]), culling and loop size [17,18], patterning [5,19], elongation and mechanical stress [20,21], elastane content in compression garments [22] and the fabric’s moisture content [23]. Publications show that the porosity of knitted fabrics is generally between 0.6 and 0.8 and can be higher for very open fabric structures.
The pore size of fibre bundles can be modelled by considering the pores as air cylinders with a surface area equal to the fibre surface and the volume to that of the pore space. The ratio of pore radius to fibre radius is equal to the ratio of pore volume to fibre volume. This approach was first introduced by Gebart in order to calculate the hydraulic diameter in flow simulation [24]. Neckar and Ibrahim discuss this approach for general fibrous assemblies and show the effect of fibre volume content on pore diameter, length, and specific surface area [25].
Bimodal modelling is usually chosen to analyse the pore size properties of textiles made from yarns. The two modes are intra-yarn pores (or yarn pores) between the fibres on the yarn scale and inter-yarn pores (or macropores) between the yarns on the fabric scale [26,27,28]. Intra-yarn pores usually have a major impact on the permeability of fabrics [26], whereas inter-yarn pores play a crucial role in the capillary transport of liquids [29].
Early observations by Miller and Tyomkin described a bimodal pore size distribution observed through the extended liquid intrusion method. For 65/35 PET/cotton-knitted fabric, they found values of intra-yarn pores around 5 µm and inter-yarn pores around 40 µm radius [12]. Rebenfeld and Miller observed bimodal pore size distributions when applying liquid intrusion to knitted and woven fabrics compared to monomodal distributions for nonwoven filter fleeces [30].
Benltoufa characterised knitted single-jersey fabrics as bimodal porous systems consisting of intra-yarn pores in the yarn and inter-yarn pores in the knitted structure. The inter-yarn pores are modelled as parallel rods, while the intra-yarn pores are modelled as flow between two distant parallel plates. The Washburn equation was used to calculate radii from wicking experiments. Inter-yarn pores in a range from 18 to 38 µm and intra-yarn pores in a range from 158 µm to 701 µm have been found for four single-jersey fabrics [28]. Birrfelder observed and quantified for both intra-yarn and inter-yarn pores separate wicking fronts for horizontal wicking in single-jersey knitted fabrics in tomographic images, but pore characteristics were not quantified [31]. With regard to intra-yarn pores, Fischer et al. characterised non-textured polyester yarns with 200 twists per metre under different tensions from tomography data. They analysed the pores in terms of cross-sectional area, pore length and connectivity. The pores were rather long in the direction of the yarn, with form factors from 0.025 to 0.035 [32]. Inhomogeneous pore size distributions, especially big intra-yarn pores, were found to slow down and inhibit fluid wicking in yarns [29,32,33].
Porosity analysis of yarn-based textiles has mainly focused on the experimental determination of the transport and integral porosity properties, rather than pore size modelling. Nevertheless, some models for the porosity of knitted fabrics have been developed from 3D geometry models [17,20,34,35].
With regard to the pore sizes of the inter-yarn pores of knitted fabrics, a cylindrical shape with a certain length and diameter was used for modelling. Karaguzel derived the cylindrical pore model for single-jersey fabrics and correlated it with air permeability and other transport properties. Karaguzel’s model cannot provide any values for very dense knitted fabrics, and with thicker, more porous yarns, the inter-yarn pores are estimated to be too large, so the model cannot be used for fine, dense knitted fabrics made from compressible yarns. A fitting factor was used to match the model with microscopic data [36]. Rong investigated the pore size distribution of 53 cotton ring-spun yarn E18 single-jersey fabrics using imaging and implemented a machine learning model to predict the mean inter-yarn pore size and its standard derivation. He neglects intra-yarn pores and focusses on inter-yarn pores. For 53 fabrics, the mean standard deviation for of the inter-yarn pore radius was 66% [37].
Although no work dedicated to modelling the intra-yarn pores in yarn-based textiles could be found, some work has been published on modelling the porous properties of random fibre networks, i.e., of nonwovens. Sampson developed a statistical model for the pore radius distribution in isotropic near-planar fibre networks [38]. Rawal discussed different pore size distribution models for nonwovens using a gamma function for fitting [39]. Bai et al. did something similar in 3D. They developed an extended model by superimposing existing models and mathematically deriving the overall PDF. His model generally agrees better with experimental data than mono-layer models. The experimental results show that the mean pore diameter shifts to larger values with increasing porosity and increasing fibre diameter. Another finding is that orientation has no significant effect on the PDF of nonwoven fibrous filters [40]. Wang and Schiller carried out investigations using pore network modelling of random fibre networks. They point out that the peak of the PDF becomes sharper with decreasing porosity, that pore diameter increases linearly with fibre diameter, and the pore connectivity decreases linearly with fibre diameter and increases with porosity in the range of their parameters [41].
Another approach was published by Komori and Makishima [42] and later refined by Gibson and Pan [14]. The distribution of voids between short fibres in short fibre-reinforced plastics was modelled. The model considers the fibres as an array of uniform cylinders, which are uniformly distributed. An aperture cycle of radius r can be placed between the fibres, in order to obtain a measure of the void space. The distribution of the aperture cycles, which determines the pore radius, can then be described by a Poisson function. This aperture radius is then taken as a measure for the pore size between the fibres. The model has two disadvantages, one is that it allows for a pore size of 0, and the other is that the distance between the fibres is used as a measure of the pore [42].
The aim of this publication is to derive the pore size distribution function of single-jersey knitted fabrics made from twist-texturized yarns with cylindrical filament cross-sections. In order to qualify a knitted fabric for a certain use and to understand how the textile manufacturing process of knitting affects the pore size distribution function, a comprehensive model would be beneficial. The model combines common assumptions about knitted fabrics: First, the fabric has a hierarchical structure of yarn and fabric scale. Second, the statistical distribution of fibres in the yarn cross-section is examined. The model is applied on examples of TTY and single-jersey fabrics and validated with microscopic images of yarn cross-sections and microtomography measurements of knitted fabrics. A parameter study of the significant parameters (see Table 1) affecting the PDF of single-jersey fabrics is carried out in order to deepen the understanding of their interactions.

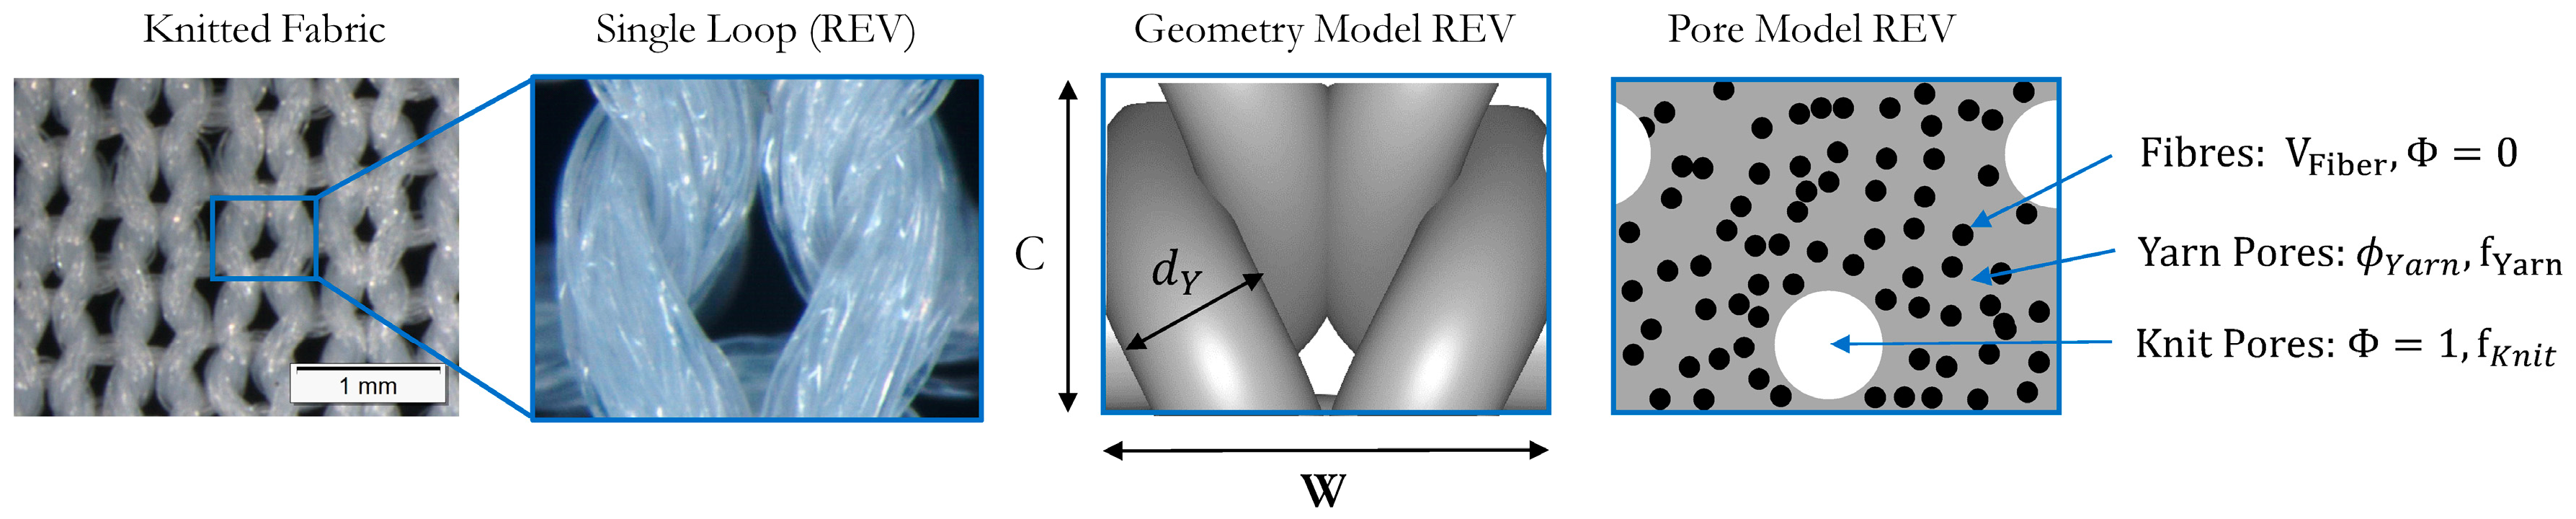
2. Model for PDF of Single-Jersey Fabrics

2.1. General Model

Single jersey is a very common, simple periodic knitting pattern. Simulations and modelling are usually performed on the representative elementary volume (REV) of the knitted fabric, which is a single loop. The REV extracted from a microscopic image of a single-jersey fabric and the derived geometrical model with its main geometric quantities are shown in Figure 1. The model generally divides the REV of the knitted fabric into three volumes, which are derived from the fibre properties and the geometric model of the REV.
The volume of the REV V R E V is the volume of the bounding box, calculated by the wale spacing W , the coarse spacing C and the fabric thickness d T as follows
V R E V = C W d T
The volume of the REV V R E V can be divided into the volume, which is occupied by the fibres V F i b e r , and the volume occupied by the yarn V Y a r n .
The volume V F i b e r can be calculated from the diameter of the fibres d F , the fibre count n F , the loop length l L , the fibre material density ρ F and the fibre misorientation N
V F i b e r = d F 2 π 4 l L n F N
The volume V Y a r n can be calculated
V Y a r n = d Y 2 π 4 l L V Y a r n , i n t
From these three volumes, V F i b e r , V Y a r n and V R E V , we can calculate the porosities of the yarn volume ϕ Y a r n , the porosity of the REV ϕ R E V , and the overall porosity of the fabric ϕ F a b r i c
ϕ Y a r n = V Y a r n V F i b r e V Y a r n
ϕ R E V = V R E V V Y a r n V R E V
ϕ F a b r i c = V R E V V F i b r e V R E V
These porosities can now be used to calculate the overall pore size distribution function of the fabric f f a b r i c ( r P ) . This is calculated by superpositioning the PDF of the yarn f y a r n ( r P ) and the PDF of the single-jersey structure f k n i t ( r P ) , each weighted by its corresponding volume fraction in the REV:
f f a b r i c ( r P ) = f y a r n ( r P ) 1 ϕ R E V + f k n i t ( r P ) ϕ R E V
The separate PDF models for the yarn f y a r n and the PDF for the single-jersey knit f k n i t are explained in the following sections.

2.2. Modelling PDF of Twist-Texturized Yarns

PDFs are usually derived from the model structures or fitted from experimental data to empirical expressions. Statistical models such as the Poisson distribution are used for non-continuous distributions, while continuous distributions are modelled using normal, log-normal or gamma distributions. Usually, two variables are used for parameterisation, one for the mean and one for the spread of the distribution.
The pore size distribution function of fibrous filters has been successfully modelled as a log-normal distribution [43]. Therefore, we use this distribution to model the PDF of TTY. The equation of the log-normal distribution function is
f x = 1 σ 2 π x e x p ( 1 2 l n ( x ) μ σ 2 ,
parametrised by its mean μ and standard deviation σ .
For many soils, which have a moisture characteristic similar to a normal cumulative distribution function, the derived pore size distribution is log-normal [44]. For porous membranes with non-uniform pore sizes, the normal and log-normal distributions are commonly used to model PDF, e.g., for hollow fibre membranes [45]. Other applications of the log-normal distribution are the size of crystals in ice cream ( μ = 15   µ m , σ = 1.5   µ m ) or the length of spoken words in telephone conversations ( μ = 5   l e t t e r s , σ = 1.5   l e t t e r s ) [46]. Typically, log-normal distributions are likely to fit when the characteristic of interest is a result of ratios of several normally distributed processes [47].
In our model, we assume that the mean μ and the standard deviation σ depend only on the pore diameter in the yarn r P , Y a r n . The mean μ is calculated as
μ = l n ( r P , Y a r n )
and the standard deviation σ as
σ = l n ( r P , Y a r n ) .
The hydraulic pore diameter is widely used as a model for different cross-sectional shapes. We calculate the mean pore diameter r P , Y a r n in the yarn using the formula for the two-dimensional hydraulic diameter of parallel cylinders derived by Gebard [24] as
r P , Y a r n = ϕ C S 1 ϕ C S r F
by the fibre diameter r F and the porosity of the yarn cross-section ϕ C S . For filament TTYs, the porosity of a yarn cross-section ϕ C S can be derived from the number of fibres n F in the yarn, the diameter of the fibres d F , the diameter of the yarn d Y and the fibre misorientation N .
ϕ C S = 1 n F d F 2 d Y 2 N
The fibre misorientation is the length of the fibre divided by the length of the yarn
N = L F i b e r L Y a r n
and can be calculated from the yarn linear density and the fibre diameter. The fibre misorientation N derives to
N = 4 m Y d F 2 π ρ F n F
where m Y is the yarn linear density, usually given in dtex, and ρ F the density of the fibre material.
The overall equation modelling of the TTY is then given by
f Y a r n r P = 1 l n ( r P , Y a r n ) 2 π r P e x p ( 1 2 l n ( r P ) l n ( r P , Y a r n ) l n ( r P , Y a r n ) 2
The PDF of the twist-texturized yarn is only parametrised by r P , Y a r n , which can be derived from usually available data of twist-texturized yarns as follows:
  • Yarn Diameter d Y
  • Fibre Diameter d F
  • Fibre Count n F
  • Yarn Linear Density m Y
Practical application of the model and derivations of the parameters for four twist-texturized yarns are presented in Section 3.

2.3. Modelling PDF of Single-Jersey Knitted Fabrics

To model the inter-yarn pores of the knitted structure, the pore diameter is developed from a geometry model of the single-jersey pattern. The yarn diameter is kept constant and the yarn volumes intersect at the binding points. This is a reasonable assumption as TTYs are very soft and compress when knitted. Many models of knitted fabric geometry have been published [48] and are available as commercial or open source [49] software. Models exist for single-jersey loop geometries, including a change in the cross-section due to compressibility [50]. At this stage, a simple model based on the publication of Choi [51] is used. The model was chosen because of its simplicity and because it is only parametrised with data that are usually available, namely the coarse spacing C, the wale spacing W and the yarn diameter d Y of the knitted fabric. To calculate the yarn path in the REV, the minimum yarn diameter d Y , m i n , was calculated from the maximum possible packing ratio ϕ Y , m i n in an outer circle using the fibre diameter d F and the number of filaments n F
d Y , m i n = ϕ Y , m i n n F d F
The maximum density ratio ϕ Y , m i n for the given number of filaments n F is calculated using the best-known maximum density ratio for a given number of circles in a circle [52].
The yarn path was then extruded by the diameter d Y , which, in the application of the model on real fabrics, is derived by microscopy or by calculation from the yarn porosity ϕ Y using Equation (16). As the volume V Y a r n is difficult to derive analytically, it has been derived numerically from calculating the volume V Y a r n of a 3D model of the REV in TexGen [49]. V Y a r n is then used to calculate the porosity of the unit cell ϕ R E V .
Analysis of the geometry of the single-jersey loop (see Figure 1) shows that for each REV, there are two inter-yarn pores: one in the needle loop and two half pores in the sinker loops on the sides. This approach differs from previous publications modelling the inter-yarn pores, which considered only one inter-yarn pore per REV [2,25,53]. Similar to Karaguzel with one pore, the two-loop pores are then modelled as cylindrical pores of the diameter d P , m a c r and the length d T . The diameter d P , m a c r is calculated as
r P , k n i t = V R E V ϕ R E V n P d T π = C W ϕ R E V n P π
where V R E V ϕ R E V is the free volume of the unit cell, n P is the number of pores in the unit cell (two for single jersey) and d T is the fabric thickness. The volume of the pores in the yarn is, therefore, not taken into account when calculating the inter-yarn pore.
In the pore model for single-jersey fabrics, the diameter of the inter-yarn pores in the fabric d p is assumed to have a Gaussian distribution, resulting from yarn unevenness and the knitting process.
f k n i t r P = 1 σ r P , k n i t 2 π e 1 2 r P r P , k n i t 2 σ P , k n i t
The standard deviation of the pore diameter r P , k n i t was set to σ r P , k n i t = 0.1 r P , k n i t as this was approximately the relative deviation of the measurements of parameters C and W in previous research. More accurate models for single-jersey fabrics, which include the change in the yarn cross-section at the binding points, exist [50] and could be used to calculate the porosity of the geometric properties of the unit cell. In order to extend the model to other knitting patterns, appropriate geometric models can be used to calculate the free space in the unit cell. By analysing the number of inter-yarn pores per unit cell, the representative inter-yarn pore diameter can be calculated.

3. Validation of Model

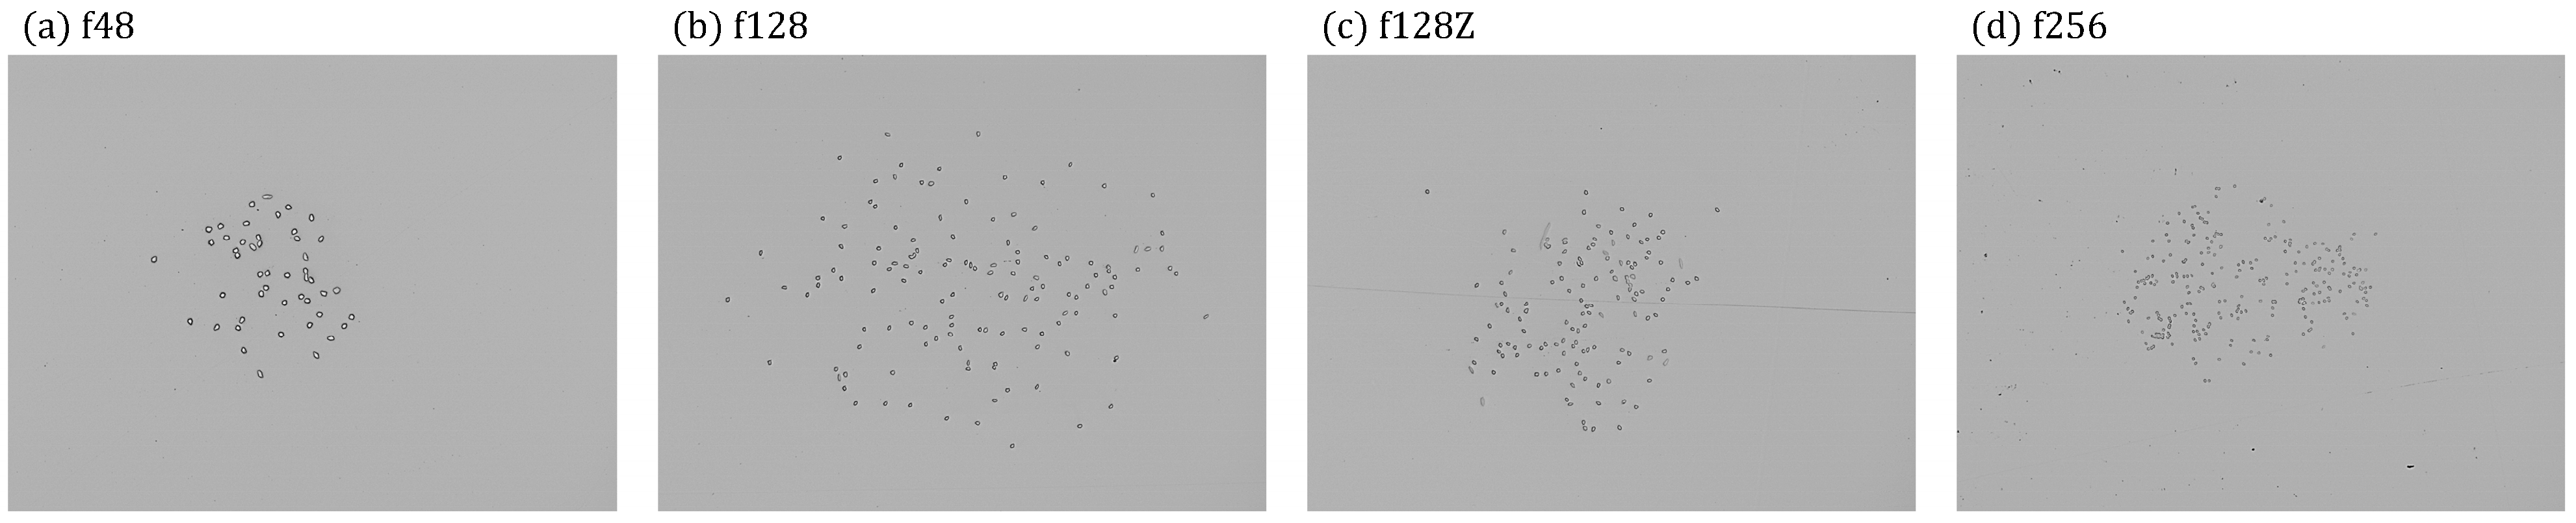
3.1. Extraction of Yarn Parameters from Cross-Sections

To validate the yarn model, four polyester TTYs were produced with approximately the same yarn count but different fibre counts. The yarns have 48, 128 and 256 individual filaments. The 128-filament yarn was additionally twisted with 200 TPM to give a compact, less porous yarn with similar fibres. The yarns were embedded in resin at a yarn tension of 0.5 cN and cross-grinded. Figure 2 shows microscope images of the yarn cross-sections with decreasing filament diameters from f48 to f256.
The images of the cross-sections were processed using the OpenCV image processing library [54] to extract the position of each fibre. The image processing software Irfan View was then used to manually remove coarse artefacts and separate visibly connected fibres. To parameterise the model with the yarns, the coordinates of the yarn axis ( x Y , c e n t e r , y Y , c e n t e r ) were determined from the mean values of the coordinates ( x F , i , y F , i ) of the individual fibres. The OpenCV image processing library was used for this purpose again.
x Y , c e n t e r = 1 n F i = 1 n x F , i , y Y , c e n t e r = 1 n F i = 1 n y F , i
The yarn radius r Y can then be calculated from the coordinates of the individual fibres and the yarn axis.
r Y = 1 n F i = 1 n x F , i x c e n t e r 2 + y F , i y c e n t e r 2
The fibre diameter d F , m e a s was also obtained from the cross-sections by manual measurement. The cross-sectional area A F was determined for five cross-sections of 10 individual fibres per yarn. The smallest cross-sectional area A F , m i n of each yarn was then used to calculate the equivalent fibre diameter.
d F , m e a s = 1 5 i = 1 5 4 A F , m i n , i π
Table 2 shows the parameters obtained for the four yarns. The yarn porosity ϕ Y was calculated from Equation ( 12 ) and the fibre misorientation N from Equation ( 14 ).

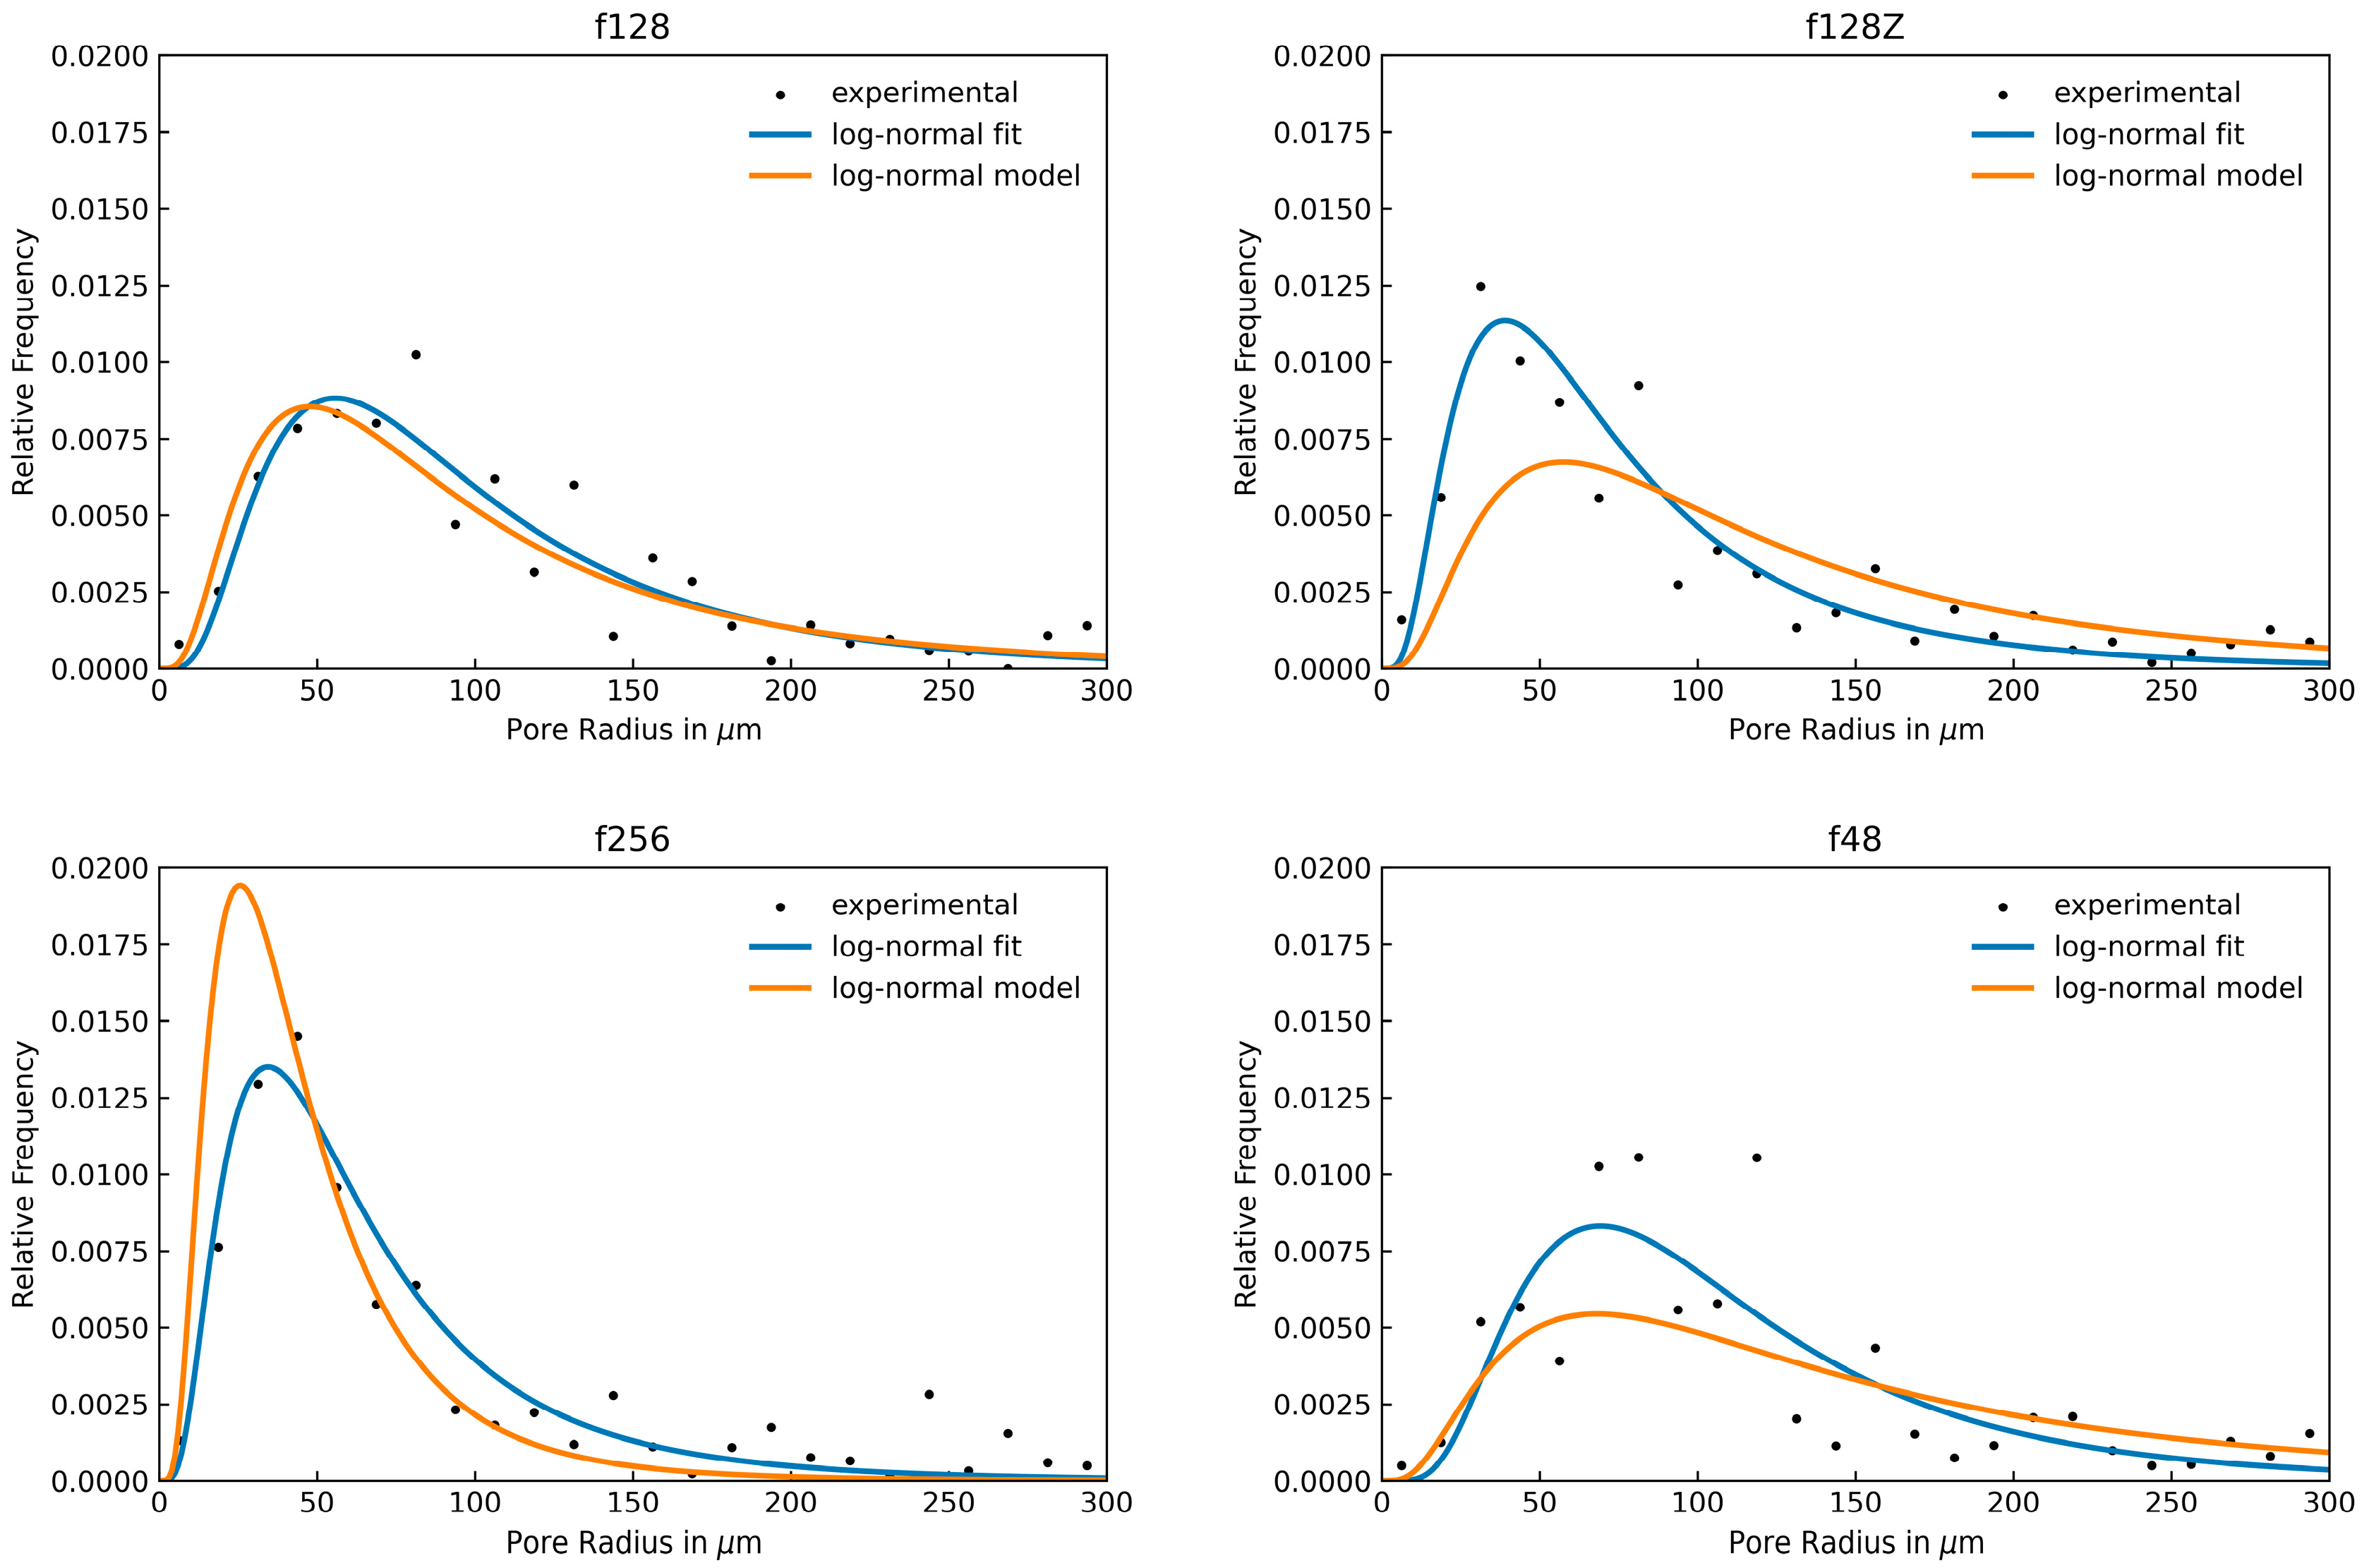
3.2. Experimental Derivation of Yarn PDF and Validation of Yarn Model

For initial validation of the model for the PDF of a TTY, it is determined experimentally using the local thickness method of the Python library PoreSpy [15]. The local thickness method calculates the radii of all surrounding boundaries and gives each pixel the maximum radius of the accessible rigid surface. The values of the radii are then analysed in a histogram, which is interpreted as the pore size distribution of the material. For each yarn, 20 cross-sections were analysed, and the average histogram of the cross-sections was used to validate the model. Figure 3 shows the image processing steps to determine the PDF.
Figure 4 shows plots of the experimental PDF data obtained by PoreSpy, a least mean square fit of the experimental data to a log-normal distribution (see Equation (8)) and our model (Equation (15)) parametrised by the values in Table 2.
In general, the experimental data show high noise, especially for the f48, where fewer filaments are present in the cross-section. The noise is due to the comparably small number of images and the bin size. Table 3 shows the pore diameters obtained by the model and by fitting the experimental data to a log-normal function.
For f48, the experimental data have the highest variance, and the model underpredicts the yarn pore diameter. F128 has a very good fit. For f256, the model underpredicts the yarn pore diameter. For f128Z, it underpredicts the diameter with the highest deviation of 63%. The yarn f128Z has a twist of 200 TPM and follows a more oriented structure, which apparently results in a PDF that does not fit the model. For the other yarns, the log-normal distribution parametrised by the yarn pore diameter qualitatively and quantitatively shows good agreement for the distribution of the intra-yarn pores in twist-texturized yarns.

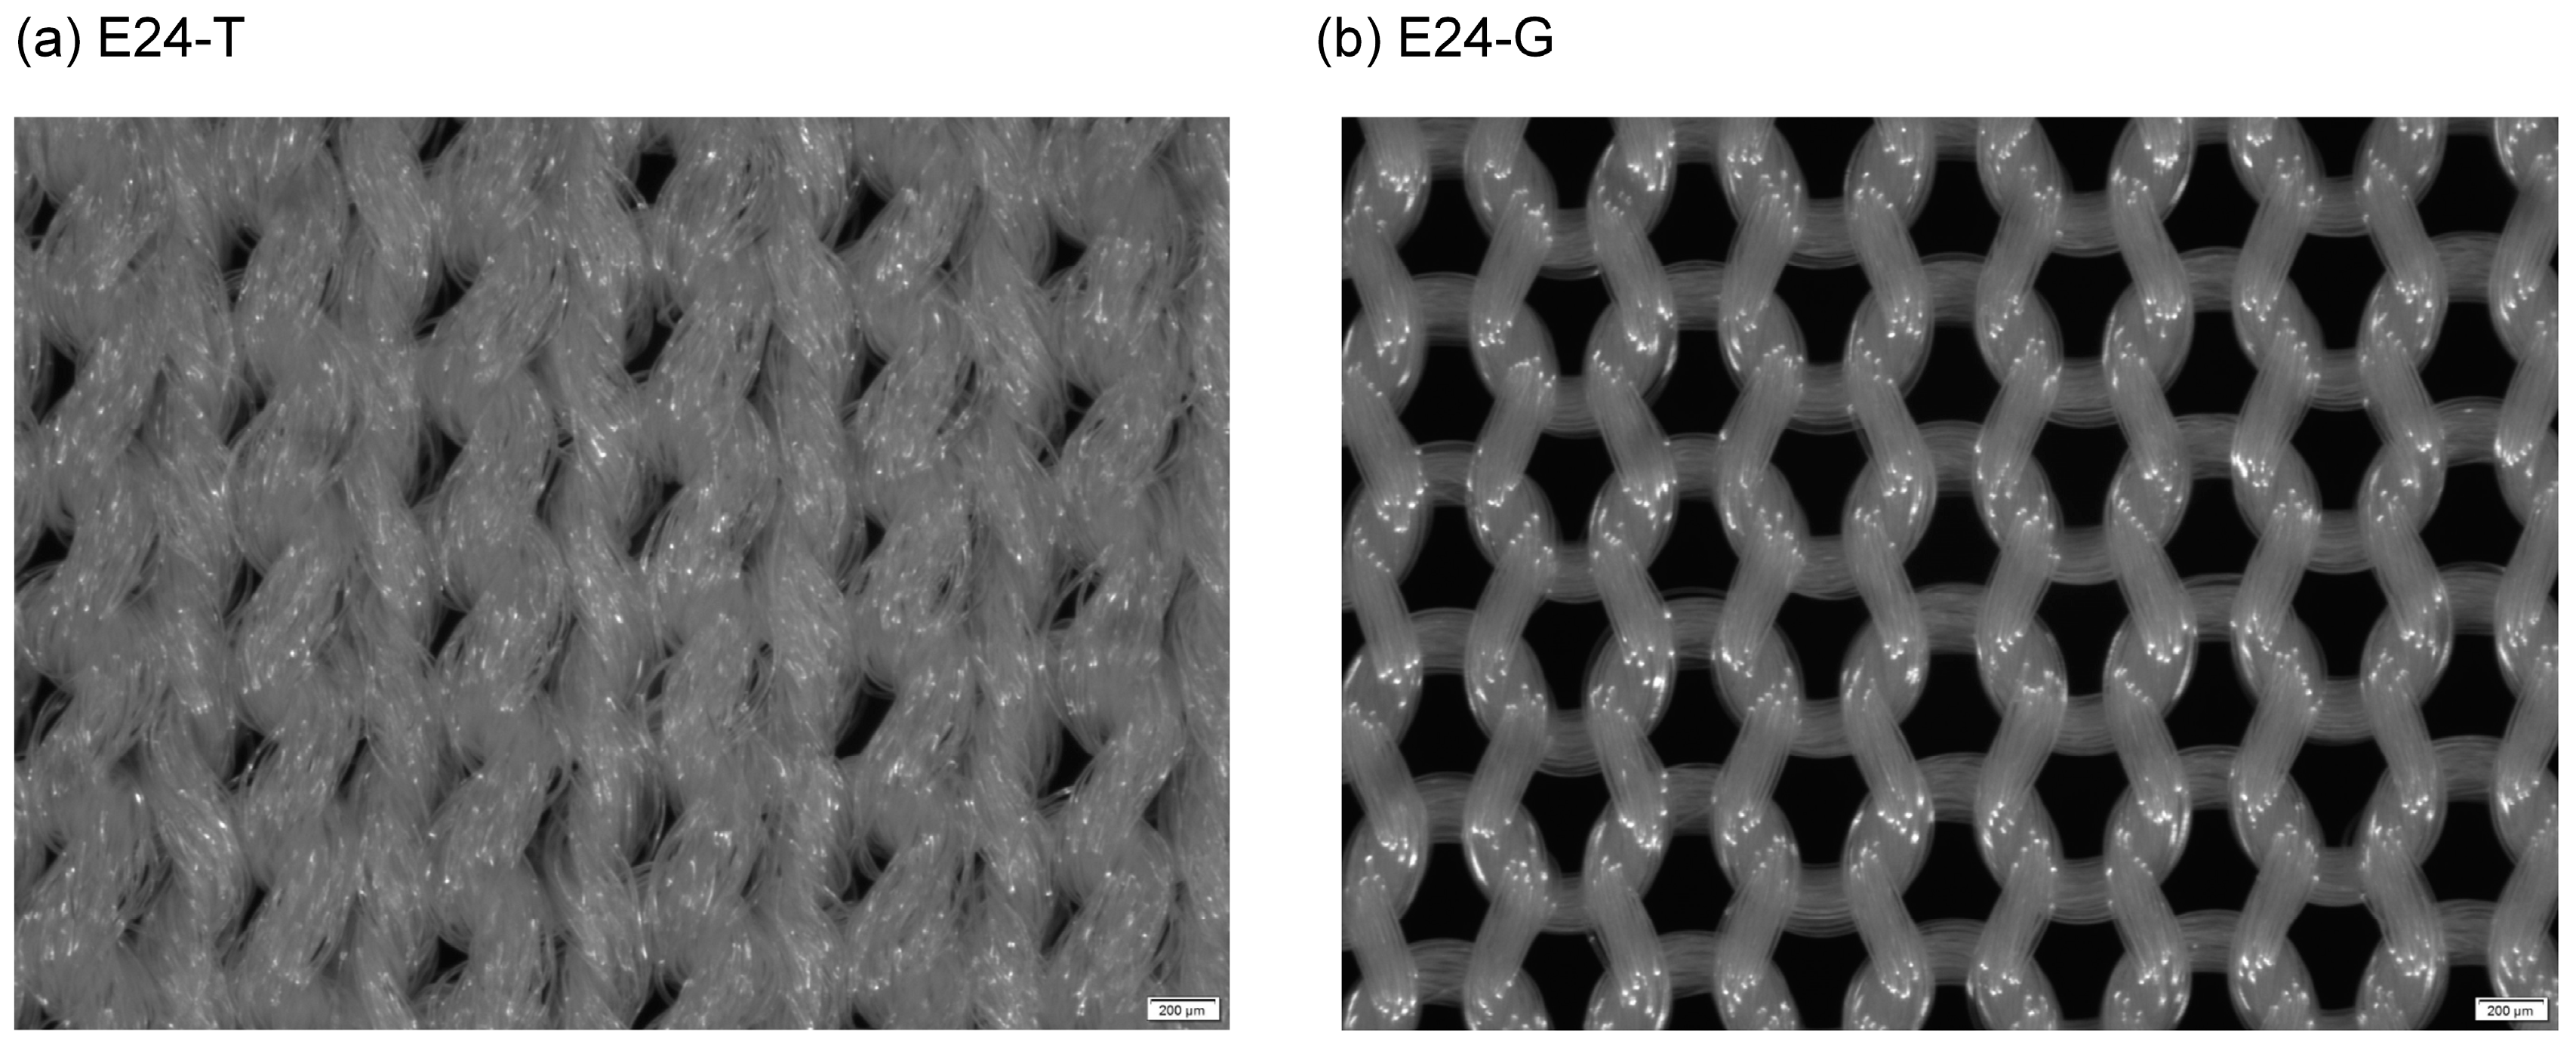
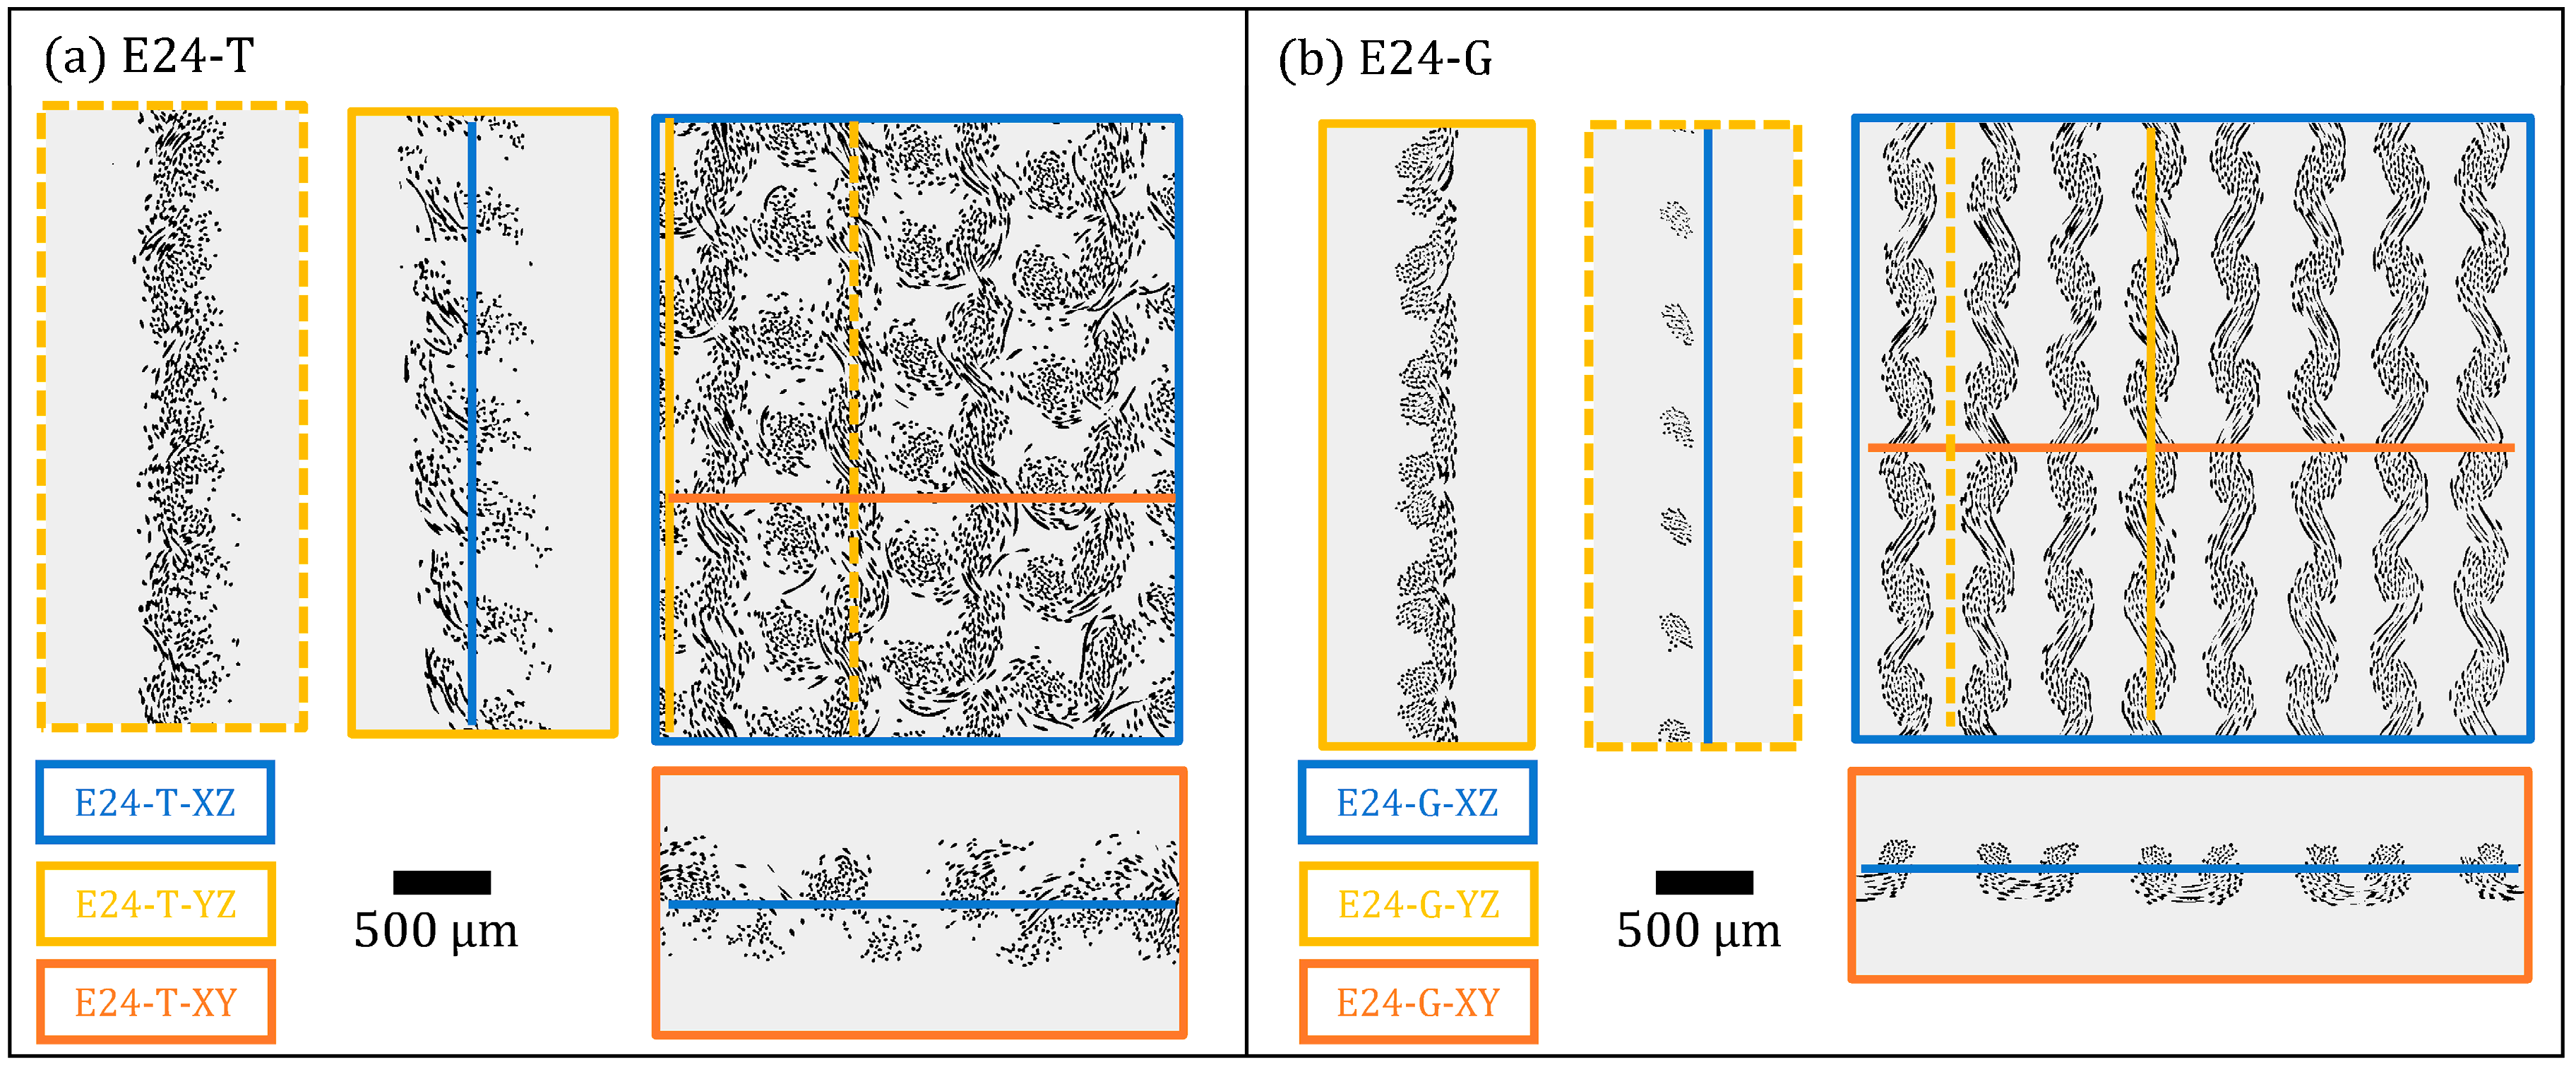
3.3. CT Scans of Single-Jersey Fabrics

To quantitatively validate the model on a fabric, two single-jersey fabrics were scanned in a Nanotom computer tomograph (CT, GE Sensing & Inspection Technologies) with a voxel length of 3.5 µm. For the CT scans, the fabrics were prepared on rigid foam frames under constant tension to stabilise the loop geometry during the imaging. Both fabrics were produced on a E24 circular knitting machine using a twist-texturized filament yarn for E24-T and a plain filament yarn for E24-G. Fabrics were chosen as they are comparable in fabric construction but are made from completely different yarns. The fibre diameter was determined by microscopy of the yarn cross-sections, the yarn diameter was determined by microscopy of the knitted fabrics and N was calculated from the loop length and the gross yarn weight. The two fabrics are shown in Figure 5, and the properties of the fabrics are given in Appendix A.
From the CT scans of the fabrics, sections of four loops in the wale and four loops in the coarse direction are extracted for analysis. Figure 6 shows examples of the CT slices obtained in the XZ directions of the fabric plane, the YZ plane in the coarse direction and the XY plane in the wale direction after thresholding. Due to the twist-texturing process, the loops of E24-T show a slight skew, whereas E24 shows no skew. Obviously, the inter-yarn pores are smaller in E24-T compared to E24-G. For the smooth yarn in E24G, the intra-yarn pores are comparatively small and compact.
In order to quantify the pore radii of the voids in the structures, slices were taken at 35 µm intervals. The image stacks were processed and analysed in Python 3.12 using the local thickness method of the PoreSpy library [15].

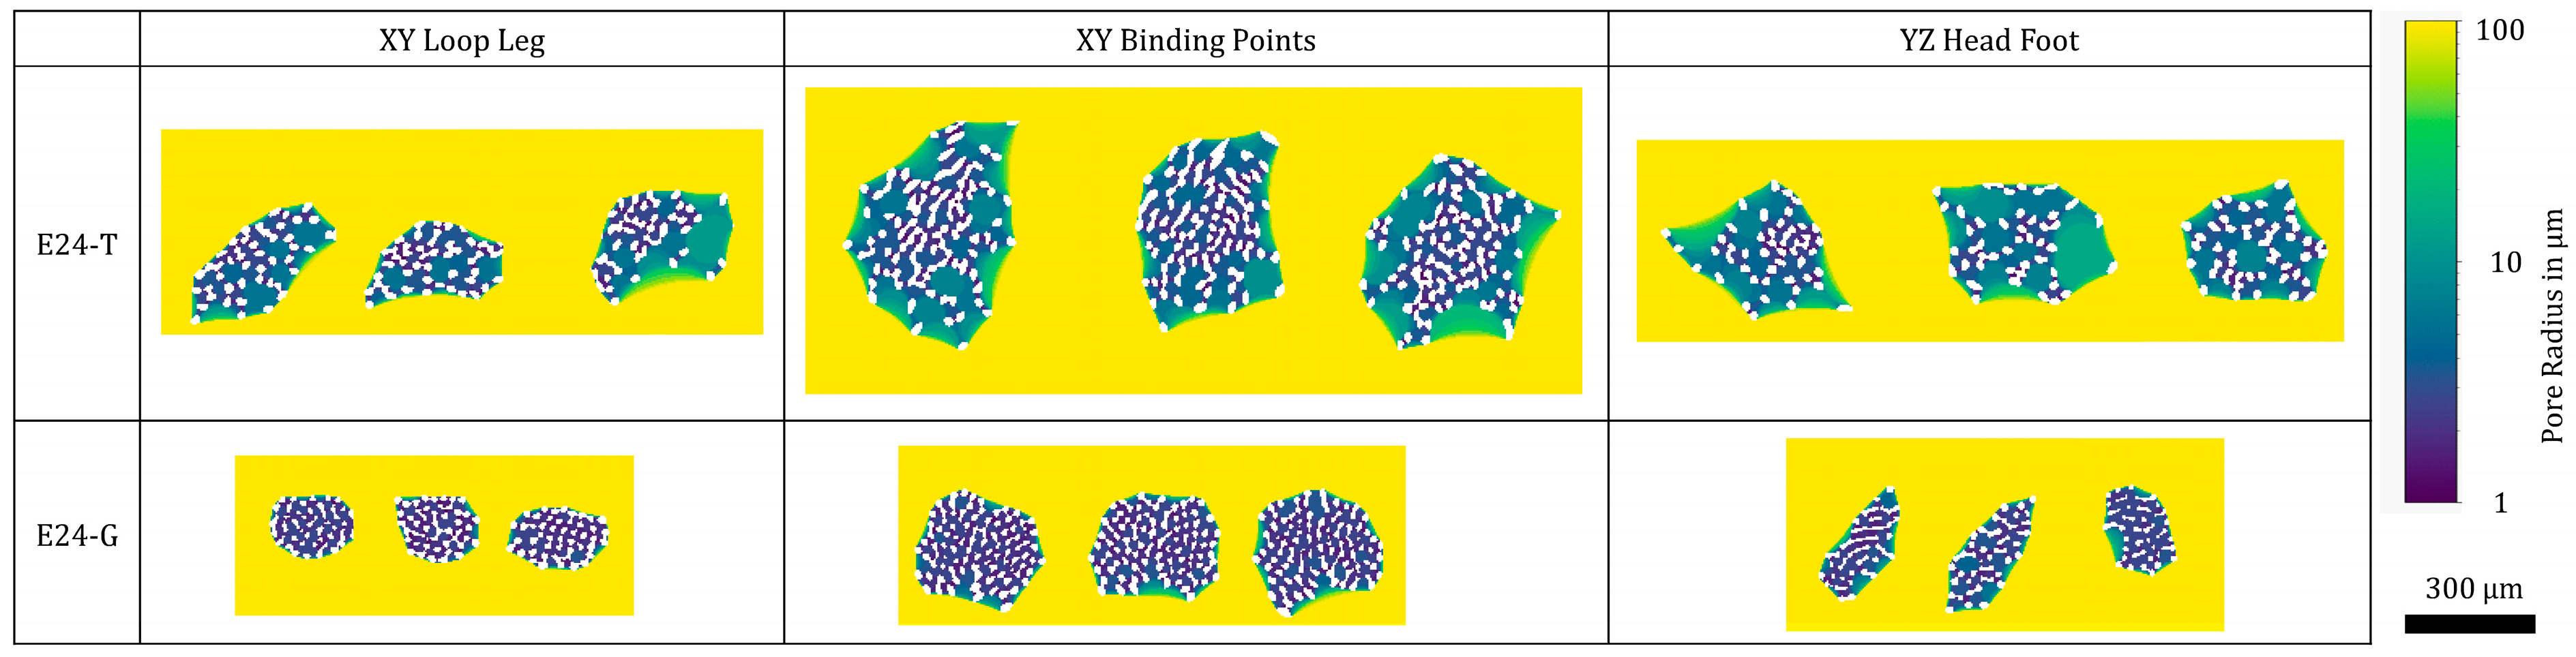
3.4. Validation of Yarn PDF in Knitted Fabrics

Yarns, especially texturized yarns, exhibit compressive behaviour when interlaced into loops in knitted fabrics. In order to analyse the porous properties of the yarns in the knitted fabric, cross-sections of the yarns were taken at specific points. The specific points in the single-jersey fabric are the loop legs, where the yarn usually has the largest span between the binding points, the loop head, where it has a slightly smaller span and corresponding radius, and the binding points themselves, where the yarns of adjacent loops cross. Figure 7a shows a schematic representation of the single-jersey loop, while Figure 7b shows selected images of the specific points.
The yarns are more compact in the knitted fabric compared to the cross-sections in Figure 2. The texturized yarn with its larger yarn diameter opens larger pores in a wider distribution. For both E24-G and E24-T, the pore size decreases visibly at the binding points. At the loop heads and feet, the yarn shows an almost elliptical shape with smaller pores on the outside. At the binding points, the yarns of E24-T are not separable and form smaller pores in the centre, while the smooth yarn pores maintain their constant small size. Figure 8 shows the visualisation of the local thickness method on the selected yarn diameters; pore radii are shown from blue to yellow with increasing size, and fibres are shown in white.
The pore size distribution function calculated by the model and the histograms of the local thicknesses are compared in Figure 9. The values of the local thicknesses have been arranged in 14 bins between 0 and 60 µm for each selected cross-section. E24-T shows a broader distribution than E24-G, both having a peak of distribution around 10 µm. The distributions of the specific yarn cross-sections are only slightly different and the loop leg measurements show slightly higher values for the loop legs for both fabric types. Both distributions show almost no values for very small pores < 5 µm. This is within the resolution of the images and, therefore, not surprising. Compared to the yarn model, the measurements show a qualitative agreement.

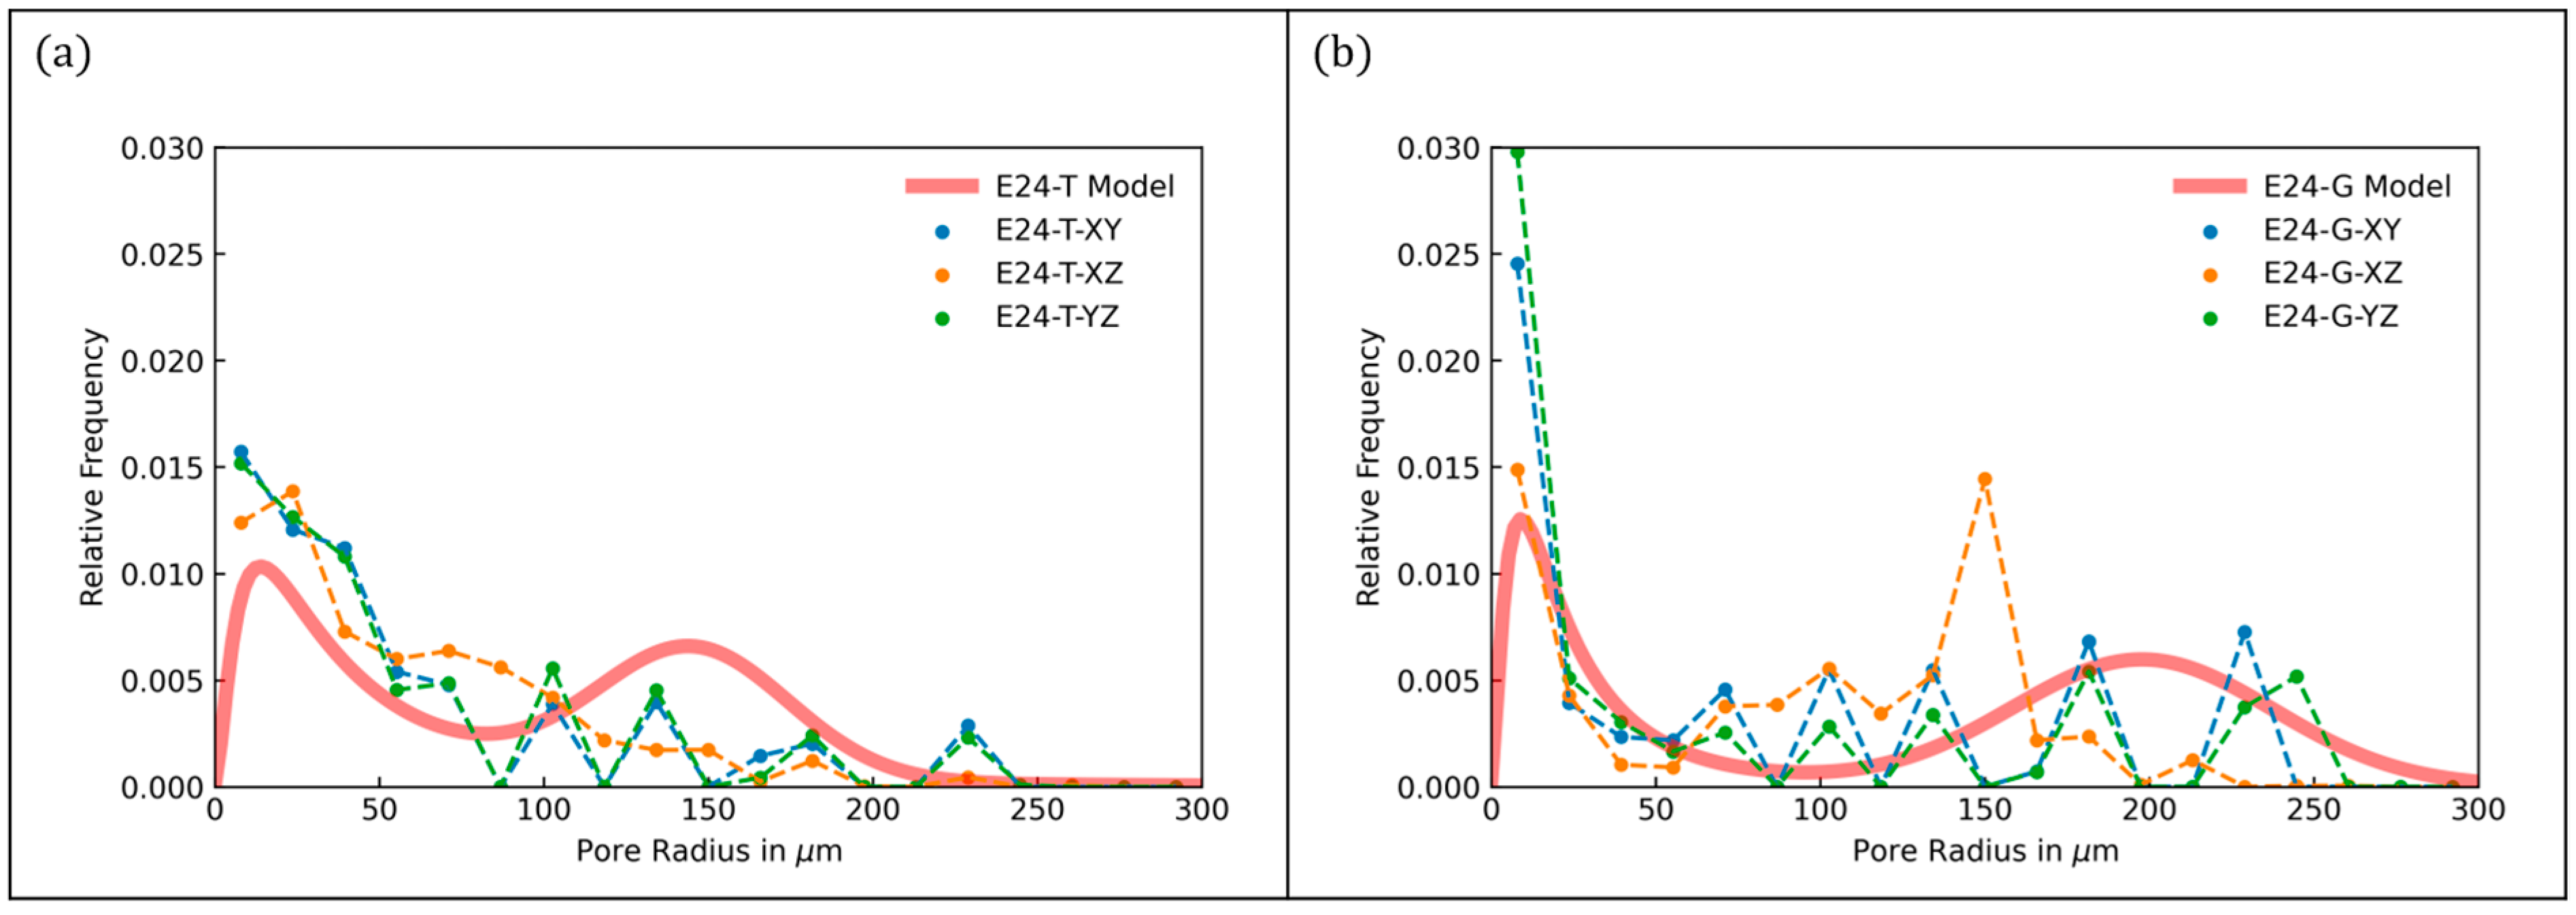
3.5. Validation of Fabric PDF

Figure 10 shows the local thickness method applied to the fabric sections. Visibly, the areas of smaller pores between the fibres are bigger and the fibres are less concentrated in the yarns for E24-T. Overall, E24-G shows a more uniform structure than E24-T, as can be seen from the YZ and XY section images.
In order to compare the experimentally derived pore radii with the model, the pore radii measurements of all images were cumulated, normalised and put into bins of 15 µm to remove noise. Figure 11 shows the histograms in the main fabric directions, XY, XZ and YZ, and the modelled PDF for each fabric.
For E24-T, the scans show almost identical relative frequency of pore radius for all fabric directions, XY, XZ and YZ. The intra-yarn pores of E24-T show a comparable mean of the distribution in the model ( r P , Y a r n , E 24 T = 55   µ m ) and in the tomography data. For the inter-yarn pores, E24-T shows almost constant relative frequencies in the range of 50–150 µm, which is a smaller value than the intra-yarn pores predicted by the model ( r P , K n i t , E 24 T = 146   µ m ) . This can be explained by individual filaments protruding from the yarn in the inter-yarn pore, which have a significant effect on the pore radius determined by the PoreSpy local thickness algorithm.
For the E24-G fabric, the XZ direction shows a significant peak around 150 µm for the inter-yarn pores and accordingly a clear bimodal distribution. XY and YZ show almost identical PDFs. For the inter-yarn pores, the value predicted by the model ( r P , K n i t , E 24 G = 199   µ m ) is larger, but the XY and YZ directions show high relative frequencies in this region. The intra-yarn pores of E24-G show good qualitative and quantitative agreement with the model ( r P , Y a r n , E 24 G = 32   µ m ) . For the intra-yarn pores in the knitted fabrics, the uncertainty at this end of the scale is probably due to the limited resolution of the CT of 3.5 µm.
In general, the measurements show peaks of pore radii at smaller values than the model. This can be explained by the fact that the inter-yarn pores in the yarn usually do not have a convex, cylindrical shape but a concave shape for the upper and lower border, which reduces the diameter over the same area (see Figure 1). From these results, it can be concluded that the model is more accurate for fabrics with a distinctive loop geometry such as E24-G.
The model effectively approximates the balance between the inter-yarn pores within the yarn and the intra-yarn pores between the individual yarns. The bimodal characteristic is clearly visible only for the smooth yarn from both the model and the scans, except that the distribution between the maxima does not drop to zero. However, the porosities ϕ M e a s , E 24 G = 0.77 and ϕ M e a s , E 24 T = 0.87 calculated from fabric weight, fabric thickness and fibre density show a small deviation from the porosities ϕ F , E 24 G = 0.84 and ϕ F , E 24 T = 0.81 obtained from the model. The values do not fit the trend of E24-G having a larger porosity and E24-T having a smaller porosity. In addition, the model over-emphasises intra-yarn pores for E24-T and under-emphasises them for E24-G. These deviations result from the calculation of the REV thickness from Choi’s model and the yarn radius used for parametrisation. Both strongly influence the calculation of the weighting porosities in the general model. This could be improved by using a more advanced loop model or by implementing a varying yarn radius to determine the volume of the yarn.

4. Parameter Study on Model

The presented model consists of several sub models that interact with each other and influence the overall PDF, i.e., the geometric model of the loop shape, the model of fibre misorientation, the PDF for the yarn volume and the PDF for the REV volume. The yarn diameter is particularly affected by fibre diameter and yarn porosity and has a strong influence on the porosity of the REV. In addition, the fabric model is influenced by the maximum packing density of the yarn (at the binding points), so the loop shape is different for yarns of similar yarn count but different fibre diameter and count.
Examples are given below to visualise the model and show the influence of typical parameters that can be altered in the design and manufacture of single-jersey fabrics on industrial knitting machines. In order to keep certain parameters constant, the area ratio in the cross-section of the yarn is kept constant by
d Y = d F n f N 1 ϕ Y
and the yarn linear density is kept constant by
m Y = N n F d F 2 π ρ F 4 .
Both Equations (20) and (21) are used to derive the free parameters in the following examples. All modelling parameters are given in Appendix A.

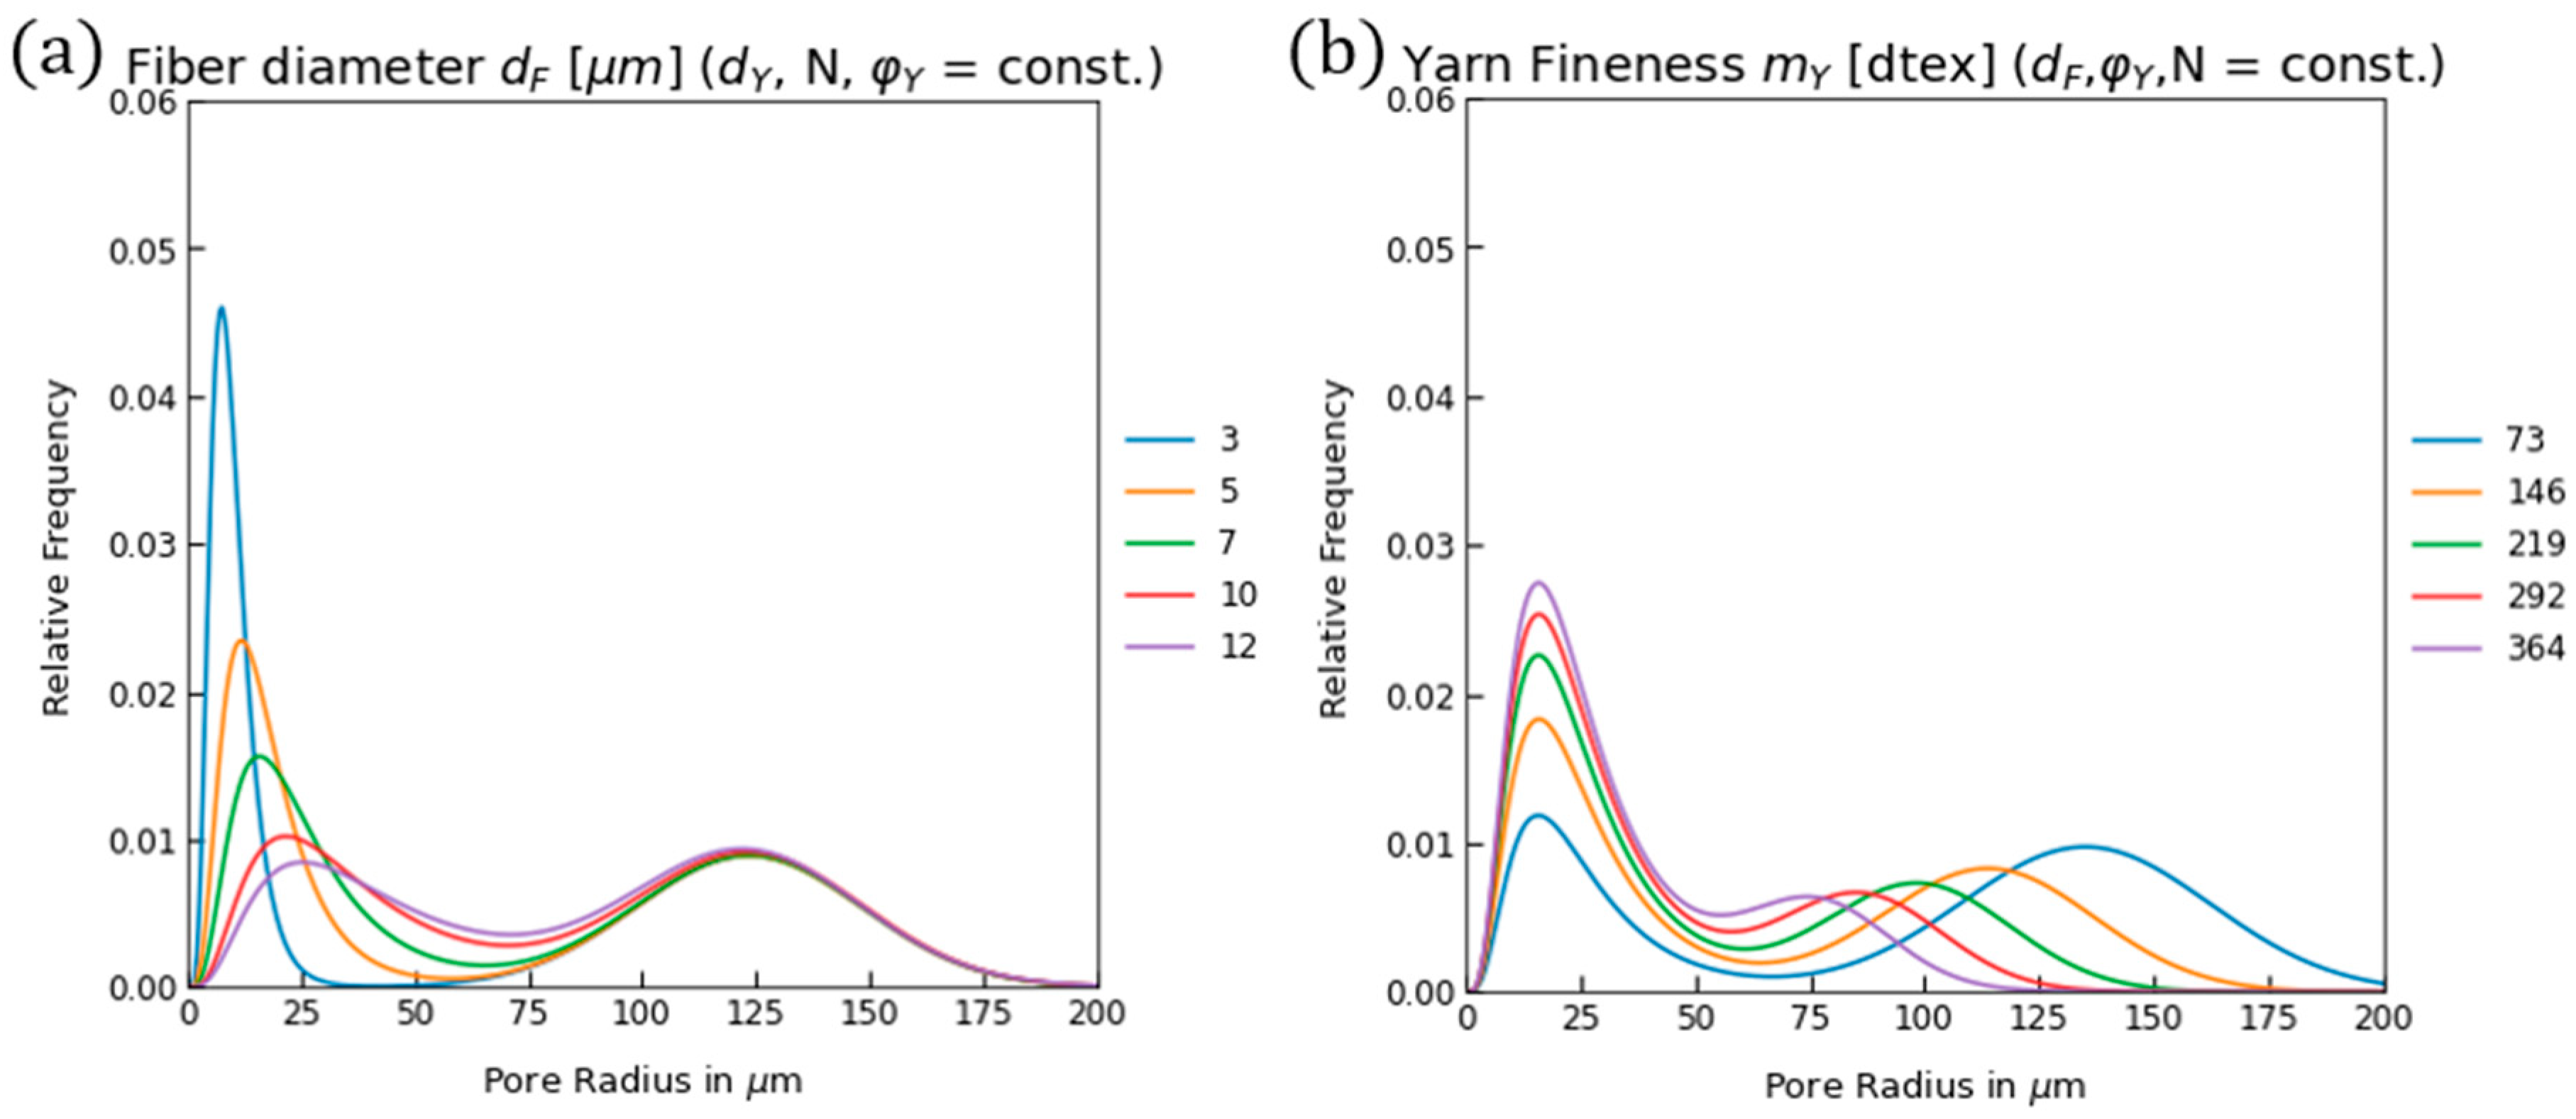
4.1. Fibre Diameter and Yarn Count

Twist-texturized yarns are often available in different fibre diameters and corresponding fibre counts while maintaining the same yarn linear density for a given machine gauge. This sub-study models the knitting of a yarn of 186 dtex on a predefined knitting machine with a gauge of E28. Fibre diameters and counts are varied from 3 µm to 12 µm and from 961 to 60 filaments, respectively.
It is obvious that the pore radii can be shifted to smaller values by reducing the fibre diameter. The regimes of the inter- and intra-yarn pores are well separated, especially for the finer filaments in this yarn, with a constant diameter of 186 µm and a yarn linear density of 186 dtex.
To obtain a denser knit, the yarn count would be increased. The sub-study in Figure 12b models increasing the yarn count by adding more filaments, which would correspond to the folding of a thin yarn several times when feeding it to a knitting machine. The average pore radius of the intra-yarn pores remains constant, while as the yarn count increases, the proportion of inter-yarn pores in the pore space decreases and the pore areas of the intra- and inter-yarn pores move closer together.

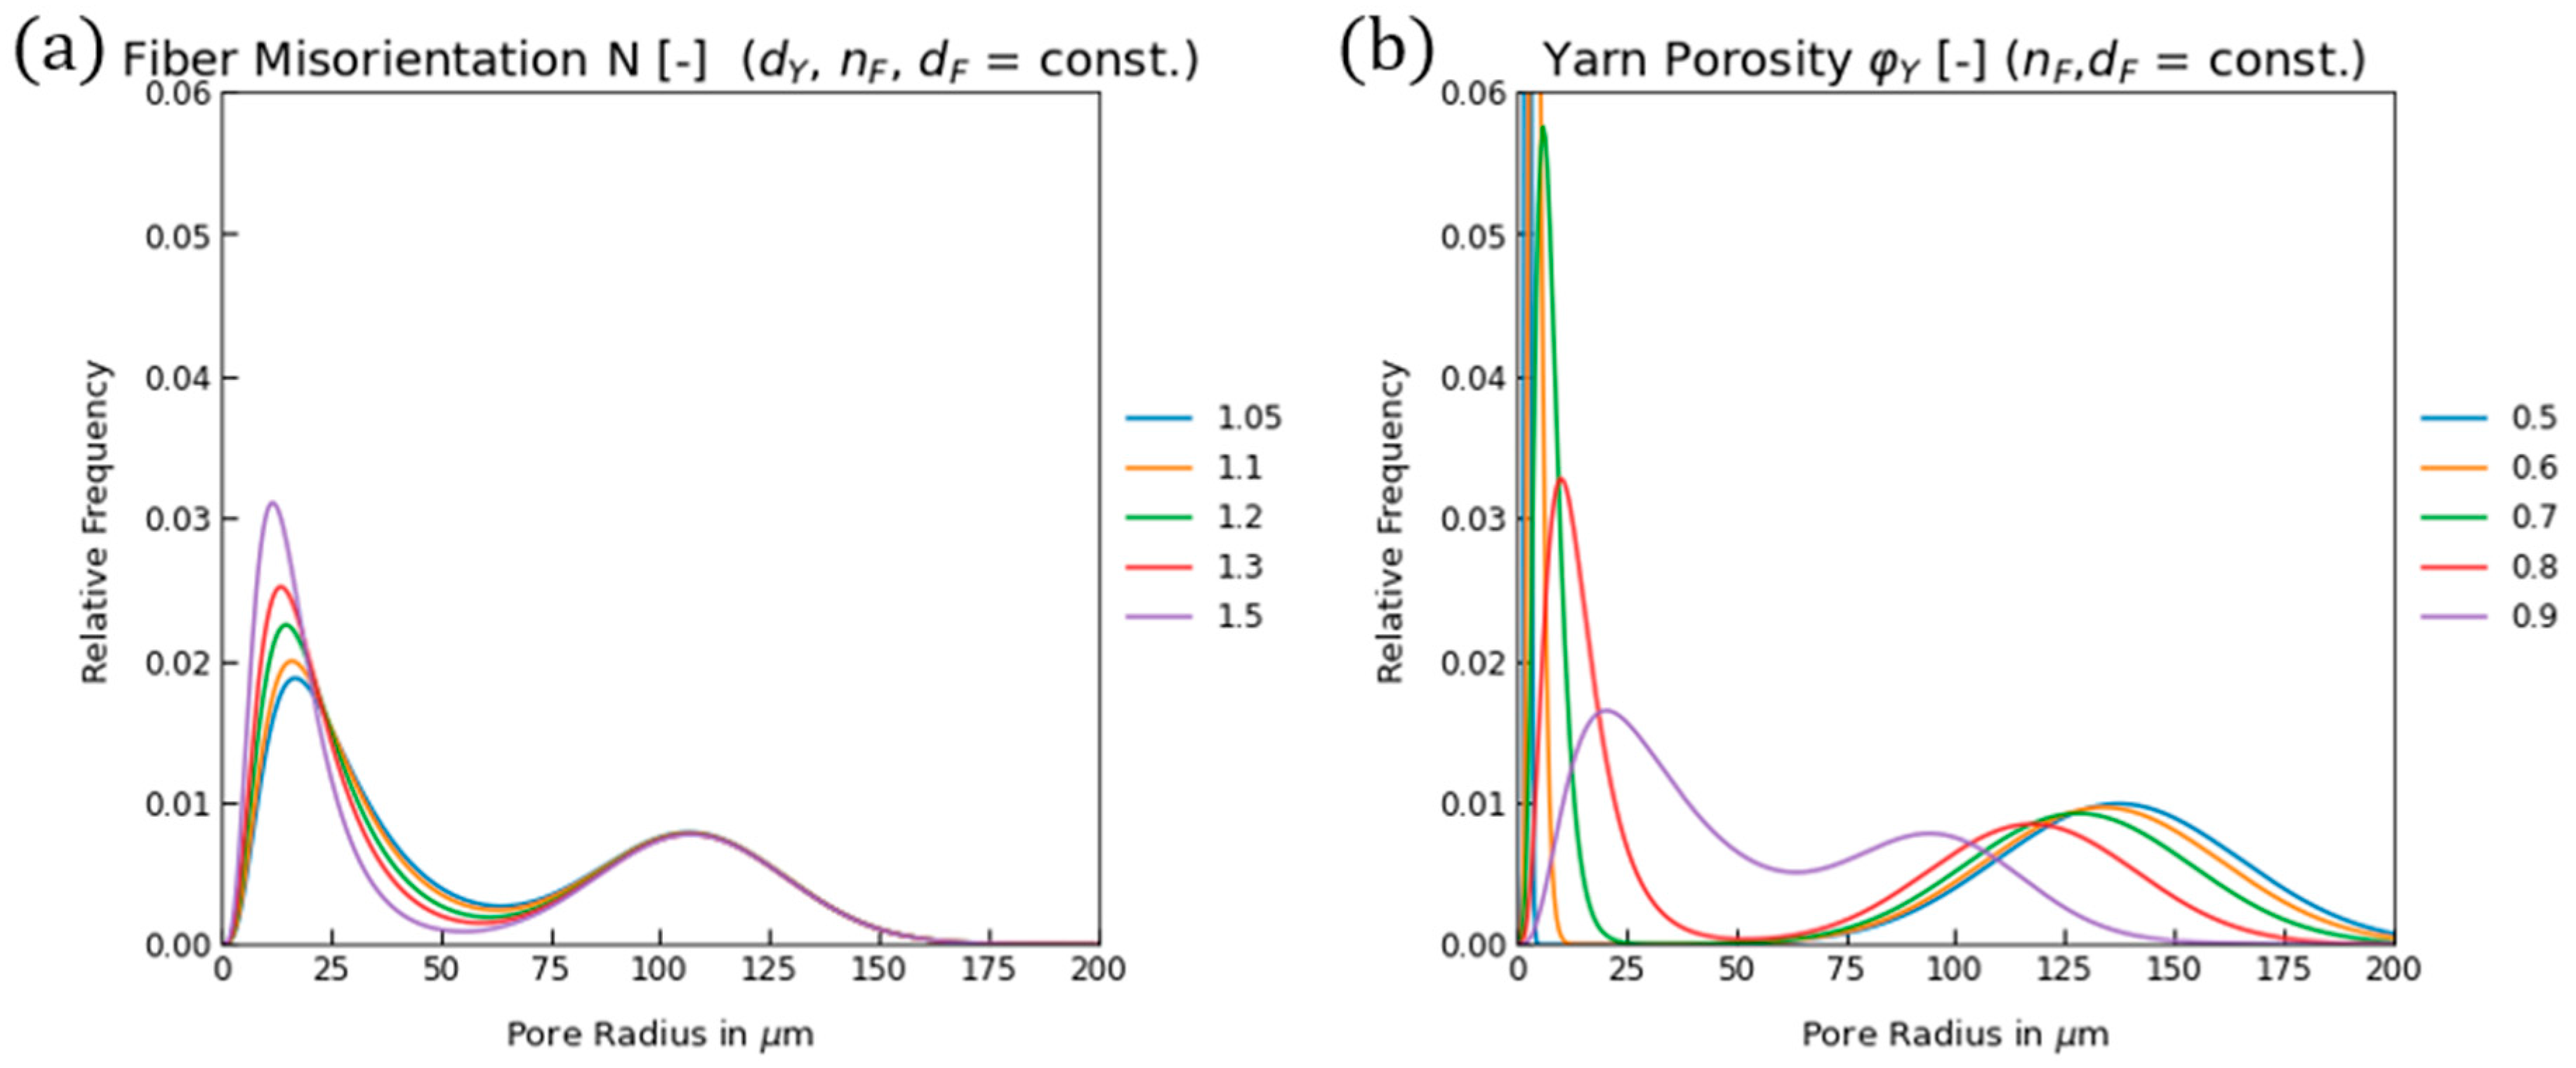
4.2. Fibre Orientation and Yarn Porosity

During the formation of the yarn structure in the twist texturization process, fibre orientation, yarn porosity and yarn diameter are defined. These parameters are interdependent on each other and change with the elongation of the yarn, knitting and finishing process. Strict one-factor-at-a-time parametrisation is desirable but not feasible for real fabrics. The parameters also interact in the modelling as well and are shown in Figure 13 below, giving insight into the overall sensitivity.
The fibre orientation is changed in a range of 1.05 to 1.5, covering both highly and poorly oriented yarns. The intra-yarn pore model shows no effect of fibre misorientation on the PDF. This is surprising at first sight but turns out to be valid, since no matter how crimped the fibres are, the pore sizes depend only on the porosity and fibre diameter (see Equation (12)). Actual production of a set of yarns where only the fibre misorientation changes as in the parameter set is not realistic as the yarn porosity increases with texturization. Numerical studies on nonwovens show that crimp has an influence but the amount of crimp has a negligible influence [55]. The other parameter, mainly set in the twist texturization process, is the yarn porosity ϕ Y . Yarn porosity affects both the intra- and inter-yarn pores, shifting the two modes of pore sizes closer together. This results in very open knits for dense yarns (with low porosities like 0.5) and very dense knits for highly porous yarns. This is actually not represented by the tightness factor, which is equally 2.25 for all knits in this parameter set.

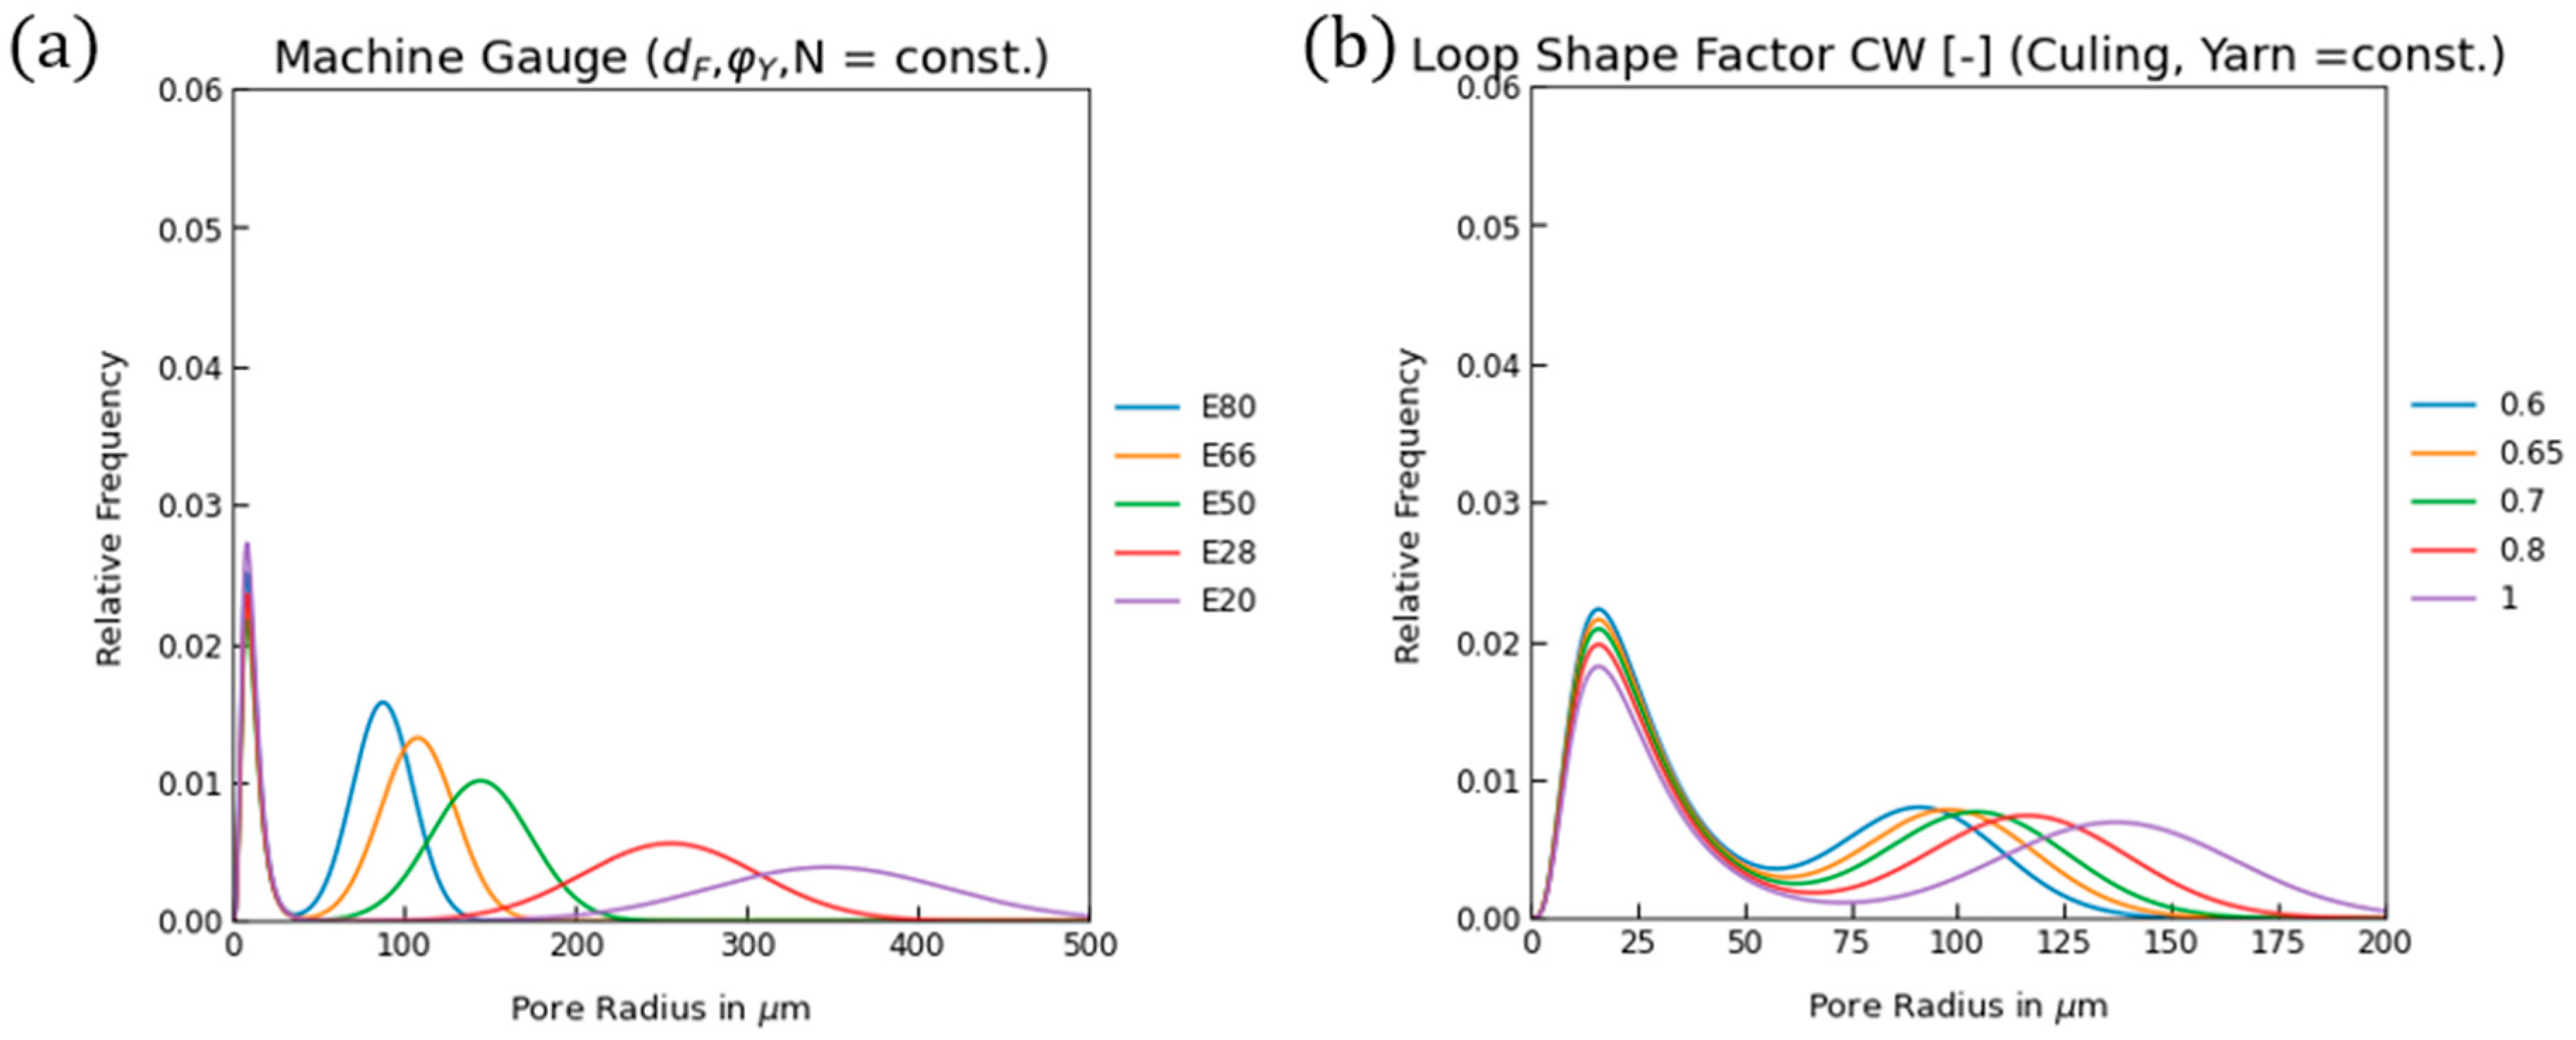
4.3. Knitting Parameters

The main geometric parameters that are changed on knitting machines are the gauge or machine fineness and the culling. Machine fineness is the number of needles per inch, while culling is a measure of needle takedown, mainly affecting the amount of yarn in the loop and ultimately the stitch density of the fabric.
For the machine fineness, comparable yarns in terms of the yarn parameters have been used, and the number of filaments has been adapted to the yarn count. For culling, the loop shape factor CW is a common measure of the geometrical influence of culling on the loop geometry. The loop shape factor CW is the ratio between the wale density w and the coarse density c of a knitted fabric, or the ratio between the wale width W and the coarse width C of a single loop.
C W = w c = C W
The loop shape factor CW increases with increasing needle take-down and the correspondingly longer loops. The behaviour of the models with respect to the machine gauge and the loop shape factor CW is shown in Figure 14.
It can be seen that the machine gauge only affects the inter-yarn pores, when the yarn parameters are kept constant. The distribution of the inter-yarn pores flattens out with coarser gauge, as the standard deviation was set to ten percent of the mean. The main effect of the culling is also on the inter-yarn pores, which grow with increasing loop shape factors.

5. Conclusions

This work presents a model for the pore size distribution function of knitted fabrics, incorporating detailed PDF models for both inter-yarn pores within yarns and intra-yarn pores on the fabric scale. The intra-yarn pores are modelled by a log-normal distribution parametrised by the hydraulic diameter. The inter-yarn pores are modelled as cylindrical pores.
The model for the intra-yarn pores is validated against porous properties obtained by imaging from microscopic images. The median diameters are between 39 and 126 µm for four twist-texturized yarns of 186 dtex linear density and 48 to 256 filaments. The model shows deviations between 3% and 63%. Accordingly, the log-normal model shows a higher deviation for yarns with higher twist and is, therefore, not suitable for twisted yarns.
Validation of the full model on topographies of two single-jersey fabrics shows the ability to qualitatively predict the bimodal pore size distribution function for single-jersey knitted fabrics. For open-knit fabrics with a defined loop structure, the experimental PDF agrees quantitatively with the model.
Despite its deviations, the model provides a quantitative measure in terms of the intra-yarn and inter-yarn pore size to characterise the fabric prior to manufacture. It predicts how the yarn structure and the knitting process interact concerning the bimodal porous properties of the single-jersey fabric.
The interactions of yarn and fabric parameters are investigated in a parameter study. Fibre diameter and yarn porosity mainly affect the inter-yarn pores in the yarn, which are generally smaller than 50 µm. The size of the intra-yarn pores in the knitted loop is mainly influenced by machine gauge, culling and the yarn diameter. The modelled radii range from around 80 µm for an E80 knitting machine to around 300 µm for an E20 knitting machine.
Despite its strengths, this model exhibits limitations in representing pore aspect ratios and pore cross-sectional shapes. It has only been validated on four yarns and two fabrics. The systematic deviation of the mean diameter of intra-yarn pores from the model could be improved by a more advanced loop model. At this stage, the model is limited to twist-texturized yarns and single-jersey fabrics. However, the bimodal approach can be extended to specific sub models of other yarn types and patterns. Future work should focus on comprehensive 3D validation at higher resolution and the effect of different loop models on the weighting of intra- and inter-yarn pores. As the porosity of staple fibre yarns differs from that of filament yarns, an appropriate model for yarn pores in staple fibre yarns could be developed to cover these yarns.

Author Contributions

Conceptualization, L.P.; methodology, L.P., L.M. and S.S.; software, L.P.; validation, L.P., L.M. and A.D.; formal analysis, L.P. and L.M.; investigation, L.P. and L.M.; resources, L.P.; data curation, L.P.; writing—original draft preparation, L.P.; writing—review and editing, L.P., L.M., S.S., A.D., U.N. and G.T.G.; visualization, L.P.; supervision, S.S., U.N. and G.T.G.; project administration, L.P. and L.M.; funding acquisition, U.N. and G.T.G. All authors have read and agreed to the published version of the manuscript.

Funding

This research was funded by the German Research Council (DFG), grant number 453311482.

Data Availability Statement

Data is available upon request.

Conflicts of Interest

The authors declare no conflicts of interest.

Appendix A

Table A1. Model parameters of validation in CT.
Name W
[ µ m ]
C
[ µ m ]
m Y
[ dtex ]
d Y
[ µ m ]
n F
[ ]
ρ F
g c m 3
d F
[ µ m ]
N
[ ]
L L
[ µ m ]
K
tex m m
ϕ Y
[ ]
ϕ R E V
[ ]
ϕ F a b r i c
[ ]
r P , K n i t
[ µ m ]
r P , Y a r n
[ µ m ]
E24-G818513186275481.3818.81.0130321.420.770.590.8419932
E24-T631477194372481.3816.31.4025561.720.870.440.8114655
Table A2. Model parameters of parameter study: fibre diameter.
Name W
[ µ m ]
C
[ µ m ]
m Y
[ d t e x ]
d Y
[ µ m ]
n F
[ ]
ρ F
g c m 3
d F
[ µ m ]
N
[ ]
L L
[ µ m ]
K
t e x m m
ϕ Y
[ ]
ϕ R E V
[ ]
ϕ F a b r i c
[ ]
r P , K n i t
[ µ m ]
r P , Y a r n
[ µ m ]
d F , 0 5003501861869611.3831.219662.190.70.560.8712410
d F , 1 5003501861863461.3851.219702.190.70.550.8712417
d F , 2 5003501861861771.3871.219762.180.70.560.8712423
d F , 3 500350186185861.38101.219782.180.70.560.8712534
d F , 4 500350186186601.38121.219812.180.70.550.8712440
Table A3. Model parameters of parameter study: yarn count.
Name W
[ µ m ]
C
[ µ m ]
m Y
[ d t e x ]
d Y
[ µ m ]
n F
[ ]
ρ F
g c m 3
d F
[ µ m ]
N
[ ]
L L
[ µ m ]
K
t e x m m
ϕ Y
[ ]
ϕ R E V
[ ]
ϕ F a b r i c
[ ]
r P , K n i t
[ µ m ]
r P , Y a r n
[ µ m ]
n F , 5 5003507399501.3871.217981.500.700.660.9013623
n F , 6 5003501461401001.3871.218792.030.700.470.8511524
n F , 7 5003502191711501.3871.219442.410.700.360.8010023
n F , 8 5003502911982001.3871.219992.700.700.270.758723
n F , 9 5003503642212501.3871.220502.940.700.220.717823
Table A4. Model parameters of parameter study: fibre misorientation.
Name W
[ µ m ]
C
[ µ m ]
m Y
[ d t e x ]
d Y
[ µ m ]
n F
[ ]
ρ F
g c m 3
d F
[ µ m ]
N
[ ]
L L
[ µ m ]
K
t e x m m
ϕ Y
[ ]
ϕ R E V
[ ]
ϕ F a b r i c
[ ]
r P , K n i t
[ µ m ]
r P , Y a r n
[ µ m ]
N 5 5003501632321281.3871.0519172.250.70.420.8410825
N 6 5003501712321281.3871.119172.250.70.420.8310824
N 7 5003501862321281.3871.219172.250.70.420.8210822
N 8 5003502022321281.3871.319172.250.70.420.8010820
N 9 5003502332321281.3871.519172.250.70.420.7710817
Table A5. Model parameters of parameter study: yarn porosity.
Name W
[ µ m ]
C
[ µ m ]
m Y
[ d t e x ]
d Y
[ µ m ]
n F
[ ]
ρ F
g c m 3
d F
[ µ m ]
N
[ ]
L L
[ µ m ]
K
t e x m m
ϕ Y
[ ]
ϕ R E V
[ ]
ϕ F a b r i c
[ ]
r P , K n i t
[ µ m ]
r P , Y a r n
[ µ m ]
ϕ Y , 5 5003501861231281.3871.219172.250.50.690.781384
ϕ Y , 6 5003501861371281.3871.219172.250.60.650.791355
ϕ Y , 7 5003501861581281.3871.219172.250.70.600.801298
ϕ Y , 8 5003501861941281.3871.219172.250.80.500.8111814
ϕ Y , 9 5003501862741281.3871.219172.250.90.340.839731
Table A6. Model parameters of parameter study: machine gauge.
Name W
[ µ m ]
C
[ µ m ]
m Y
[ d t e x ]
d Y
[ µ m ]
n F
[ ]
ρ F
g c m 3
d F
[ µ m ]
N
[ ]
L L
[ µ m ]
K
t e x m m
ϕ Y
[ ]
ϕ R E V
[ ]
ϕ F a b r i c
[ ]
r P , K n i t
[ µ m ]
r P , Y a r n
[ µ m ]
E803182227980161.38101.211812.380.70.700.858912
E663852699292211.38101.214192.140.70.720.8610912
E50508356117117341.38101.218621.840.70.740.8714612
E289076352212211221.38101.233391.410.70.720.8625712
E2012708893443442961.38101.247361.240.70.680.8334912
Table A7. Model parameters of parameter study: culling.
Name W
[ µ m ]
C
[ µ m ]
m Y
[ d t e x ]
d Y
[ µ m ]
n F
[ ]
ρ F
g c m 3
d F
[ µ m ]
N
[ ]
L L
[ µ m ]
K
t e x m m
ϕ Y
[ ]
ϕ R E V
[ ]
ϕ F a b r i c
[ ]
r P , K n i t
[ µ m ]
r P , Y a r n
[ µ m ]
C W 0 5003301862321281.3871.218202.370.70.360.809324
C W 1 5003251862321281.3871.218672.310.70.380.819924
C W 2 5003501862321281.3871.219172.250.70.400.8210624
C W 3 5004001862321281.3871.220252.130.70.430.8311724
C W 4 5005001862321281.3871.222561.910.70.480.8413824

References

  1. Ortega, M.; Saynisch, A.; Yurtseven, B.-M.; Gries, T. A Review on False-Twist Texturing. Fibers 2024, 12, 36. [Google Scholar] [CrossRef]
  2. Mezarcioz, S.; Ogulata, R.T. Modelling of Porosity in Knitted Fabrics. J. Fash. Technol. Text. Eng. 2017, s1, 5. [Google Scholar] [CrossRef]
  3. Khalil, E. Effect of Stitch Length on Physical and Mechanical Properties of Single Jersey Cotton Knitted Fabric. Int. J. Sci. Res. 2012, 3, 593–596. [Google Scholar]
  4. Pauly, L.; Maier, L.; Nieken, U.; Gresser, G.T. Functional design of porous systems by systematic patterning of flat knits. In Proceedings of the 15th Annual International Conference on Porous Media, Edinburgh, UK, 22–25 May 2023; Available online: https://events.interpore.org/event/41/contributions/5685/contribution.pdf (accessed on 1 November 2024).
  5. Kabir, S.M.F.; Uluturk, I.; Pang, R.; Khadse, N.; Stapleton, S.E.; Park, J.H. Structure–Property Investigation of Knit Patterns on Thermal Comfort: A Holistic Approach. ACS Appl. Eng. Mater. 2023, 1, 1455–1466. [Google Scholar] [CrossRef]
  6. Chen, Q.; Tang, K.-P.M.; Ma, P.; Jiang, G.; Xu, C. Thermophysiological comfort properties of polyester weft-knitted fabrics for sports T-shirt. J. Text. Inst. 2017, 108, 1421–1429. [Google Scholar] [CrossRef]
  7. Çil, M.; Nergis, U.; Candan, C. An Experimental Study of Some Comfort-related Properties of Cotton—Acrylic Knitted Fabrics. Text. Res. J. 2009, 79, 917–923. [Google Scholar] [CrossRef]
  8. Rouquerol, J.; Avnir, D.; Fairbridge, C.W.; Everett, D.H.; Haynes, J.M.; Pernicone, N.; Ramsay, J.D.F.; Sing, K.S.W.; Unger, K.K. Recommendations for the characterization of porous solids (Technical Report). Pure Appl. Chem. 1994, 66, 1739–1758. [Google Scholar] [CrossRef]
  9. Dal, V.; Atmaca, M.; Yildiz, Z.; Ceviz, N.O.; Hes, L. Thermal Comfort of Woolen Fabrics Depending on Physical Properties. J. Nat. Fibers 2016, 13, 714–725. [Google Scholar] [CrossRef]
  10. Mao, Z.; Yu, H.; Wang, Y.; Zhang, L.; Zhong, Y.; Xu, H. States of Water and Pore Size Distribution of Cotton Fibers with Different Moisture Ratios. Ind. Eng. Chem. Res. 2014, 53, 8927–8934. [Google Scholar] [CrossRef]
  11. Nagy, V.; Vas, L.M. Pore characteristic determination with mercury porosimetry in polyester staple yarns. Fibres Text. East. Eur. 2005, 13, 21–26. [Google Scholar]
  12. Miller, B.; Tyomkin, I. An Extended Range Liquid Extrusion Method for Determining Pore Size Distributions. Text. Res. J. 1986, 56, 35–40. [Google Scholar] [CrossRef]
  13. Jakšić, D.; Jakšić, N. Assessment of Porosity of Flat Textile Fabrics. Text. Res. J. 2007, 77, 105–110. [Google Scholar] [CrossRef]
  14. Pan, N.; Gibson, P. Thermal and Moisture Transport in Fibrous Materials, 1st ed.; Woodhead Publishing: Cambridge, UK, 2006; Available online: https://shop.elsevier.com/books/thermal-and-moisture-transport-in-fibrous-materials/pan/978-1-84569-057-1 (accessed on 24 August 2024).
  15. Gostick, J.; Khan, Z.; Tranter, T.; Kok, M.; Agnaou, M.; Sadeghi, M.; Jervis, R. PoreSpy: A Python Toolkit for Quantitative Analysis of Porous Media Images. J. Open Source Softw. 2019, 4, 1296. [Google Scholar] [CrossRef]
  16. Ogulata, R.T.; Mavruz, S. Investigation of porosity and air permeability values of plain knitted fabrics. Fibres Text. East. Eur. 2010, 82, 71–75. [Google Scholar]
  17. Dias, T.; Delkumburewatte, G.B. Changing porosity of knitted structures by changing tightness. Fibers Polym. 2008, 9, 76–79. [Google Scholar] [CrossRef]
  18. Abd elzaher Eltahan, E.; Sultan, M.; Mito, A.-B. Determination of loop length, tightness factor and porosity of single jersey knitted fabric. Alex. Eng. J. 2016, 55, 851–856. [Google Scholar] [CrossRef]
  19. Ramratan, R.; Choudhary, A.K. The Influence of Yarn and Knit Structure on Comfort Properties of Sportswear Fabric. J. Text. Appar. Technol. Manag. 2020, 11, 10. [Google Scholar]
  20. Abdolmaleki, S.; Jeddi, A.A.A.; Amani, M. Estimation on the 3D porosity of plain knitted fabric under uniaxial extension. Fibers Polym. 2012, 13, 535–541. [Google Scholar] [CrossRef]
  21. Abdolmaleki, S.; Jeddi, A. Estimation on the 3D Porosity of Plain Weft Knitted Fabric under Wale Extension. J. Text. Polym. 2014, 2, 65–70. [Google Scholar]
  22. Daukantiene, V.; Vadeike, G. Evaluation of the air permeability of elastic knitted fabrics and their assemblies. Int. J. Cloth. Sci. Technol. 2018, 30, 839–853. [Google Scholar] [CrossRef]
  23. Du, Y.; Shen, W.; Feng, X. Analysis of the Porosity Changing after Moisture Absorption in Functional Knitted Fabrics. J. Donghua Univ. Engl. Ed. 2007, 24, 740–743. [Google Scholar]
  24. Gebart, B.R. Permeability of Unidirectional Reinforcements for RTM. J. Compos. Mater. 1992, 26, 1100–1133. [Google Scholar] [CrossRef]
  25. Neckář, B.; Ibrahim, S. Theoretical Approach for Determining Pore Characteristics Between Fibers. Text. Res. J. 2003, 73, 611–619. [Google Scholar] [CrossRef]
  26. Li, Y.F.; Huang, L.Q.; Yu, J.Y. Study on the Pore Structure of Cotton-Like Polyester Knitted Fabrics. Adv. Mater. Res. 2013, 821–822, 270–273. [Google Scholar] [CrossRef]
  27. Mark, A.; Bauer, B.; Gresser, G. Quantification of hierarchic multimodal pore structures in textiles by the example of knitted fabric structures. In Proceedings of the Aachen Dresden International Textile Conference, Aachen, Germany, 26–27 November 2015. [Google Scholar]
  28. Benltoufa, S.; Fayala, F.; BenNasrallah, S. Capillary Rise in Macro and Micro Pores of Jersey Knitting Structure. J. Eng. Fibers Fabr. 2008, 3, 155892500800300. [Google Scholar] [CrossRef]
  29. Maier, L.; Pauly, L.; Gostick, J.T.; Gresser, G.T.; Nieken, U. Spontaneous imbibition in thin anisotropic fibrous media: Experiments and numerical modelling. Text. Res. J. 2024, 00405175241268794. [Google Scholar] [CrossRef]
  30. Rebenfeld, L.; Miller, B. Using Liquid Flow to Quantify the Pore Structure of Fibrous Materials. J. Text. Inst. 1995, 86, 241–251. [Google Scholar] [CrossRef]
  31. Birrfelder, P.; Dorrestijn, M.; Roth, C.; Rossi, R.M. Effect of fiber count and knit structure on intra- and inter-yarn transport of liquid water. Text. Res. J. 2013, 83, 1477–1488. [Google Scholar] [CrossRef]
  32. Fischer, R.; Schlepütz, C.M.; Hegemann, D.; Rossi, R.M.; Derome, D.; Carmeliet, J. Four-dimensional imaging and free-energy analysis of sudden pore-filling events in wicking of yarns. Phys. Rev. E 2021, 103, 053101. [Google Scholar] [CrossRef]
  33. Fischer, R.; Schlepütz, C.M.; Zhao, J.; Boillat, P.; Hegemann, D.; Rossi, R.M.; Derome, D.; Carmeliet, J. Wicking dynamics in yarns. J. Colloid Interface Sci. 2022, 625, 1–11. [Google Scholar] [CrossRef]
  34. Benltoufa, S.; Fayala, F.; Cheikhrouhou, M.; Ben Nasrallah, S. Porosity determination of jersey structure. AUTEX Res. J. 2007, 7, 63–69. [Google Scholar] [CrossRef]
  35. Siddiqui, M.O.R.; Sun, D. Porosity Prediction of Plain Weft Knitted Fabrics. Fibers 2014, 3, 1–11. [Google Scholar] [CrossRef]
  36. Karaguzel, B. Characterization and Role of Porosity in Knitted Fabrics. Master’s Thesis, North Carolina State University, Raleigh, NC, USA, 2004. [Google Scholar]
  37. Huang, R. Characterization and Modeling of Pore Size in Weft-Knitted Fabrics; North Carolina State University: Raleigh, NC, USA, 2023; Available online: https://repository.lib.ncsu.edu/server/api/core/bitstreams/0eff62d3-7f05-4907-aac5-179f0cf499b4/content (accessed on 26 January 2025).
  38. Sampson, W.W. A multiplanar model for the pore radius distribution in isotropic near-planar stochastic fibre networks. J. Mater. Sci. 2003, 38, 1617–1622. [Google Scholar] [CrossRef]
  39. Rawal, A.; Rao, P.V.K.; Russell, S.; Jeganathan, A. Effect of fiber orientation on pore size characteristics of nonwoven structures. J. Appl. Polym. Sci. 2010, 118, 2668–2673. [Google Scholar] [CrossRef]
  40. Bai, H.; Qian, X.; Fan, J.; Qian, Y.; Duo, Y.; Liu, Y.; Wang, X. Computing Pore Size Distribution in Non-woven Fibrous Filter Media. Fibers Polym. 2020, 21, 196–203. [Google Scholar] [CrossRef]
  41. Wang, F.; Schiller, U.D. Computational characterization of nonwoven fibrous media: I. Pore-network extraction and morphological analysis. Phys. Rev. Mater. 2020, 4, 083803. [Google Scholar] [CrossRef]
  42. Komori, T.; Makishima, K. Geometrical Expressions of Spaces in Anisotropic Fiber Assemblies. Text. Res. J. 1979, 49, 550–555. [Google Scholar] [CrossRef]
  43. Ren, J.; Li, Z.; Wong, F.-S. A new method for the prediction of pore size distribution and MWCO of ultrafiltration membranes. J. Membr. Sci. 2006, 279, 558–569. [Google Scholar] [CrossRef]
  44. D’Hollander, E.H. Estimation of the pore size distribution from the moisture characteristic. Water Resour. Res. 1979, 15, 107–112. [Google Scholar] [CrossRef]
  45. Boributh, S.; Jiraratananon, R.; Li, K. Analytical solutions for membrane wetting calculations based on log-normal and normal distribution functions for CO2 absorption by a hollow fiber membrane contactor. J. Membr. Sci. 2013, 429, 459–472. [Google Scholar] [CrossRef]
  46. Limpert, E.; Stahel, W.A.; Abbt, M. Log-normal Distributions across the Sciences: Keys and Clues. BioScience 2001, 51, 341–352. [Google Scholar] [CrossRef]
  47. Crow, E.L. Lognormal Distributions: Theory and Applications; Statistics: Textbooks and Monographs Series; Dekker: New York, NY, USA, 1988. [Google Scholar]
  48. Kyosev, Y. Topology-Based Modeling of Textile Structures and Their Joint Assemblies: Principles, Algorithms and Limitations; Springer International Publishing: Cham, Switzerland, 2019. [Google Scholar] [CrossRef]
  49. Brown, L.P. TexGen. In Advanced Weaving Technology; Kyosev, Y., Boussu, F., Eds.; Springer International Publishing: Cham, Switzerland, 2022; pp. 253–291. [Google Scholar] [CrossRef]
  50. Kyosev, Y.; Angelova, Y.; Kovar, R. 3D Modeling of Plain Weft Knitted Structures of Compressible Yarn. Res. J. Text. Appar. 2005, 9, 88–97. [Google Scholar] [CrossRef]
  51. Choi, K.F.; Lo, T.Y. An Energy Model of the Plain Knitted Loop. Text. Res. J. 2003, 73, 739–748. [Google Scholar] [CrossRef]
  52. Specht, E. The Best Known Packings of Equal Circles in a Circle (Complete up to N = 2600). Available online: http://hydra.nat.uni-magdeburg.de/packing/cci/cci.html#References (accessed on 28 June 2023).
  53. Mezarcioz, S.; Mezarcioz, S.; Ogulata, R.T. Prediction of air permeability of knitted fabrics by means of computational fluid dynamics. Tekst. Konfeksiyon 2014, 24, 202–211. [Google Scholar]
  54. Team, O.D. OpenCV: Open Source Computer Vision Library. Available online: https://opencv.org (accessed on 16 December 2024).
  55. Sozumert, E.; Kiyak, Y.; Demirci, E.; Silberschmidt, V.V. Effect of microstructure on porosity of random fibrous networks. J. Text. Inst. 2020, 111, 1713–1723. [Google Scholar] [CrossRef]
Figure 1. Structure of a single-jersey knitted fabric, a single loop as a representative elementary volume (REV), a geometrical model of the REV and the location of the pores between the yarns in the knitted fabric.
Fibers 13 00048 g001
Figure 2. Cross-sections of twist-texturized yarns for validation of yarn pore model.
Fibers 13 00048 g002
Figure 3. Imaging algorithm to determine the pore size distribution function. Darker colours of the local thickness method represent smaller pore radii.
Fibers 13 00048 g003
Figure 4. Histograms of experimental PDF determined by PoreSpy, fit of log-normal function to the experimental data and PDF of the presented model.
Fibers 13 00048 g004
Figure 5. Microscopic images of fabrics E24-T and E24-G used for validation.
Fibers 13 00048 g005
Figure 6. CT slices of the two fabrics with fibres (black).
Fibers 13 00048 g006
Figure 7. (a) Location of yarn cross-sections at the loop legs, the binding points and the loop heads. (b) Corresponding yarn cross-sections for both fabric types.
Fibers 13 00048 g007
Figure 8. Images of local thicknesses for selected yarn cross-sections.
Fibers 13 00048 g008
Figure 9. Combined histograms of image stacks and the presented model for selected yarn cross-sections (bin size = 3.6 µm).
Fibers 13 00048 g009
Figure 10. Pore size of CT images with PoreSpy algorithm.
Fibers 13 00048 g010
Figure 11. Combined histograms of image stacks and the presented model (bin size = 15 µm).
Fibers 13 00048 g011
Figure 12. (a) Variation in fibre diameter by maintaining the yarn count and the yarn. (b) Variation in yarn count and fibre count by adding more filaments.
Fibers 13 00048 g012
Figure 13. (a) Variation in fibre misorientation N. (b) Varying the yarn porosity and keeping the fibre diameter and count as constants.
Fibers 13 00048 g013
Figure 14. Influence of machine gauge and culling on PDF.
Fibers 13 00048 g014
Table 1. Input parameters to the presented model.
ScalePropertyAbbreviationUnit
YarnFibre diameter d F μ m
Fibre count n F μ m
Yarn linear density m Y d t e x
Yarn diameter d Y μ m
FabricCoarse spacing C μ m
Wale spacing W μ m
Table 2. Measures of yarns for validation of model.
Name m Y , m e a s
[dtex]
d Y , m e a s
[µm]
n F
[−]
ρ F
[dtex]
d F , m e a s
[µm]
ϕ Y
[−]
N
[−]
f48182518481.3819.320.931.06
f1281808141281.3812.510.961.34
f128Z1805961281.3812.510.941.01
f2561805082561.388.330.901.40
Table 3. Median pore diameters in the yarn derived by the model and by fitting the experimental data to a log-norm function.
Name r P , Y a r n , m o d e l
[µm]
r P , Y a r n , f i t
[µm]
Deviation [%]
f4897126−23
f1288386+3
f128Z10464+63
f2563955−29
Disclaimer/Publisher’s Note: The statements, opinions and data contained in all publications are solely those of the individual author(s) and contributor(s) and not of MDPI and/or the editor(s). MDPI and/or the editor(s) disclaim responsibility for any injury to people or property resulting from any ideas, methods, instructions or products referred to in the content.

