Abstract
The electrical conductivity of extruded carbon fiber (CF)/Polymethylmethacrylate (PMMA) composites with controlled CF aspect ratio and filler fractions ranging from 0 to 50 vol. % has been investigated and analyzed. The composites were extruded through a capillary rheometer, utilizing either 1-mm or 3-mm diameter extrusion dies, resulting in cylindrical composite filaments of two different diameters. Since the average CF orientation becomes more aligned with the extrusion flow when the diameter of the extrusion dies decreases, the relationship between conductivity and average fiber orientation could therefore be examined. The room temperature conductivities of the extruded filaments as a function of CF fractions were fitted to the McLachlan general effective medium (GEM) equation and the percolation thresholds were determined to 20.0 ± 2.5 vol. % and 32.0 ± 5.9 vol. % for the 3-mm (with CFs oriented less) and 1-mm (with CFs oriented more) filaments, respectively. It turned out that the oriented CFs in the composite shift the percolation threshold to a higher value, however, the conductivity above the percolation threshold is higher for composites with oriented CFs. A novel approach based on the Balberg excluded volume theory was proposed to explain this counterintuitive phenomenon.
1. Introduction
Conductive polymer composites (CPCs) are widely used in many fields, such as antistatic materials, electromagnetic interference (EMI) shielding, sensor and conductors. Nowadays, the conductivity of CPCs is generally explained by “conductive pathways” in the composites, which are formed by conductive fillers [1,2,3,4,5]. When the filler fraction increases, the number of “conductive pathways” grows, and consequently, the conductivity of the composite also increases. An electrical percolation threshold is defined as a certain critical filler fraction when the conductivity of the composite increases by several orders of magnitude [6,7]. Many theories have been suggested for describing the relationship between filler fraction and electrical conductivity for composites consisting of polymers and conductivity fillers. The most classical percolation theory is [8]:
where σ and σ0 are the conductivities of the composite and the polymer matrix, respectively. is the volume fraction of fillers and c is the percolation threshold. For composites with filler fractions > c, the experimental results are fitted by plotting log (σ) against log ( c) and regulating c until the best linear fit is obtained. Another model is the general effective medium (GEM) equation presented by McLachlan [9]:
where σm, σc, σf are the conductivities of the PMMA matrix, the composite and the CFs, respectively. The volume fraction of CFs is denoted and the percolation threshold . For 3-D systems [9], the exponential factors are generally set to s = 0.87 and t = 2.
Chopped CFs with high aspect ratio (AR = length/diameter) is one of the most widely used conductive fillers. With a larger AR of the fibers, the percolation threshold of the composites is shifted towards a lower concentration of fillers [10]. It has been reported that the internal orientation of the CFs also influences the threshold of the composite [10,11]. A decreased particle size, when AR and all other variables are kept constant, generally result in a decreased percolation threshold due to shorter average inter-particle distances [12] An increased applied voltage (or temperature) can potentially result in a decreased percolation threshold, because the maximum hopping/tunneling distances for the electrons will increase if they have higher energy [13]. If the fillers are surface modified with dense insulating grafts, the shortest possible interparticle distance will be limited, resulting in a higher and narrower percolation threshold [14]. The dispersion of the fillers also effect the percolation threshold [1,15]. The main factors that influence the percolation threshold of composites (in general) are summarized in Table 1.

Table 1.
Factors which influence the percolation threshold of composites.
In our previous work, CF/PMMA composites with very narrow AR distributions (9.2 ± 1.3) were successfully manufactured using a two-step melt mixing procedure [10]. Anisotropic CF orientations were induced by extruding the material through a 1-mm (diameter) capillary rheometer into rod-like composite filaments with high CF fractions. The percolation thresholds of these anisotropic 1-mm composite filaments were high, up to 30.43 vol. %. Significantly lower values (10–15% [10]) have previously been reported for isotropic CF/PMMA composites with the same AR. However, several previous papers have also reported that a more parallel filler alignment increases the electrical conductivity [16,17], which is intuitively in contrast to our observation that an increasing anisotropy results in a higher percolation threshold. (Normally a higher percolation threshold results in a lower electrical conductivity, assuming that the volume filler fraction is fixed). The aim of this paper is to examine and explain the counterintuitive phenomenon observed for CF/PMMA composites.
In this study, the electrical conductivities and percolation thresholds of composites extruded with 1 mm and 3 mm diameter, respectively, capillary rheometer dies are compared, using the same CF volume filler fraction and AR for both die diameters. The CFs in the 3-mm extruded filaments undertake less shear deformation during the melt spinning process and therefore possess less orientation than in the 1-mm extruded filaments. As a consequence, the percolation threshold of the 3-mm filaments is expected to be between value of the isotropic CF/PMMA composite ( ≅ 15%) and the highly anisotropic 1-mm die composite ( ≅ 30%). Using this novel experimental strategy, the influence of pure fiber orientation was systematically examined more precisely than previously possible. Furthermore, the methodically derived experimental results enabled us to reveal the underlying explanation for the aforementioned strange phenomenon.
2. Experimental
2.1. Materials
The matrix material was PMMA Plexiglas 7N (Evonik Röhm GmbH, Darmstadt, Germany), with weight-average molar mass 99 kg/mol, density 1.19 g/cm3. polydispersity index = 1.52. The filler material was chopped carbon fibers with a diameter of 7 µm, an initial length of 6 mm, a density of 1.79 g/cm3 and a specific resistance of 1.7 × 10⁻³ Ω/cm, obtained from Tenax®—JHT C493 6 mm (Toho Tenax Europe GmbH, Wuppertal, Germany).
2.2. Sample Preparation
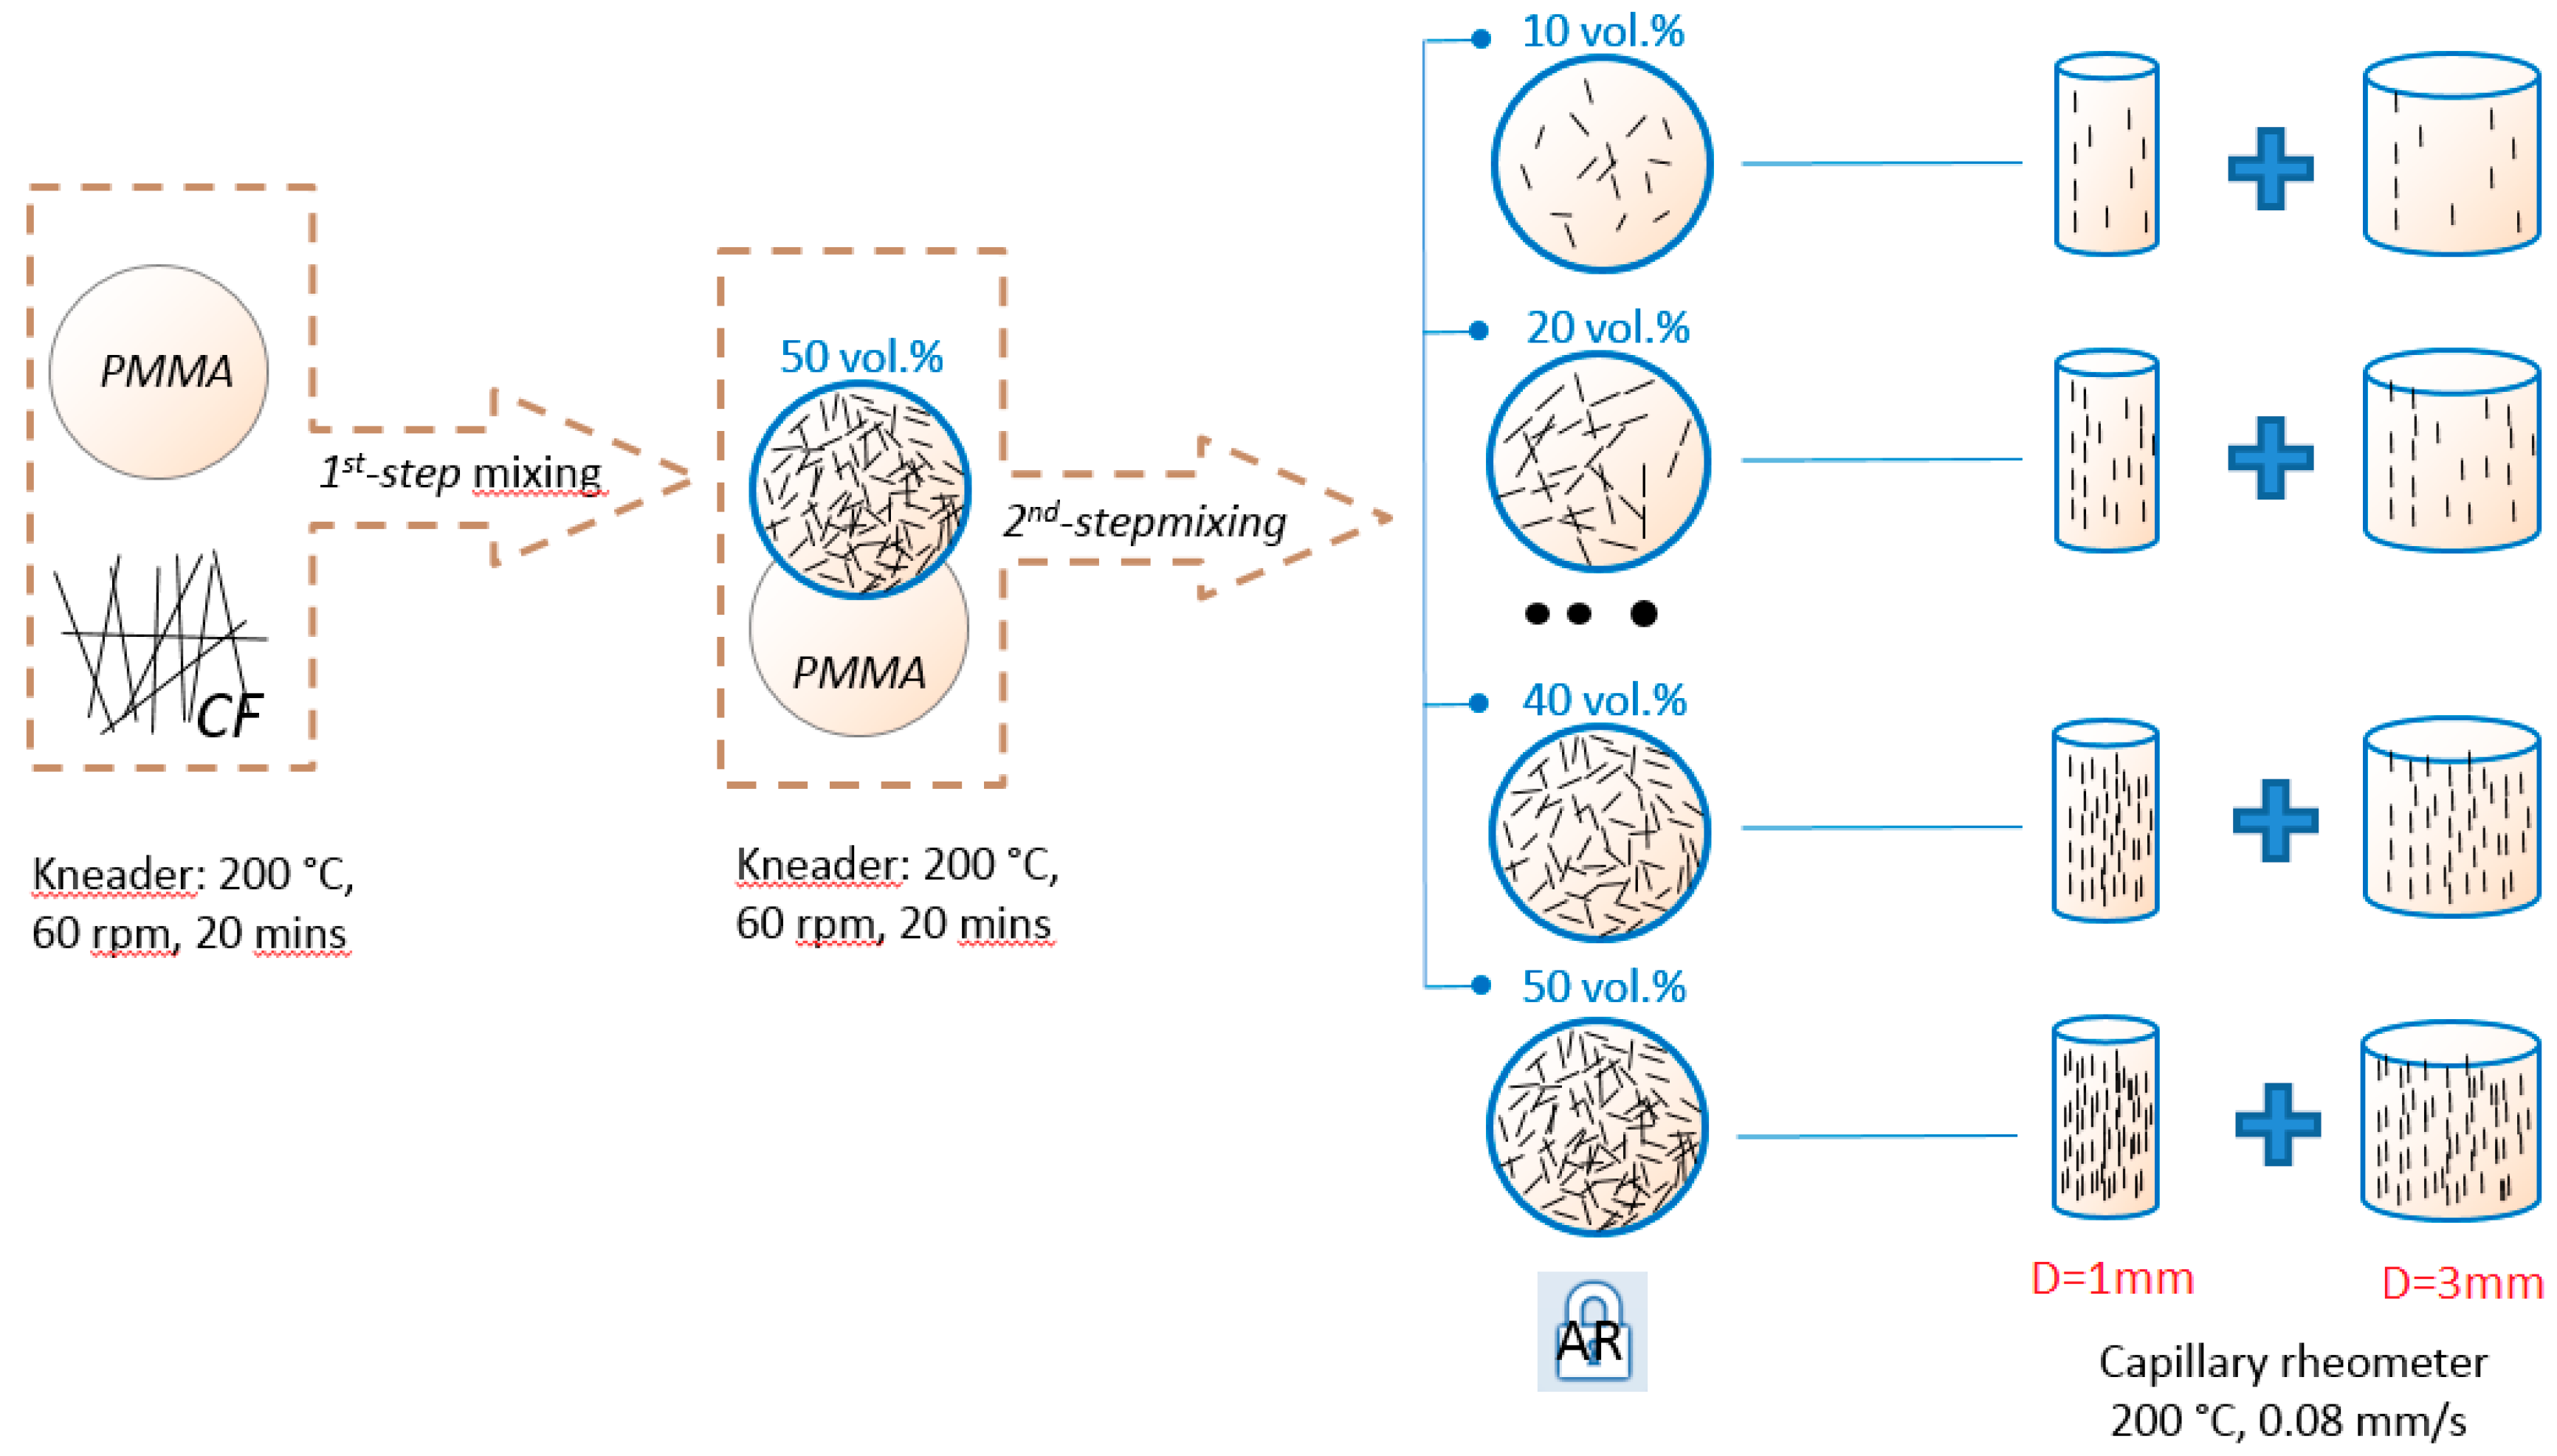
A two-step mixing procedure, described in a recent publication [10], was applied in this study (Figure 1). Prior to processing, all the materials were dried 24 h under vacuum at 80 °C. CF/PMMA composites were prepared by melt mixing in an internal kneader PolyDrive (Haake, 557-8310) (Schwerte, Germany) at a temperature of 200 °C and a rotation speed of 60 rpm. The composites (50 vol. %) produced according to this process are referred to as 1st-step mixing (blue circle marked with 50 vol. %).
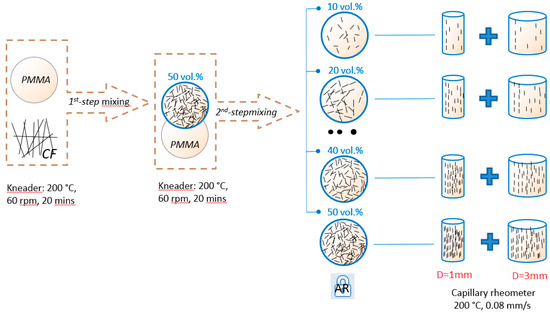
Figure 1.
Process flow chart of the two-step melt mixing method and extrusion process.
Composites from the first-step mixing were treated as master batches (MB) and portions of these batches were further diluted with pure PMMA to the required concentration (2nd-step mixing). After melt mixing, all the composites were ground into granules and dried under vacuum at 80 °C for 24 h. With this 2-step melt mixing procedure, the AR of the CFs were successfully controlled.
After drying, the composite granules were extruded at 200 °C utilizing a capillary rheometer (Göttfert, Rheograph 2003), (Göttfert, Buchen, Germany), using either a 10-mm length die with a diameter D = 1 mm or a 10 mm length die with a D = 3 mm. A constant extrusion speed v = 0.08 mm/s of the pistol (with diameter D0 = 12 mm) was applied for both dies. Therefore, the apparent shear rate of the extruded composite filaments can be calculated from Equation (3) [18,19], resulting in (D = 1 mm) = 92.16 s−1, and (D = 3 mm) = 3.41 s−1.
2.3. Sample Characterization
The extruded filaments (both diameters) were cut into 20-mm-long samples; the end sections were polished in order to remove isolate polymer. Conductive silver paste was then coated (exclusively) at the polished ends, to ensure enough contact between the samples and the electrode. The electrical resistance R of the samples at room temperature was measured using a Keithley 6487 Pico ammeter (Tektronix, Beaverton, OR, USA) at a constant voltage 1 V (Figure 2). The conductivity σ was calculated as follows:
where R is the electrical resistivity of the composite, L is the distance between two silver-coated ends of the sample, and D is the diameter of the fiber composite. The diameters of the extrudes samples were close to the diameters of the extrusion dies (1 mm and 3 mm), a slight reduction of the fiber diameter of less than 5% was observed as a consequence of stretching during fiber spinning by gravity. A Vernier calliper was used for the diameter measurements. For each material composition 20 composite samples were manufactured and analyzed. Each presented conductivity data point is thus the average of 20 individual measurements on different samples.

Figure 2.
Electrical conductivity measurement of the silver-coated samples; (a) practicality photography of the 1-mm diameter samples and 3-mm diameter samples; (b) schematic sketch of the electrical conductivity measurement.
In order to investigate the CFs orientation in the extruded filament, the samples were fixed with epoxy resin and then polished until the width of the exposed surface of the sample was equal to the original diameter of the fiber composites (Figure 3) [10]. The CF orientation was then analyzed using a light microscope.

Figure 3.
Polishing method, to investigate the carbon fibers orientation of the composites filament.
3. Results and Discussion
3.1. Thermogravimetric Analysis (TGA) of the CF/PMMA Composites
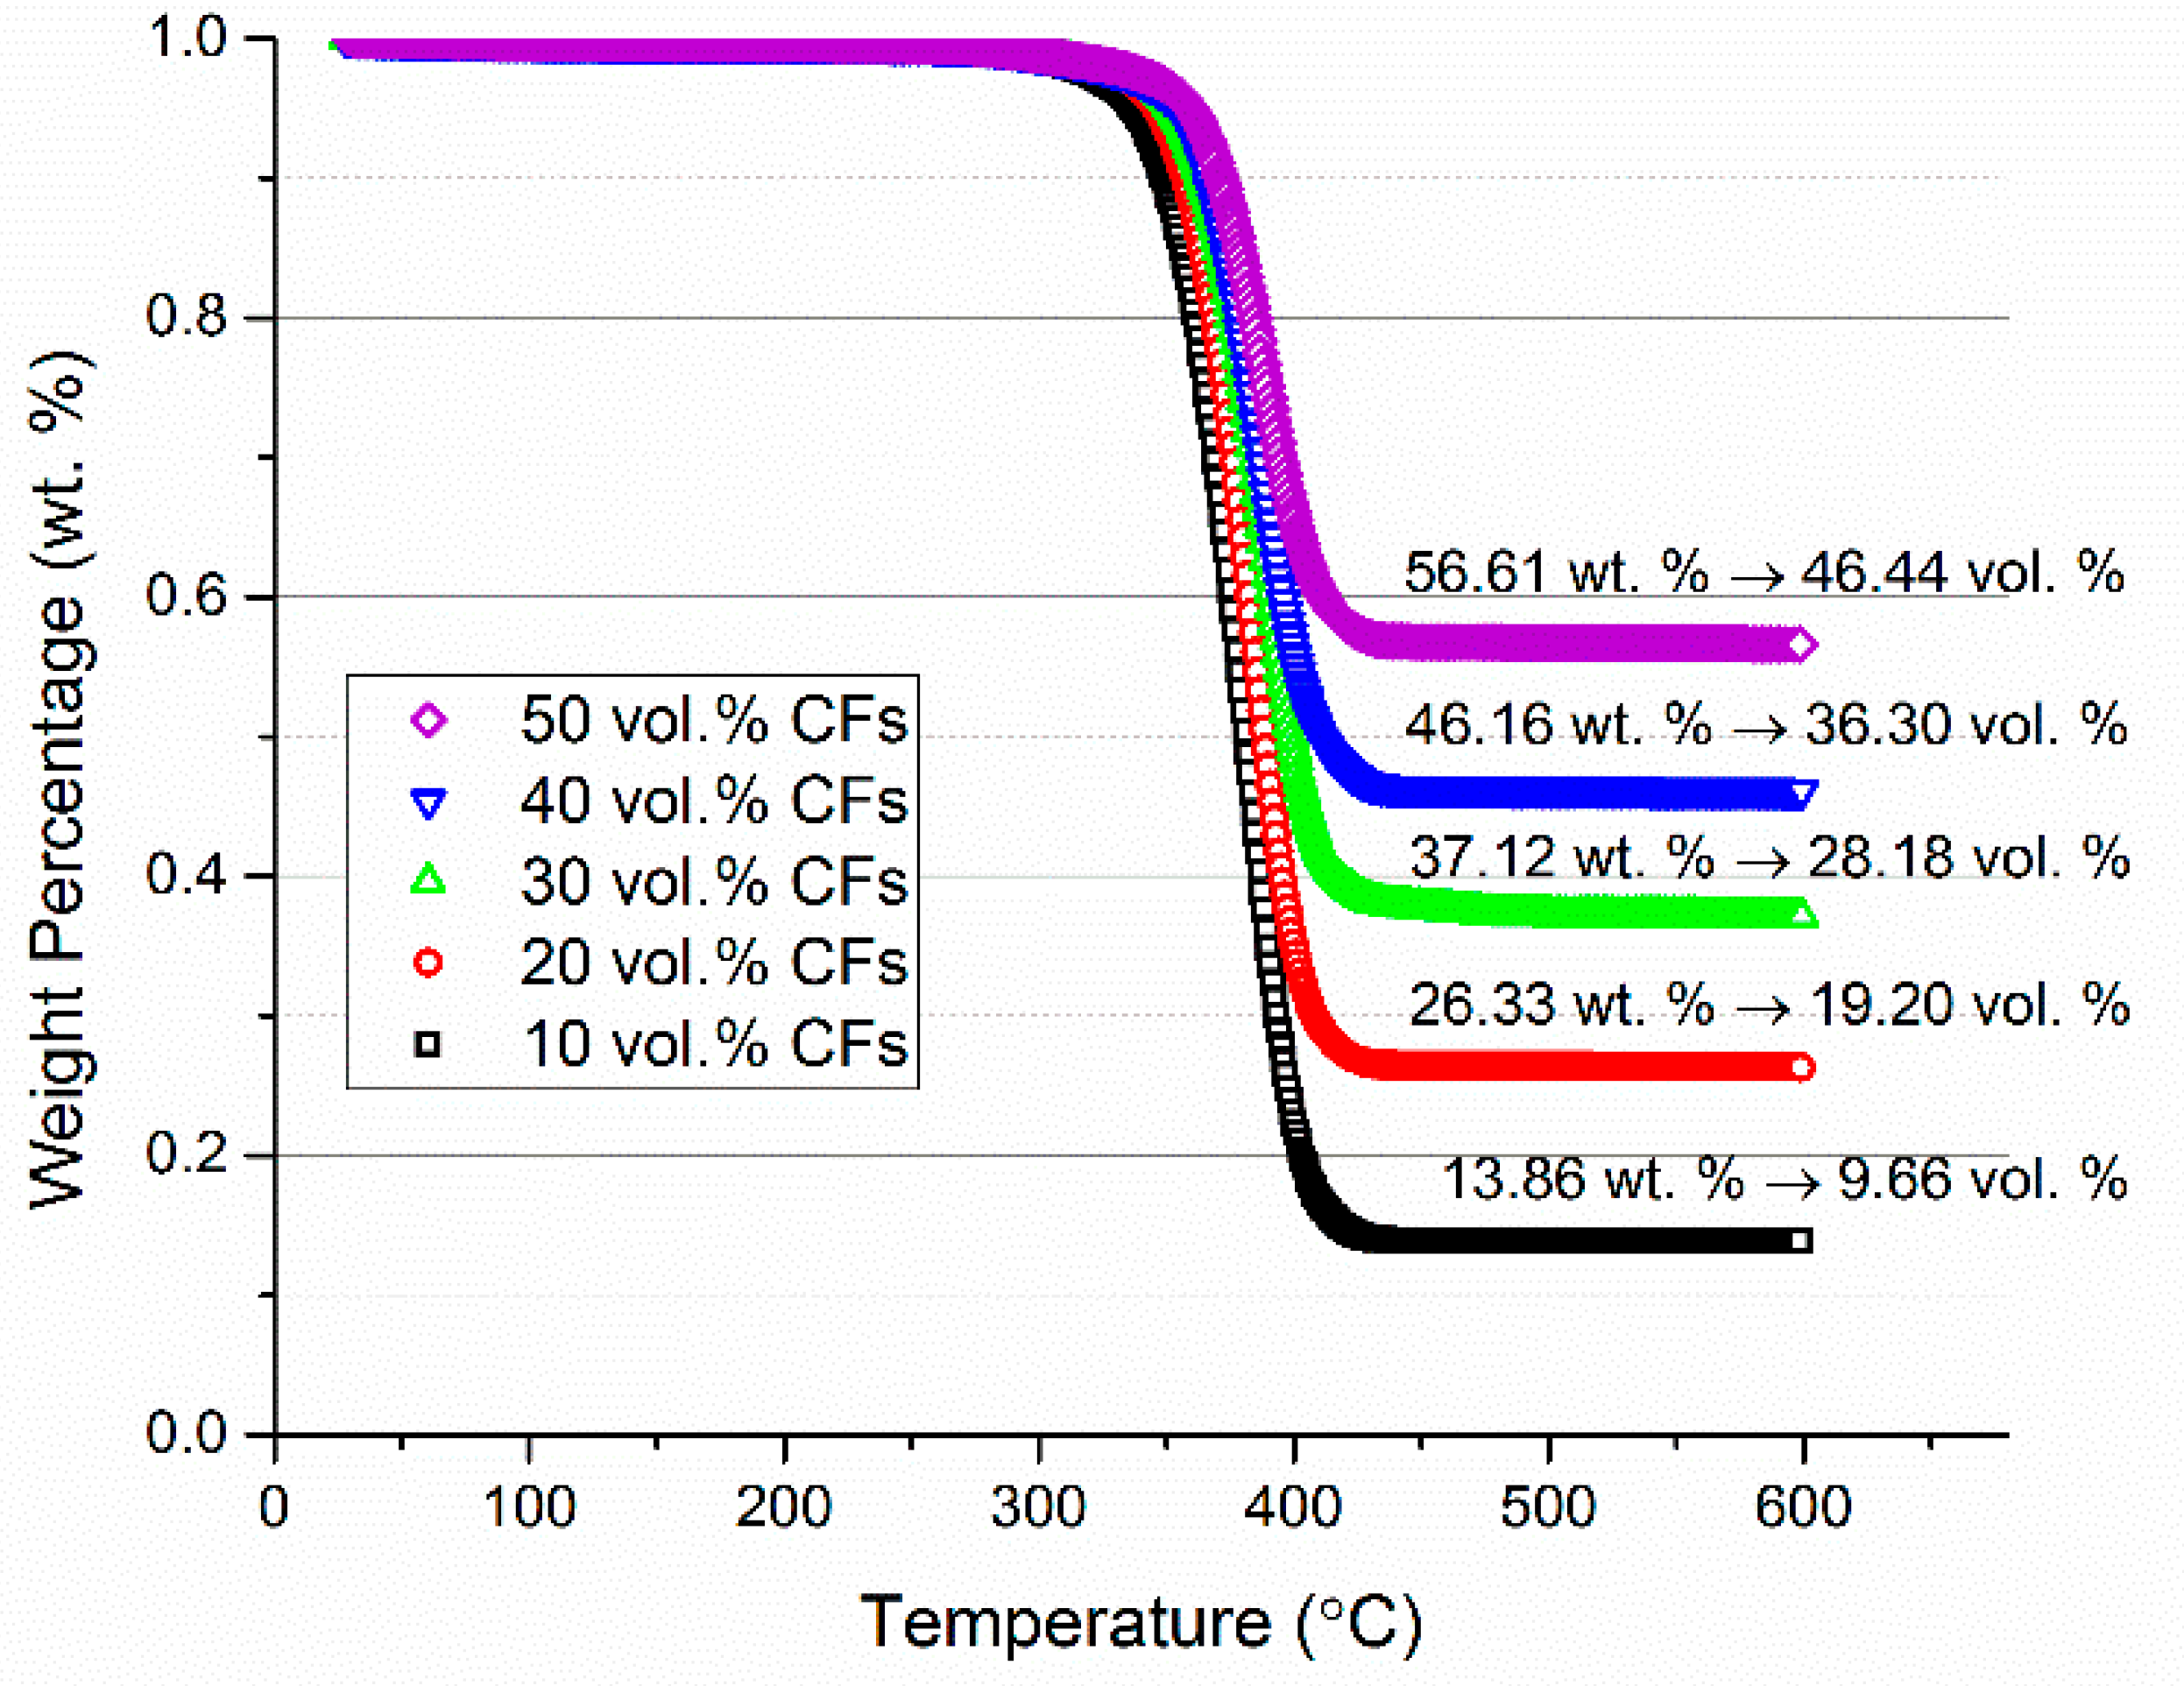
In order to determine the actual CF volume fractions in the CF/PMMA composites, TGA measurements were utilized under a nitrogen atmosphere, with a heating rate 10 °C/min on composites with five different designed CFs fractions (10; 20; 30; 40; 50 vol. %) as shown in Figure 4. The actual CF weight fractions in the composites were given, and the corresponding CF volume fractions can be reanalyzed by Equation (5),
where ρCF = 1.79 g/cm3 and ρCF = 1.19 g/cm3. The extrusion processing parameters (T = 200 °C, extrusion speed = 0.08 mm/s) were optimized for CF/PMMA composites [7,10] such that the porosity became very small and thus could be neglected in Equation (5).
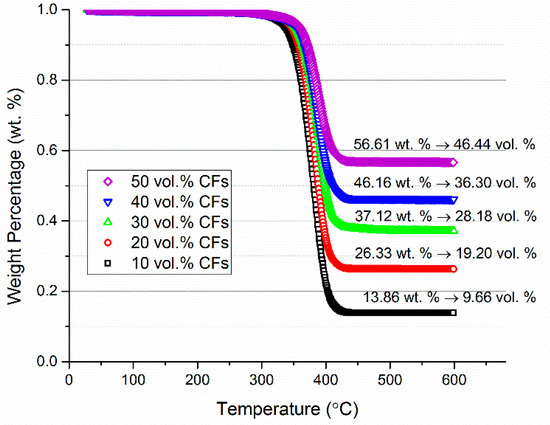
Figure 4.
The weight fraction of carbon fibers (CFs) obtained by observing the decrease of the composites weight percentage (TGA); after reanalysis, the difference between actual CFs volume fraction and designed CFs volume fraction.
Due to the possible loss of CFs during the melt mixing process, some differences were found between the actual CF volume fractions in the composites and the designed CF volume fractions. These differences are explicitly stated in Figure 4 and are indicated with horizontal error bars in Figure 5.
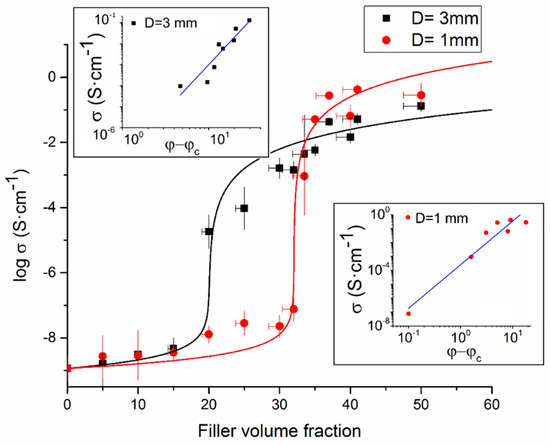
Figure 5.
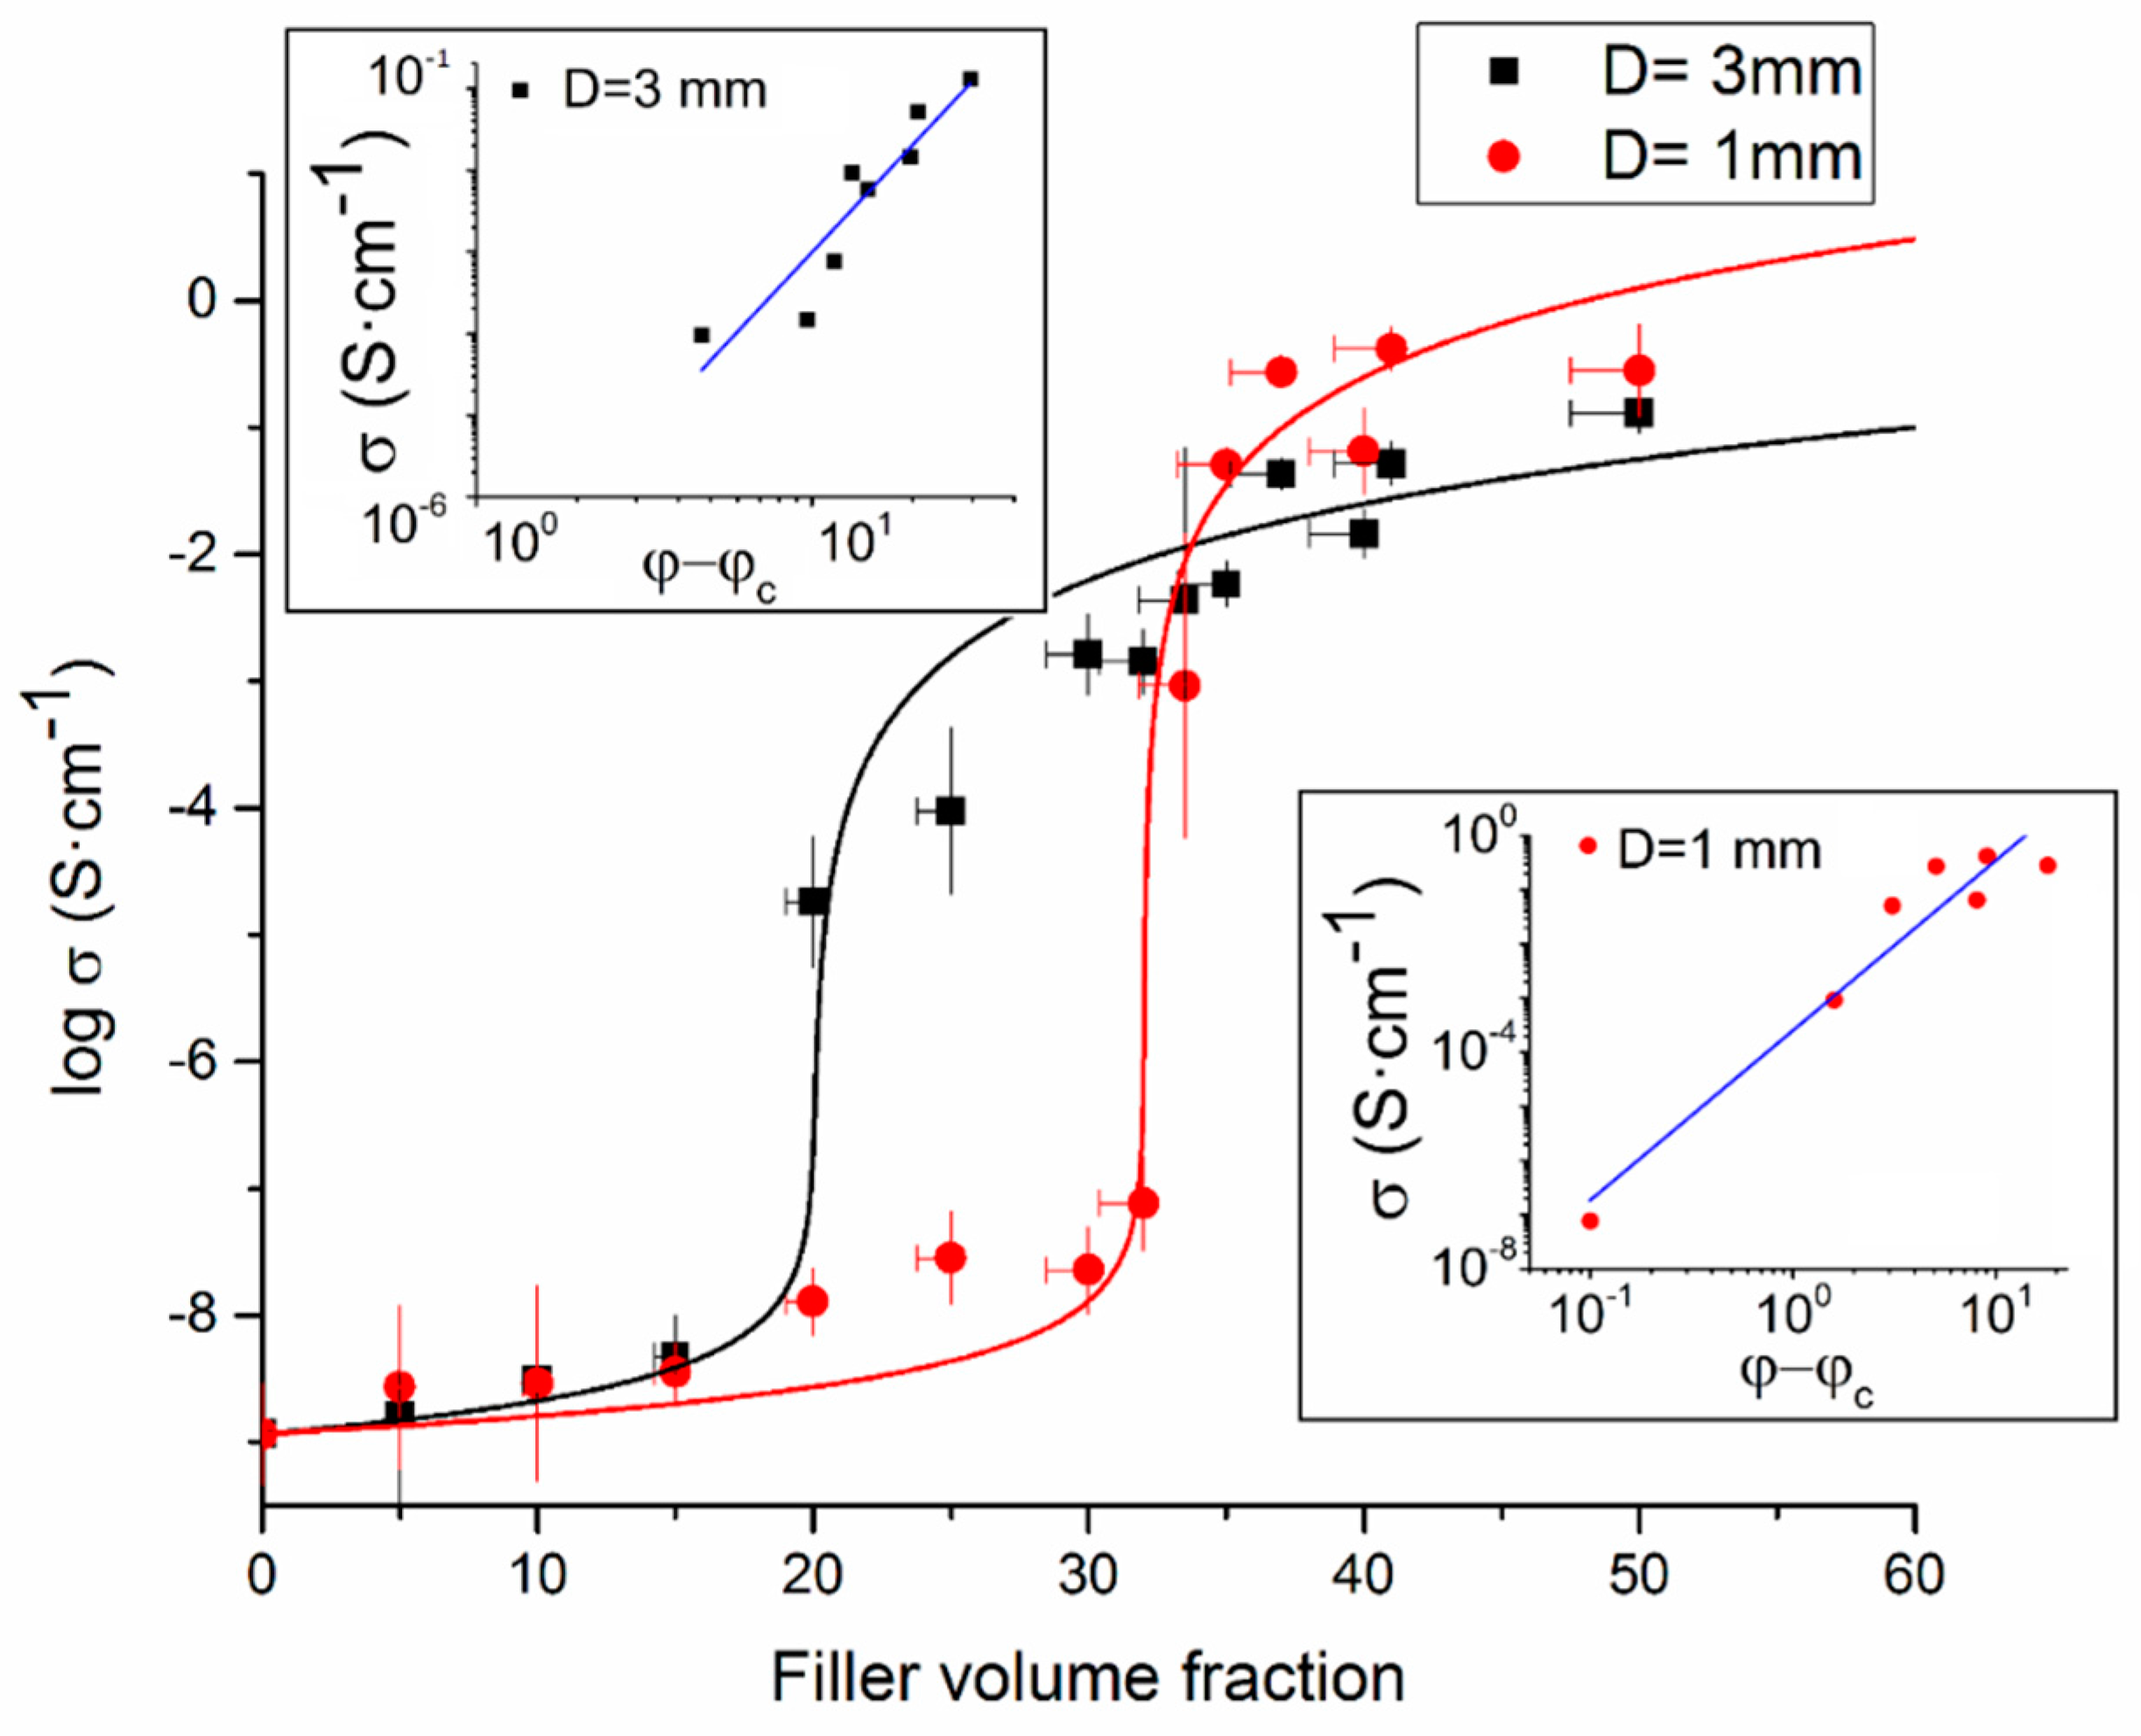
The logarithm of the electrical conductivity vs. CF volume fraction for extruded filaments with 1-mm diameter and 3-mm diameter, respectively. The solid lines show the best fit with the McLachlan equation (Equation (2)). The two insets illustrate the linear fit using (Equation (1)) for the 1-mm diameter and 3-mm diameter, respectively.
3.2. Electrical Conductivity of the Extruded Filaments
Figure 5 shows the logarithm of the conductivity plotted versus the CF volume fraction. The conductivities of extruded 1-mm and 3-mm diameter filaments are presented with red circles and black squares, respectively. Each data point corresponds the average of 20 measurements, with standard deviations shown with vertical error bars. Horizontal error bars indicate the uncertainty in filler fraction. The conductivity of pure PMMA was measured to 1.16 × 10⁻⁹ S/cm. The percolation thresholds of the composites were obtained by fitting the experimental data with the GEM equation (Equation (2)), as shown in Figure 5.
The percolation thresholds φc, as obtained with the GEM equation, became (D = 1 mm) = 32.0 ± 5.9 vol. %, and (D = 3 mm) = 20.0 ± 2.5 vol. % for the D ≅ 1 mm and the D ≅ 3 mm samples, respectively. When instead the classical percolation theory (Equation (1) was used to determine the percolation thresholds, the values became (D = 1 mm) = 31.9 vol. % and (D = 3 mm) = 20.3 vol. %, values that are consistent with the corresponding data obtained from the GEM equation. Illustrations of the Equation (1) fitting are presented in the insets of Figure 5.
During the extrusion process, the 1-mm diameter filaments encountered higher shear rates ((D = 1 mm) = 92.16 s−1) and thus larger shear deformations. Therefore, a greater orientation of the CFs in the 1 mm extruded filament were induced. The average CF orientation was the only difference between the D = 1 mm and the D = 3 mm systems, because the CF aspect ratio distribution was the same in both structures. The results show that a higher orientation of the CFs leads to a higher percolation threshold. As a consequence, the conductivity of the 1-mm diameter composites is significantly lower than the conductivity of the 3-mm samples in the region between the two percolation thresholds (20–32 vol. %).
The conductivity of the 1-mm specimen rapidly increased 6 magnitudes around the percolation threshold and then quickly reached an almost constant value while the conductivity of the 3-mm specimen only increased 3 magnitudes at the percolation threshold but continued to increase slowly also at higher filler fractions. At about 50 vol. % fibers, the 1-mm and 3-mm specimens approached the same value. These differences and observations can be explained by the “contact model” [20,21], which is generally used for CPCs after reaching the percolation threshold (Equation (6)).
In Equation (6), σc, σm and σf are the conductivities of the composite, the polymer matrix and the conductive fillers, respectively. d = diameter of the fibers, l = average length of the fibers, θ = average angle between the inclination of fibers and the direction of the applied voltage, vf is the volume fraction of the fillers, and X is a factor depending on the contact number of fibers, i.e., the vf. Finally, dc is the diameter of the circle of contact, which depends on the applied voltage.
In this study, the voltage was applied along the extrusion direction and therefore cos2θ increases when the CFs in the CPCs become more oriented. The fibers in the 1-mm specimen were highly oriented (θ ≈ 0 => cos2θ ≈ 1) already at low filler fractions, resulting in a nearly constant cos2θ-term. On the other hand, the fibers of the 3-mm specimen were initially more randomly oriented and the cos2θ value (and thus the conductivity) of the 3-mm samples therefore increased gradually with increasing filler concentration. At very high filler fractions, the fibers were highly oriented in both specimen and therefore the ultimate conductivity values approached each other.
It can finally be noted that when the filler volume fraction is beyond the percolation threshold of both specimens (i.e., higher than 35%), the conductivity of the extruded filaments with a 3-mm diameter is lower than the conductivity of extruded filaments with a 1-mm diameter. The observation that an increased fiber orientation can result in a higher electrical conductivity, assuming that the fibers are aligned with the electric field, is consistent with previous studies [16,17,18]. In order to take all these morphology-related features into account, a novel approach was proposed in the next section.
3.3. A Novel Explanation Model with a Supporting Morphological Study
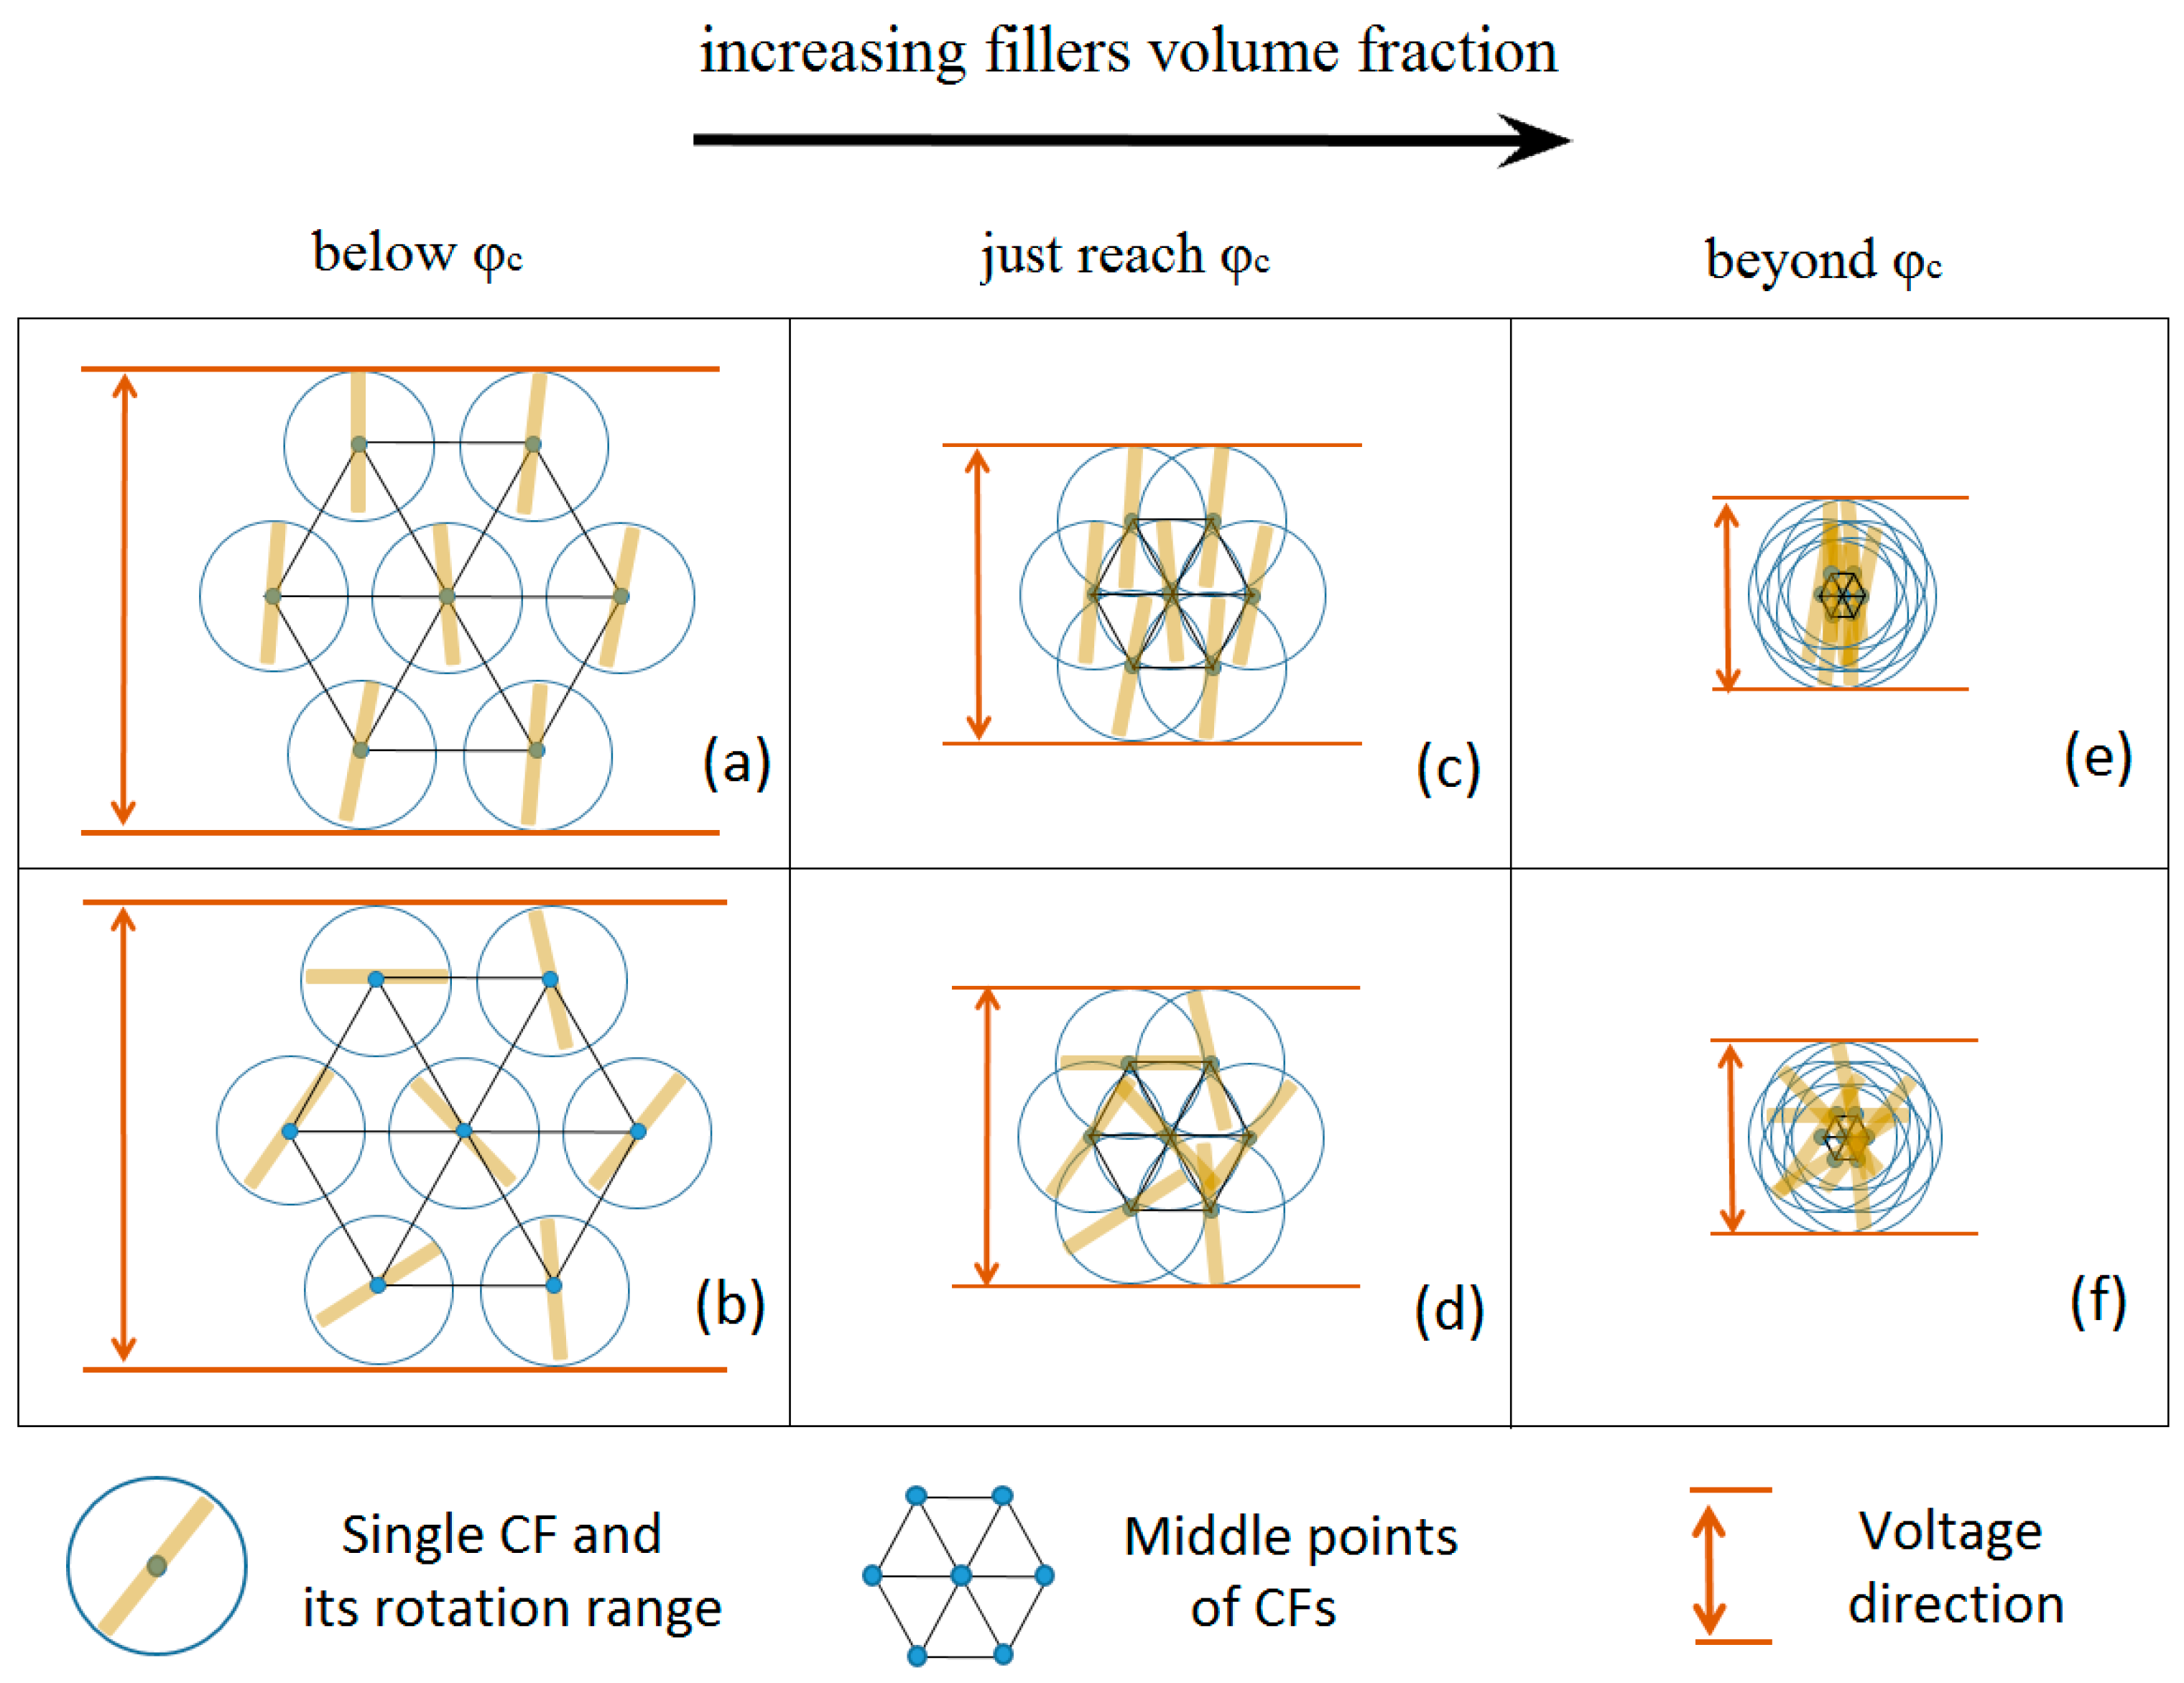
The explanation of the contradiction that the 1-mm specimen sometimes have higher and lower conductivity values than the corresponding 3-mm specimen, which presumably lies in the volume fraction of fillers. Figure 6 is a schematic interpretation of the relationship between conductivity, filler orientation and filler volume fraction. Suppose that the midpoints of the CFs are fixed and that the independent CFs can only rotate around their midpoints in a 2-D system. The rotation range of each single CF is a circle, which is in consistency with the excluded volume concept from Balberg [11]. The applied electric field is directed from the top to the bottom of the figures.
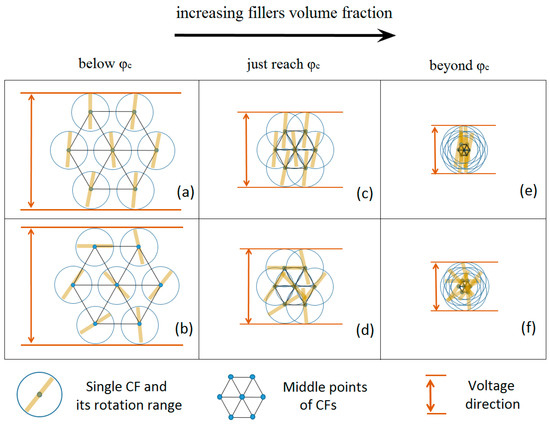
Figure 6.
Schematic interpretation of conductive polymer composites (CPCs) with highly oriented CFs (a,c,e) and CPCs with randomly dispersed CFs (b,d,f). The structure of inner CFs are shown below percolation threshold (a,b), just reach percolation threshold (c,d) and far beyond percolation threshold (e,f).
The close packing of the circles corresponds to the volume fraction just below the percolation threshold in the limit when the CFs still cannot contact each other. Under this condition, no difference is found between composites produced at higher shear rate (i.e., with more oriented fillers), and composites produced at lower shear rate (i.e., with less oriented fillers). The two cases are illustrated by the D ≅ 1 mm (Figure 6a) and D ≅ 3 mm (Figure 6b) samples in this study.
Increasing the volume fraction of the CFs can be considered as proportionally reducing the size of the hexagon formed by the middle points of the CFs. The overlapping portion between the CFs in Figure 6 can be explained by the “soft-shell/hard-core” structure of the conducting CFs [6]. In this work and in our previous study [10], the CFs were well-aligned within the composites due to the extrusion process and there were only small angles between the CFs, which reduced the possibility for CFs to contact each other (Figure 6c). However, when the CFs are rotated (Figure 6d), the percolation threshold is reached and the conductivity consequently increases. This phenomenon explains the lower conductivity of the D ≅ 1 mm composite filaments, which have more highly oriented CFs, in the 20–35 vol. % range of Figure 5.
When the CF volume filler fractions increases beyond the percolation thresholds, both CPCs become conductive. The conductivity along the CFs is however higher than between the contact points between CFs. Since there are more contact points in the conductive network formed by randomly dispersed CFs (Figure 6f) than in the network formed by oriented and nearly parallel CFs (Figure 6e), the latter system is expected to have a higher conductivity, assuming that the electric field is parallel with the fiber direction. This explains why the (highly oriented) D ≅ 1 mm samples are more conductive that the (less oriented) D ≅ 3 mm samples at high CF volume fractions (>35 vol. %), as observed in Figure 5. The above proposed explanation model is expected to be valid on all length scales as long as the fibers are stiff and approximately nondeformable.
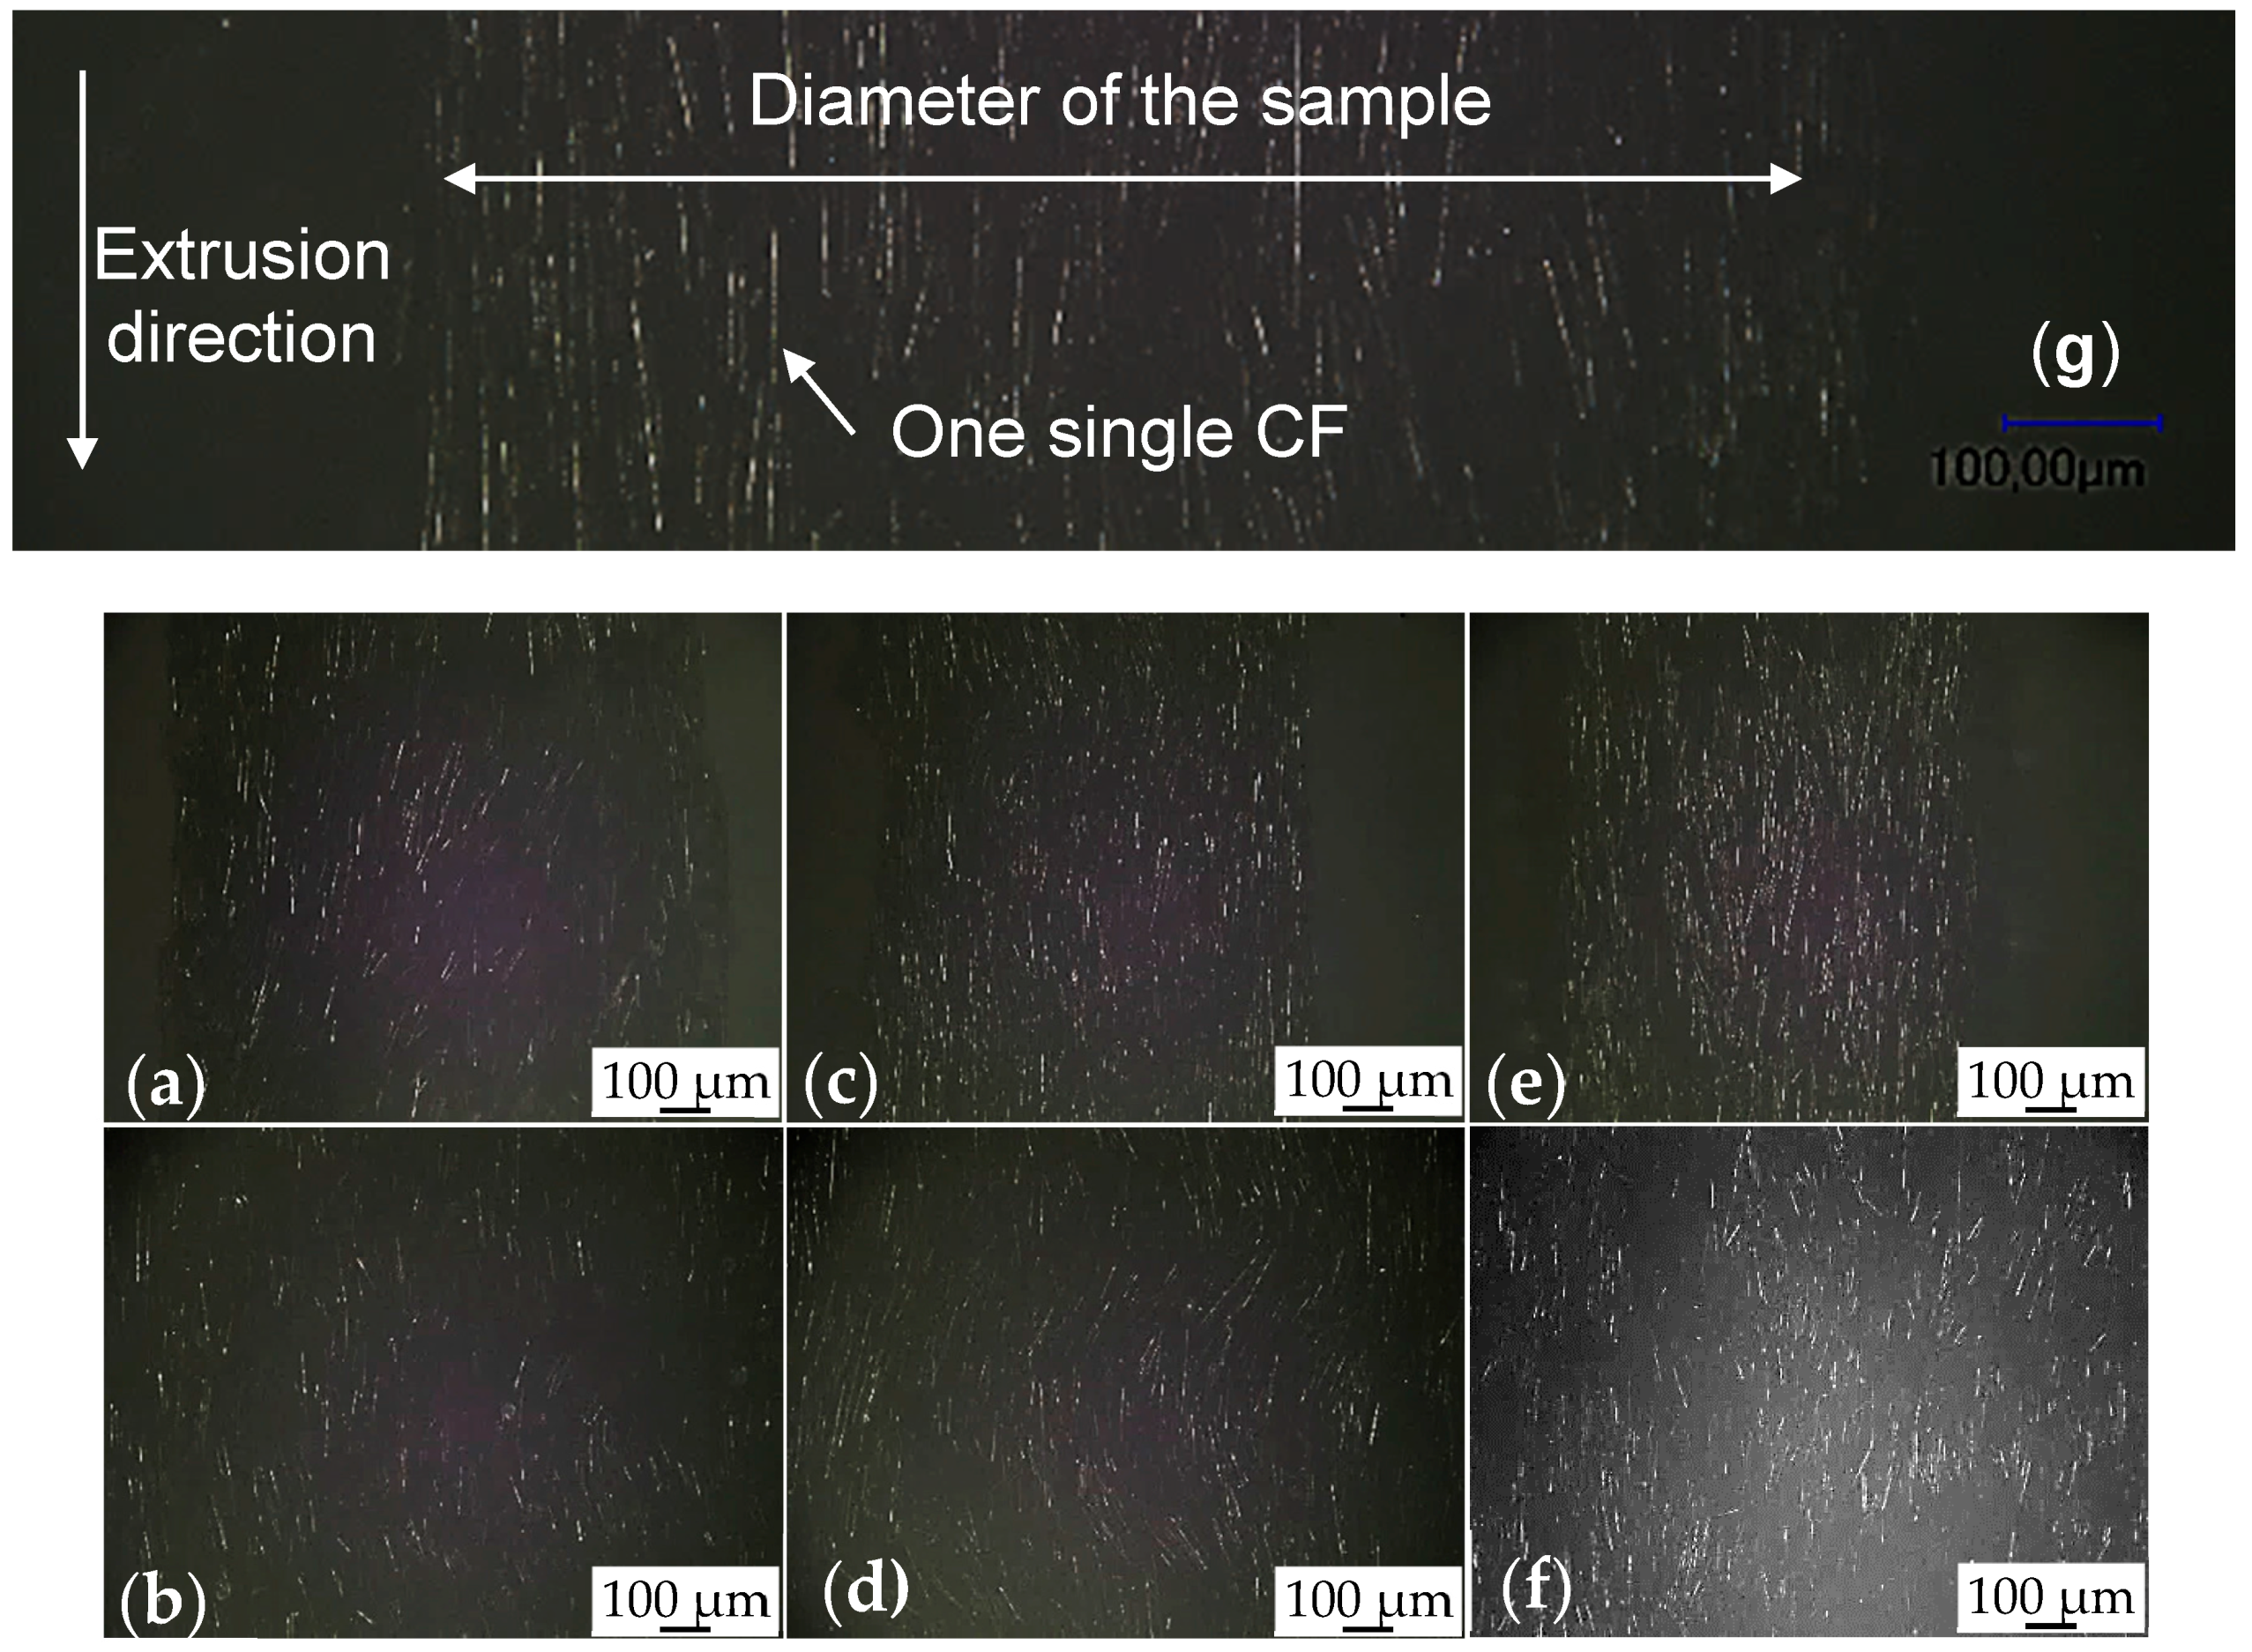
The morphology of the CFs in the composites is show in Figure 7g, where the extrusion direction and a single CF were marked. Micrographs showing typical fiber orientations in extruded composite filaments with 10, 30 and 50 vol. %. CFs are shown in Figure 7a–f in order to present the complete sample. The upper row corresponds to (the presumably more oriented) samples with D ≅ 1 mm and the lower to (the presumably less oriented) samples with D ≅ 3 mm. A slightly reduction of the fiber diameter can be found from Figure 7a,c,e, as the filler volume fraction increases. It can be observed and confirmed that the D ≅ 3 mm samples are, as expected, more isotropic than the 1 mm samples. It can also be noted that the orientation increases with filler fraction, which explains why the conductivities of both composite systems approaches each other at very high filler fractions.
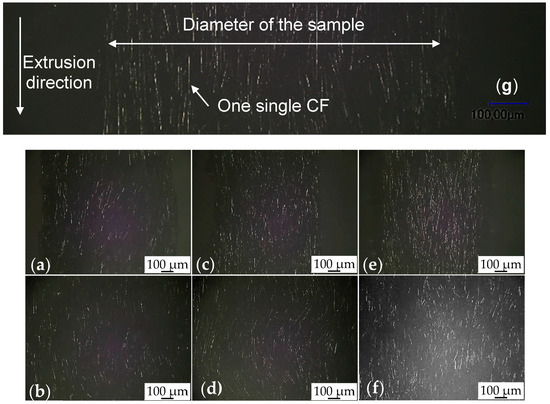
Figure 7.
Morphological study of the extruded composites filaments with 1-mm diameter (g,a,c,e) and with 3-mm diameter (b,d,f). The structure of inner CFs are shown. Below percolation threshold with 10 vol. % CFs (a,b), just reach percolation threshold with 30 vol. % CFs (c,d) and far beyond percolation threshold with 50 vol. % CFs (e,f).
4. Conclusions
In this work, the electrical conductivity of extruded CF/PMMA composite filaments with 1-mm and 3-mm diameter were investigated. The electrical conductivity measurements were conducted for 0–50 vol. % CF/PMMA composites with different fiber orientations, but all other properties held constant. The percolation threshold was 20.0 ± 2.5 vol. % for (slightly oriented) composites with 3-mm diameter and 32.0 ± 5.9 vol. % for (highly oriented) composites with 1-mm diameter. Below 32 vol. % fibers, the conductivity of the 3 mm composites was clearly higher than the 1-mm composites, but the opposite was observed above 32 vol. %. This apparently strange phenomenon was readily explained by the difference in average fiber orientation observed from micrographs. A novel explanation was finally developed that could satisfactorily summarize how the conductivity of fiber composites is influenced by fiber orientation and filler fraction, and thus explain the experimental conductivity results.
Acknowledgments
Guanda Yang and Yijing Qin were thanked for their instructive ideas and kind modification of this paper.
Author Contributions
M.Q. conceived the experiments, wrote the paper; F. N. analyzed the data, improved the paper quality; D.W.S. proposed the idea, designed the experiments, and made modifications of detail.
Conflicts of Interest
The authors declare no conflict of interest.
References
- Nilsson, F.; Unge, M. Conductivity simulations of field-grading composites. J. Phys. D Appl. Phys. 2016, 49, 335303. [Google Scholar] [CrossRef]
- Kádár, R.; Abbasi, M.; Figuli, R.; Rigdahl, M.; Wilhelm, M. Linear and Nonlinear Rheology Combined with Dielectric Spectroscopy of Hybrid Polymer Nanocomposites for Semiconductive Applications. Nanomaterials 2017, 7, 23. [Google Scholar] [CrossRef] [PubMed]
- Gaska, K.; Xu, X.; Gubanski, S.; Kádár, R. Electrical, Mechanical, and Thermal Properties of LDPE Graphene Nanoplatelets Composites Produced by Means of Melt Extrusion Process. Polymers 2017, 9, 11. [Google Scholar] [CrossRef]
- Rousakis, T.C.; Kouravelou, K.B.; Karachalios, T.K. Effects of carbon nanotube enrichment of epoxy resins on hybrid FRP–FR confinement of concrete. Compos. Part B Eng. 2014, 57, 210–218. [Google Scholar] [CrossRef]
- Gong, J.; Yang, H.; Yang, P. Investigation on field emission properties of N-doped graphene-carbon nanotube composites. Compos. Part B Eng. 2015, 75, 250–255. [Google Scholar] [CrossRef]
- Nilsson, F.; Krueckel, J.; Schubert, D.W.; Chen, F.; Unge, M.; Gedde, U.W.; Hedenqvist, M.S. Simulating the effective electric conductivity of polymer composites with high aspect ratio fillers. Compos. Sci. Technol. 2016, 132, 16–23. [Google Scholar] [CrossRef]
- Qu, M.; Nilsson, F.; Qin, Y.; Yang, G.; Pan, Y.; Liu, X.; Rodriguez, G.H.; Chen, J.; Zhang, C.; Schubert, D.W. Electrical conductivity and mechanical properties of melt-spun ternary composites comprising PMMA, carbon fibers and carbon black. Compos. Sci. Technol. 2017, 150, 24–31. [Google Scholar] [CrossRef]
- Sahimi, M. Applications of Percolation Theory; CRC Press: Boca Raton, FL, USA, 1994. [Google Scholar]
- McLachlan, D.S.; Sauti, G. The AC and DC conductivity of nanocomposites. J. Nanomater. 2007, 2007, 30389. [Google Scholar] [CrossRef]
- Qu, M.; Schubert, D.W. Conductivity of melt spun PMMA composites with aligned carbon fibers. Compos. Sci. Technol. 2016, 136, 111–118. [Google Scholar] [CrossRef]
- Chekanov, Y.; Ohnogi, R.; Asai, S.; Sumita, M. Positive temperature coefficient effect of epoxy resin filled with short carbon fibers. Polym. J. 1998, 30, 381–387. [Google Scholar] [CrossRef]
- Jing, X.; Zhao, W.; Lan, L. The effect of particle size on electric conducting percolation threshold in polymer/conducting particle composites. J. Mater. Sci. Lett. 2000, 19, 377–379. [Google Scholar] [CrossRef]
- Wang, X. High Field nonlinear Resistive Silicon Carbide, Zinc Oxide-Based Silicone Rubber Composites for Cable Field Grading: Mechanism(s), Properties and Filler Treatment. Ph.D. Dissertation, Rensselaer Polytechnic Institute, Troy, NY, USA, 2009. [Google Scholar]
- Wåhlander, M.; Nilsson, F.; Andersson, R.L.; Carlmark, A.; Hillborg, H.; Malmström, E. Reduced and Surface-Modified Graphene Oxide with Nonlinear Resistivity. Macromol. Rapid Commun. 2017, 38. [Google Scholar] [CrossRef] [PubMed]
- Li, J.; Ma, P.C.; Chow, W.S.; To, C.K.; Tang, B.Z.; Kim, J.K. Correlations between percolation threshold, dispersion state, and aspect ratio of carbon nanotubes. Adv. Funct. Mater. 2007, 17, 3207–3215. [Google Scholar] [CrossRef]
- King, J.A.; Keith, J.M.; Smith, R.C.; Morrison, F.A. Electrical conductivity and rheology of carbon fiber/liquid crystal polymer composites. Polym. Compos. 2007, 28, 168–174. [Google Scholar] [CrossRef]
- Fan, Z.; Advani, S.G. Characterization of orientation state of carbon nanotubes in shear flow. Polymer 2005, 46, 5232–5240. [Google Scholar] [CrossRef]
- Darby, R. Chemical Engineering Fluid Mechanics, 2nd ed.; CRC Press: Boca Raton, FL, USA, 2001; p. 64. [Google Scholar]
- Balberg, I.; Anderson, C.H.; Alexander, S.; Wagner, N. Excluded volume and its relation to the onset of percolation. Phys. Rev. B 1984, 30, 3933. [Google Scholar] [CrossRef]
- Tsotra, P.; Friedrich, K. Electrical and mechanical properties of functionally graded epoxy-resin/carbon fibre composites. Compos. Part A: Appl. Sci. Manuf. 2003, 34, 75–82. [Google Scholar] [CrossRef]
- Taipalus, R.; Harmia, T.; Zhang, M.Q.; Friedrich, K. The electrical conductivity of carbon-fibre-reinforced polypropylene/polyaniline complex-blends: Experimental characterisation and modelling. Compos. Sci. Technol. 2001, 61, 801–814. [Google Scholar] [CrossRef]
© 2018 by the authors. Licensee MDPI, Basel, Switzerland. This article is an open access article distributed under the terms and conditions of the Creative Commons Attribution (CC BY) license (http://creativecommons.org/licenses/by/4.0/).

