1. Introduction
Carotenoids are lipophilic pigments of a yellow to red color, produced by many species of plants, fungi, bacteria, and algae. Generally, they are tetraterpenoid compounds with a conjugated double bond system which promotes their characteristic intensive colors and antioxidant properties. There are approximately 800 different known carotenoids. The high variability in structures is possible through modifications of arrangements derived from their basic linear structure. Hydrogenation, dehydrogenation, cyclization, chain lengthening or shortening, and the inclusion of oxygenated radicals give rise to various conformations and properties. The presence of functional groups determines their polarity and solubility in different solvents. In nature, carotenoids all-
E-configuration-, which is more stable, and, to a lesser extent, in the (
Z)-conformation [
1,
2].
Carotenoids are known due to their high antioxidant potential and provitamin A activity, and are related to the prevention of neurodegenerative and cardiovascular diseases, macular degeneration, cancer, and diabetes mellitus [
3,
4,
5,
6]. Only carotenoids with an unsubstituted β-ring with an 11-carbon polyene chain are vitamin A precursors, such as β-carotene, β-cryptoxanthin, and
α-carotene [
7].
Considering their health importance, the possibility of using carotenoids as food coloring turns their application into an excellent appeal for consumers, increasingly concerned about a healthy diet [
8] and the safety of synthetic food colorants [
9]. However, due to highly unsaturated chains, carotenoids are prone to isomerization or oxidation, promoted by exposure to light, high temperature, oxygen, and acidic conditions [
10]. Both chemical instability and the poor dispersibility of carotenoids in aqueous systems restrict their incorporation in food, mainly when faced with adverse processing and storage steps. Nanoencapsulation is a promising approach for the entrapment of bioactive compounds due to improving solubility, increasing bioavailability, and protecting from environmental conditions, such as exposure to light, high temperature, and oxidation [
2,
11]. Furthermore, the smaller particle sizes given by nanoencapsulation reduce the tendency to aggregation and gravitational separation [
12], which becomes interesting for application in beverages and other foods that are expected to be stable during storage.
A wide range of encapsulation systems have been conducted to protect carotenoids and other phytochemicals [
13]. Some of these techniques are: solid lipid nanoparticle [
14], nanoencapsulation by electrospinning [
15], multilayer emulsions [
16], coacervation [
17], co-crystallization [
18] and micelles [
19]. Among the available techniques, emulsification is a relatively simple and economical method for encapsulation. An emulsion based system is obtained by solubilizing lipophilic compounds in an oil phase, followed by homogenization in an aqueous phase containing an emulsifier [
20]. The addition of proteins, carbohydrates, and other biopolymers as encapsulating agents can promote the formation of particles with increased stability [
14,
16], besides producing powders of improved quality with greater water dispersibility after freeze-drying. The development of powder forms is convenient for commercial purposes to favor handling, storage, and transportation. Moreover, it expands the possibility of application in different products, in aqueous or powder matrices [
21,
22].
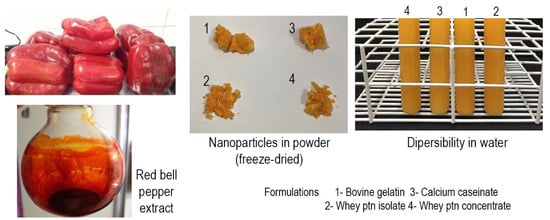
Prioritizing the development of formulations containing natural and GRAS (generally recognized as safe) ingredients, four different encapsulating agents were chosen: whey protein concentrate (WPC), whey protein isolate (WPI), calcium caseinate (CC), and bovine gelatin (BG), besides soy lecithin as the emulsifier.
Due to their relatively low cost and emulsifying properties, the above are commonly used by the food industry to produce emulsions, foams, or to act as a gelling agent. Whey proteins are mainly composed of the globular proteins β-globulin (50%), α-lactalbumin (20%), bovine serum albumin, and immunoglobulins. β-globulin is a small protein (18.3 kDa) with an amphiphilic character and a high hydrophobic cavity formed due to its conformation. Caseins are the major proteins in milk, divided into α1, α2, β, and k-casein, with an isoelectric point around 4.6. Usually, caseinates improve solubility in water, and are used as an emulsifier, thickener, and gelling agent. Gelatin is an animal protein derived from skin, bones, and connective tissues. Gelatin is known due to its amphiphilic and nontoxic nature, biodegradability, water retention, and film formation ability [
23,
24].
Red bell pepper extract was used due to its intense coloration and rich carotenoid profile and composition of mainly β-carotene, β-cryptoxanthin, and capsanthin [
25]. Furthermore, bell peppers (
Capsicum annum L.) are produced on a large scale worldwide [
26].
The present investigation aimed to produce powder nanoparticles of red bell pepper extract, soy lecithin, and, separately, four different wall materials by an emulsification technique followed by freeze-drying, aiming to investigate the effect of these systems on the preservation and water dispersibility of carotenoids, enabling application as a food colorant.
2. Materials and Methods
2.1. Materials
Ripe red bell peppers were purchased from a market in Rio de Janeiro. Whey protein isolate, whey protein concentrate, and calcium caseinate were obtained from Alibra® (Campinas, SP, Brazil). Bovine gelatin (Type B) was purchased from Sigma-Aldrich® (St. Louis, MO, USA)
2.2. Pigment Extraction from Red Bell Pepper
The extract was obtained according to our previous study [
27]. Red bell peppers were sanitized and ground in an industrial blender. The extraction of the pigments was conducted by maceration in a solvent mixture of distilled water and ethyl alcohol (1:9,
v/
v) until exhaustion. The ethanolic phase was partitioned in hexane (1:1,
v/
v) and concentrated using a rotatory evaporator under 40 °C. All procedures were conducted in the dark.
2.3. Preparation of Nanoparticles
Four wall materials were used to identify the best performance for encapsulation and smaller particle size: calcium caseinate (CC), whey protein concentrate (WPC), whey protein isolate (WPI), and bovine gelatine (BG). Nanoparticles were obtained by O/W emulsification with subsequent freeze-drying.
Initially, 0.1 g of red pepper extract was solubilized in 0.9 g of soybean oil (oil phase) under magnetic stirring for 10 min. Two aqueous phases (AP) were prepared, AP1 (100 mL) containing 1 g of soy lecithin (1% w/v), and AP2 containing 1 g of CC, WPI, WPC, or BG (1% w/v) solubilized in 100 mL each of ultrapure water under magnetic stirring. All encapsulating agents were solubilized at room temperature, except bovine gelatin prepared at 40 °C/1 h.
The oil phase was homogenized to the AP1 using an ultradisperser (Ultra Turrax, T25, IKA®, Staufen, Germany) at 10,000 rpm for 5 min. Subsequently, the emulsion obtained was added to AP2 at 12,000 rpm while stirring for 5 min. All emulsions were produced in triplicate, frozen at −18 °C, and freeze-dried at −60 °C and pressure of 76 µmHg (L108, Liotop, Liobras®, São Carlos, SP, Brazil).
2.4. Characterization of Nanoparticles
2.4.1. HPLC Analysis
Red bell pepper extract (RBPE) and formulations of whey protein isolate (EWPI), whey protein concentrate (EWPC), calcium caseinate (ECC), and bovine gelatin (EBG) were analyzed by HPLC-DAD to determine β-carotene concentration.
A total of 60 mg of each formulation was submitted to subsequent extractions with hexane until exhaustion, to recover encapsulated extract. The samples were sonicated in an ultrasound bath for 10 min, followed by centrifugation at 4 °C and 10,000 rpm. The supernatant was recovered and evaporated in the rotatory evaporator under 40 °C. All samples were solubilized in HPLC grade acetone with 0.1% of butylated hydroxytoluene (BHT) and filtered in a 0.22 µm membrane.
HPLC (Shimadzu®, Kyoto, Japan) system presented an automatic injector (SIL-20AC), quaternary analytical pump (LC-20AT), degassing unit (DGU-20A), column oven (CTO-20AC), and diode array detector (SPD-M20A), controlled by LC Solution software. The column used was a C18 (Shimadzu® Shim-pack VP-ODS), 250 × 4.6 mm, 5 µm. The mobile phase consisted of a gradient elution with methanol (solvent A) and methyl tert-butyl ether (solvent B), as follows: 0–30% B from 0 to 2.5 min, 30–40% B from 2.5 to 15 min, 40% B from 15 to 18 min, 40–30% B from 18–23 min, 30–0% B from 23–25 min and 0% B from 25 to 28 min. The volume injection was 15 µL and a flow rate of 0.7 mL·min−1.
β-carotene identification was based on the UV-vis retention time and absorption spectrum, compared with the β-carotene standard (Sigma Aldrich®, St. Louis, MO, USA). A calibration curve of the standard was prepared previously to quantify β-carotene in the samples.
2.4.2. Determination of Encapsulation Efficiency (EE)
Formulations were submitted to repeated extractions, according to Falcão et al. [
28], to quantify the red bell pepper extract incorporated in the particles. A total of 10 mg of each sample with 2 mL of hexane were sonicated in an ultrasound bath for 10 min. Subsequently, samples were centrifuged at 9000 rpm for 5 min to separate the supernatant containing the extract. These steps were repeated until complete exhaustion of color. Supernatants were adjusted to 10 mL with hexane and then analyzed in a spectrophotometer on a wavelength of 468 nm. Absorbance results were compared with a standard curve obtained previously using red bell pepper extract, and an equation was applied to determine encapsulation efficiency: EE (%) = 100 × (measured RBPE content/theoretical RBPE content).
2.4.3. Fourier Transform Infrared Spectroscopy (FTIR)
Fourier transform infrared spectroscopic (FTIR) spectra of encapsulating agents (WPI, WPC, CC, BG), red bell pepper extract, soy lecithin, and formulations were obtained in the range of 400 to 4000 cm−1 using spectrometer IRTRACER-100 (Shimadzu®, Kyoto, Japan) with attenuated total reflection (ATR) and a resolution of 0.01 cm−1.
2.4.4. Dynamic Light Scattering (DLS) and Zeta Potential
Particle size, polydispersity index, and zeta potential of nanoparticles were measured with ZetaSizer Nano ZS (Malvern Instruments Ltd., Malvern, UK). A total of 10 mg of each sample was dispersed in 50 mL of ultrapure water and homogenized in a shaker. The samples were analyzed in a folded capillary zeta cell. Experiments were performed in triplicate.
2.4.5. Atomic Force Microscopy (AFM)
Encapsulated surfaces were evaluated by atomic force microscopy using AFM 5100N (Hitachi®, Tokyo, Japan), tip NSG01 (185 kHz frequency) and AFM 5100 II software. The samples were dispersed (0.5 mg·mL−1) in ultrapure water and homogenized in an ultrasound bath for 5 min. An aliquot was dripped on a mica slide and dried at room temperature.
2.4.6. Thermogravimetric Analysis (TGA)
Thermogravimetric analysis was performed using a thermal gravimetric analyzer (Netzsch STA 409 PC/PG, Selb, Germany). Samples were heated from 25 to 400 °C at a heating rate of 10 °C/min under a nitrogen flow of 20 mL/min.
2.4.7. Dispersion Stability
Dispersion stability was performed according to Busch et al. [
29] with modifications. Ten mL solutions of each formulation (10 mg/mL) were prepared using distilled water and arranged in test tubes, remaining at rest for 24 h (T1) and 48 h (T2) at 25 °C and protected from light. An aliquot of 5 mL was taken from each tube and disposed of in previously weighed Petri dishes. Samples were oven dried at 105 °C for 4 h and weighed. Results were determined as milligrams of sample dispersed per mL of water. The experiment was performed in triplicate.
2.4.8. Color Analysis
A total of 20 mg of each sample was dispersed in 20 mL of distilled water and homogenized in a shaker for 10 min to evaluate the color of samples. Analysis was performed in triplicate using a spectrophotometer Colorview 9000 (BYK Gardner®, Columbia, SC, USA). Results were expressed in CIELab coordinates.
2.5. Statistical Analysis
Yield results, incorporation efficiencies, β-carotene content quantification, color analysis, and dispersion stability values were statistically evaluated by analysis of variance (ANOVA one way), considering p < 0.05 to determine significant differences between means. The Tukey test was used to compare averages with significant differences. Statistical analyses were performed using GraphPad Prism version 5.01 (GraphPad Software Inc., San Diego, CA, USA).
3. Results and Discussion
3.1. HPLC Analysis of Encapsulated Carotenoids and Red Bell Pepper Extract
HPLC analysis was conducted for red bell pepper (RBPE) extract crude and RBPE extracted from formulations (EWPC, EWPI, ECC, and EBG), to verify possible differences in carotenoid profile among the formulations obtained. The identification of β-carotene in the samples was confirmed by comparing the absorption spectrum at maximum wavelengths of 425, 451, and 476 nm and retention time at 21 min (
Figure 1). The line equation obtained for the β-carotene calibration curve was y = 2 × 10
7 + 29,521 (R
2 = 0.993).
Respectively, it was obtained 1.63 ± 0.17mg/g, 1.99 ± 0.16 mg/g, 1.71 ± 0.47 mg/g, 1.40 ± 0.45 mg/g for ECC, EWPI, EBG and EWPC. Besides slight variation, there was no significant difference (p > 0.05) between all the samples, which indicates that all systems could retain β-carotene similarly. For RBPE, it was obtained 3.15 ± 0.12 mg/g of β-carotene, which differed significantly from the other samples, indicating that the steps of the encapsulation process led to the loss of carotenoids. Although the analyses were performed under controlled temperature and light conditions, nanoparticles were submitted to different procedures, such as the emulsion process, freeze-drying, extraction, and evaporation, which may contribute to losses in carotenoid content.
From a qualitative perspective, chromatograms (
Figure 1) showed similar profiles between the formulations and RBPE, except small displacements and the junction of the first two peaks in RBPE. These results agree with those of Zanoni [
30], who observed the encapsulation of astaxanthin in WPC nanoparticles. The author reported no differences between the carotenoid profiles obtained by HPLC between the extract samples before and after encapsulation. Mai et al. [
31] also found similarities between free gac oil fruit profiles and those encapsulated in solid lipid nanoparticles. However, substantial losses were observed by calculating the peak area, indicating that the process of obtaining the particles may have caused these losses, as in the present study.
A greater separation would be obtained through saponification, removing the lipids and chlorophylls associated with carotenoids [
32]. Nevertheless, this procedure leads to a significant loss in other carotenoids, interfering with the result, and was not feasible with the incorporated extracts due to the reduced sample quantity. However, it can be noted that, in the formulations, the first peaks appeared separated and with better resolution. These samples passed through additional steps that had not occurred with red bell pepper extract, such as emulsification, freeze-drying, and sonication, which may interfere with the final profile.
Regarding the RBPE chromatogram, 14 peaks were presented in the characteristic absorption spectra of most carotenoids, which absorb maximally at three wavelengths or one maximum wavelength, in the case of apocarotenols and keto carotenoids [
33]. Generally, the first peaks found in the red bell pepper extracts are related to the keto carotenoids capsanthin and capsorubin, characteristic of the Capsicum species and which provide the red color. Other carotenoids commonly present in red bell peppers are β-cryptoxanthin, β-carotene, violaxanthin, lutein, zeaxanthin [
34]. In our previous studies, we identified capsanthin, capsorubin, β-cryptoxanthin, β-carotene, 13 and 9-cis-β-carotene [
25,
27]. Profile changes in red bell pepper extract occur due to agroclimatic conditions, maturation stage, and variety [
35].
3.2. Determination of Encapsulation Efficiency
In order to determine the encapsulation efficiency (EE) of the red bell pepper extract, its total content in each powder sample was evaluated and compared with the theoretical incorporated amount. High encapsulation efficiency is pursued to reduce costs, deliver higher amounts of bioactivity [
36], and obtain a formulation with greater coloring capacity.
After freeze-drying, samples were weighted to calculate yield. Percent yields of the nanoparticles were obtained by comparing the mass of each obtained concerning the sum of the masses of lecithin, encapsulating agent, and RBPE used initially. Results showed no significant differences (p > 0.05) between the four formulations, with yields of 98.53 ± 1.26 (ECC), 99.86 ± 0.20 (EWPI), 99.75 ± 0.24 (EWPC), and 99.88±0.11 (EBG).
Concerning encapsulation efficiency, the obtained averages were 54.0% ± 2.0 (ECC), 57.6% ± 1.6 (EWPI), 56.6% ± 5.0 (EWPC), and 64.0% ± 2.3 (EBG), with a significant difference only between formulations based on CC and BG, indicating that the performance of the four materials was similar. Despite the high yield obtained, the encapsulation efficiency was considered median for all samples. These results may be related to the small amount of extract used in the formulation production, compared with the higher masses of the other components. Thus, extract loss was not significant in the yield results. Red bell pepper extract has a high coloring power, requiring the application of small amounts to achieve the desired color. Regarding this, losses during the emulsion production or the freeze-drying process could negatively impact the absorbance and, consequently, encapsulation efficiency results.
These findings confirm the results obtained in the HPLC analyses, which revealed significant differences between encapsulated and RBPE quantification.
Despite these results, no extract precipitation was observed in the emulsions or the freeze dried powders. Moreover, the quantification of the β-carotene and chromatogram profile previously demonstrated no prominent differences in performance among nanoparticles. Although different wall materials have been used, the procedure for obtaining the nanoparticles seems to have been the main reason for affecting the maintenance of the carotenoid content.
According to Medeiros et al. [
37], the best encapsulation efficiency of Cantaloupe carotenoids was of porcine gelatine nanoparticles (90%), followed by whey protein concentrate (77%) and whey protein isolate nanoparticles (58%), with only the last one being similar to the results of the present study. According to the authors, Tween 20 as a surfactant in both aqueous phases can improve encapsulation efficiency, despite the resembling technique. Concerning this, other methods could be employed to enhance encapsulation efficiency. For instance, changes in the proportion of emulsifier, encapsulant, and extract can increase the encapsulation efficiency, as reported by Bassijeh et al. [
38] with astaxanthin microparticles of WPI and Persian gum.
3.3. Fourier Transform Infrared Spectroscopy
FT-IR analysis is widely used to characterize encapsulated materials, enabling the comparison of the absorption spectra of the red bell pepper extract, encapsulating agents, emulsifiers, and formulations. Evidence of process efficiency can be observed through the attenuation of band absorption intensity for the extract, emergence of new bands, or displacement.
Regarding the spectrum of the red bell pepper extract (
Figure 2), a broad and weak band is observed in the region of 3392 cm
−1, characteristic of hydroxyls (OH), related to the xanthophyll structures present in the extract. Two bands of intense absorption can be observed in the regions 2922 and 2852 cm
−1, referring to the axial deformation of C-H bonds. Another intense absorption band is in the region of 1739 cm
−1, which corresponds to the axial deformation of carbonyls (C = O). Bands located in the 1456 and 1163 cm
−1 refer to angular deformations of C-H bonds, representing the symmetric deformation for methylene (CH
2) and asymmetric deformation for methyl (CH
3), respectively [
39]. RBPE spectrum results followed those found by De Lima Petito et al. [
27] and Gomes et al. [
25].
The absorption spectrum for the soybean lecithin sample showed similarity to the spectrum of RBPE, with small differences in the intensity of the bands and the presence of a very strong band at 1030 cm
−1, referring to the C-O phosphate ester stretch [
39].
Regarding WPI, WPC, CC, and BG, the spectra showed weak bands of approximately 90–95% transmittance, with similar profiles. Prominent bands were observed nearly at 3288, 1635, and 1520 cm
−1 and are related to O-H bonds, and N-H bending is related to amide I and amide II, respectively [
40].
Spectra for the encapsulated samples were very similar. There were format changes and reducing transmittance in bands located at approximately 3200 cm
−1 for all the encapsulated samples, which could indicate the formation of H-bonds or N-H interactions, which is in agreement with Ntohogian et al. [
41]. Regarding the characteristic band of RBPE (1739 cm
−1) and lecithin (1753 cm
−1), no observed increase or attenuation of transmittance intensity was observed, despite a shift in this band occurring at 1741–1743 cm
−1 in all the samples. However, the strong band (36% transmittance) located at 1030 cm
−1 in lecithin appears attenuated in encapsulated spectra, decreased to 60%, besides being dislocated to 1060 cm
−1. In contrast, weak bands observed in proteins spectra (1630–1637, 1520–1550 cm
−1) obtained a decrease in transmittance, from 90–95% to 60–70%. These results possibly suggest the emergence of interactions of the polar regions of the proteins with the phosphate group of soy lecithin [
36] for all the encapsulated samples, proposing that the emulsion-based technique was effective for encapsulation with these wall materials. Similarly, Kaur et al. [
18] reported the presence of all ingredient bands in carotenoid-sucrose encapsulated formulations.
3.4. DLS and Zeta Potential
DLS is the most widely used method to characterize particle size and distribution [
42]. A smaller particle size and monodisperse distribution are desired, indicating higher stability to gravitational separation or aggregation [
43].
The polydispersity index (PDI) is a dimensionless measure used to define whether a system is monodispersed or polydispersed, reflecting the particle size distribution of the formulation. Monodisperse systems present PDI < 0.05, while moderately and highly polydispersed systems present PDI between 0.08 to 0.7 and > 0.7, respectively [
44]. Results demonstrated (
Table 1) that all samples have an average polydispersity, being lower in ECC (0.463), EBG (0.490), and higher in EWPI (0.542), and EWPC (0.648) formulations, which denotes a heterogeneous size distribution.
Z average corresponds to the average particle size by intensity measurement. From this measurement, it is observed that the formulation with the smallest particle size was EWPI with 158 nm, followed by EWPC (209.7 nm), ECC (229.1 nm), and EBG (397.5 nm) (
Table 1). As the samples are polydisperse, it is recommended to verify the percentage size distribution as well as the representation by number. Large particles tend to scatter light intensely, hence, analysis by intensity tends to overestimate the size of particles in heterogeneous populations [
44,
45,
46].
EWPI, followed by EWPC, stands out for the smallest particle size, presenting 62% of their population with 109 nm and 71% with 206 nm, respectively, and 71 nm and 64 nm by numerical analysis. In contrast, the ECC and EBG formulations obtained the largest particle sizes, with 91.4% of their population at 316.5 nm and 95.5% at 672 nm, respectively, and by number, 109 nm and 173 nm (
Table 1 and
Figure 3).
Results indicated that the nanoparticles of EWPI (
Figure 3b) and EWPC (c) presented a better performance for this specific composition and technique. At the same time, ECC (a) and EBG (d) formulations demonstrated the largest particle size and a more heterogeneous distribution profile. Gelatin and caseins present few secondary structures and tend to adsorb as linear polymers. Thereby, their arrangements are more prominent and allow greater interaction with the aqueous phase when compared to globular proteins [
47], which may have contributed to the increase in size. Furthermore, during this analysis, the samples did not pass by filtration, centrifugation, or another method that could select particles, indicating that these results reproduce the conditions of dispersing the samples in an aqueous based system.
Yi et al. [
48] reported average particle sizes of 78 and 90 nm in diameter when using sodium caseinate and WPI to encapsulate β-carotene by the homogenization–evaporation method, similar to the presented results. Møller et al. [
49] demonstrated particle sizes of 136–1190 nm for complexes of norbixin and WPI, with these results being dependent on solution pH. Medeiros et al. [
36] compared porcine gelatin, WPI, and WPC as encapsulating agents for Cantaloupe carotenoid extract in an emulsion-based system, followed by freeze-drying. Results demonstrated the smallest particle size for formulations with porcine gelatin (59 nm), in contrast with the present study. However, the authors conducted the particles crosslinking with formaldehyde, which may explain the contrasting results.
Regarding zeta potential, all samples presented a negative charge and the obtained values were −34.4 ± 1.36 mV (ECC), −33.4 ± 0.92 mV (EWPC), −36.6 ± 1.60 (EWPI) −21.7 ± 1.42 (EBG). Zeta potential magnitude indicates colloidal system stability, with the highest values being related to greater electrostatic repulsion between the particles. Therefore, to be considered a stable system, a suspension may present a zeta potential of more than positive or negative 30 mV [
50]. Compared to the other formulations, EBG presented the lowest zeta potential. This value agrees with the porcine gelatin nanoparticles obtained by Medeiros [
37], although WPI and WPC presented the lowest values in their study.
3.5. Atomic Force Microscopy (AFM)
AFM is an effective technique to characterize nanoparticles’ morphology and confirm particle size and distribution.
Regarding ECC topography (
Figure 4a), spherical particles with a heterogenous size profile can be observed, with 40 to 120 nm particles. In the ECC 3D images, the height of particles shows some particles with no defined form. Regarding EWPC and EWPI (
Figure 4b,c), it also demonstrates a heterogeneous profile, with particles of 30 to 150 nm. However, the presence of numerous and smaller particles can be emphasized. The vibrating appearance in these samples is generally caused by remaining water content and may interfere with particle sizing.
The particles presented soft surfaces, except for EBG, which showed a rigid and uniform appearance. EBG samples (
Figure 4d) exhibited small spherical particles with sizes from 10 to 140 nm, contrary to the values obtained in DLS analysis, where EBG demonstrated the highest particle sizes. These results may suggest that, according to the medium where it was applied, EBG presents different characteristics. For instance, DLS analyses were performed in an aqueous medium, promoting the hydration of particles and consequently increasing particle size. On the other hand, AFM was performed with dried samples, which may explain a retraction in particle size.
Ghasemi et al. [
51], obtaining freeze dried nanocomplexes of WPC and pectin loaded with orange peel oil in 50 to 200 nm, described differences between AFM and DLS particle sizing, attributing the results to the conditions of the samples for these analyses. Similar results were associated by Fan [
52] with pea protein nanoparticles.
3.6. Thermogravimetric Analysis (TGA)
Formulation thermal stability were evaluated by thermogravimetric analysis (TGA), a technique in which the weight of a sample is measured as a function of temperature. Changes in sample mass are attributed to thermal events such as the evaporation of volatiles and water, melting, sublimation, and decomposition [
53].
RBPE TG curves (
Figure 5a) presented a profile with no significant steps, while in the DTG curves (
Figure 6a), two peaks are observed at 187 °C and a maximum degradation peak located at 336.4 °C. A similar profile was obtained by Ramos-Hernández et al. [
54] for β-carotene. Soy lecithin presented peaks at 82.3 °C, 195 °C, and a prominent peak at 346 °C.
Regarding the encapsulating agent TG curves (
Figure 5a,b), the profiles are very similar, in agreement with Barreto et al. [
55], indicating that, besides different protein structures, they present similar thermal behaviors. The formulations also showed profiles similar to each other and to the encapsulating agents. However, comparing TG curves between these groups, a lower slope of nanoparticles curves is observed at 300 °C, indicating a decreased decomposition speed and improved thermal stability. These steps of weight losses can be observed in DTG curves (
Figure 6a,b), for CC, WPI, WPC, and BG, the first one at 67–91 °C in a magnitude of approximately −1.5%, related to the loss of water and volatile compounds [
56], and a peak of maximum degradation rate related to the decomposition of proteins at 326, 318, 323, 334 °C, respectively [
57,
58].
Regarding the encapsulated samples, the temperature peaks for maximum weight loss were dislocated to higher temperatures, respectively, 394, 383, 394, 405 °C for ECC, EWPI, EWPC, and EBG, when compared to those obtained for pure components, which indicates an improvement in the thermal stability. The extinction and attenuation of the weight loss peaks of soy lecithin and the red pepper extract demonstrate a thermal protective effect of wall materials, which indirectly infers an efficient encapsulation of these substances [
59,
60].
Increasing thermal stability was also reported by Lekshmi et al. [
61] with the use of WPI and chitosan as wall materials in a squalene based emulsion. In the study of Talón et al. [
60], the thermal degradation of maltodextrin nanoparticles was more affected by lecithin addition than whey protein. According to the authors, formulations with whey protein degradated at the highest temperature. This can be related to an increase in formulation molecular weight and the enhancement of cohesive forces, whereas lecithin lipids present a plasticizing effect that reduces attractive forces between chains. In the present study, formulations obtained increases in maximum degradation rates at approximately 70 °C compared with pure components and RBPE, and around 50 °C compared to soy lecithin. These results indicated that interactions between lecithin, RBPE, and proteins might occur, providing a more stable formulation.
3.7. Dispersion Stability
Aqueous dispersibility and stability are essential characteristics for the functionality of food coloring. Despite their high coloring power, carotenoids are known for their low aqueous solubility, limiting their application in foods. Therefore, the development of strategies that overcome these barriers is essential. The dispersibility test was carried out to evaluate the ability of nanoparticles to be dispersed in water and their ability to remain in suspension.
All formulations could maintain stability at different times, preserving an average concentration of 8 mg/mL in suspension. Results indicated no significant difference between all the samples for the two different times (
Figure 7a). Nevertheless, gelatin samples presented sedimentation (
Figure 7b,c) and a higher discrepancy between replicates. As discussed previously, these results can be explained by EBG particle size in water, and zeta potential. Particle hydration tends to increase the particle size, which leads to instability, probably generating aggregation and gravitational separation.
Moreover, systems with multiple components that contain proteins, phospholipids, and polysaccharides are prone to sedimentation due to differences in densities [
62]. However, sedimentation was not definitive, being reversed after mixing.
In the previous study of our research group [
27], water solubility found for red bell pepper extract was 0.025 mg/mL, which indicates the very low solubility of the extract. Each nanoparticle obtained was efficient in increasing and enabling the application of carotenoid extract in water, which reveals their potential as a food color additive.
3.8. Color Analysis
Color is an essential sensory attribute that affects the acceptability of a food or product. The food industry resorts to applying food coloring, to add or enhance color. Synthetic food colorants are the most used and widely studied regarding toxicity and side effects on consumer health. The development of alternatives to these artificial additives is emerging because of the growing consumer demand for natural and health-promoting products. Nevertheless, their replacement is challenging due to advantageous properties such as high stability, ease of application, intense color, and low cost [
63].
According to obtained results, nanoparticles dispersed in water (1 mg/mL) demonstrated an intense orange color (
Figure 7b,c), easily comparable to those presented by orange flavored soft drinks. Generally, mixtures of artificial colors such as tartrazine, Red 40, and sunset yellow are used to achieve this coloration. These synthetic food colorants are widely applied, mainly in products aimed at children [
64].
Samples were evaluated and compared for color parameters
L *,
a*, and
b*, which indicate the degrees of lightness, red (+) to green (−), and yellow (+) to blue (−), respectively. Regarding the degree of the luminosity of the samples (
Figure 7d),
L *, it was observed that there was a significant difference between all the samples (
p < 0.05), except between the EWPC and EBG samples (
p > 0.05). EWPI was darker, while the ECC sample was lighter. Regarding the degrees of red and yellow (
Figure 7c,f), indexes
a * and
b *, the casein sample presented a lower value, indicating a lower degree of red and yellow when compared to the others. Moreover, there was a significant difference for both parameters compared to the rest of the samples. ECC samples presented the lowest encapsulation efficiency, related to the demonstrated color parameters. According to Lee et al. [
65], consumers tend to choose foods with higher chroma, which indicates a more intense color. Decreasing chroma in most foods is related to decomposition, leading to a decrease in preference.
Stability studies considering different processing and storage conditions, such as temperature variation, light exposure, pH, and different food matrices, are necessary to assess the influence of variables on color and nanoparticle shelf life. Considering the results of dispersibility, DLS, and AFM, the EBG formulation tended to lower stability in water. For this reason, stability studies may be directed to the application in powder, creamy, or instant products.
In addition, plans to optimize the process of obtaining nanoparticles are required. Several process variables can be evaluated, such as the proportion of encapsulants, emulsifiers, rotation speed, and others, to increase encapsulation efficiency, and improve particle size and distribution.
4. Conclusions
Developing alternatives to improve carotenoids dispersibility and chemical stability is an important issue to attend to the increasing demand for food application. In the present study, emulsion based systems formulated with red bell pepper extract, soy lecithin, and all encapsulate agents (WPI, WPC, CC, and BG) resulted in particles with a nanoscale size and improved carotenoids dispersion in an aqueous media. Carotenoids were successfully encapsulated in all formulations, and β-carotene was similarly maintained, despite losses probably related to the production process. Through DLS analysis, results showed that EWPI and EWPC presented the smallest particle sizes. FT-IR demonstrated similar changes in all nanoformulations spectra, indicating possible interactions between the ingredients, mainly lecithin and encapsulating agents. AFM revealed that nanoparticles presented a heterogeneous particle size distribution and spherical forms. Regarding TGA, formulations showed similar thermal behaviors and lower decomposition speed than RBPE, suggesting improved thermal stability. Furthermore, formulations presented an intense color and relative stability to sedimentation for 48h. Future studies are required to improve physical characteristics, such as size distribution and encapsulation efficiency. Moreover, application and shelf life assessment in different food matrices are necessary.


 ,
, 


