2.2. Efficiency Calibration of Gramma-Ray Spectrometer
The initial calibration of the sensitivity of the HPGe-spectrometer was carried out by two γ-radiation sources placed instead of the target. The first is with radionuclide cesium-137 of the IGI-Ts-3-1 type (Mayak, Russia) with an activity of 4.52 × 10⁶ Bq, and the second is GBa3.11 based on the radionuclide barium-133 (Riverc, Russia) with an activity of 6.86 × 10⁵ Bq. Since the energies of the γ-emission line of radiation sources differ from 478 keV (661 keV for the first source and 383 keV for the second) and the confidence limits of the total error in determining the activity of sources are significant (10% for the first, and 20% for the second), the detector sensitivity was determined with an error worse than 20%. This accuracy is clearly insufficient to evaluate the target.
An increase in the accuracy of the detector sensitivity calibration along the 478 keV photon emission line up to 4% was achieved using seven reference radionuclide photon sources from the OSGI-RT set (Riverc, Russia): 137Cs, 60Co, 133Ba, 54Mn, 152Eu, 207Bi, and 22Na. For each of them, the confidence limits of the total error in determining the activity are 3%. These photon sources have a size of less than 1 mm in diameter and can be considered as point sources. Since the activity of these sources is lower by an order of magnitude (from 3.3 × 10⁴ to 1.01 × 10⁵), the sources are placed closer to the spectrometer. They are fixed on a Plexiglas plate mounted on a movable controlled 2D table, moved coaxially close to the entrance window of the detector, and measurements are conducted. The measurements are repeated with the source moved away from the detector up to a distance of 112 mm with a step of 8 mm. The measurements were carried out using 23 γ-radiation lines.
Let us assume that the detection efficiency ε(
x,
E) is inversely proportional to the square distance from the radiation source to the germanium crystal of the detector
x =
x0 +
xi, where
x0 is the distance from the surface of the input window to the germanium crystal,
xi is the distance from the surface of the input window to the radiation source (from 0 to 112 mm with 8 mm step), and
E is the photon energy.
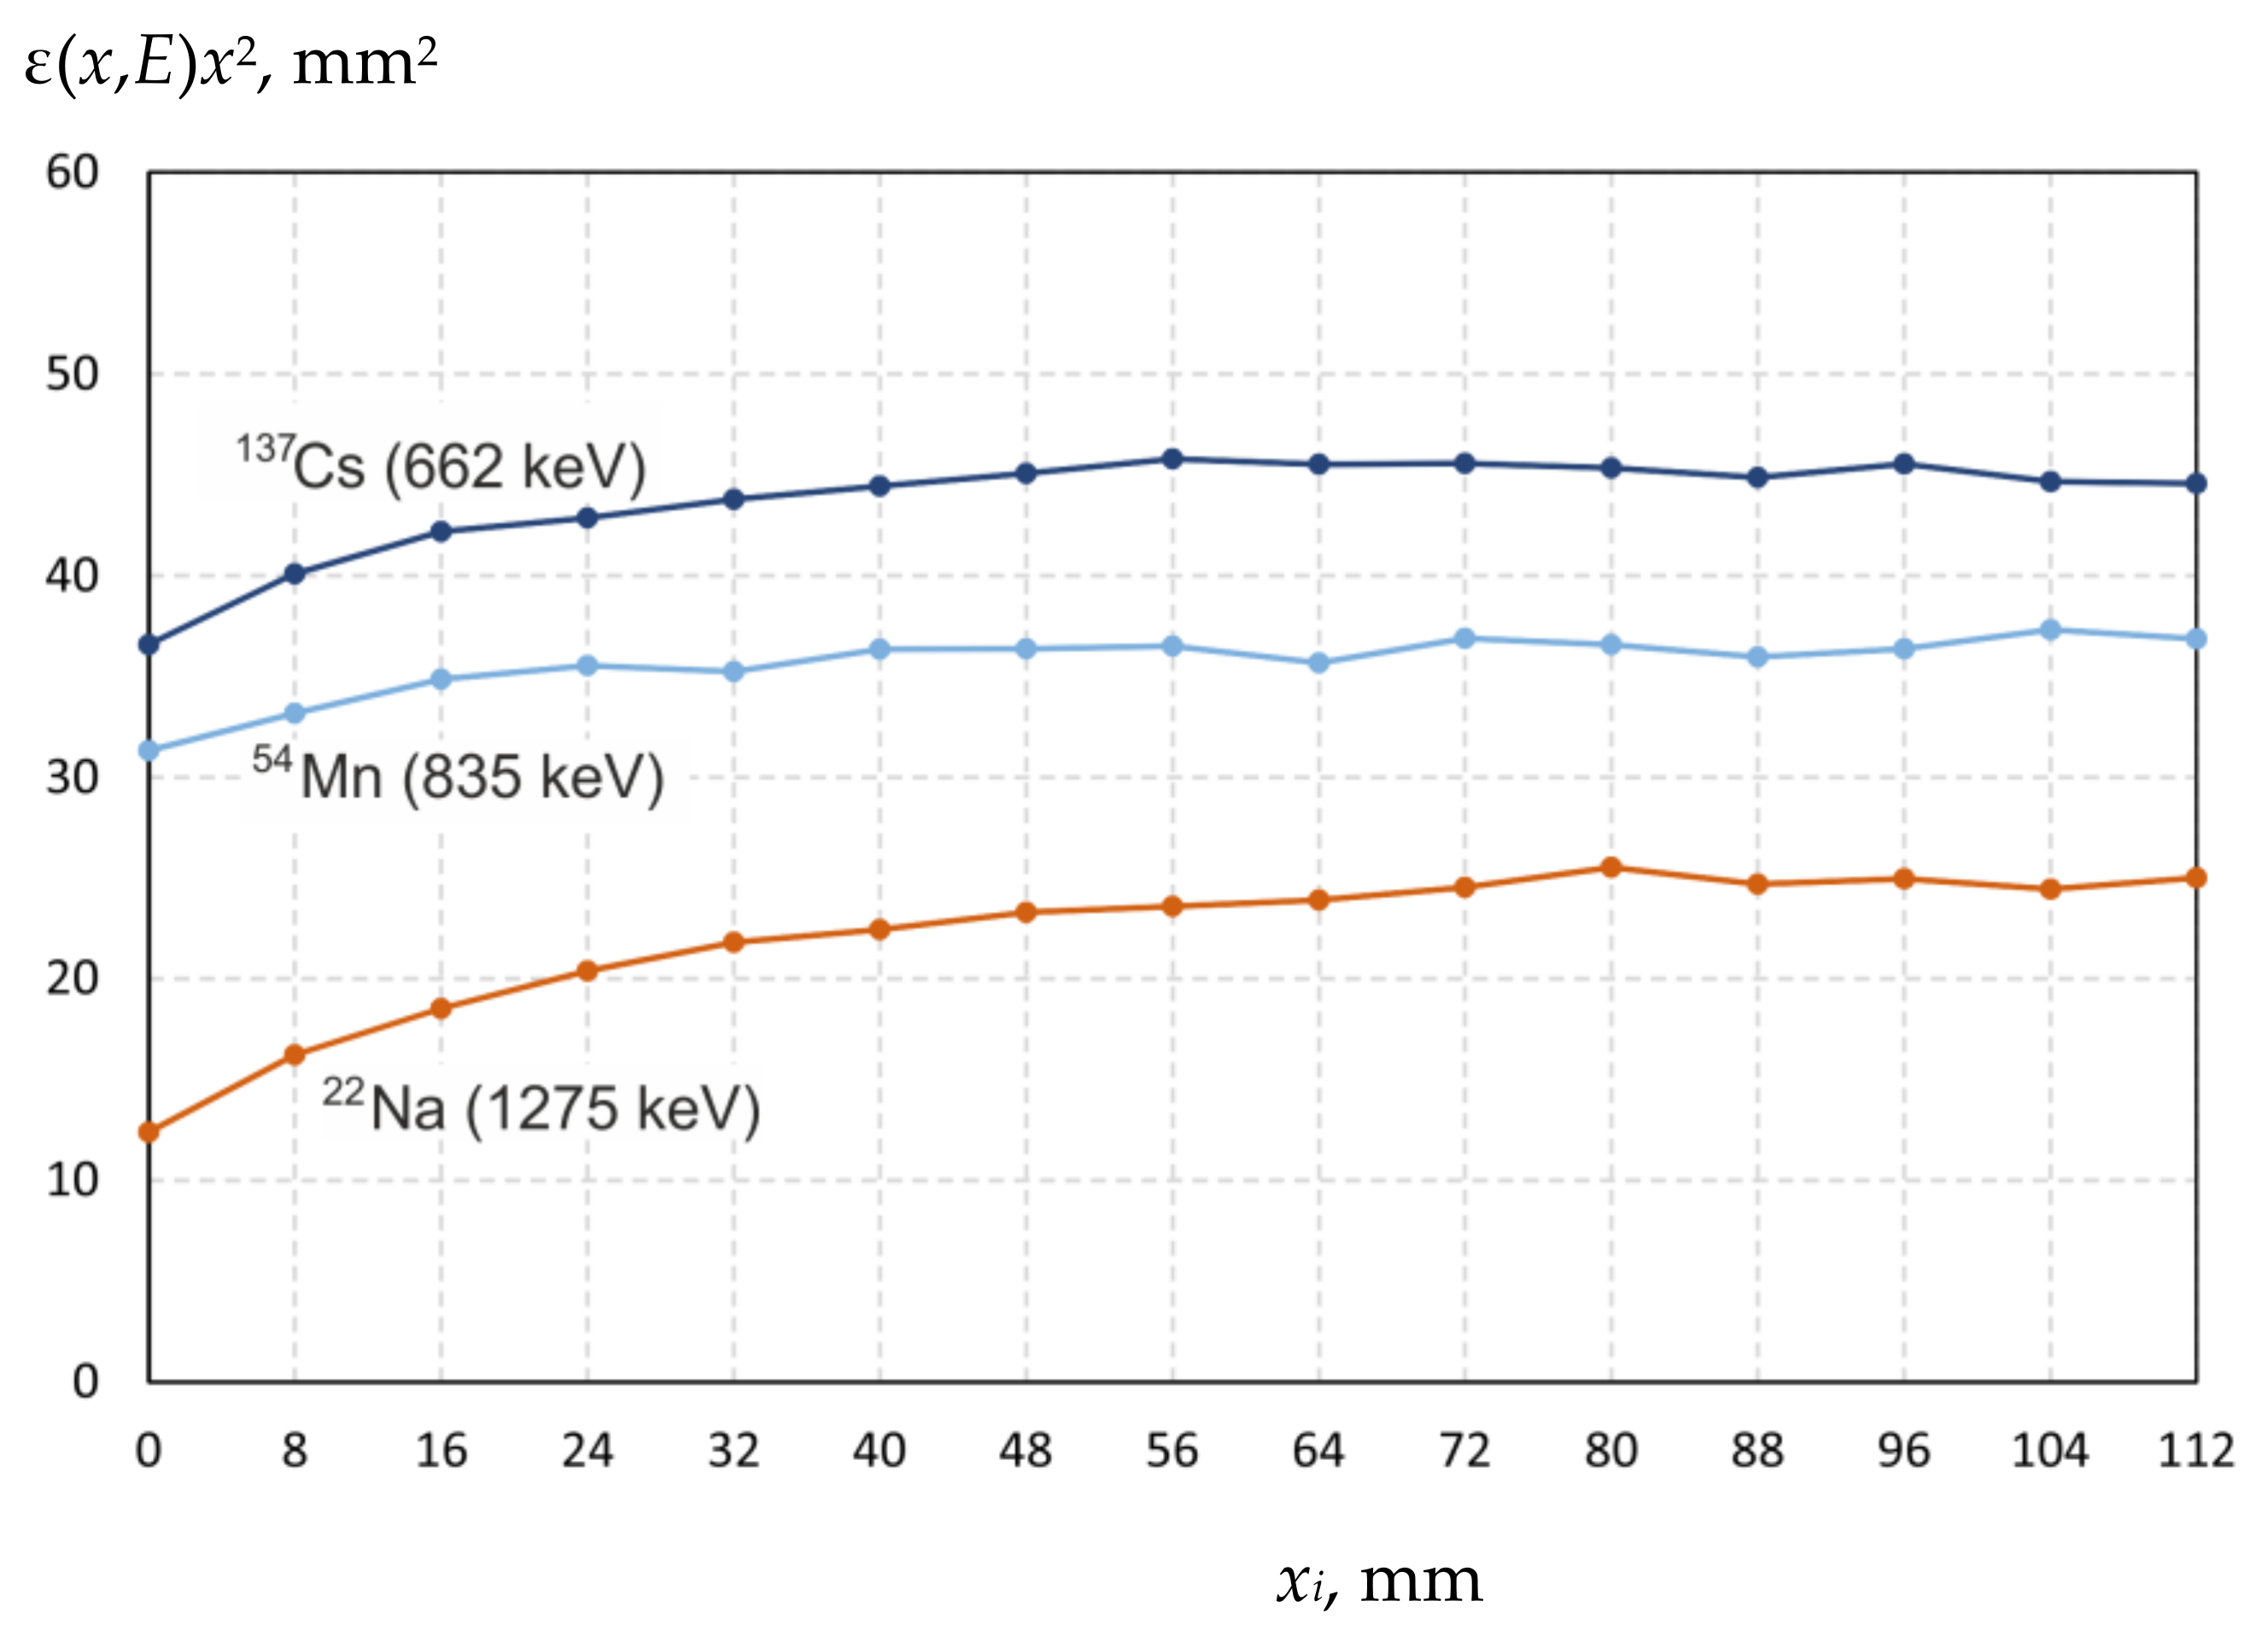
Figure 3 shows a graph of the ε(
x,
E)
x2 dependence for three sources photon radiation at
x0 = 33 mm.
At large distances, the function ε(
x,
E)
x2 is constant (
Figure 3), but as the radiation source is moved closer to the detector, the values of the function ε(
x,
E)
x2 decrease. This behavior at close distances can be explained by several reasons: significant pulse pile-up at very high count rates, edge effects of the detector and others. Thus, in the measurement of the
54Mn source radiation intensity, when the detector dead time does not exceed 11%, the ε(
x,
E)
x2 function is almost constant, starting from a distance of 16 mm. In the measurement of the intensity of
22Na source with higher activity, when the dead time exceeds 40%, the ε(
x,
E)
x2 function becomes constant only from the distance of 56 mm. Consequently, the detector software does not provide reliable measurement of the radiation intensity at high loadings, and measurements carried out with a dead time of more than 5% are unreliable. Note that the dead time correction has been applied by software of HPGe-spectrometer automatically.
We assume that the measurements carried out at a distance xi ≥ 56 mm are reliable and let us determine the mean values and standard deviations of the ε(x,E)x2 function for all 23 γ-radiation lines. By varying x0, we found the minimum standard deviation sum of the function ε(x,E)x2—as x0 = 33.3 mm. Further, this value is used to determine the efficiency of the registration.
The result of measuring the function ε(
x,
E)
x2 for 23 γ-radiation lines is shown in
Figure 4. The accuracy of the ε
x2 values, which takes into account the passport confidence limit of the error in determining the activity, ranges from 3.2% to 5% with two exceptions (7.5% and 9% at energies of 867 keV and 1770 keV). Finally, the value of the ε(
x,
E)
x2 function for the 478 keV γ-radiation line is determined to be 55.5 ± 2 mm
2.
2.3. Calibration of the Proton Beam Energy and Current
The proton energy is determined as E = e·UH− + 2·e·Uhv, where e is the electron charge; e UH− is the energy of negative hydrogen ions injected into the accelerator (usually 22 keV); Uhv is the potential of the high-voltage power supply. The potential is measured with a resistive divider installed inside the high-pressure tank of the high-voltage power supply.
Since the 7Li(p,n)7Be reaction has the threshold energy of 1882 keV, the neutron yield strongly depends on the proton energy. Hence, with a 1% decrease in the proton energy of 2 MeV, the neutron yield decreases by 18% and by 11% at 2.2 MeV.
The potential is measured at a frequency of 1 Hz and is used in the control program of the facility to maintain the potential of the high-voltage electrode of the accelerator at a predetermined level. During the accelerator operation, it was previously noticed that the potential of the high-voltage power source and, consequently, the proton energy gradually decrease during the operational hours. This may be caused by a disproportionate change in the resistances of the resistive divider legs when it is heated. Thus, studying the radiation blistering effect on the neutron yield, it was found that during 5 h of continuous operation of the accelerator at a current of 0.5 mA, the proton energy decreased by 0.65%.
The resistive divider is calibrated according to the
7Li(p,n)
7Be threshold reaction. The BDMN-100-07 detecting unit (Doza LLC, Moscow, Russia) measures the dependence of the neutron radiation dose rate on the proton energy in the range from 1.910 MeV to 2.000 MeV. In this energy range, the dependence of the neutron yield on the energy is linear [
5]; the reliability of the linear approximation of values, calculated with a step of 0.01 MeV,
R2 = 1. The value of
R2 was obtained using the standard Excel Pearson function. Note that this straight line of the linear approximation of the data crosses the
x-axis at 1.885 MeV rather than at the reaction threshold value of 1.882 MeV.
The calibration used in these studies was carried out earlier. Since the preliminary estimates of the measured neutron yield were not consistent with the calculated ones, the calibration of the resistive divider was repeated after the studies. It was found that the measured proton energy was 30 ± 10 keV higher than the true value in the 2 MeV area.
In the 2.2 MeV region, the proton energy was additionally calibrated using the
9Be(p,n)
9B reaction (the reaction threshold is 2.057 MeV). To this end, a beryllium disk with a diameter of 32 mm and a thickness of 9.7 mm was tightly attached to the copper substrate of the target through an indium-gallium alloy and then irradiated with a proton beam in position
A (see
Figure 1). A neutron detector with a lithium-containing GS20 scintillator (The Saint-Gobain Crystals, Hiram, OH, USA) was installed in front of the target, the dependence of the recorded signal on the proton energy was measured. The measurement results and the dependence of the neutron yield on the energy calculated by the PINO program [
6] are shown in
Figure 5. In this figure, the
x-axis shows the energy
E obtained by multiplying it by the coefficient
k selected so that the experimental data fit the calculated ones in the best way, rather than the energy
E given by the control program of the apparatus. In this case,
k = 0.983 ± 0.001. This means that if the control program of the apparatus sets the proton energy as 2200 keV, the proton energy was, in fact, 2163 ± 2 keV. If the program sets the proton energy as 2000 keV, the proton energy was, in fact, 1966 ± 2 keV.
Thus, we have calibrated the resistive divider, and in further calculations, a correction will be made for the proper energy value. It should be noted that this correction is applicable only for the mode when the apparatus has worked for some time and the high voltage source is heated. This is not so at the onset of the process. In order to clarify it, the following experiment was carried out.
The irradiation of targets Nos. 12 and 13 (see
Table 1) was performed with the actual constant proton energy rather than the set one. To this end, a bending magnet was used as an energy analyzer. If the actual proton energy decreases, the proton beam on the surface of the lithium target shifts. By increasing the set energy in the control system of the apparatus, the proton beam was returned to its original position. The position of the proton beam in the center of the target was controlled by the following diagnostic tools: (i) a video camera recording lithium luminescence under the action of protons; (ii) five thermocouples located inside the copper disk of a lithium target (one in the center, the other four at a distance of 18 mm from the center, uniformly distributed in azimuth); and (iii) according to the readings of two small neutron detectors with a polystyrene-based scintillator enriched with boron, which were glued to the vacuum chamber of the target assembly near the lithium target. To improve the sensitivity of diagnostic tools to proton beam displacement, the proton beam scanner installed in the vertical beam transport path was not turned on. In this case, the proton beam on the target surface had a characteristic size of 3 cm.
Figure 6 shows the time dependence of the proton energy, the neutron detector signal, and the temperature in the center of the lithium target during the irradiation session of target No. 12. It can be seen that the neutron yield and temperature in the center of the target were practically constant, while the set proton beam energy had to be practically linearly increased during the first 15 min of irradiation at 13 keV. In 15 min, no further energy correction is required to maintain the proton beam at the center of the target. The exposed proton energy in the plateau mode was 2213 ± 2 keV. By multiplying it with the coefficient
k = 0.983 ± 0.001, we obtain the actual proton energy during the irradiation of target No. 12; it is 2175 ± 3 keV. Let us immediately pay attention to the fact that at the very beginning of irradiation, the actual proton energy was equal to 2175 keV since the proton beam hit the center of the target. This means that at the very beginning of irradiation, the coefficient
k = 2175/2200 = 0.9886.
It should be noted that the accelerator operating mode at 2.2 MeV was practically limiting and was accompanied by 11 high voltage breakdowns (see temperature data in
Figure 6), after which the proton beam parameters returned to their initial values in 15 s.
A similar procedure for determining the correct proton energy was applied in the irradiation session of target No. 13.
For the other irradiation sessions, when the constancy of the proton energy is not maintained by the bending magnet used as the energy analyzer, it is necessary to make yet another assumption: the coefficient k depends on time. In the first 15 min, it decreases linearly from 0.9886 (the estimate is given above) to 0.983 and then remains constant for 45 min. Thus, the weighted average coefficient k of irradiation sessions for targets Nos. 1–11 is 0.98375 ± 0.002. We will use it to correct the proton energy in the irradiation sessions of these targets.
The proton current is measured by the voltage drop across a calibrated resistance connected to a target unit electrically isolated from the apparatus. Although the target unit is made in the form of a deep Faraday cup, emission of secondary electrons from it is possible. To measure electron emission, the gate as a part of the target unit was additionally isolated, and potential was applied to it. The application of a 500 V negative blocking voltage reduces the proton current by an average of 1%, which means that the measured proton fluence is overestimated by 1%.


 ,
, 


