
Synthesis of Microscopic Cell Images Obtained from Bone Marrow Aspirate Smears through Generative Adversarial Networks


Abstract
:Simple Summary
Abstract
1. Introduction
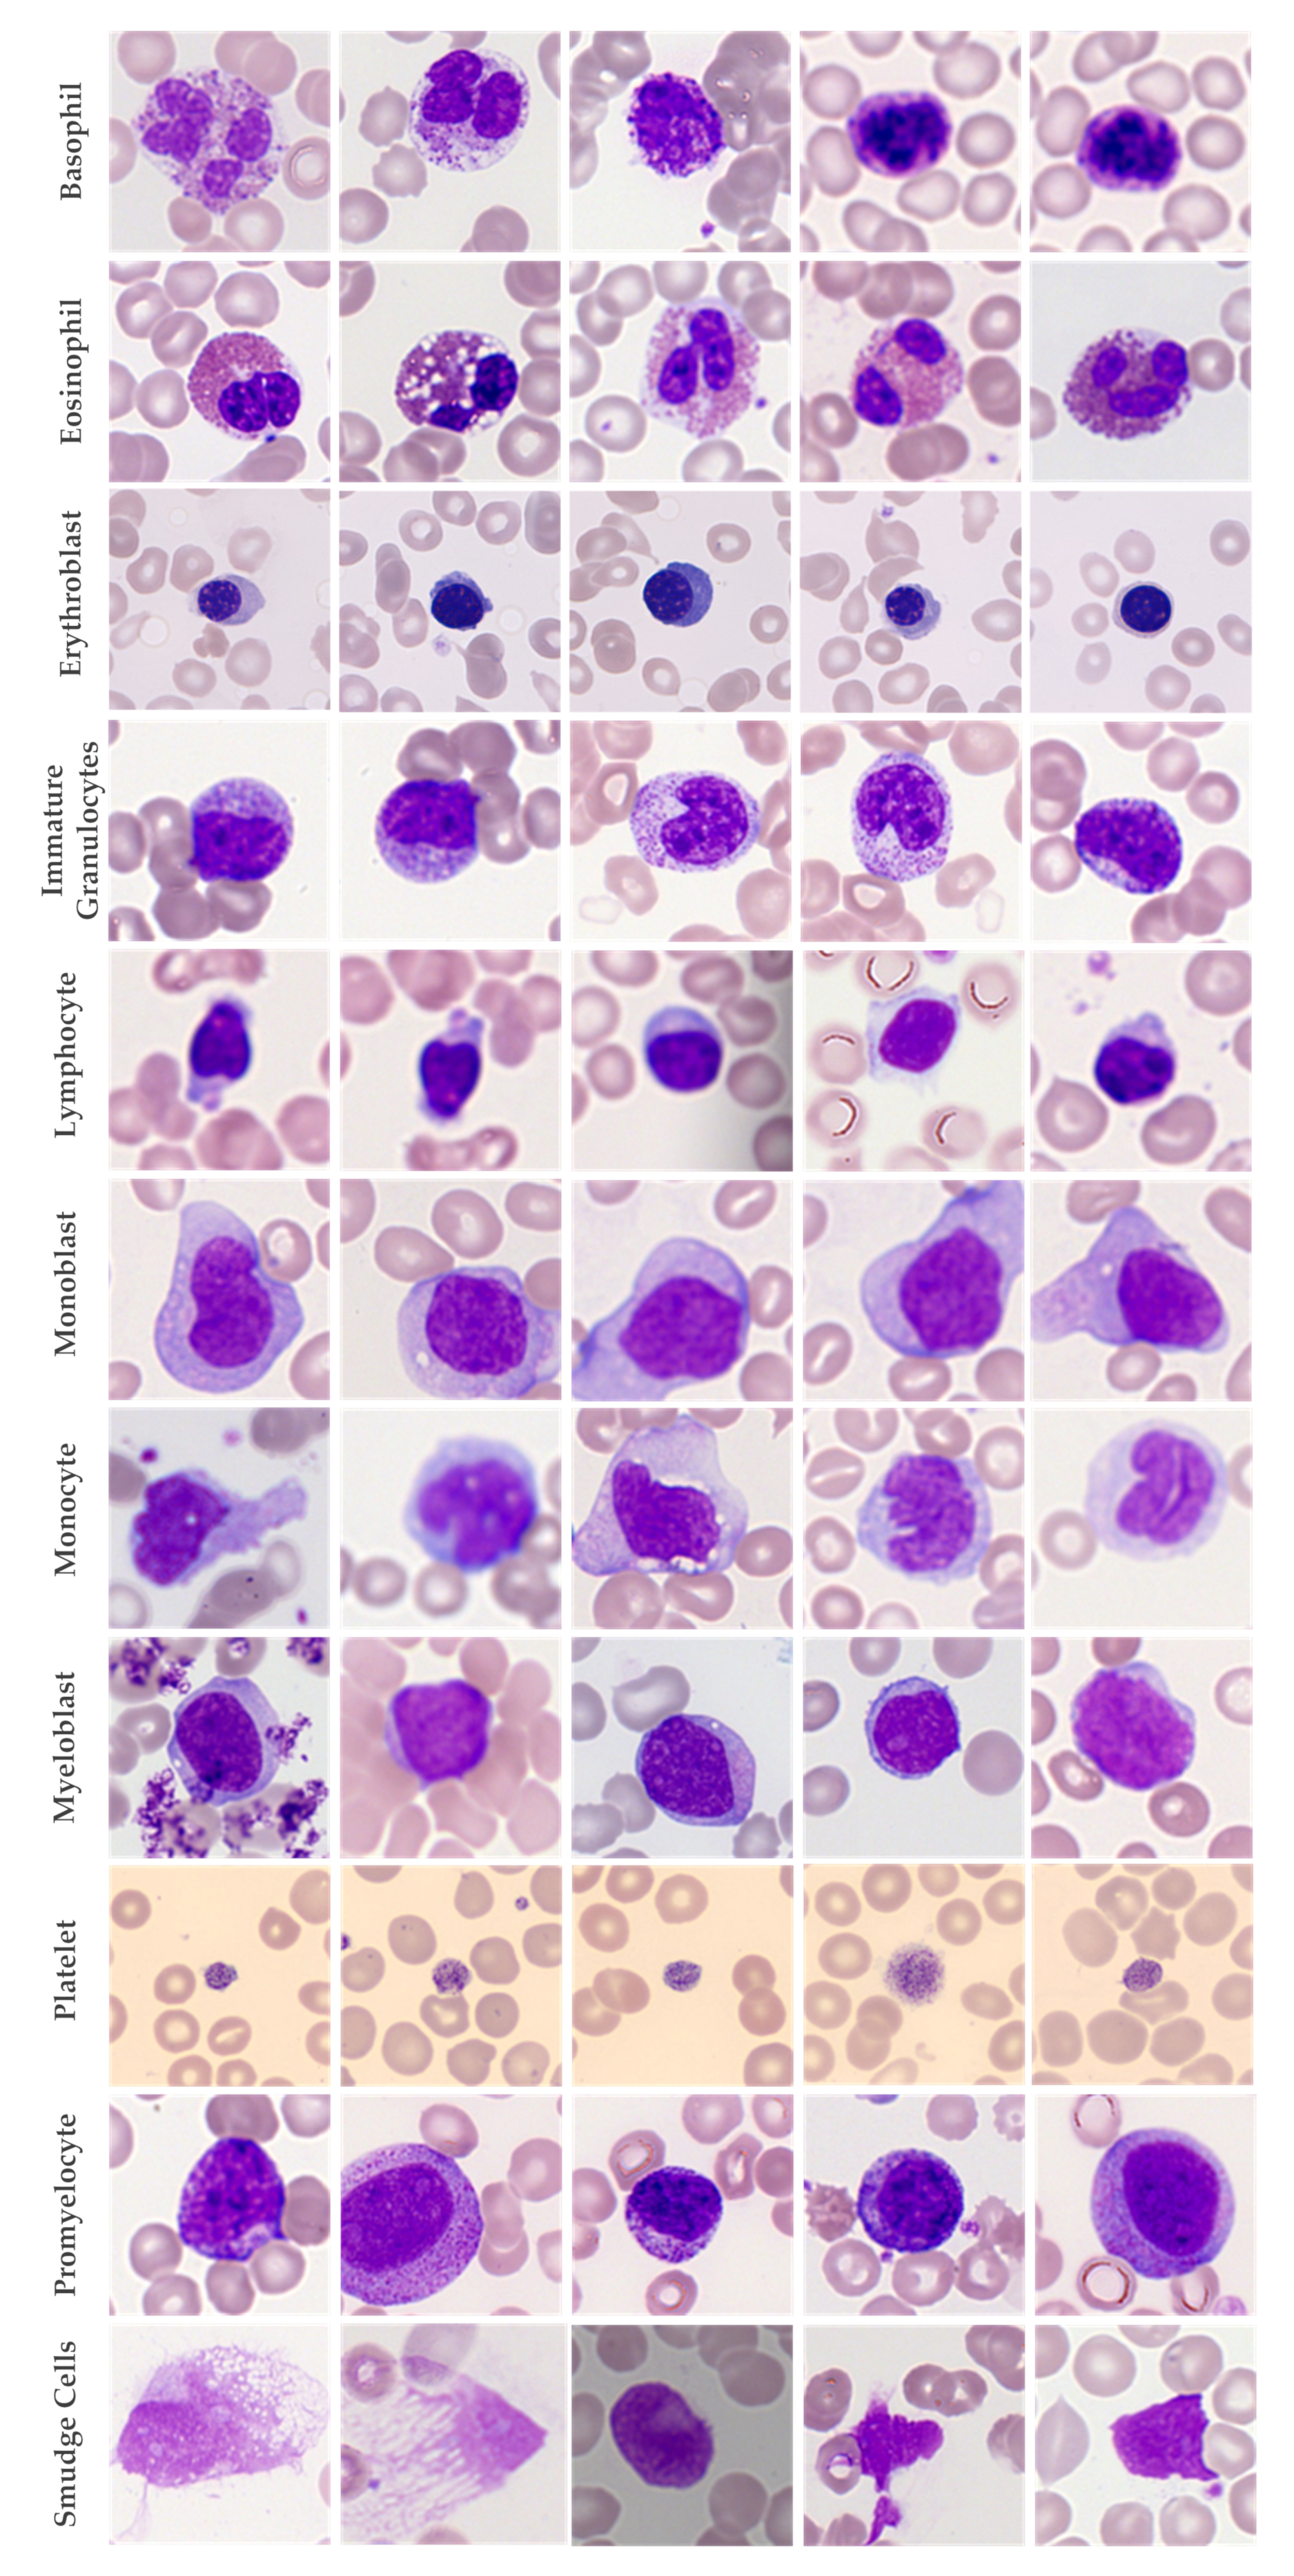
- We have prepared a new dataset that consists of microscopic cell images obtained from bone marrow aspirate smears collected from three different data sources. The dataset has been prepared with the help of experts from the relevant field;
- We present a GAN model WGAN-GP-AC that uses the WGAN-GP model combined with the architecture of AC-GAN to generate synthetic microscopic cell images obtained from bone marrow aspirate smears;
- We use the synthetic data for classification purposes and provide results comparing the performance of classification models using synthetic and original data.
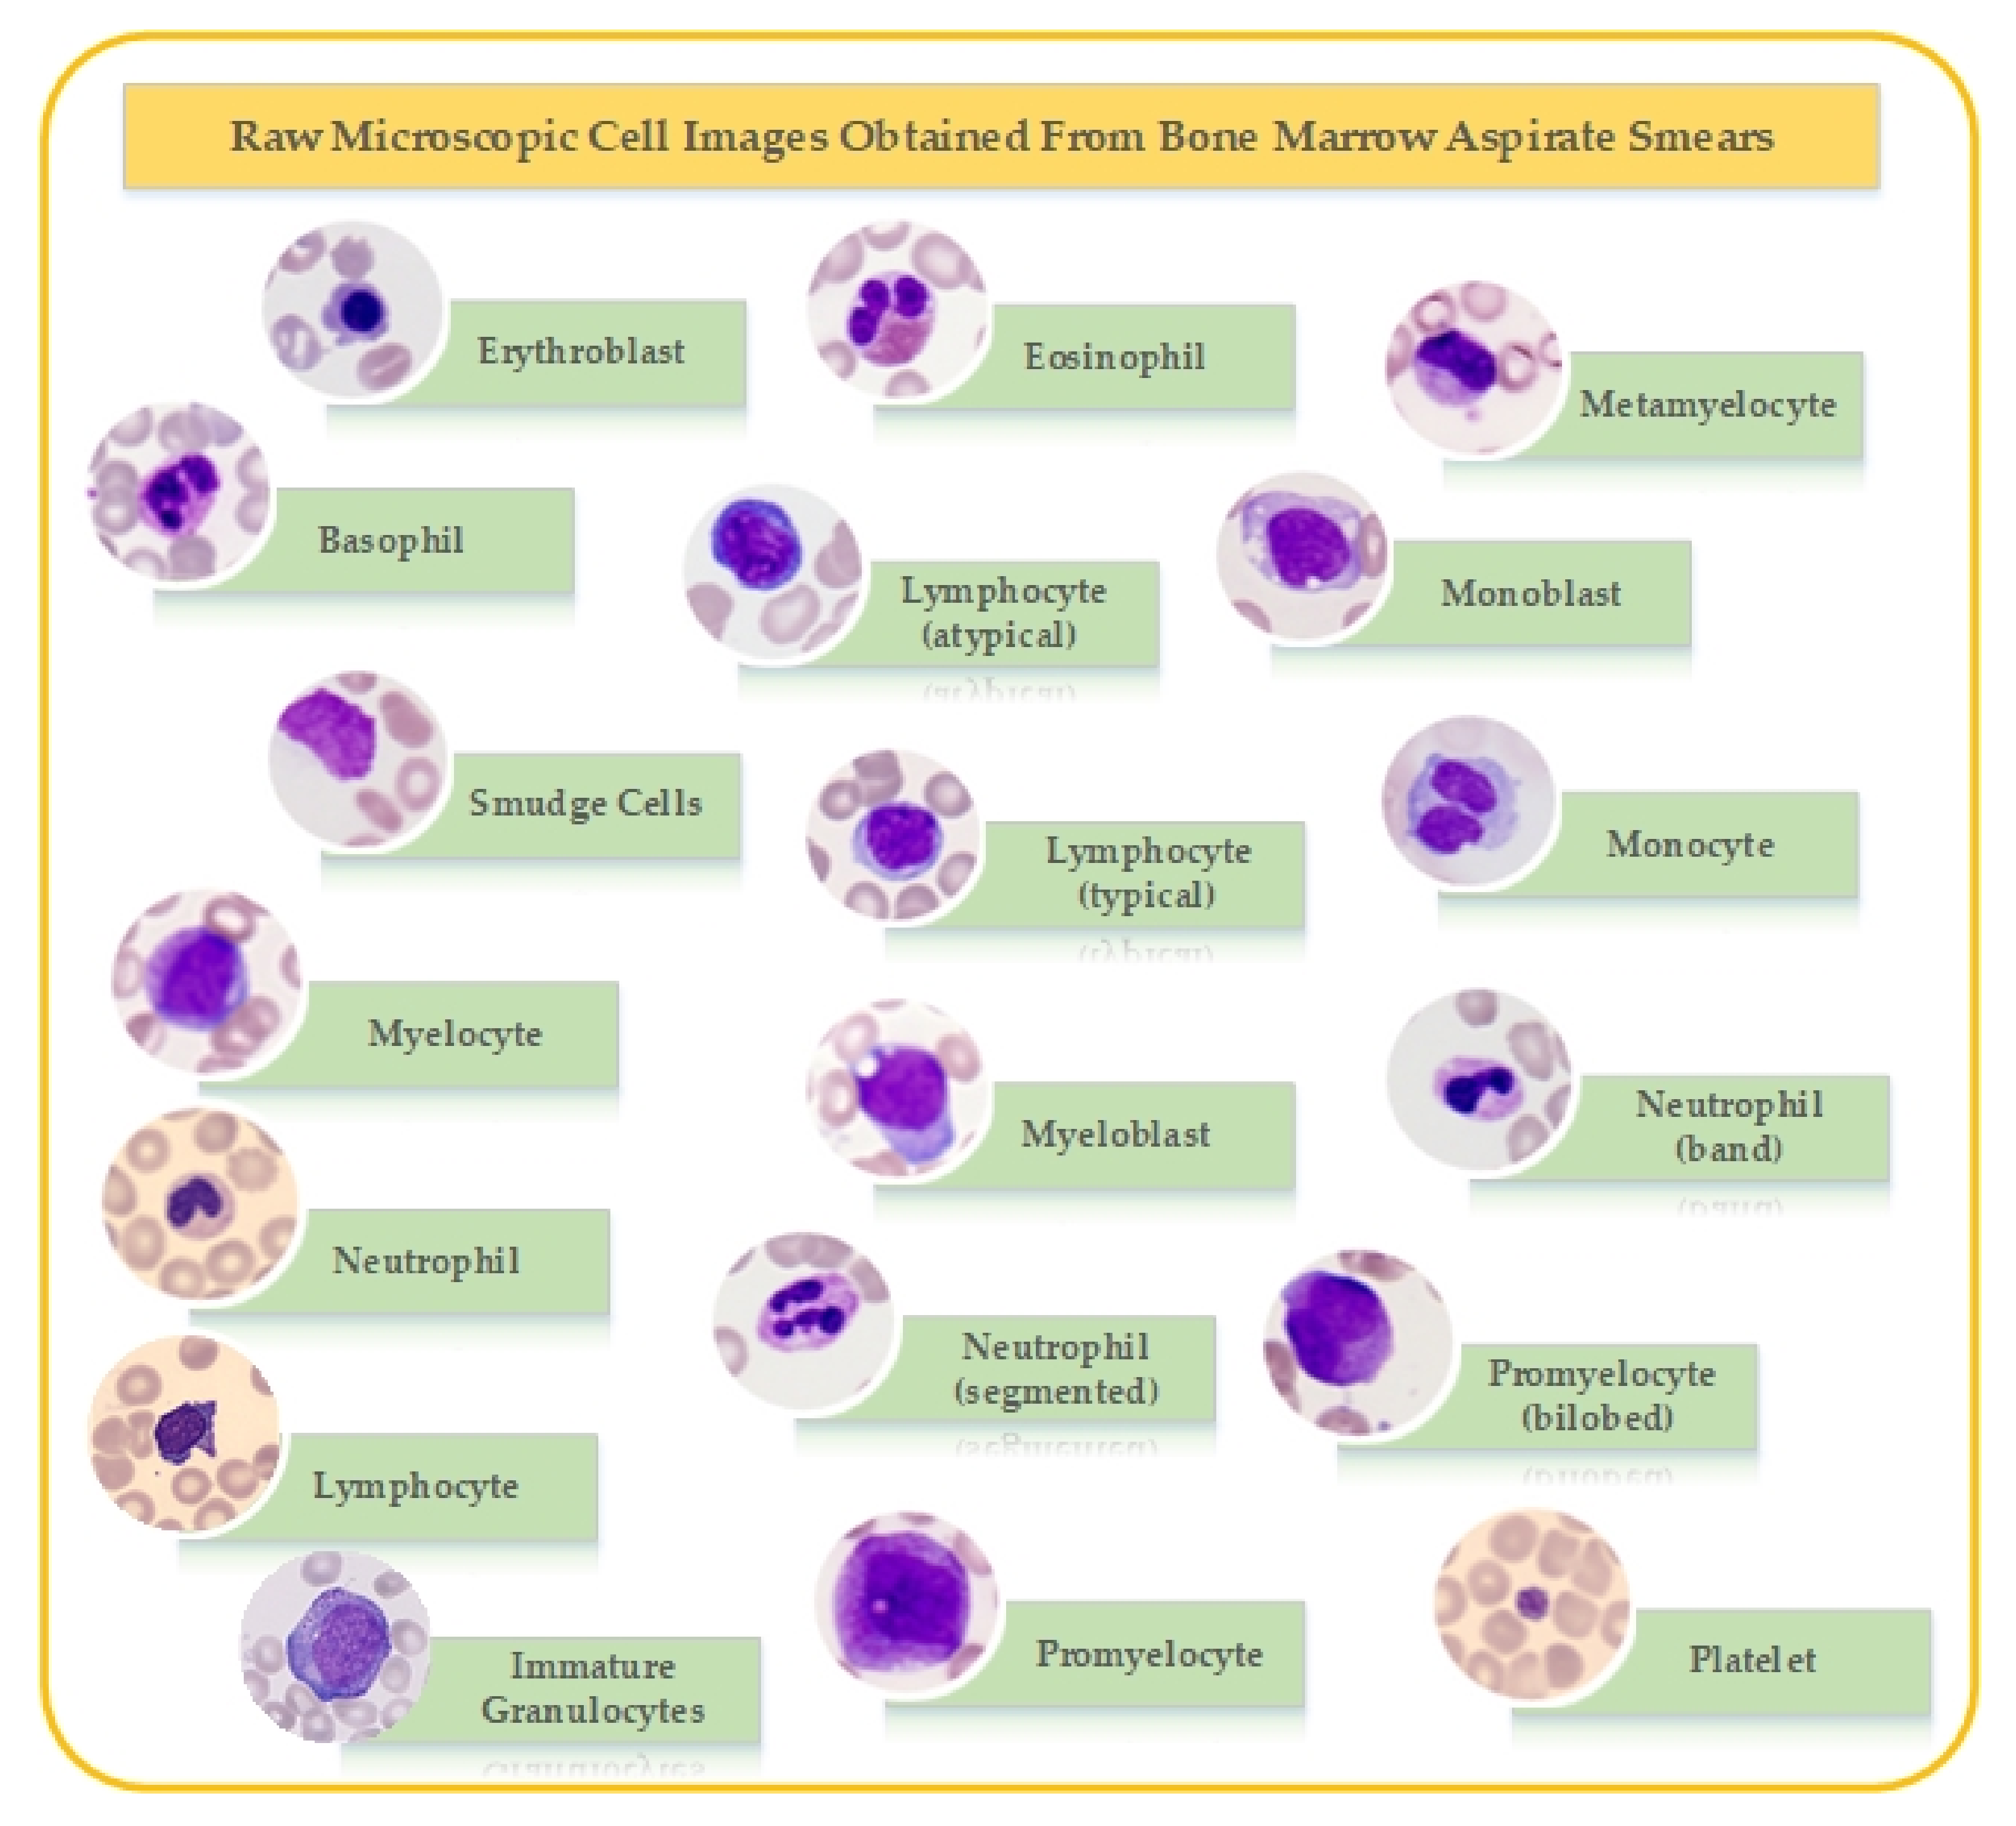
2. Dataset
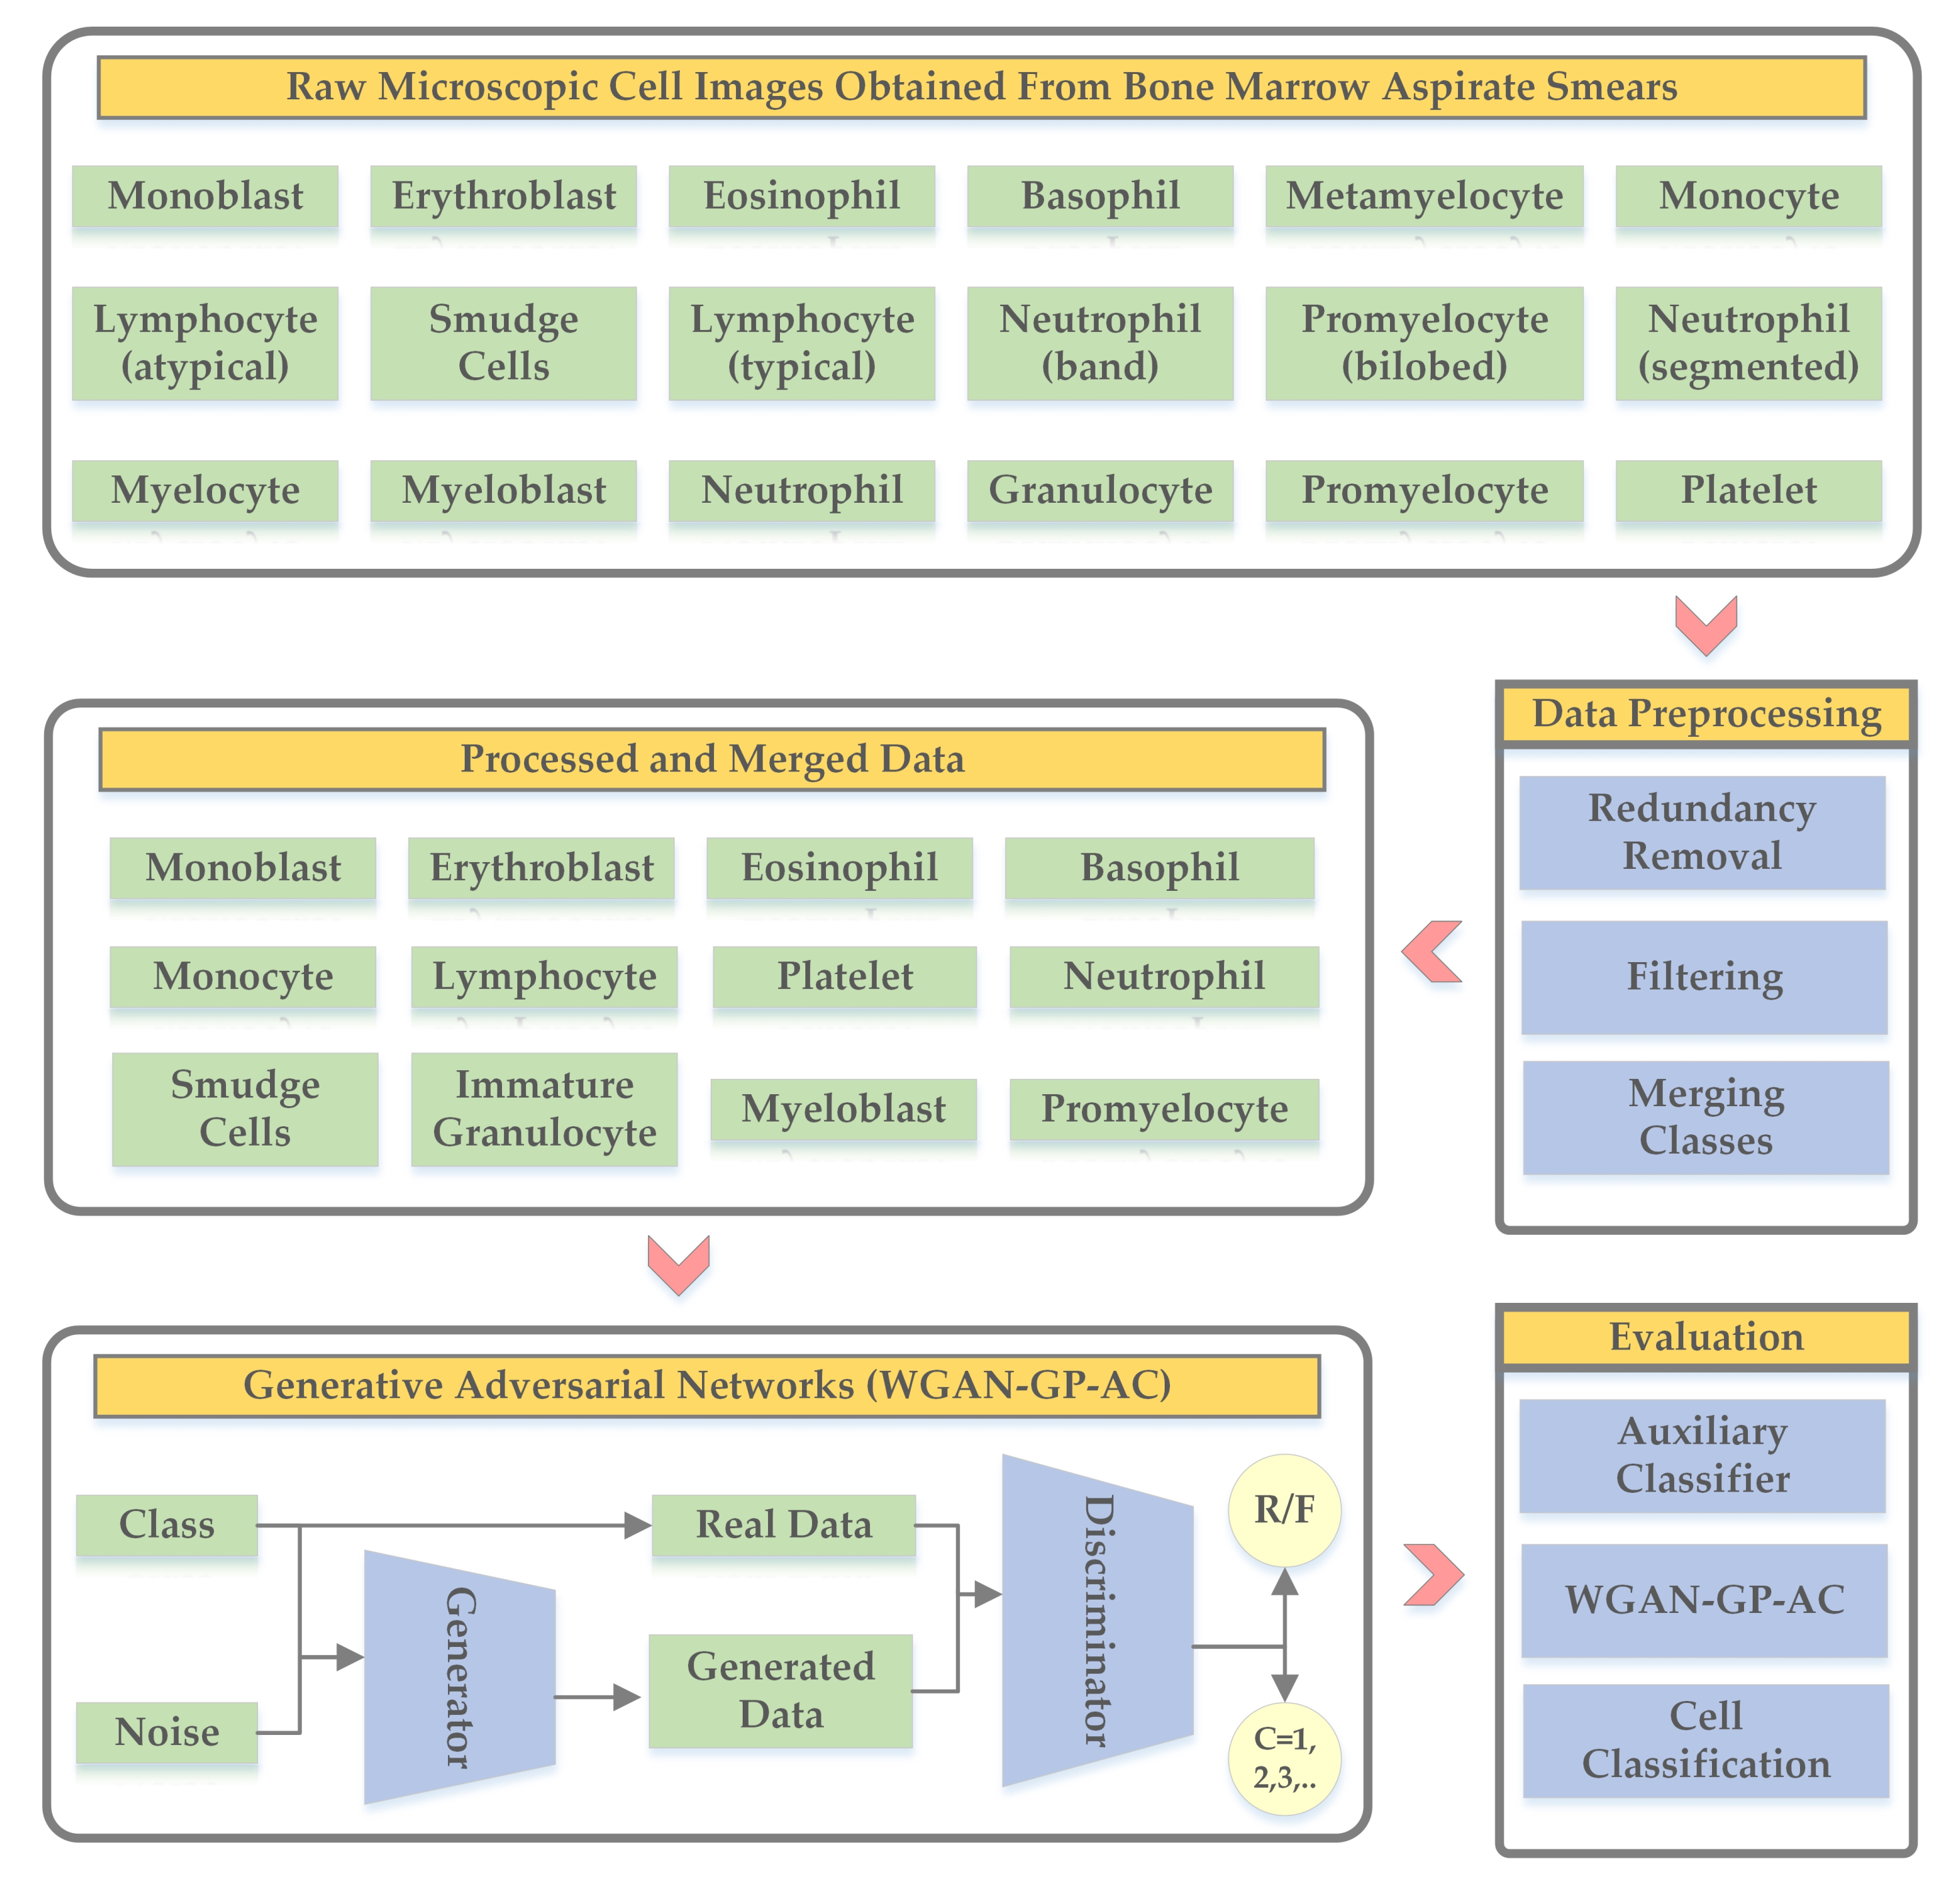
3. Methodology
3.1. Data Preprocessing
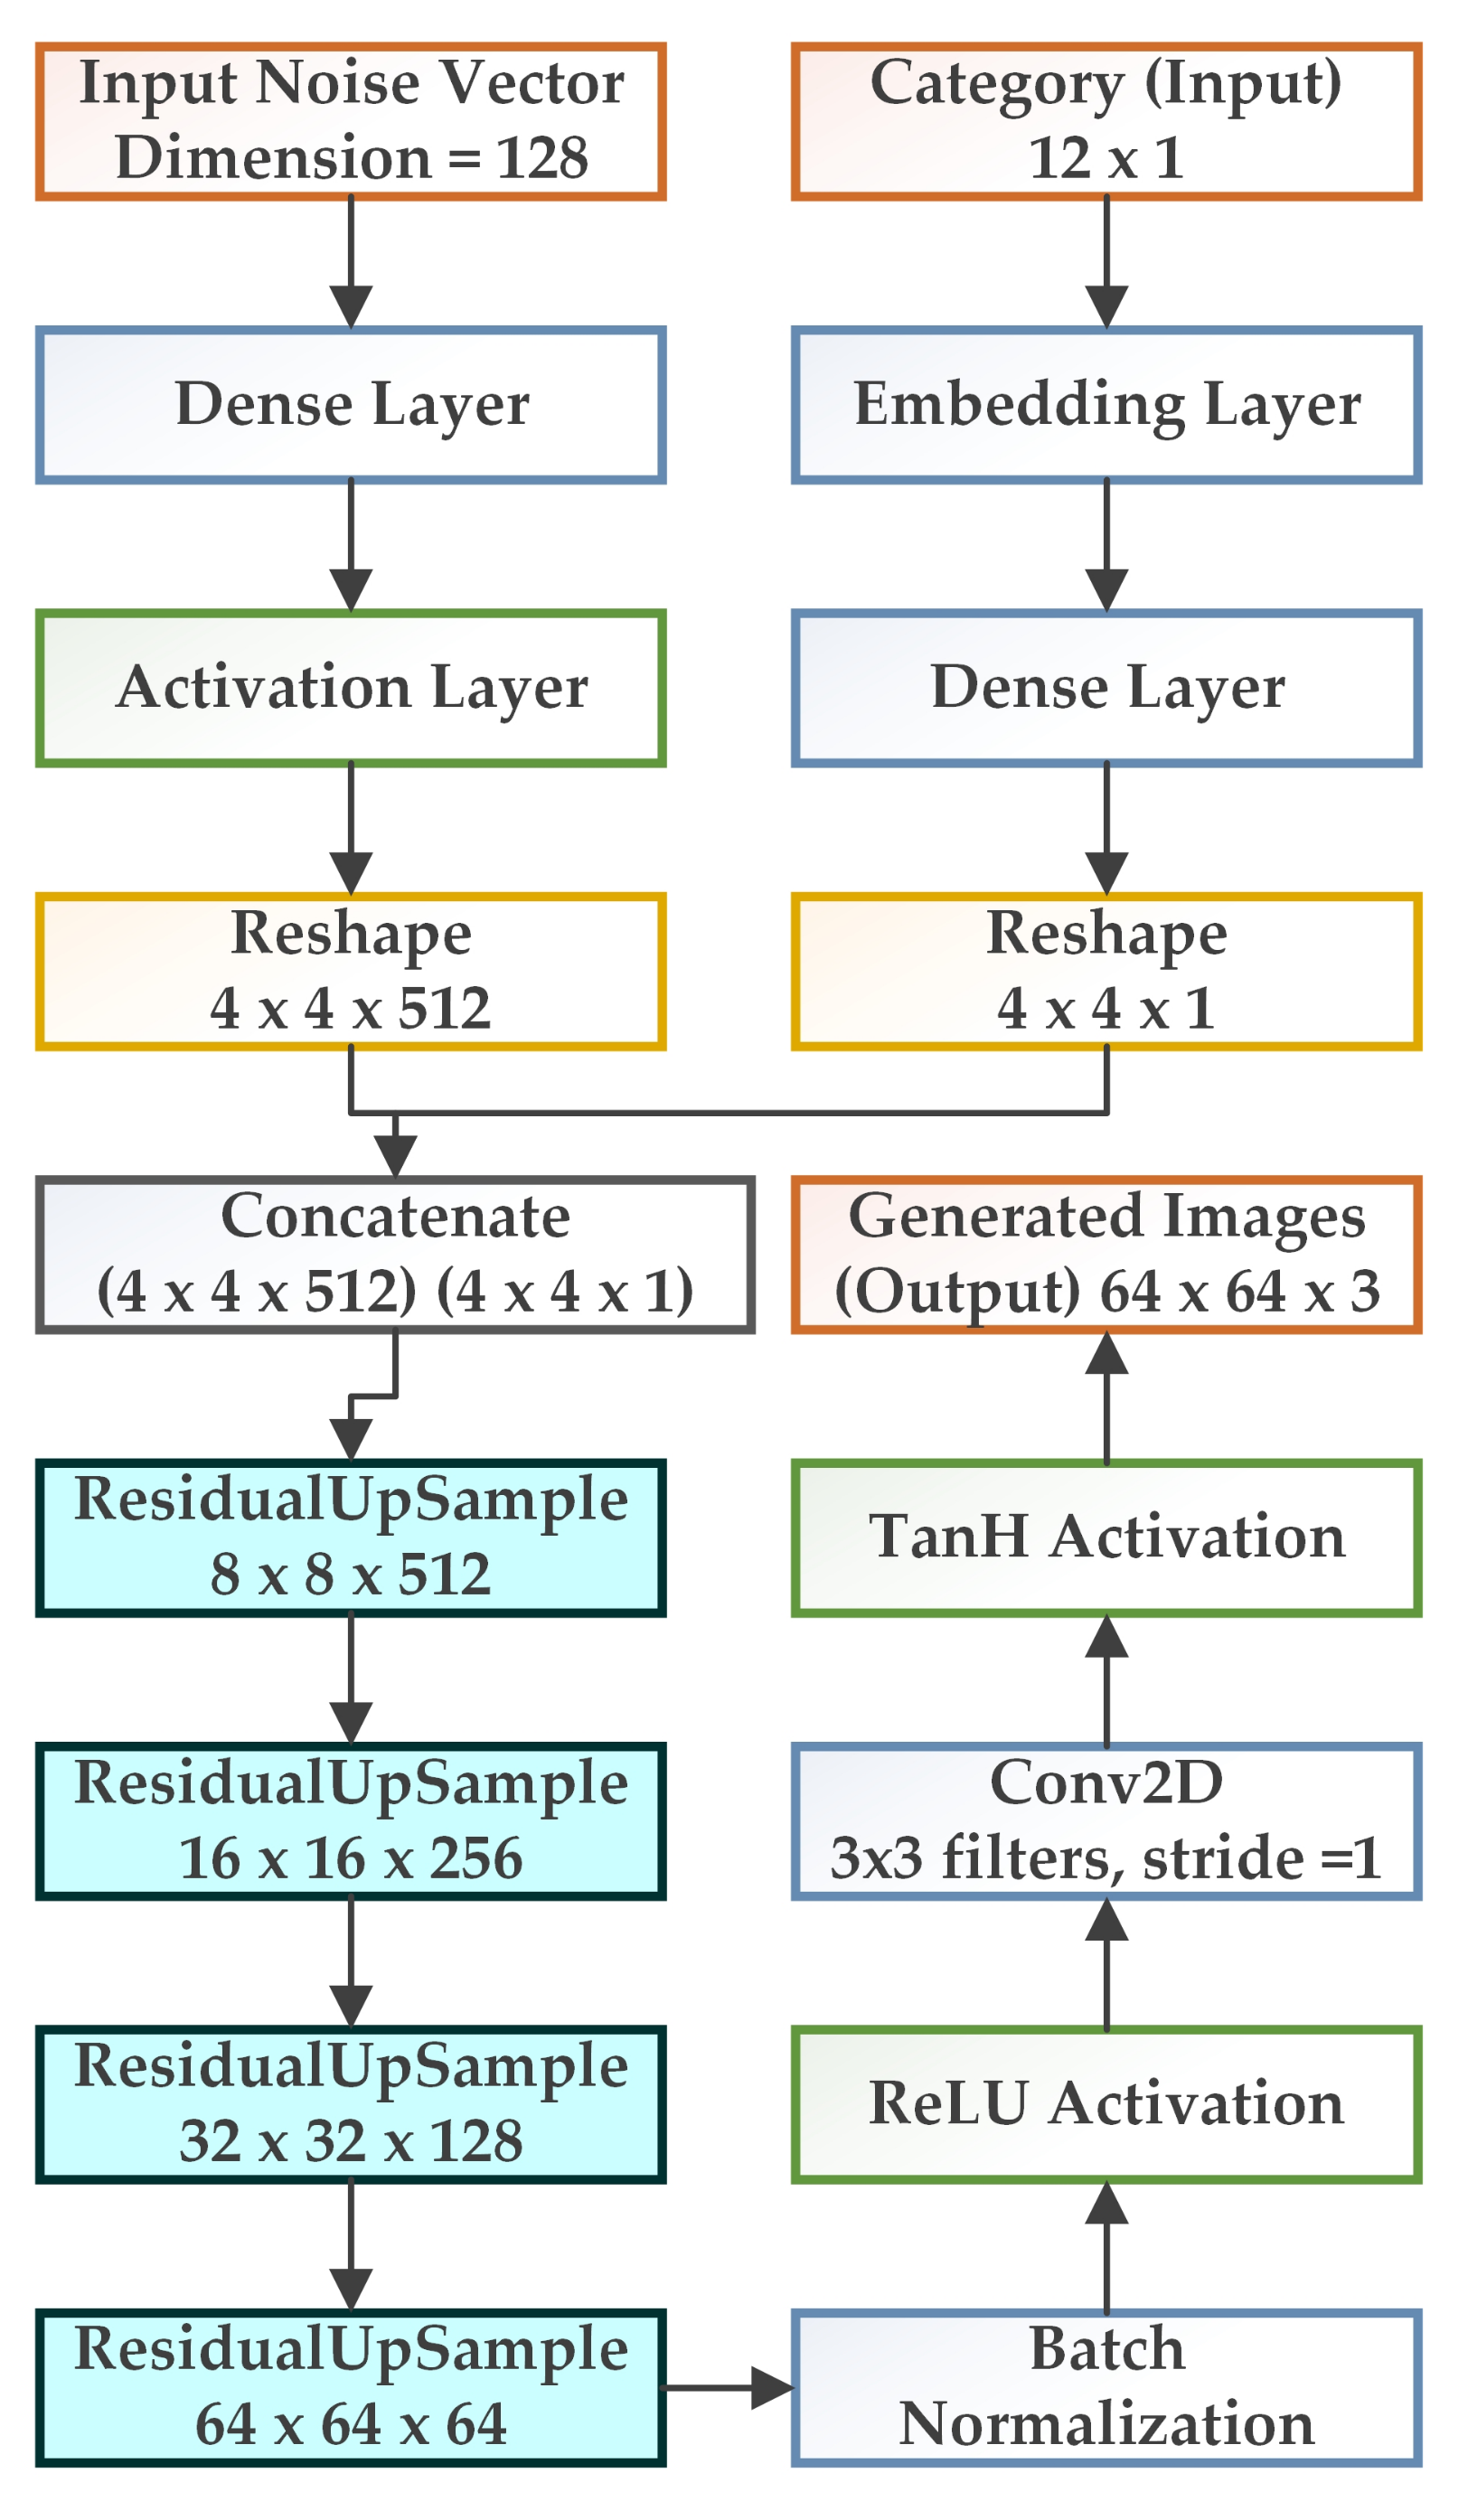
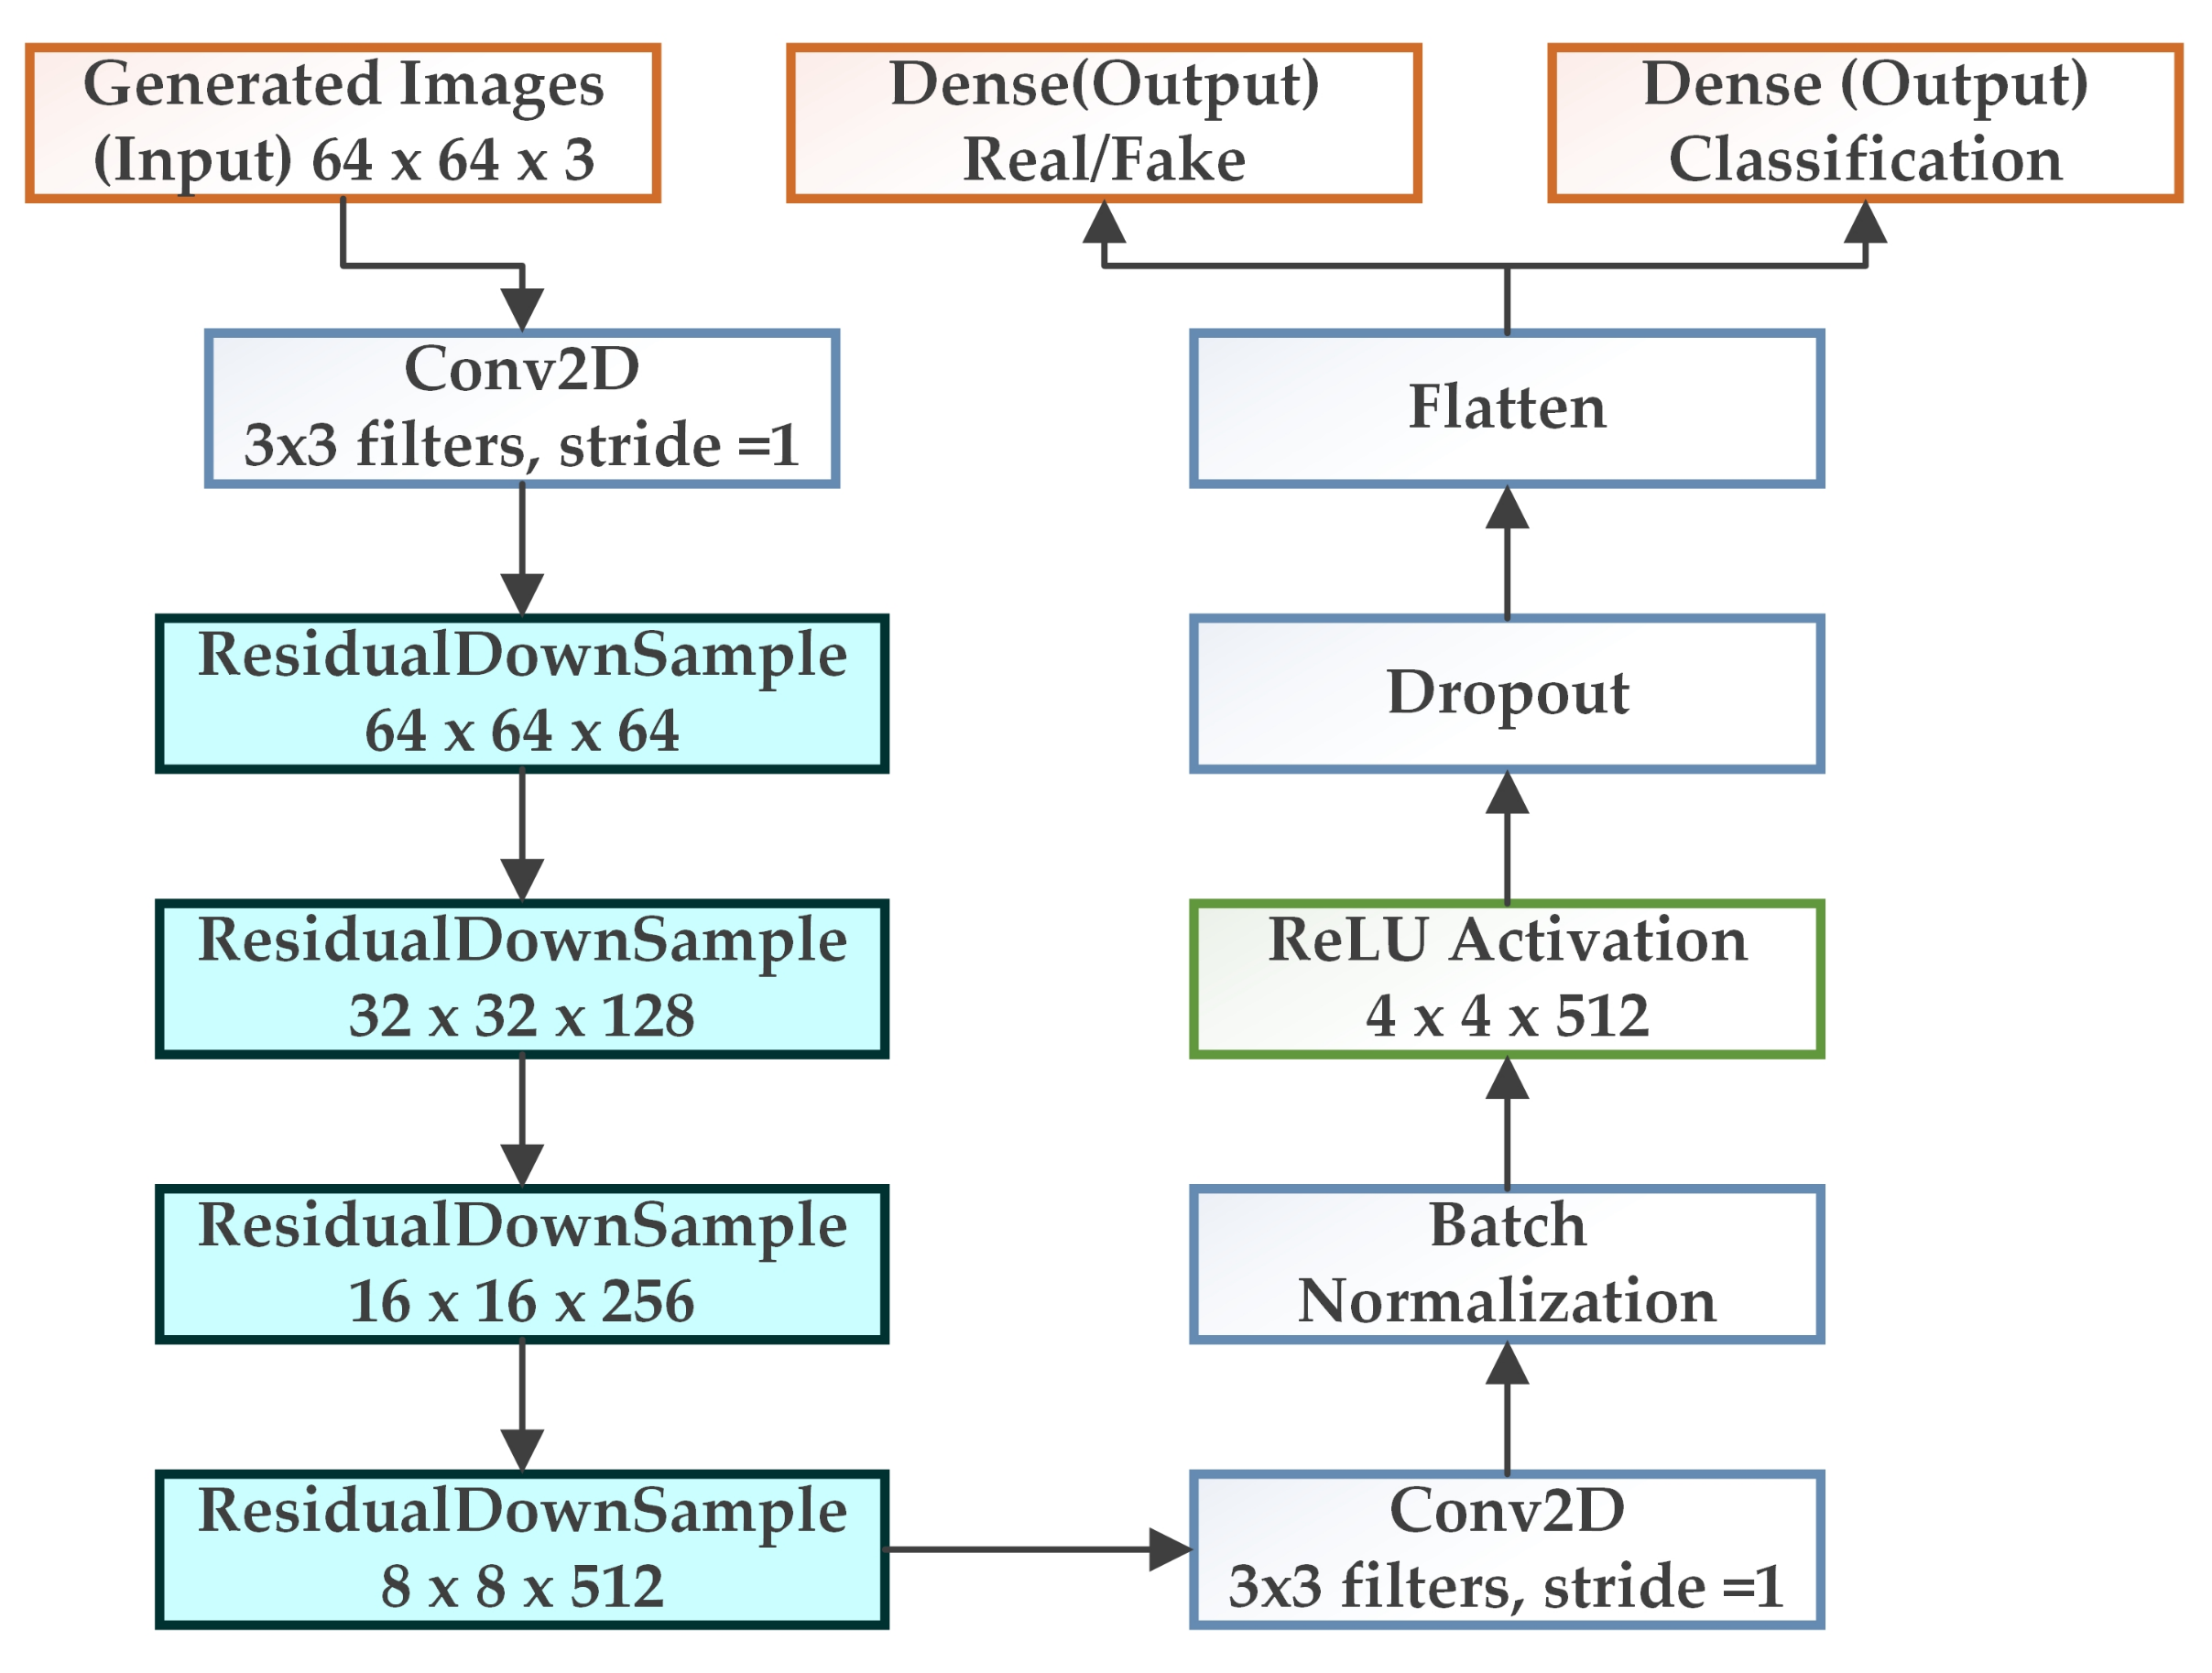
3.2. WGAN-GP-AC
4. Experiments and Results
5. Conclusions and Discussion
Author Contributions
Funding
Institutional Review Board Statement
Informed Consent Statement
Data Availability Statement
Conflicts of Interest
References
- Gurcan, M.N.; Boucheron, L.E.; Can, A.; Madabhushi, A.; Rajpoot, N.M.; Yener, B. Histopathological image analysis: A review. IEEE Rev. Biomed. Eng. 2009, 2, 147–171. [Google Scholar] [CrossRef] [PubMed] [Green Version]
- Cavallo, C.; Boffa, A.; Andriolo, L.; Silva, S.; Grigolo, B.; Zaffagnini, S.; Filardo, G. Bone marrow concentrate injections for the treatment of osteoarthritis: Evidence from preclinical findings to the clinical application. Int. Orthop. 2021, 45, 525–538. [Google Scholar] [CrossRef]
- Tomasian, A.; Jennings, J.W. Bone marrow aspiration and biopsy: Techniques and practice implications. Skelet. Radiol. 2021, 51, 81–88. [Google Scholar] [CrossRef]
- Hasserjian, R.P. Controversies in the recent (2016) World Health Organization classification of acute myeloid leukemia. Best Pract. Res. Clin. Haematol. 2021, 34, 101249. [Google Scholar] [CrossRef]
- Goodfellow, I.; Pouget-Abadie, J.; Mirza, M.; Xu, B.; Warde-Farley, D.; Ozair, S.; Courville, A.; Bengio, Y. Generative adversarial nets. Adv. Neural Inf. Process. Syst. 2014, 27, 2672–2680. [Google Scholar]
- Baxi, V.; Edwards, R.; Montalto, M.; Saha, S. Digital pathology and artificial intelligence in translational medicine and clinical practice. Mod. Pathol. 2021, 35, 23–32. [Google Scholar] [CrossRef]
- Lee, K.; Lockhart, J.H.; Xie, M.; Chaudhary, R.; Slebos, R.J.; Flores, E.R.; Chung, C.H.; Tan, A.C. Deep Learning of Histopathology Images at the Single Cell Level. Front. Artif. Intell. 2021, 4, 137. [Google Scholar] [CrossRef] [PubMed]
- Arjovsky, M.; Chintala, S.; Bottou, L. Wasserstein generative adversarial networks. In Proceedings of the International Conference on Machine Learning, Sydney, Australia, 6–11 August 2017; pp. 214–223. [Google Scholar]
- Gulrajani, I.; Ahmed, F.; Arjovsky, M.; Dumoulin, V.; Courville, A. Improved training of wasserstein gans. arXiv 2017, arXiv:1704.00028. [Google Scholar]
- Kutlu, H.; Avci, E.; Özyurt, F. White blood cells detection and classification based on regional convolutional neural networks. Med. Hypotheses 2020, 135, 109472. [Google Scholar] [CrossRef]
- Girshick, R.; Donahue, J.; Darrell, T.; Malik, J. Rich feature hierarchies for accurate object detection and semantic segmentation. In Proceedings of the IEEE Conference on Computer Vision and Pattern Recognition, Columbus, OH, USA, 23–28 June 2014; pp. 580–587. [Google Scholar]
- Girshick, R. Fast r-cnn. In Proceedings of the IEEE International Conference on Computer Vision, Washington, DC, USA, 7–13 December 2015; pp. 1440–1448. [Google Scholar]
- Ren, S.; He, K.; Girshick, R.; Sun, J. Faster r-cnn: Towards real-time object detection with region proposal networks. Adv. Neural Inf. Process. Syst. 2015, 28, 91–99. [Google Scholar] [CrossRef] [Green Version]
- Xie, J.; Girshick, R.; Farhadi, A. Unsupervised deep embedding for clustering analysis. In Proceedings of the International Conference on Machine Learning, New York, NY, USA, 19–24 June 2016; pp. 478–487. [Google Scholar]
- Zhang, X.; Su, H.; Yang, L.; Zhang, S. Weighted hashing with multiple cues for cell-level analysis of histopathological images. In Proceedings of the International Conference on Information Processing in Medical Imaging, Isle of Skye, UK, 28 June–3 July 2015; pp. 303–314. [Google Scholar]
- Wang, C.W.; Huang, S.C.; Lee, Y.C.; Shen, Y.J.; Meng, S.I.; Gaol, J.L. Deep learning for bone marrow cell detection and classification on whole-slide images. Med. Image Anal. 2022, 75, 102270. [Google Scholar] [CrossRef] [PubMed]
- Radford, A.; Metz, L.; Chintala, S. Unsupervised representation learning with deep convolutional generative adversarial networks. arXiv 2015, arXiv:1511.06434. [Google Scholar]
- Ma, L.; Shuai, R.; Ran, X.; Liu, W.; Ye, C. Combining DC-GAN with ResNet for blood cell image classification. Med. Biol. Eng. Comput. 2020, 58, 1251–1264. [Google Scholar] [CrossRef] [PubMed]
- Yao, S.; Tan, J.; Chen, Y.; Gu, Y. A weighted feature transfer gan for medical image synthesis. Mach. Vis. Appl. 2021, 32, 1–11. [Google Scholar] [CrossRef]
- Gozes, G.; Shkolyar, A.; Gefen, A.; Benayahu, D.; Greenspan, H. Harnessing generative adversarial networks to generate synthetic mitosis images for classification of cell images. In Proceedings of the Medical Imaging 2021, Digital Pathology, Online, 15–19 February 2021; International Society for Optics and Photonics: Washington, DC, USA, 2021; Volume 11603, p. 1160309. [Google Scholar]
- Halicek, M.; Ortega, S.; Fabelo, H.; Lopez, C.; Lejeune, M.; Callico, G.M.; Fei, B. Conditional generative adversarial network for synthesizing hyperspectral images of breast cancer cells from digitized histology. In Proceedings of the Medical Imaging 2020, Digital Pathology, Houston, TX, USA, 15–20 February 2020; International Society for Optics and Photonics: Washington, DC, USA, 2020; Volume 11320, p. 113200U. [Google Scholar]
- Ghorbani, A.; Natarajan, V.; Coz, D.; Liu, Y. Dermgan: Synthetic generation of clinical skin images with pathology. In Proceedings of the Machine Learning for Health Workshop, Vancouver, BC, Canada, 13 December 2019; pp. 155–170. [Google Scholar]
- Chaudhari, P.; Agrawal, H.; Kotecha, K. Data augmentation using MG-GAN for improved cancer classification on gene expression data. Soft Comput. 2020, 24, 11381–11391. [Google Scholar] [CrossRef]
- Odena, A.; Olah, C.; Shlens, J. Conditional image synthesis with auxiliary classifier gans. In Proceedings of the International Conference on Machine Learning, Sydney, Australia, 6–11 August 2017; pp. 2642–2651. [Google Scholar]
- Eonelab.co.kr, Molecular Diagnostic Research Center. 1983. Available online: https://www.eonelab.co.kr/global/en/main/main.asp (accessed on 15 October 2021).
- Acevedo, A.; Merino, A.; Alférez, S.; Molina, Á.; Boldú, L.; Rodellar, J. A dataset of microscopic peripheral blood cell images for development of automatic recognition systems. Data Brief 2020, 30, 105474. [Google Scholar] [CrossRef]
- Matek, C.; Schwarz, S.; Marr, C.; Spiekermann, K. A single-cell morphological dataset of leukocytes from AML patients and non-malignant controls (AML-Cytomorphology_LMU). The Cancer Imaging Archive (TCIA) [Internet]. 2019. Available online: https://wiki.cancerimagingarchive.net/pages/viewpage.action (accessed on 29 October 2019).
- Chen, X.; Duan, Y.; Houthooft, R.; Schulman, J.; Sutskever, I.; Abbeel, P. Infogan: Interpretable representation learning by information maximizing generative adversarial nets. In Proceedings of the 30th International Conference on Neural Information Processing Systems, Barcelona, Spain, 5–10 December 2016; pp. 2180–2188. [Google Scholar]
- Hu, B.; Tang, Y.; Eric, I.; Chang, C.; Fan, Y.; Lai, M.; Xu, Y. Unsupervised learning for cell-level visual representation in histopathology images with generative adversarial networks. IEEE J. Biomed. Health Inform. 2018, 23, 1316–1328. [Google Scholar] [CrossRef] [Green Version]
- Mirza, M.; Osindero, S. Conditional generative adversarial nets. arXiv 2014, arXiv:1411.1784. [Google Scholar]
- Xia, X.; Xu, C.; Nan, B. Inception-v3 for flower classification. In Proceedings of the 2017 2nd International Conference on Image, Vision and Computing (ICIVC), Chengdu, China, 2–4 June 2017; pp. 783–787. [Google Scholar]
- Liang, J. Image classification based on RESNET. J. Phys. Conf. Ser. 2020, 1634, 012110. [Google Scholar] [CrossRef]
- Kaur, T.; Gandhi, T.K. Automated brain image classification based on VGG-16 and transfer learning. In Proceedings of the 2019 International Conference on Information Technology (ICIT), Bhubaneswar, India, 19–21 December 2019; pp. 94–98. [Google Scholar]
- Sharma, N.; Jain, V.; Mishra, A. An analysis of convolutional neural networks for image classification. Procedia Comput. Sci. 2018, 132, 377–384. [Google Scholar] [CrossRef]
- Wu, X.; Liu, R.; Yang, H.; Chen, Z. An Xception Based Convolutional Neural Network for Scene Image Classification with Transfer Learning. In Proceedings of the 2020 2nd International Conference on Information Technology and Computer Application (ITCA), Guangzhou, China, 18–20 December 2020; pp. 262–267. [Google Scholar]
- Bansal, M.; Kumar, M.; Sachdeva, M.; Mittal, A. Transfer learning for image classification using VGG19: Caltech-101 image data set. J. Ambient Intell. Hum. Comput. 2021, 12, 1–12. [Google Scholar] [CrossRef] [PubMed]
- Lucic, M.; Kurach, K.; Michalski, M.; Gelly, S.; Bousquet, O. Are gans created equal? a large-scale study. arXiv 2017, arXiv:1711.10337. [Google Scholar]
- Kynkäänniemi, T.; Karras, T.; Laine, S.; Lehtinen, J.; Aila, T. Improved precision and recall metric for assessing generative models. arXiv 2019, arXiv:1904.06991. [Google Scholar]


| Cell Type | Number of Images | Dataset-1 | Dataset-2 | Dataset-3 |
|---|---|---|---|---|
| Basophil | 1224 | 570 | 420 | 234 |
| Eosinophil | 3538 | 1061 | 1356 | 1121 |
| Erythroblast | 1547 | 540 | 500 | 507 |
| Immature Grannulocytes | 2881 | 1266 | 1615 | N/A |
| Lymphocyte | 1213 | N/A | 1213 | N/A |
| Lymphocyte Atypical | 7 | 4 | N/A | 3 |
| Lymphocyte Typical | 3818 | 1790 | N/A | 2028 |
| Metamyelocyte | 13 | 8 | N/A | 5 |
| Monoblast | 26 | 14 | N/A | 12 |
| Monocyte | 2583 | 912 | 1013 | 658 |
| Myeloblast | 3104 | 1246 | N/A | 1858 |
| Myelocyte | 39 | 22 | N/A | 17 |
| Neutrophil | 3316 | N/A | 3316 | N/A |
| Neutrophil Band | 82 | 42 | N/A | 40 |
| Neutrophil Segmented | 7346 | 3588 | N/A | 3758 |
| Platelet | 2339 | 1650 | 689 | N/A |
| Promyelocyte | 69 | 26 | N/A | 43 |
| Promyelocyte Bilobed | 18 | 10 | N/A | 8 |
| Smudge Cells | 15 | 7 | N/A | 8 |
| Cell Type | Number of Images |
|---|---|
| Basophil | 1224 |
| Eosinophil | 3538 |
| Erythroblast | 1547 |
| Immature Grannulocytes | 2933 |
| Lymphocyte | 5038 |
| Monoblast | 26 |
| Monocyte | 2583 |
| Myeloblast | 3104 |
| Neutrophil | 10,743 |
| Platelet | 2339 |
| Promyelocyte | 87 |
| Smudge Cells | 15 |
| Models | IS | FID | LPIPS | Precision | Recall | F1 |
|---|---|---|---|---|---|---|
| AC-GAN | 8.34 ± 0.89 | 76.3 | 0.34 | 94.37 | 94.01 | 94.13 |
| WGAN | 9.67 ± 0.25 | 72.3 | 0.31 | 94.58 | 94.57 | 93.06 |
| WGAN-GP | 10.06 ± 0.03 | 71.1 | 0.29 | 96.72 | 95.38 | 95.11 |
| InfoGAN | 9.12 ± 0.37 | 73.9 | 0.32 | 94.01 | 94.83 | 94.92 |
| WGAN-GP-Info | 9.94 ± 0.71 | 73.1 | 0.33 | 94.49 | 95.03 | 94.02 |
| DCGAN | 9.89 ± 0.28 | 73.4 | 0.31 | 95.66 | 94.91 | 95.50 |
| CGAN | 9.01 ± 0.77 | 75.2 | 0.34 | 93.01 | 93.48 | 92.99 |
| WGAN-GP-AC | 12.36 ± 0.41 | 67.2 | 0.25 | 96.83 | 96.09 | 96.32 |
| Models | l1 Error | l2 Error | PSNR | SSIM |
|---|---|---|---|---|
| AC-GAN | 13.9% | 6.3% | 30.73 | 0.8762 |
| WGAN | 12.8% | 5.1% | 32.61 | 0.9135 |
| WGAN-GP | 12.6% | 5.4% | 31.42 | 0.9172 |
| InfoGAN | 11.9% | 5.7% | 31.67 | 0.9288 |
| WGAN-GP-Info | 12.3% | 5.2% | 31.89 | 0.9061 |
| DCGAN | 12.7% | 6.1% | 32.77 | 0.9258 |
| CGAN | 14.3% | 6.7% | 32.33 | 0.9378 |
| WGAN-GP-AC | 9.8% | 4.2% | 36.71 | 0.9616 |
| Classification Models | Original Data Precision | Recall | Synthetic Data Precision | Recall |
|---|---|---|---|---|
| InceptionV3 | 0.93 | 0.92 | 0.95 | 0.96 |
| ResNet | 0.87 | 0.89 | 0.9 | 0.91 |
| VGG16 | 0.93 | 0.9 | 0.94 | 0.93 |
| CNN | 0.86 | 0.88 | 0.89 | 0.91 |
| Xception | 0.88 | 0.89 | 0.92 | 0.92 |
| VGG19 | 0.91 | 0.91 | 0.94 | 0.96 |
| Classification | Augmention-1 | Augmentation-2 | Augmentation-3 | Original + Synthetic | ||||
|---|---|---|---|---|---|---|---|---|
| Models | Precision | Recall | Precision | Recall | Precision | Recall | Precision | Recall |
| InceptionV3 | 0.94 | 0.93 | 0.93 | 0.92 | 0.94 | 0.94 | 0.93 | 0.94 |
| ResNet | 0.88 | 0.87 | 0.89 | 0.88 | 0.86 | 0.85 | 0.89 | 0.90 |
| VGG16 | 0.91 | 0.92 | 0.90 | 0.89 | 0.90 | 0.90 | 0.92 | 0.90 |
| CNN | 0.87 | 0.88 | 0.86 | 0.85 | 0.85 | 0.84 | 0.87 | 0.89 |
| Xception | 0.89 | 0.87 | 0.87 | 0.86 | 0.90 | 0.89 | 0.89 | 0.90 |
| VGG19 | 0.90 | 0.88 | 0.89 | 0.88 | 0.90 | 0.91 | 0.92 | 0.93 |
Publisher’s Note: MDPI stays neutral with regard to jurisdictional claims in published maps and institutional affiliations. |
© 2022 by the authors. Licensee MDPI, Basel, Switzerland. This article is an open access article distributed under the terms and conditions of the Creative Commons Attribution (CC BY) license (https://creativecommons.org/licenses/by/4.0/).
Share and Cite
Hazra, D.; Byun, Y.-C.; Kim, W.J.; Kang, C.-U. Synthesis of Microscopic Cell Images Obtained from Bone Marrow Aspirate Smears through Generative Adversarial Networks. Biology 2022, 11, 276. https://doi.org/10.3390/biology11020276
Hazra D, Byun Y-C, Kim WJ, Kang C-U. Synthesis of Microscopic Cell Images Obtained from Bone Marrow Aspirate Smears through Generative Adversarial Networks. Biology. 2022; 11(2):276. https://doi.org/10.3390/biology11020276
Chicago/Turabian StyleHazra, Debapriya, Yung-Cheol Byun, Woo Jin Kim, and Chul-Ung Kang. 2022. "Synthesis of Microscopic Cell Images Obtained from Bone Marrow Aspirate Smears through Generative Adversarial Networks" Biology 11, no. 2: 276. https://doi.org/10.3390/biology11020276
APA StyleHazra, D., Byun, Y.-C., Kim, W. J., & Kang, C.-U. (2022). Synthesis of Microscopic Cell Images Obtained from Bone Marrow Aspirate Smears through Generative Adversarial Networks. Biology, 11(2), 276. https://doi.org/10.3390/biology11020276