Modeling COVID-19 Incidence by the Renewal Equation after Removal of Administrative Bias and Noise
Abstract
:Simple Summary
Abstract
1. Introduction
- a computation of the reproduction number ;
- a correction of the weekend and festive days bias on ;
- a verification that the difference between the observed incidence curve after bias correction and its expected value using the renewal equation is a white noise, the parameters of which can be estimated.
- Based on the case renewal equation, we propose a new variational model which estimate:
- A time varying reproduction number
- A restored incidence curve with the weekly and festive day biases corrected.
- The weekly seasonality profile of the incidence curve.
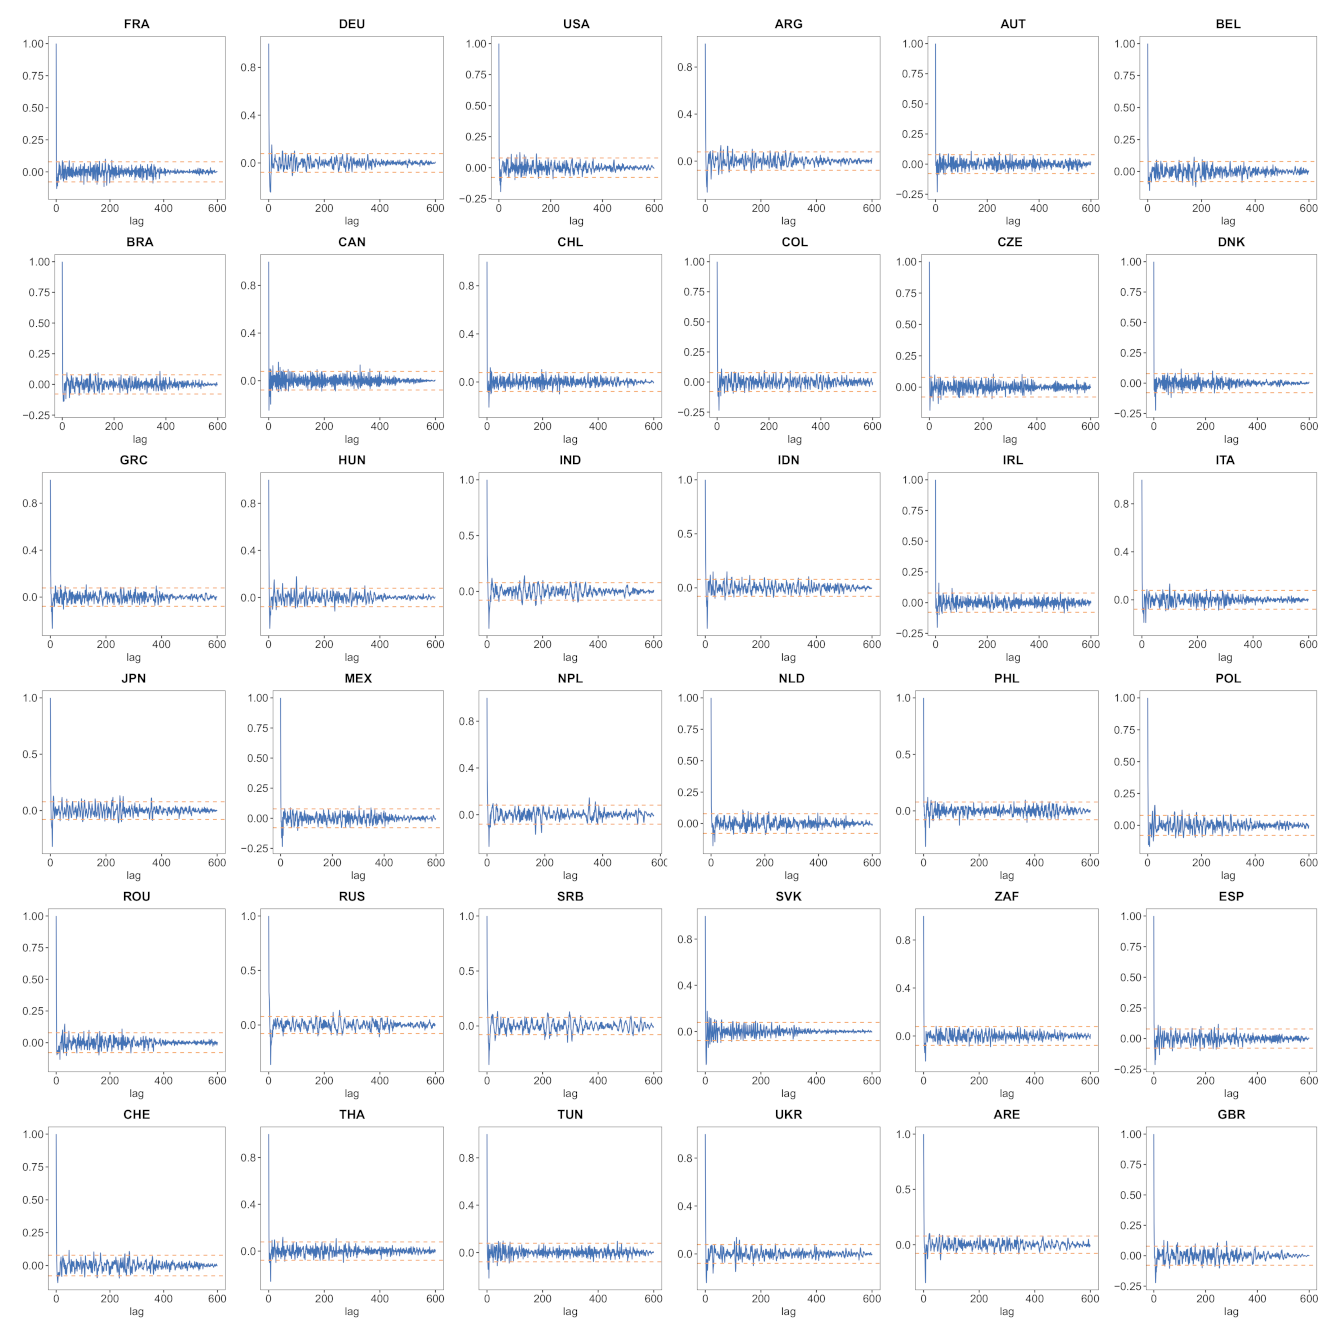
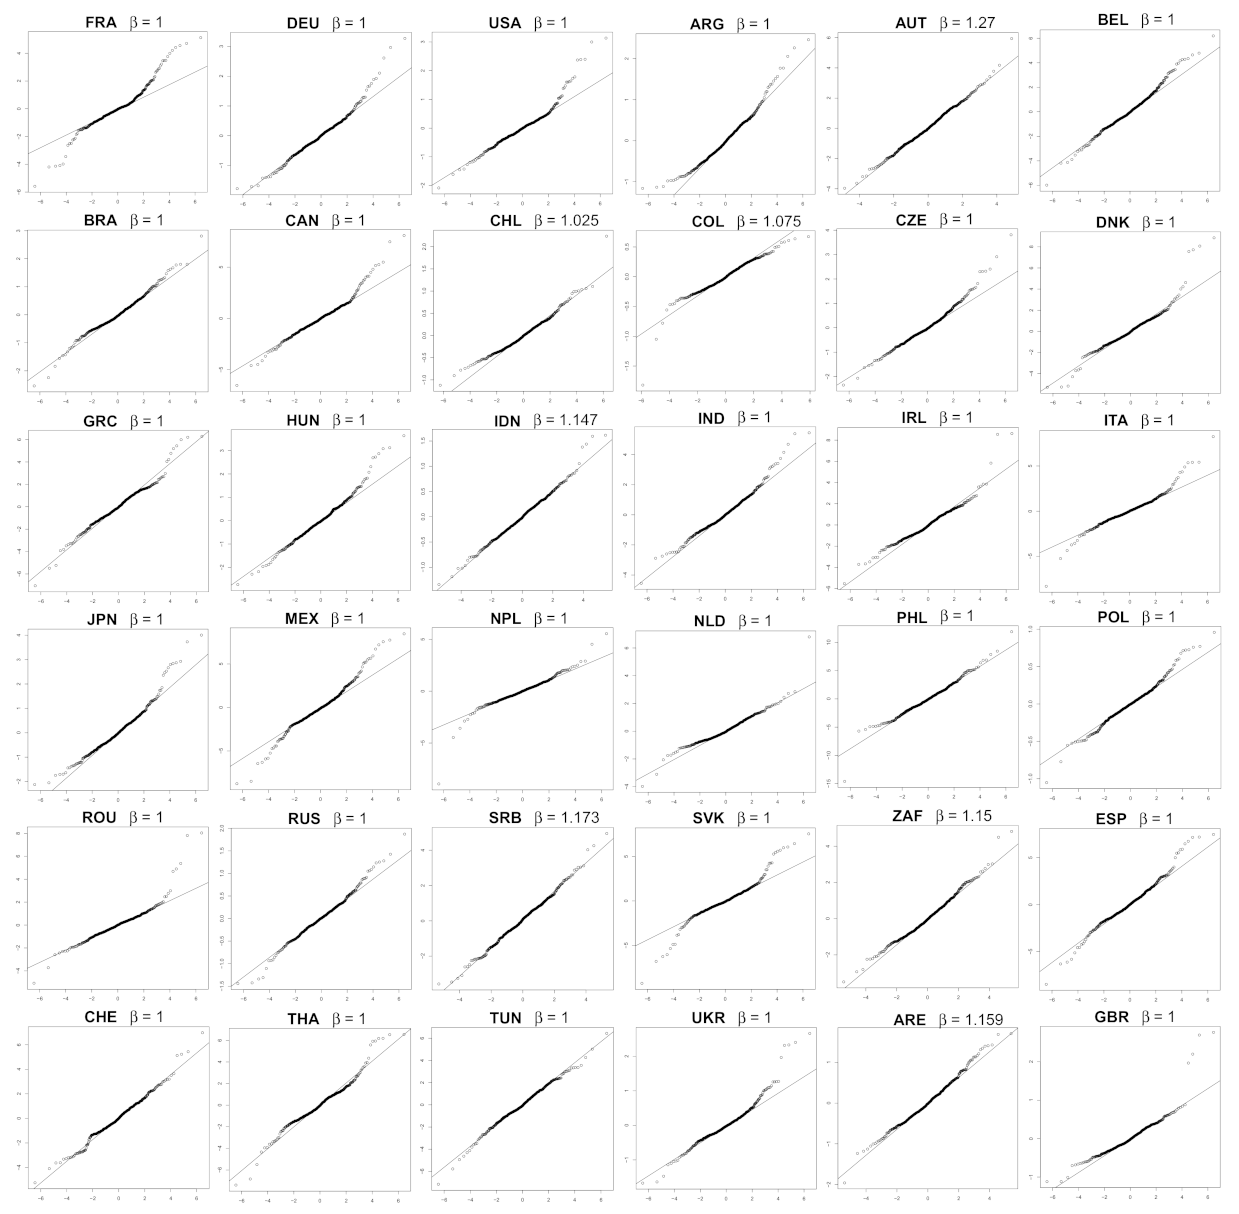
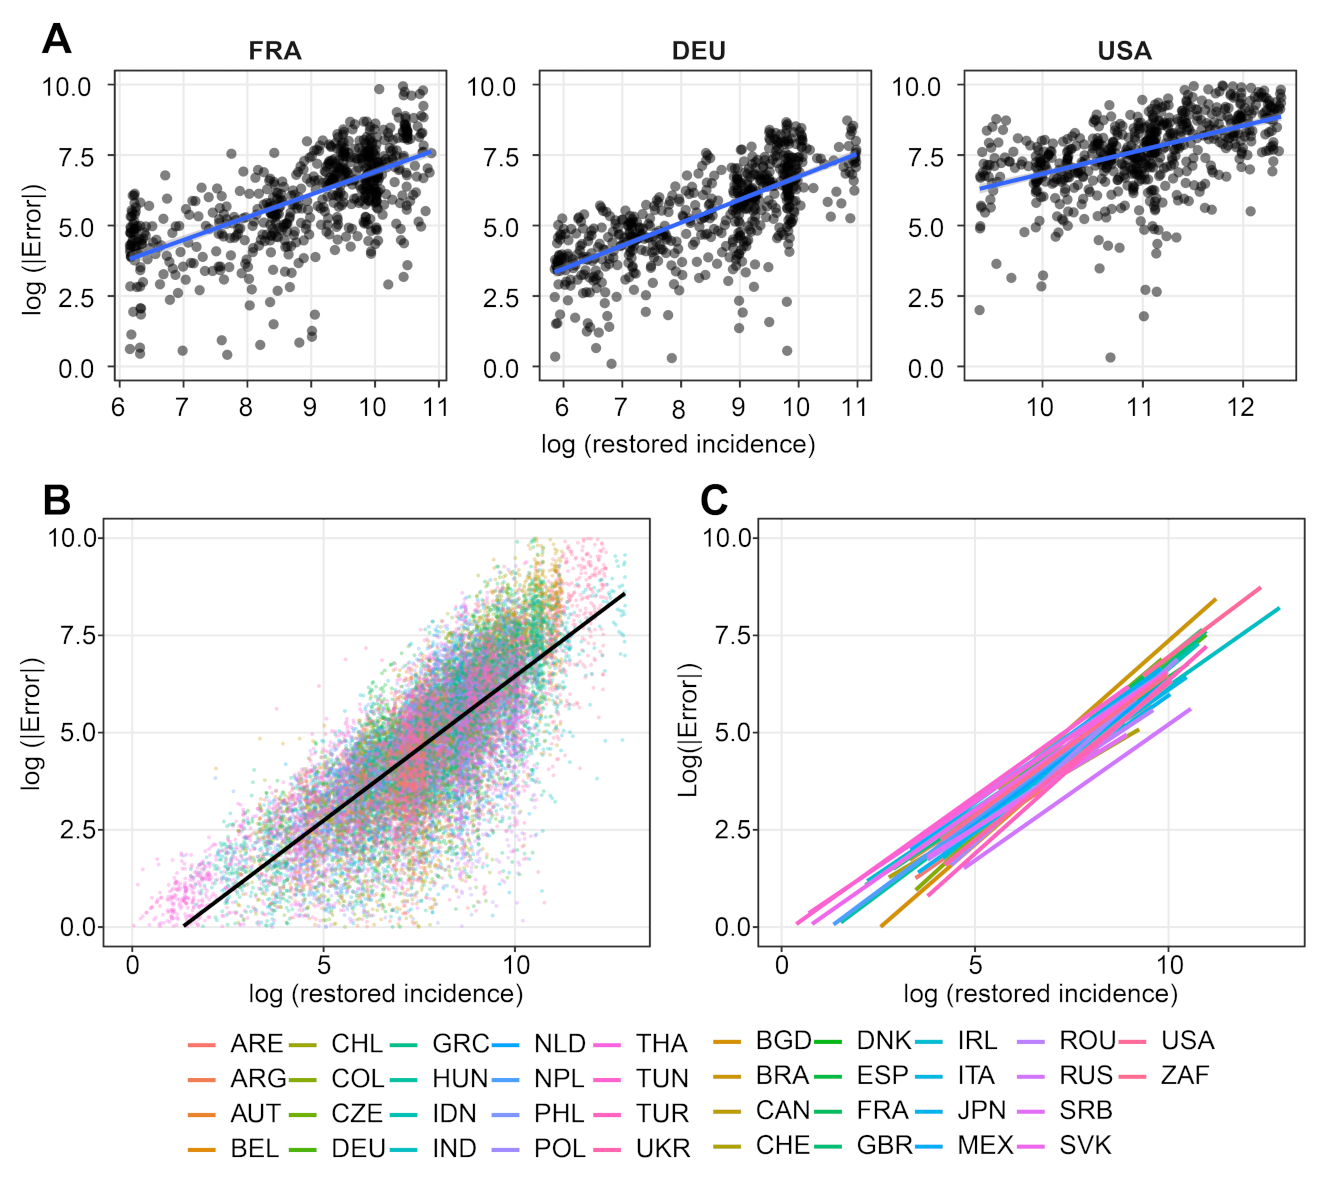
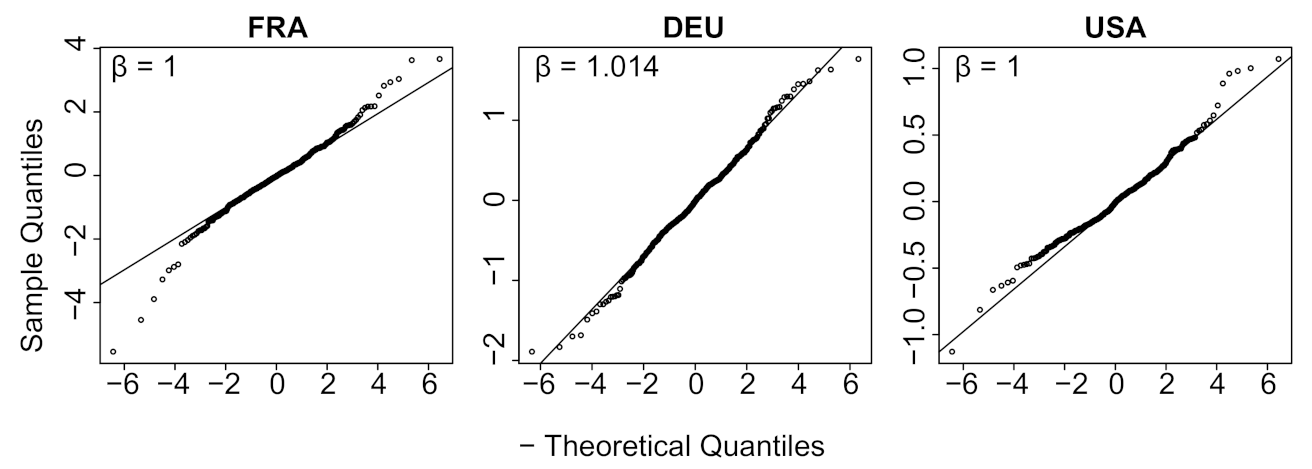
- We verify experimentally, on many countries, that, once the weekly and festive days biases have been corrected, the difference between the incidence curve and its expected value using the renewal equation is well approximated by an exponential distributed white noise multiplied by a power of the magnitude of the restored incidence curve.
2. The Proposed Variational Model
3. Results
4. Discussion of Previous Models
4.1. The Fraser Renewal Equation
4.2. Deterministic Implementations Using Fraser’s Renewal Equation and Other Models
4.3. Stochastic Observation Models for and
5. Conclusions
Author Contributions
Funding
Institutional Review Board Statement
Informed Consent Statement
Data Availability Statement
Conflicts of Interest
Appendix A


| Country | Mean | Std | Location | Scale | Shape () |
|---|---|---|---|---|---|
| Exponential | Exponential | Exponential | |||
| FRA * | −0.0283 | 0.8290 | −0.0286 | 0.5394 | 1.0000 |
| DEU * | −0.0178 | 0.4785 | −0.0135 | 0.3433 | 1.0144 |
| USA * | −0.0044 | 0.2169 | −0.0059 | 0.1537 | 1.0000 |
| FRA | 0.0109 | 1.0024 | −0.0316 | 0.6026 | 1.0000 |
| DEU | 0.0091 | 0.5143 | 0.0050 | 0.3458 | 1.0000 |
| USA | 0.0032 | 0.4779 | −0.0097 | 0.3003 | 1.0000 |
| ARG | 0.0025 | 0.4430 | −0.0286 | 0.3153 | 1.0000 |
| AUT | 0.0419 | 1.1030 | −0.0041 | 0.9035 | 1.2701 |
| BEL | 0.0413 | 1.2175 | −0.0366 | 0.8304 | 1.0000 |
| BRA | −0.0018 | 0.4825 | −0.0368 | 0.3312 | 1.0000 |
| CAN | 0.0068 | 1.2720 | −0.0252 | 0.8290 | 1.0000 |
| CHL | 0.0019 | 0.2960 | −0.0082 | 0.2138 | 1.0252 |
| COL | −0.0026 | 0.2006 | −0.0107 | 0.1490 | 1.0751 |
| CZE | 0.0116 | 0.5671 | −0.0415 | 0.3755 | 1.0000 |
| DNK | 0.0278 | 1.2446 | −0.0298 | 0.8126 | 1.0000 |
| GRC | 0.0218 | 1.2764 | −0.0410 | 0.8847 | 1.0000 |
| HUN | 0.0069 | 0.6600 | −0.0267 | 0.4410 | 1.0000 |
| IND | 0.0419 | 0.9891 | −0.0084 | 0.6786 | 1.0000 |
| IDN | −0.0015 | 0.3374 | −0.0140 | 0.2607 | 1.1466 |
| IRL | 0.0030 | 1.1778 | −0.0748 | 0.8252 | 1.0000 |
| ITA | 0.0368 | 1.1441 | 0.0141 | 0.7130 | 1.0000 |
| JPN | 0.0243 | 0.6647 | −0.0254 | 0.4515 | 1.0000 |
| MEX | −0.0318 | 1.7329 | −0.0955 | 1.1091 | 1.0000 |
| NPL | 0.0035 | 0.8994 | 0.0005 | 0.5652 | 1.0000 |
| NLD | 0.0437 | 0.7185 | −0.0404 | 0.4910 | 1.0000 |
| PHL | −0.0196 | 2.0401 | −0.0930 | 1.4011 | 1.0000 |
| POL | −0.0017 | 0.1911 | −0.0043 | 0.1268 | 1.0000 |
| ROU | 0.0063 | 0.9465 | −0.0011 | 0.5798 | 1.0000 |
| RUS | 0.0107 | 0.3383 | 0.0066 | 0.2270 | 1.0000 |
| SRB | 0.0675 | 1.0140 | 0.0758 | 0.7932 | 1.1728 |
| SVK | 0.0024 | 1.3671 | −0.0778 | 0.8194 | 1.0000 |
| ZAF | 0.0139 | 0.9110 | −0.0320 | 0.7059 | 1.1497 |
| ESP | 0.0637 | 1.6068 | −0.0047 | 1.0840 | 1.0000 |
| CHE | 0.0528 | 1.2228 | 0.0017 | 0.8667 | 1.0000 |
| THA | 0.0299 | 1.3738 | −0.0312 | 0.9374 | 1.0000 |
| TUN | 0.0123 | 1.3033 | −0.0845 | 0.9224 | 1.0000 |
| UKR | 0.0034 | 0.4117 | −0.0215 | 0.2586 | 1.0000 |
| ARE | 0.0108 | 0.4192 | −0.0127 | 0.3265 | 1.1588 |
| GBR | 0.0085 | 0.3304 | −0.0171 | 0.2163 | 1.0000 |
| Country | a | b | p-Value | Country | a | b | p-Value |
|---|---|---|---|---|---|---|---|
| FRA * | 0.8074272 | −1.164141 | 2.01 × 10 | FRA | 0.8136197 | −1.1710322 | 2.76 × 10 |
| DEU * | 0.8233846 | −1.496739 | 5.99 × 10 | DEU | 0.8235076 | −1.5057318 | 3.01 × 10 |
| USA * | 0.9076139 | −2.264255 | 3.16 × 10 | USA | 0.8638492 | −1.7287377 | 6.37 × 10 |
| ARG | 0.8340299 | −1.5574878 | 1.71 × 10 | AUT | 0.6628437 | −0.5661912 | 3.45 × 10 |
| BGD | 0.9104934 | −2.5672893 | 6.14 × 10 | BEL | 0.7184413 | −0.6589731 | 3.65 × 10 |
| BRA | 0.8906214 | −1.536314 | 1.03 × 10 | CAN | 0.7240632 | −0.6726824 | 2.96 × 10 |
| CHL | 0.8349688 | −1.9543089 | 2.64 × 10 | COL | 0.9175985 | −2.2638884 | 3.03 × 10 |
| CZE | 0.8520268 | −1.4708978 | 2.88 × 10 | DNK | 0.6900743 | −0.6284769 | 2.78 × 10 |
| GRC | 0.6555842 | −0.5683038 | 2.58 × 10 | HUN | 0.7838904 | −1.3618843 | 4.47 × 10 |
| IND | 0.7042499 | −0.8457334 | 8.20 × 10 | IDN | 0.8406915 | −1.7674138 | 5.30 × 10 |
| IRL | 0.7043354 | −0.5484242 | 1.35 × 10 | ITA | 0.6964125 | −0.8659193 | 2.53 × 10 |
| JPN | 0.7222903 | −1.2445353 | 5.65 × 10 | MEX | 0.725394 | −0.4661005 | 1.76 × 10 |
| NPL | 0.7548857 | −1.0559482 | 1.42 × 10 | NLD | 0.7494921 | −1.1280471 | 3.35 × 10 |
| PHL | 0.6715338 | −0.1103984 | 1.90 × 10 | POL | 0.9306078 | −2.6041615 | 3.02 × 10 |
| ROU | 0.6920366 | −1.0282145 | 4.11 × 10 | RUS | 0.7212814 | −2.0048746 | 4.05 × 10 |
| SRB | 0.628712 | −0.65103 | 6.76 × 10 | SVK | 0.7381511 | −0.7853881 | 8.53 × 10 |
| ZAF | 0.7275793 | −0.7811203 | 9.48 × 10 | ESP | 0.6806819 | −0.3916179 | 2.03 × 10 |
| CHE | 0.6138378 | −0.5491828 | 1.38 × 10 | THA | 0.7110685 | −0.4672682 | 1.63 × 10 |
| TUN | 0.7539949 | −0.503523 | 3.03 × 10 | TUR | 0.8998264 | −2.658924 | 1.32 × 10 |
| UKR | 0.8172308 | −1.8996555 | 1.75 × 10 | ARE | 0.7511088 | −1.5460453 | 3.80 × 10 |
| GBR | 0.8705096 | −1.9395546 | 1.70 × 10 | World | 0.7631129 | −1.1389749 | 0.00 |
| Brownian | −1.0155743 | 13.3969412 | 0.0844 |


References
- Lotka, A.J. Relation between birth rates and death rates. Science 1907, 26, 21–22. [Google Scholar] [CrossRef] [PubMed]
- Wallinga, J.; Teunis, P. Different epidemic curves for severe acute respiratory syndrome reveal similar impacts of control measures. Am. J. Epidemiol. 2004, 160, 509–516. [Google Scholar] [CrossRef] [PubMed] [Green Version]
- Cori, A.; Ferguson, N.M.; Fraser, C.; Cauchemez, S. A new framework and software to estimate time-varying reproduction numbers during epidemics. Am. J. Epidemiol. 2013, 178, 1505–1512. [Google Scholar] [CrossRef] [PubMed] [Green Version]
- Ma, S.; Zhang, J.; Zeng, M.; Yun, Q.; Guo, W.; Zheng, Y.; Zhao, S.; Wang, M.H.; Yang, Z. Epidemiological parameters of coronavirus disease 2019: A pooled analysis of publicly reported individual data of 1155 cases from seven countries. medRxiv 2020. [Google Scholar] [CrossRef]
- Nishiura, H. Time variations in the transmissibility of pandemic influenza in Prussia, Germany, from 1918–19. Theor. Biol. Med. Model. 2007, 4, 20. [Google Scholar] [CrossRef] [Green Version]
- Nishiura, H.; Chowell, G. The Effective Reproduction Number as a Prelude to Statistical Estimation of Time-Dependent Epidemic Trends. In Mathematical and Statistical Estimation Approaches in Epidemiology; Chowell, G., Hyman, J.M., Bettencourt, L.M.A., Castillo-Chavez, C., Eds.; Springer: Dordrecht, The Netherlands, 2009; pp. 103–121. [Google Scholar]
- Alvarez, L.; Colom, M.; Morel, J.D.; Morel, J.M. Computing the daily reproduction number of COVID-19 by inverting the renewal equation using a variational technique. Proc. Natl. Acad. Sci. USA 2021, 118, e2105112118. [Google Scholar] [CrossRef]
- Thompson, R.; Stockwin, J.; van Gaalen, R.D.; Polonsky, J.; Kamvar, Z.; Demarsh, P.; Dahlqwist, E.; Li, S.; Miguel, E.; Jombart, T.; et al. Improved inference of time-varying reproduction numbers during infectious disease outbreaks. Epidemics 2019, 29, 100356. [Google Scholar] [CrossRef]
- Liu, Q.H.; Ajelli, M.; Aleta, A.; Merler, S.; Moreno, Y.; Vespignani, A. Measurability of the epidemic reproduction number in data-driven contact networks. Proc. Natl. Acad. Sci. USA 2018, 115, 12680–12685. [Google Scholar] [CrossRef] [Green Version]
- Obadia, T.; Haneef, R.; Boëlle, P.Y. The R0 package: A toolbox to estimate reproduction numbers for epidemic outbreaks. BMC Med. Informatics Decis. Mak. 2012, 12, 147. [Google Scholar] [CrossRef]
- Alvarez, L.; Colom, M.; Morel, J.D.; Morel, J.M. EpiInvert Online Interface, IPOL: Image Processing On Line. Available online: http://www.ctim.es/epiinvert (accessed on 9 December 2021).
- Tikhonov, A.N.; Arsenin, V.Y. Solutions of Ill-Posed Problems; Wiley: New York, NY, USA, 1977. [Google Scholar]
- Benning, M.; Burger, M. Modern regularization methods for inverse problems. Acta Numer. 2018, 27, 1–111. [Google Scholar] [CrossRef] [Green Version]
- Hyndman, R.; Athanasopoulos, G. Forecasting: Principles and Practice, 2nd ed.; OTexts: Melbourne, Australia, 2018; ISBN 1886529043. Available online: OTexts.com/fpp2 (accessed on 9 December 2021).
- Government of France. Informations COVID-19, Carte et Données. Available online: https://www.gouvernement.fr/info-coronavirus/carte-et-donnees (accessed on 9 December 2021).
- Robert Koch-Institut. COVID-19-Dashboard. Available online: https://experience.arcgis.com/experience/478220a4c454480e823b17327b2bf1d4 (accessed on 9 December 2021).
- Spanish Goverment. Situación actual COVID-19. Available online: https://www.sanidad.gob.es/en/profesionales/saludPublica/ccayes/alertasActual/nCov/situacionActual.htm (accessed on 9 December 2021).
- Ritchie, H.; Ritchie, H.; Mathieu, E.; Rodés-Guirao, L.; Appel, C.; Giattino, C.; Ortiz-Ospina, E.; Hasell, J.; Macdonald, B.; Beltekian, D.; et al. Coronavirus Pandemic (COVID-19), OurWorldInData.org. Available online: https://ourworldindata.org/coronavirus-source-data (accessed on 9 December 2021).
- Mineo, A.M. On the estimation of the structure parameter of a normal distribution of order p. Statistica 2003, 63, 109–122. [Google Scholar] [CrossRef]
- Demongeot, J.; Oshinubi, K.; Seligmann, H.; Thuderoz, F. Estimation of Daily Reproduction rates in COVID-19 Outbreak. medRxiv 2021. [Google Scholar] [CrossRef]
- Fraser, C. Estimating Individual and Household Reproduction Numbers in an Emerging Epidemic. PLoS ONE 2007, 2, e758. [Google Scholar] [CrossRef]
- Knight, J.; Mishra, S. Estimating effective reproduction number using generation time versus serial interval, with application to COVID-19 in the Greater Toronto Area, Canada. Infect. Dis. Model. 2020, 5, 889–896. [Google Scholar] [CrossRef]
- Bonifazi, G.; Lista, L.; Menasce, D.; Mezzetto, M.; Pedrini, D.; Spighi, R.; Zoccoli, A. A simplified estimate of the effective reproduction number R_t R t using its relation with the doubling time and application to Italian COVID-19 data. Eur. Phys. J. Plus 2021, 136, 1–14. [Google Scholar] [CrossRef] [PubMed]
- Flaxman, S.; Mishra, S.; Gandy, A.; Unwin, H.J.T.; Coupland, H.; Mellan, T.A.; Zhu, H.; Berah, T.; Eaton, J.W.; Guzman, P.N.P.; et al. Estimating the Number of Infections and the Impact of Nonpharmaceutical Interventions on COVID-19 in 11 European Countries. Imperial College COVID-19 Response Team. Available online: https://www.imperial.ac.uk/media/imperial-college/medicine/sph/ide/gida-fellowships/Imperial-College-COVID19-Europe-estimates-and-NPI-impact-30-03-2020.pdf (accessed on 30 September 2020).
- Koyama, S.; Horie, T.; Shinomoto, S. Estimating the time-varying reproduction number of COVID-19 with a state-space method. PLoS Comput. Biol. 2021, 17, e1008679. [Google Scholar] [CrossRef] [PubMed]
- Drewes, H.; Flaeschner, G.; Moeller, P. Improving the reproduction number calculation by treating for daily variations of SARS-CoV-2 cases. medRxiv 2021. [Google Scholar] [CrossRef]
- Tao, Y. Maximum entropy method for estimating the reproduction number: An investigation for COVID-19 in China and the United States. Phys. Rev. E 2020, 102, 032136. [Google Scholar] [CrossRef]
- Wang, K.; Zhao, S.; Li, H.; Song, Y.; Wang, L.; Wang, M.H.; Peng, Z.; Li, H.; He, D. Real-time estimation of the reproduction number of the novel coronavirus disease (COVID-19) in China in 2020 based on incidence data. Ann. Transl. Med. 2020, 8, 689. [Google Scholar] [CrossRef]
- Shapiro, M.B.; Karim, F.; Muscioni, G.; Augustine, A.S. Adaptive Susceptible-Infectious-Removed Model for Continuous Estimation of the COVID-19 Infection Rate and Reproduction Number in the United States: Modeling Study. J. Med. Int. Res. 2021, 23, e24389. [Google Scholar] [CrossRef]
- Boulmezaoud, T.Z.; Alvarez, L.; Colom, M.; Morel, J.M. A Daily Measure of the SARS-CoV-2 Effective Reproduction Number for all Countries. Image Process. Line 2020, 10, 191–210. [Google Scholar] [CrossRef]
- Gostic, K.M.; McGough, L.; Baskerville, E.B.; Abbott, S.; Joshi, K.; Tedijanto, C.; Kahn, R.; Niehus, R.; Hay, J.A.; De Salazar, P.M.; et al. Practical considerations for measuring the effective reproductive number, Rt. PLoS Comput. Biol. 2020, 16, e1008409. [Google Scholar] [CrossRef] [PubMed]
- You, C.; Deng, Y.; Hu, W.; Sun, J.; Lin, Q.; Zhou, F.; Pang, C.H.; Zhang, Y.; Chen, Z.; Zhou, X.H. Estimation of the time-varying reproduction number of COVID-19 outbreak in China. Int. J. Hyg. Environ. Health 2020, 228, 113555. [Google Scholar] [CrossRef] [PubMed]
- Chintalapudi, N.; Battineni, G.; Sagaro, G.G.; Amenta, F. COVID-19 outbreak reproduction number estimations and forecasting in Marche, Italy. Int. J. Infect. Dis. 2020, 96, 327–333. [Google Scholar] [CrossRef]
- Hong, H.G.; Li, Y. Estimation of time-varying reproduction numbers underlying epidemiological processes: A new statistical tool for the COVID-19 pandemic. PLoS ONE 2020, 15, e0236464. [Google Scholar] [CrossRef]
- Salas, J. Improving the estimation of the COVID-19 effective reproduction number using nowcasting. Stat. Methods Med. Res. 2021, 30, 2075–2084. [Google Scholar] [CrossRef]
- Pascal, B.; Abry, P.; Pustelnik, N.; Roux, S.G.; Gribonval, R.; Flandrin, P. Nonsmooth convex optimization to estimate the COVID-19 reproduction number space-time evolution with robustness against low quality data. arXiv 2021, arXiv:2109.09595. [Google Scholar]
- Abry, P.; Pustelnik, N.; Roux, S.; Jensen, P.; Flandrin, P.; Gribonval, R.; Lucas, C.G.; Guichard, É.; Borgnat, P.; Garnier, N. Spatial and temporal regularization to estimate COVID-19 reproduction number R (t): Promoting piecewise smoothness via convex optimization. PLoS ONE 2020, 15, e0237901. [Google Scholar] [CrossRef]
- Parag, K.V. Improved estimation of time-varying reproduction numbers at low case incidence and between epidemic waves. PLoS Comput. Biol. 2021, 17, e1009347. [Google Scholar] [CrossRef]
- Mee, P.; Alexander, N.; Mayaud, P.; Gonzalez, F.d.J.C.; Abbott, S.; de Souza Santos, A.A.; Acosta, A.L.; Parag, K.V.; Pereira, R.H.; Prete, C.A., Jr.; et al. Tracking the emergence of disparities in the subnational spread of COVID-19 in Brazil using an online application for real-time data visualisation: A longitudinal analysis. Lancet Reg.-Health-Am. 2021, 5. [Google Scholar] [CrossRef]
- Jung, S.m.; Endo, A.; Akhmetzhanov, A.R.; Nishiura, H. Predicting the effective reproduction number of COVID-19: Inference using human mobility, temperature, and risk awareness. Int. J. Infect. Dis. 2021, 113, 47–54. [Google Scholar] [CrossRef] [PubMed]
- Abbott, S.; Hellewell, J.; Thompson, R.N.; Sherratt, K.; Gibbs, H.P.; Bosse, N.I.; Munday, J.D.; Meakin, S.; Doughty, E.L.; Chun, J.Y.; et al. Estimating the time-varying reproduction number of SARS-CoV-2 using national and subnational case counts. Wellcome Open Res. 2020, 5, 112. [Google Scholar] [CrossRef]
- Sherratt, K.; Abbott, S.; Meakin, S.R.; Hellewell, J.; Munday, J.D.; Bosse, N.; CMMID COVID-19 Working Group; Jit, M.; Funk, S. Exploring surveillance data biases when estimating the reproduction number: With insights into subpopulation transmission of COVID-19 in England. Philos. Trans. R. Soc. B 2021, 376, 20200283. [Google Scholar] [CrossRef] [PubMed]
- Karnakov, P.; Arampatzis, G.; Kičić, I.; Wermelinger, F.; Wälchli, D.; Papadimitriou, C.; Koumoutsakos, P. Data-driven inference of the reproduction number for COVID-19 before and after interventions for 51 European countries. Swiss Med. Wkly. 2020, 150, w20313. [Google Scholar] [CrossRef] [PubMed]
- Cazelles, B.; Champagne, C.; Nguyen-Van-Yen, B.; Comiskey, C.; Vergu, E.; Roche, B. A mechanistic and data-driven reconstruction of the time-varying reproduction number: Application to the COVID-19 epidemic. PLoS Comput. Biol. 2021, 17, e1009211. [Google Scholar] [CrossRef]
- Mellan, T.A.; Hoeltgebaum, H.H.; Mishra, S.; Whittaker, C.; Schnekenberg, R.P.; Gandy, A.; Unwin, H.J.T.; Vollmer, M.A.; Coupland, H.; Hawryluk, I.; et al. Subnational analysis of the COVID-19 epidemic in Brazil. MedRxiv 2020. [Google Scholar] [CrossRef]


Publisher’s Note: MDPI stays neutral with regard to jurisdictional claims in published maps and institutional affiliations. |
© 2022 by the authors. Licensee MDPI, Basel, Switzerland. This article is an open access article distributed under the terms and conditions of the Creative Commons Attribution (CC BY) license (https://creativecommons.org/licenses/by/4.0/).
Share and Cite
Alvarez, L.; Morel, J.-D.; Morel, J.-M. Modeling COVID-19 Incidence by the Renewal Equation after Removal of Administrative Bias and Noise. Biology 2022, 11, 540. https://doi.org/10.3390/biology11040540
Alvarez L, Morel J-D, Morel J-M. Modeling COVID-19 Incidence by the Renewal Equation after Removal of Administrative Bias and Noise. Biology. 2022; 11(4):540. https://doi.org/10.3390/biology11040540
Chicago/Turabian StyleAlvarez, Luis, Jean-David Morel, and Jean-Michel Morel. 2022. "Modeling COVID-19 Incidence by the Renewal Equation after Removal of Administrative Bias and Noise" Biology 11, no. 4: 540. https://doi.org/10.3390/biology11040540
APA StyleAlvarez, L., Morel, J.-D., & Morel, J.-M. (2022). Modeling COVID-19 Incidence by the Renewal Equation after Removal of Administrative Bias and Noise. Biology, 11(4), 540. https://doi.org/10.3390/biology11040540


