
Understanding the Mechanism of Diabetes Mellitus in a LRBA-Deficient Patient

 , ,
, ,  ,
, 
Abstract
:Simple Summary
Abstract
1. Introduction
2. Materials and Methods
2.1. Patient Recruitment
2.2. RNA Extraction and Sequencing
2.3. Data Analysis, Visualization, and Interpretation for RNA-Seq
2.4. Peripheral Blood Mononuclear Cells (PBMCs) Isolation
2.5. Antibodies
2.6. Western Blotting
2.7. CTLA-4 Stimulation and Expression Using Flowcytometry
2.8. MIN6 Cell Culture
2.9. RNA Extraction from MIN6 Cells and cDNA Synthesis
2.10. Transient Knockdown of MIN6 by Small Interfering RNA (siRNA) Transfection
2.11. Insulin Secretion Assay in MIN6
2.12. qRT-PCR
2.13. Colorimetric Assay for Cell Viability
2.14. Statistical Analysis
3. Results
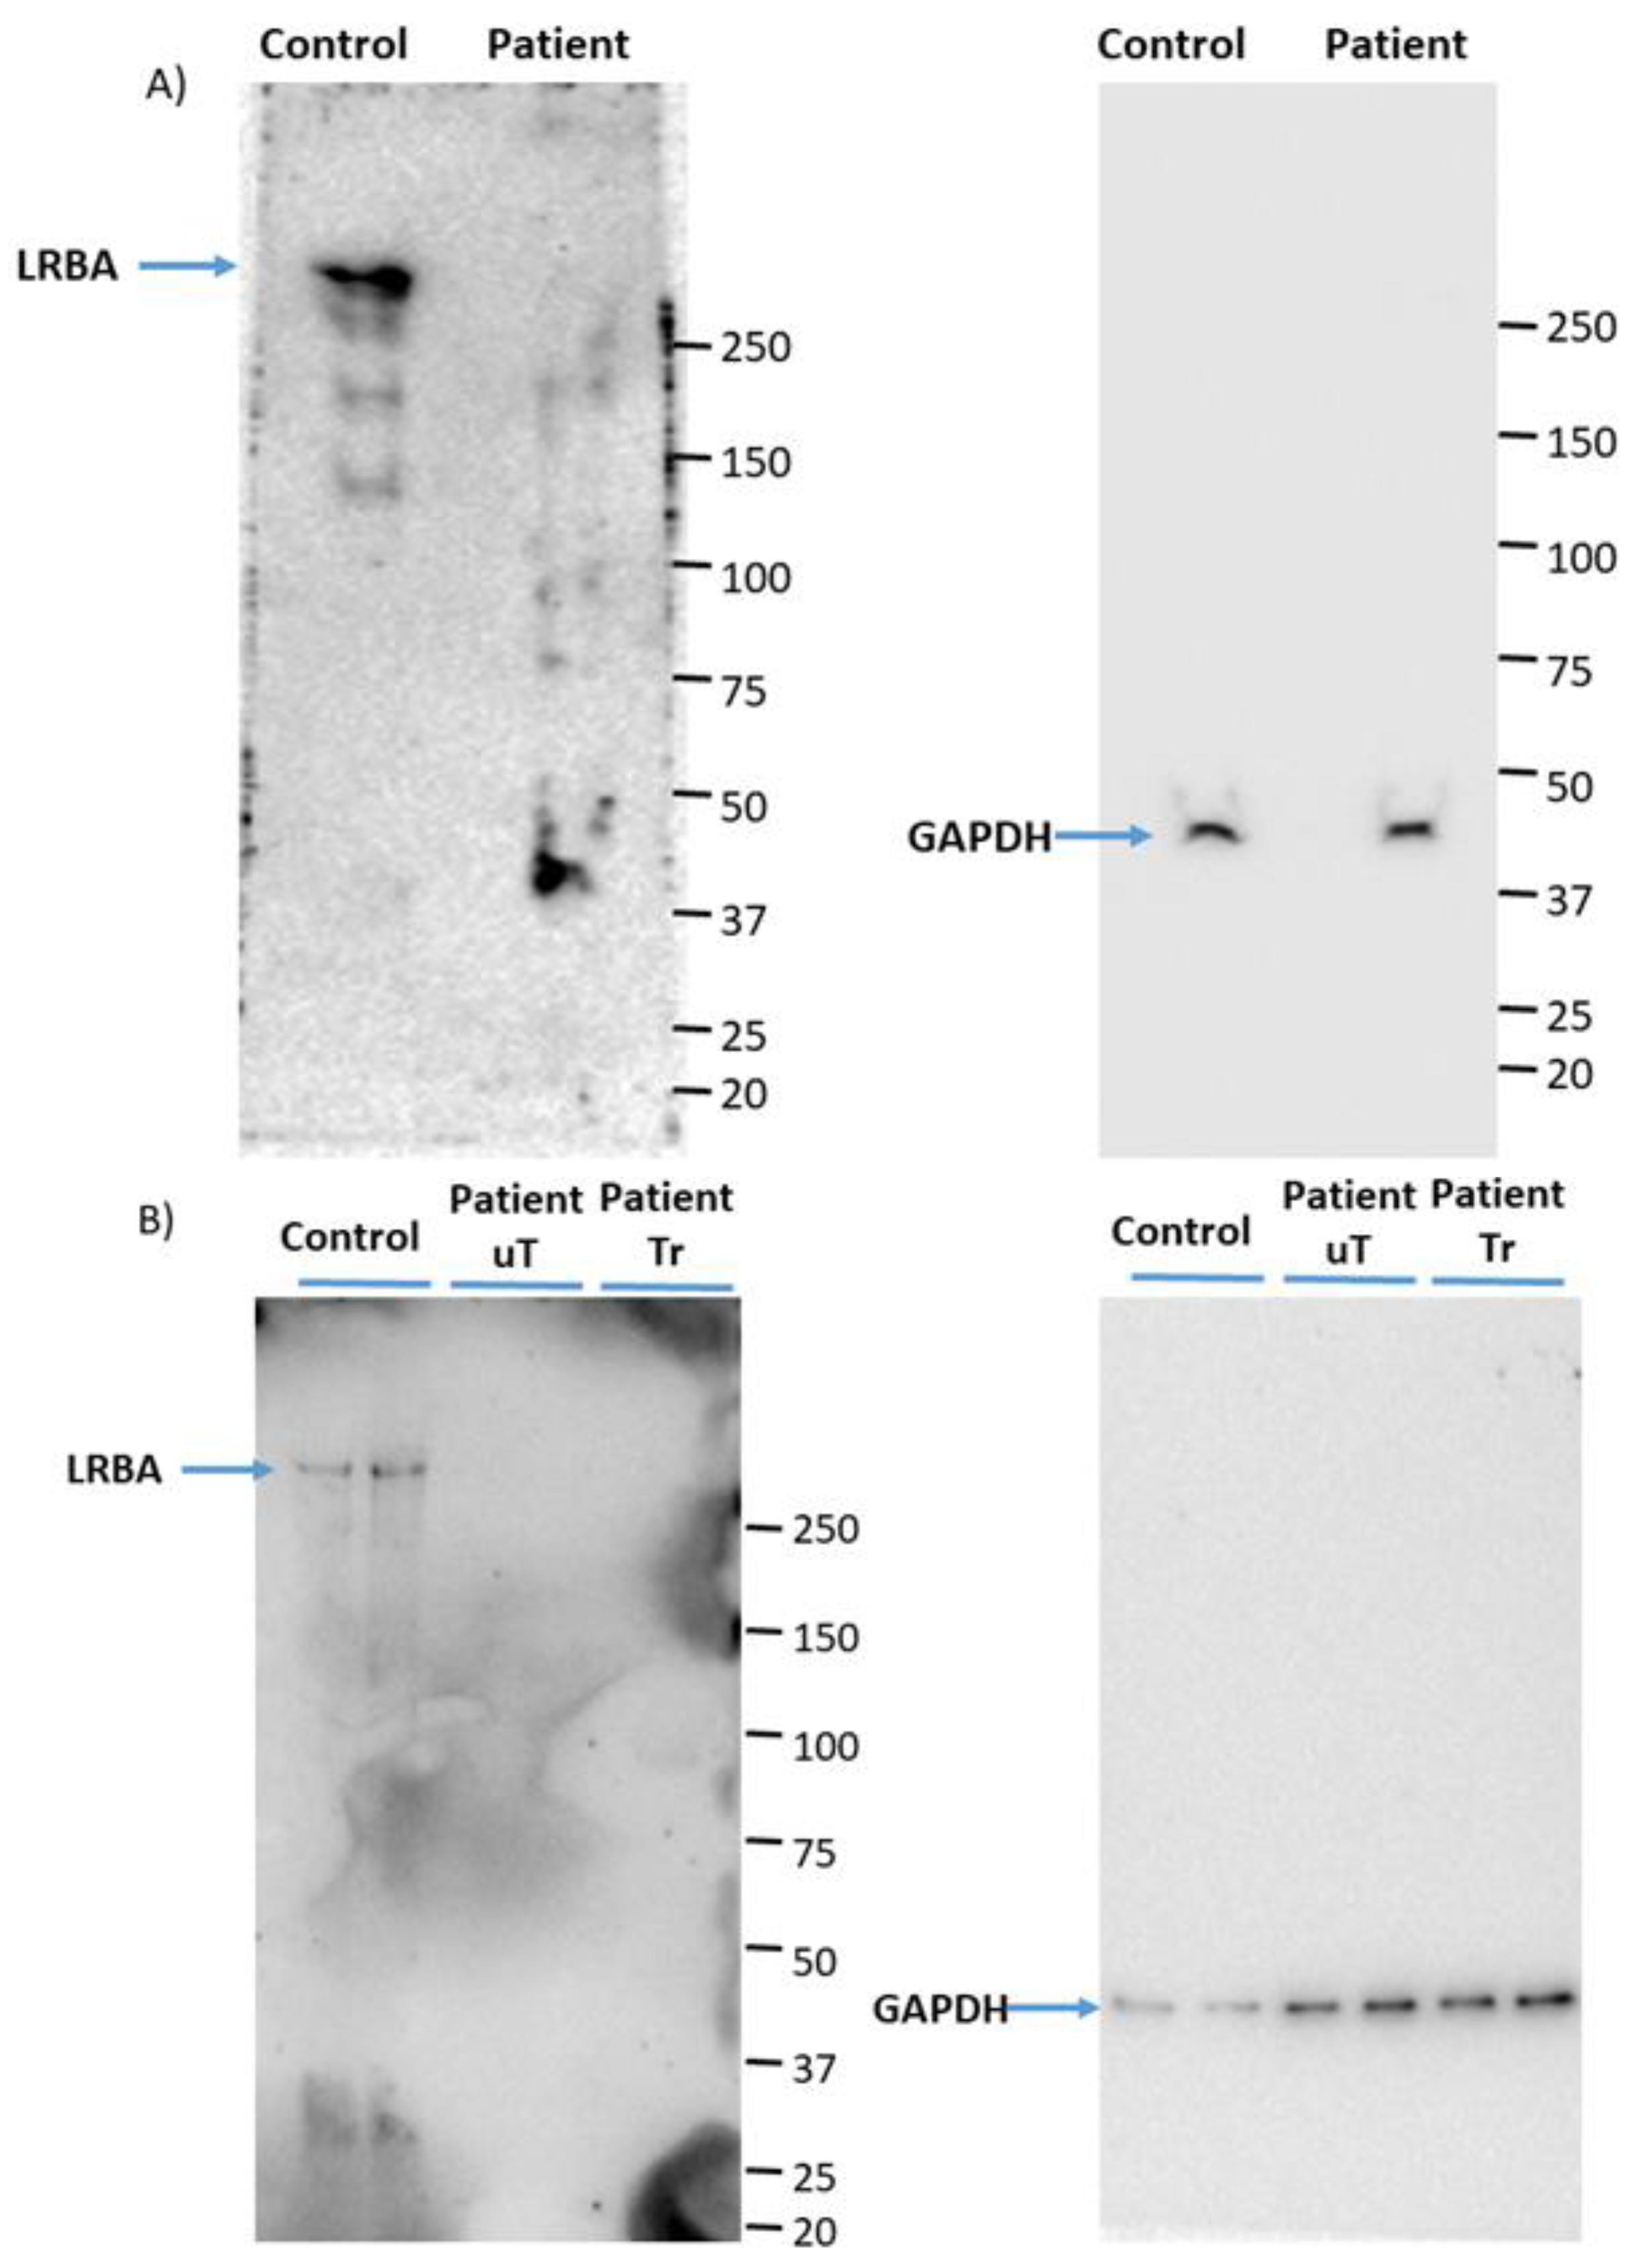
3.1. LRBA Is Deficient in the Proband’s PBMCs
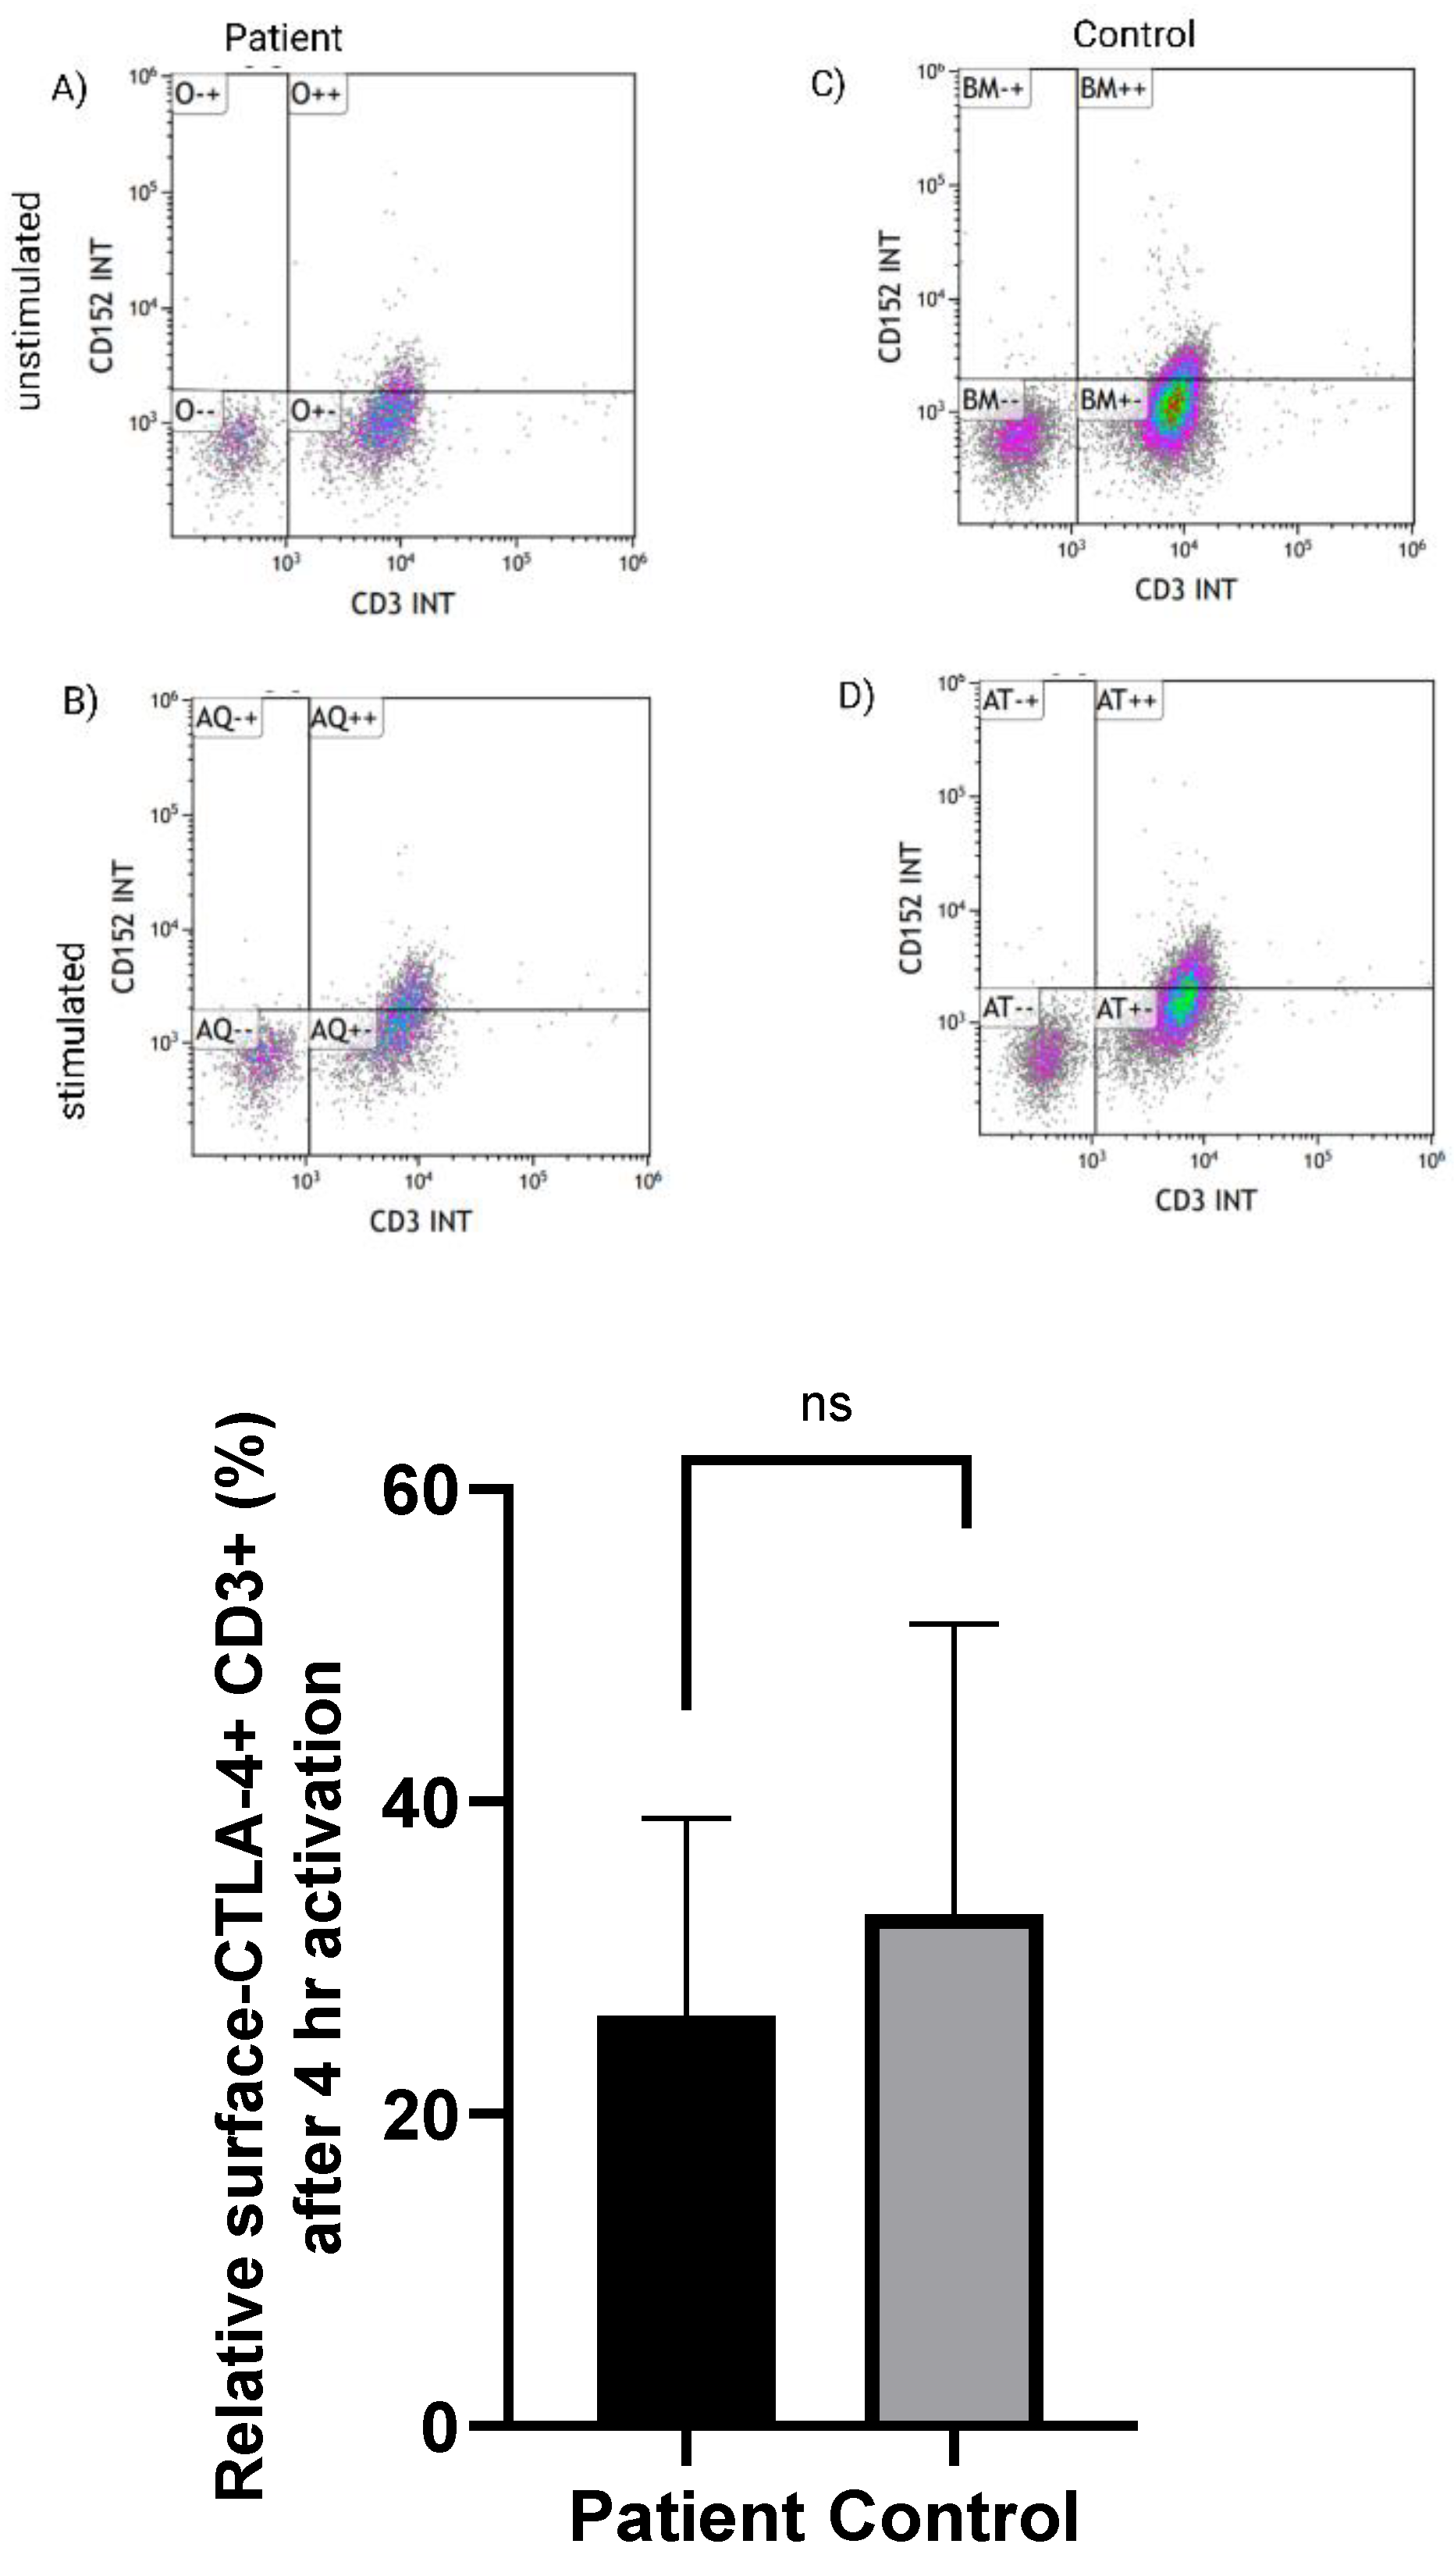
3.2. Normal Expression of CTLA-4 on CD3+ T Cells in LRBA-Deficient Patient
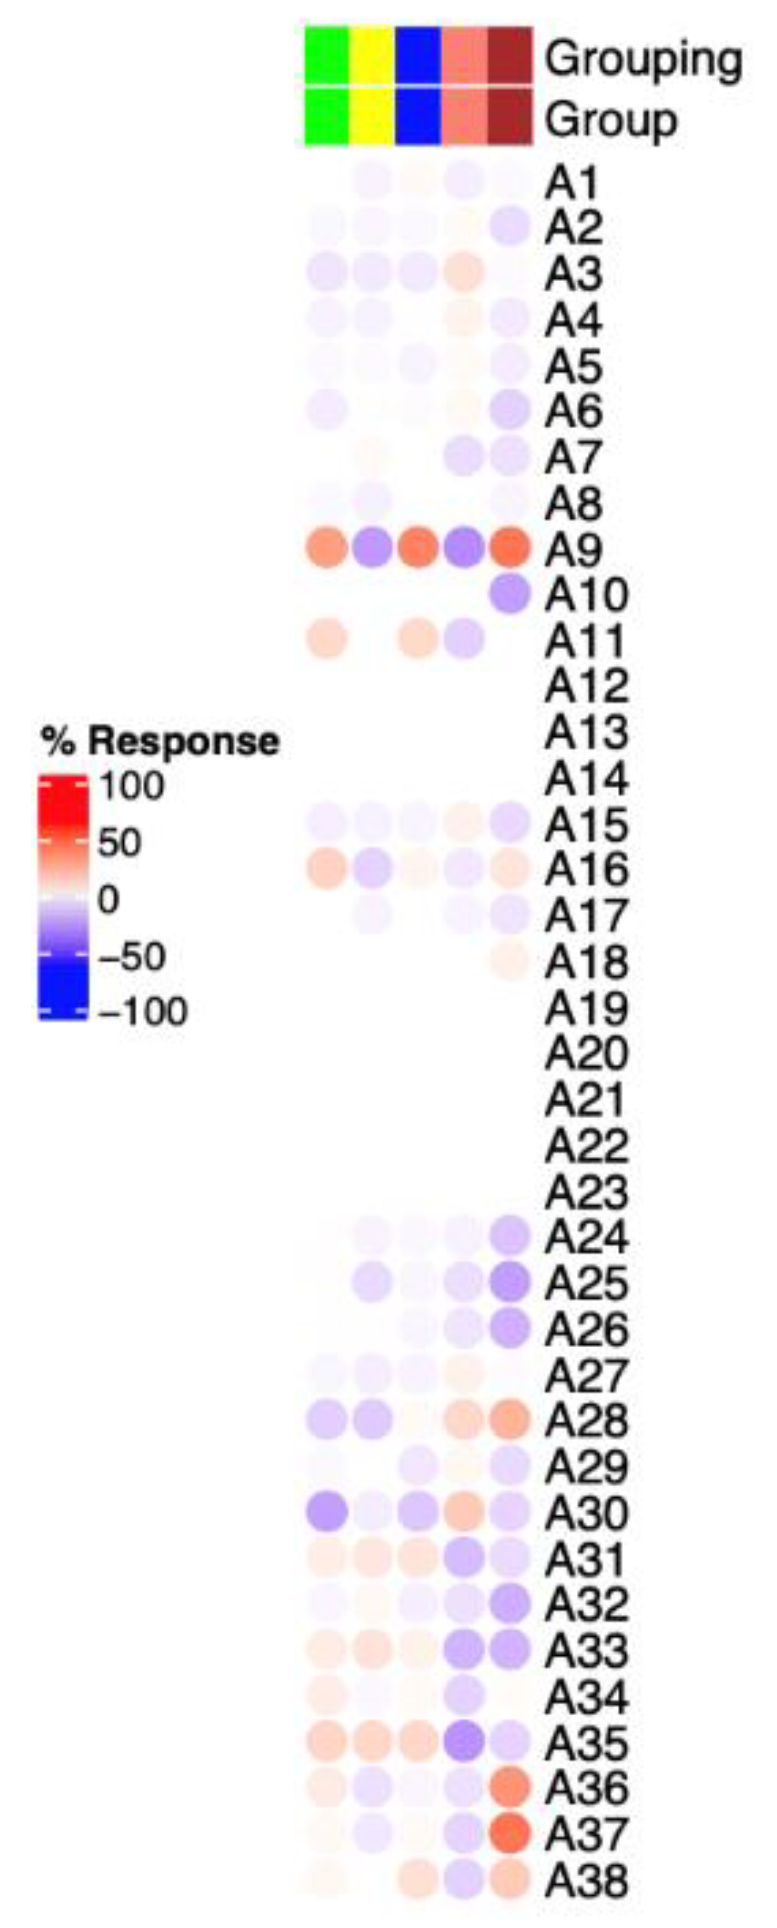
3.3. Immunosuppressive-Related Genes in Erythroid Cells Are Upregulated in LRBA-Deficient Proband
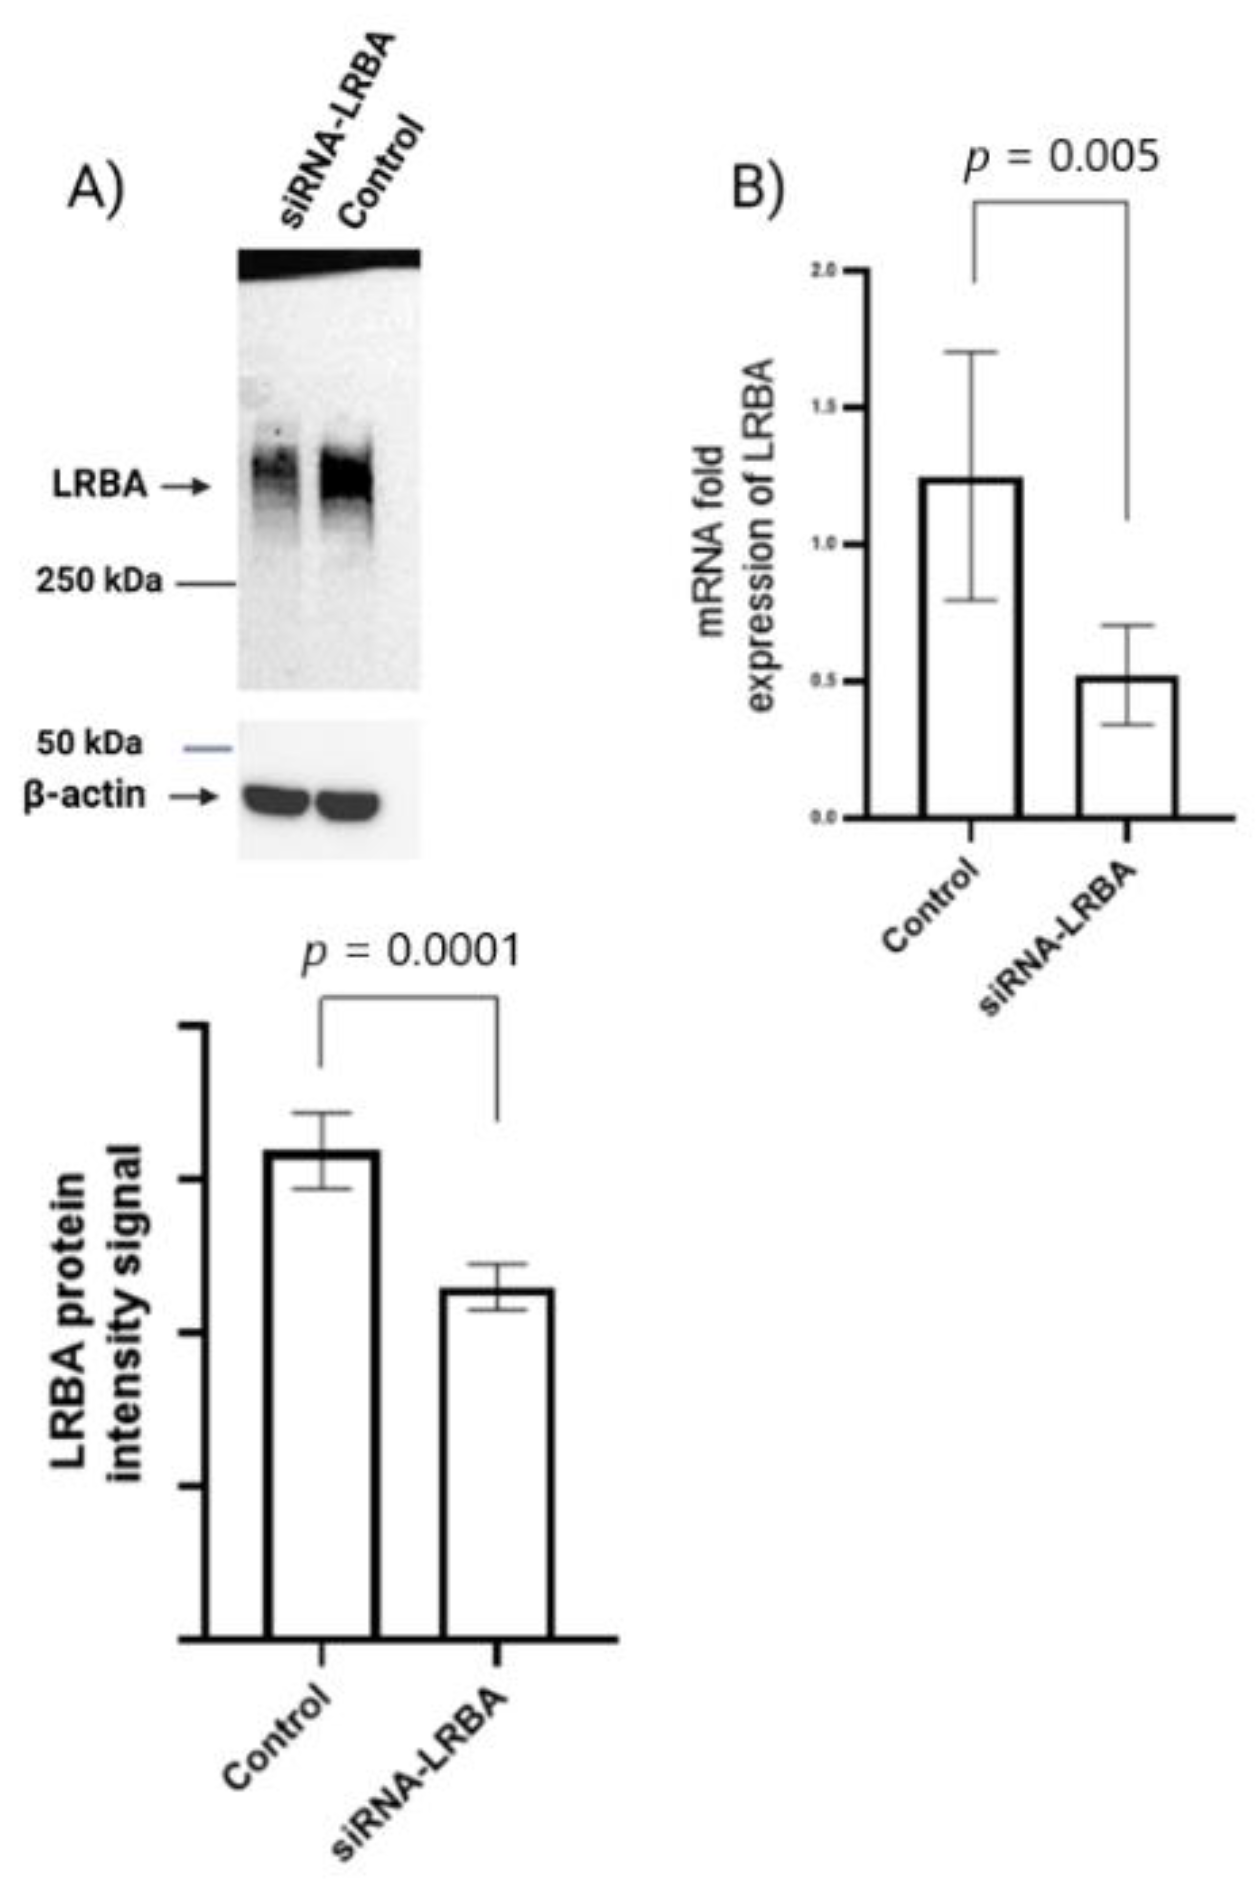
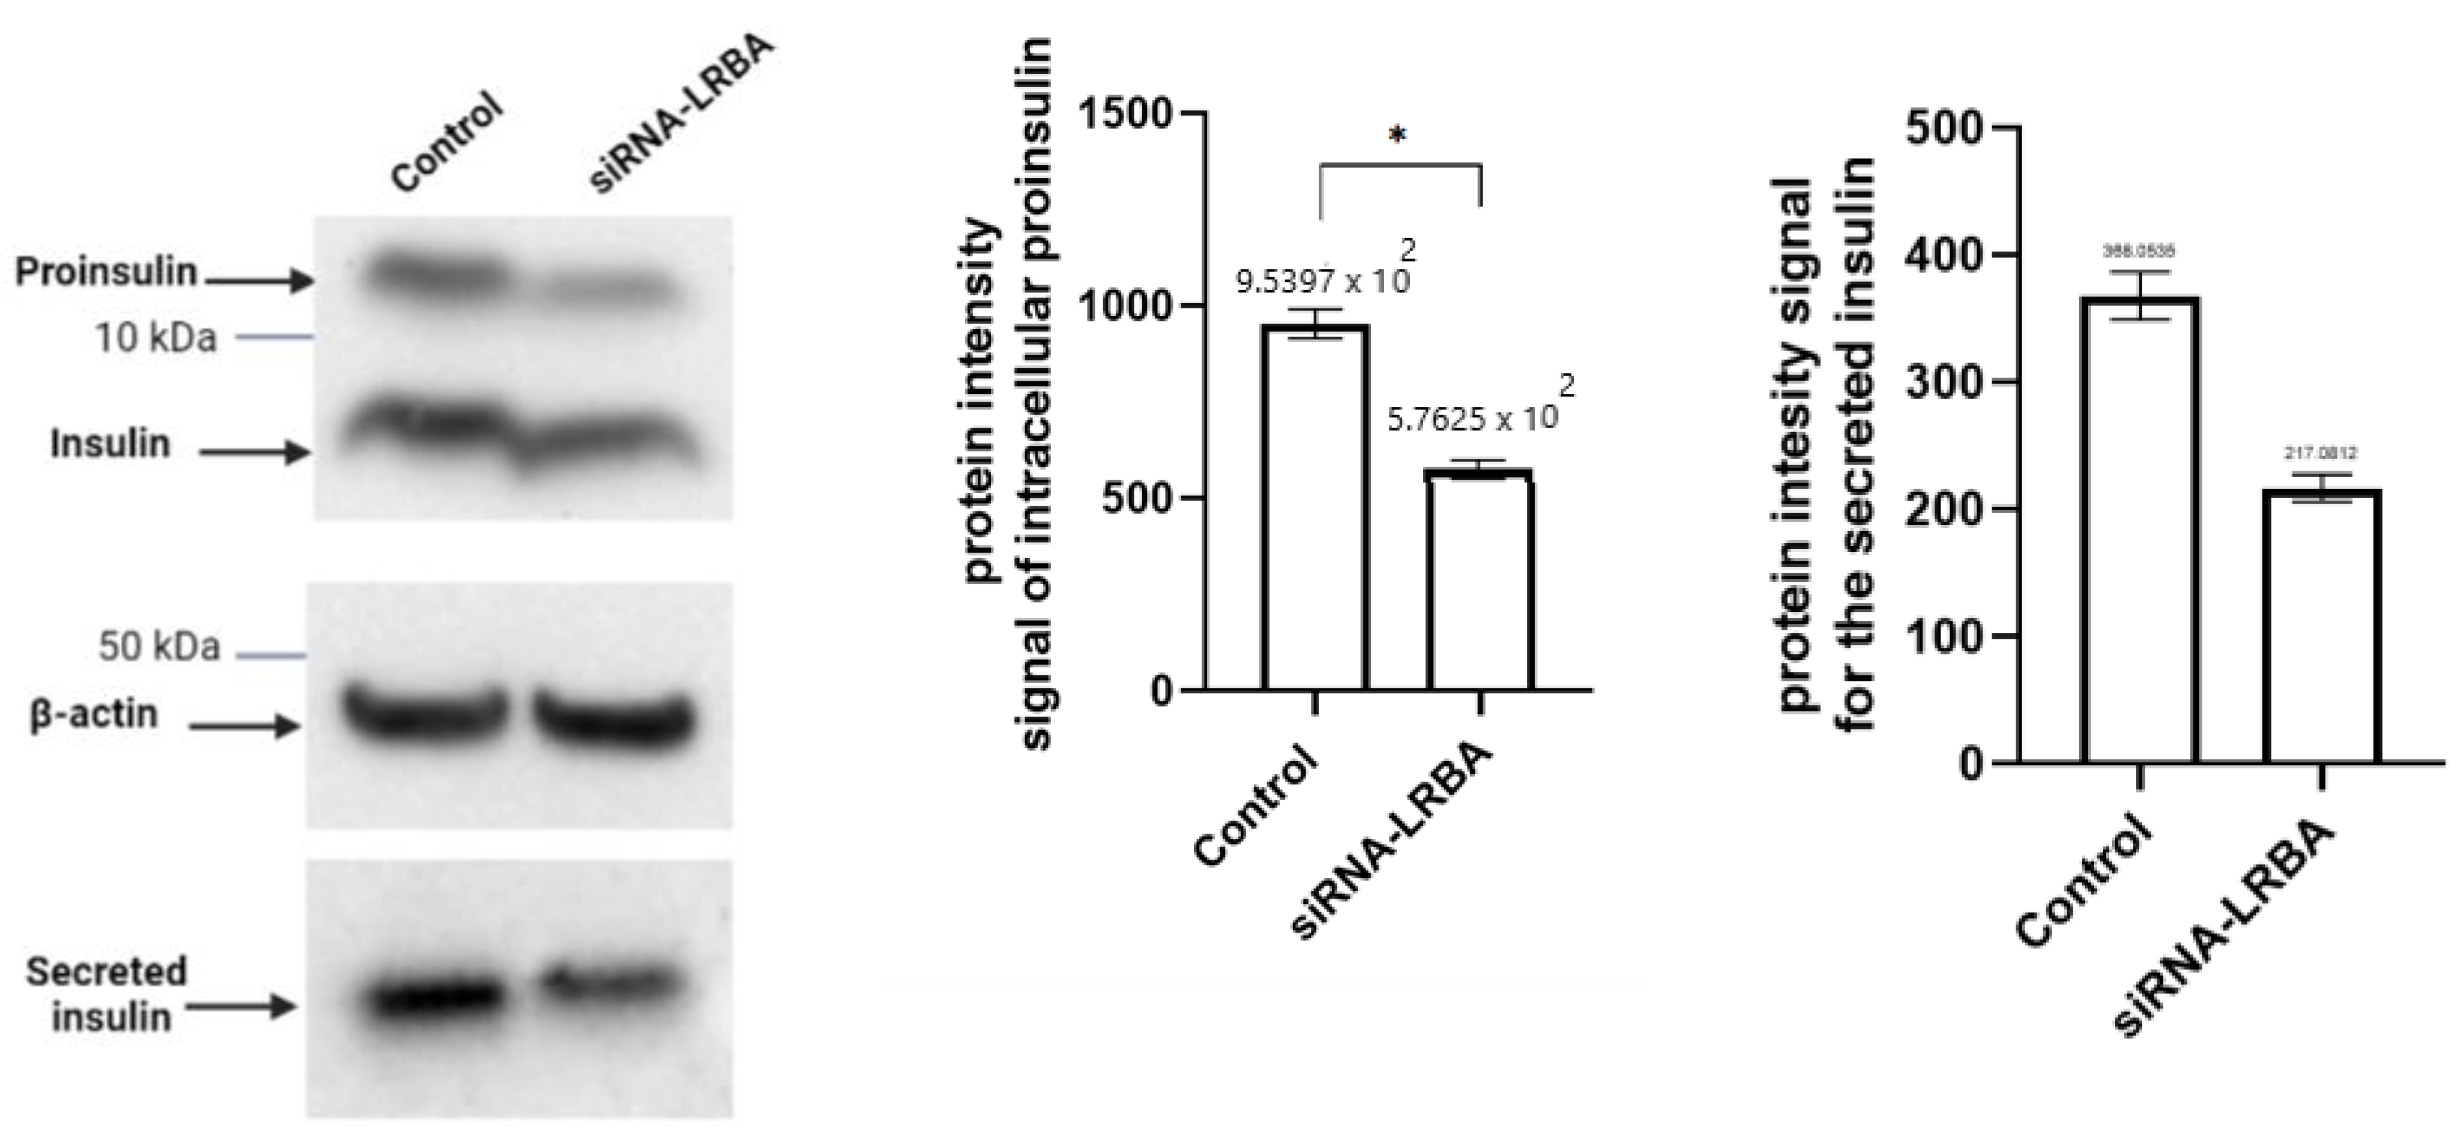
3.4. Knocking down LRBA in MIN6 β-Cells Lead to Reduced Intracellular of Proinsulin and Insulin and Consequently Reduced Insulin Secretion
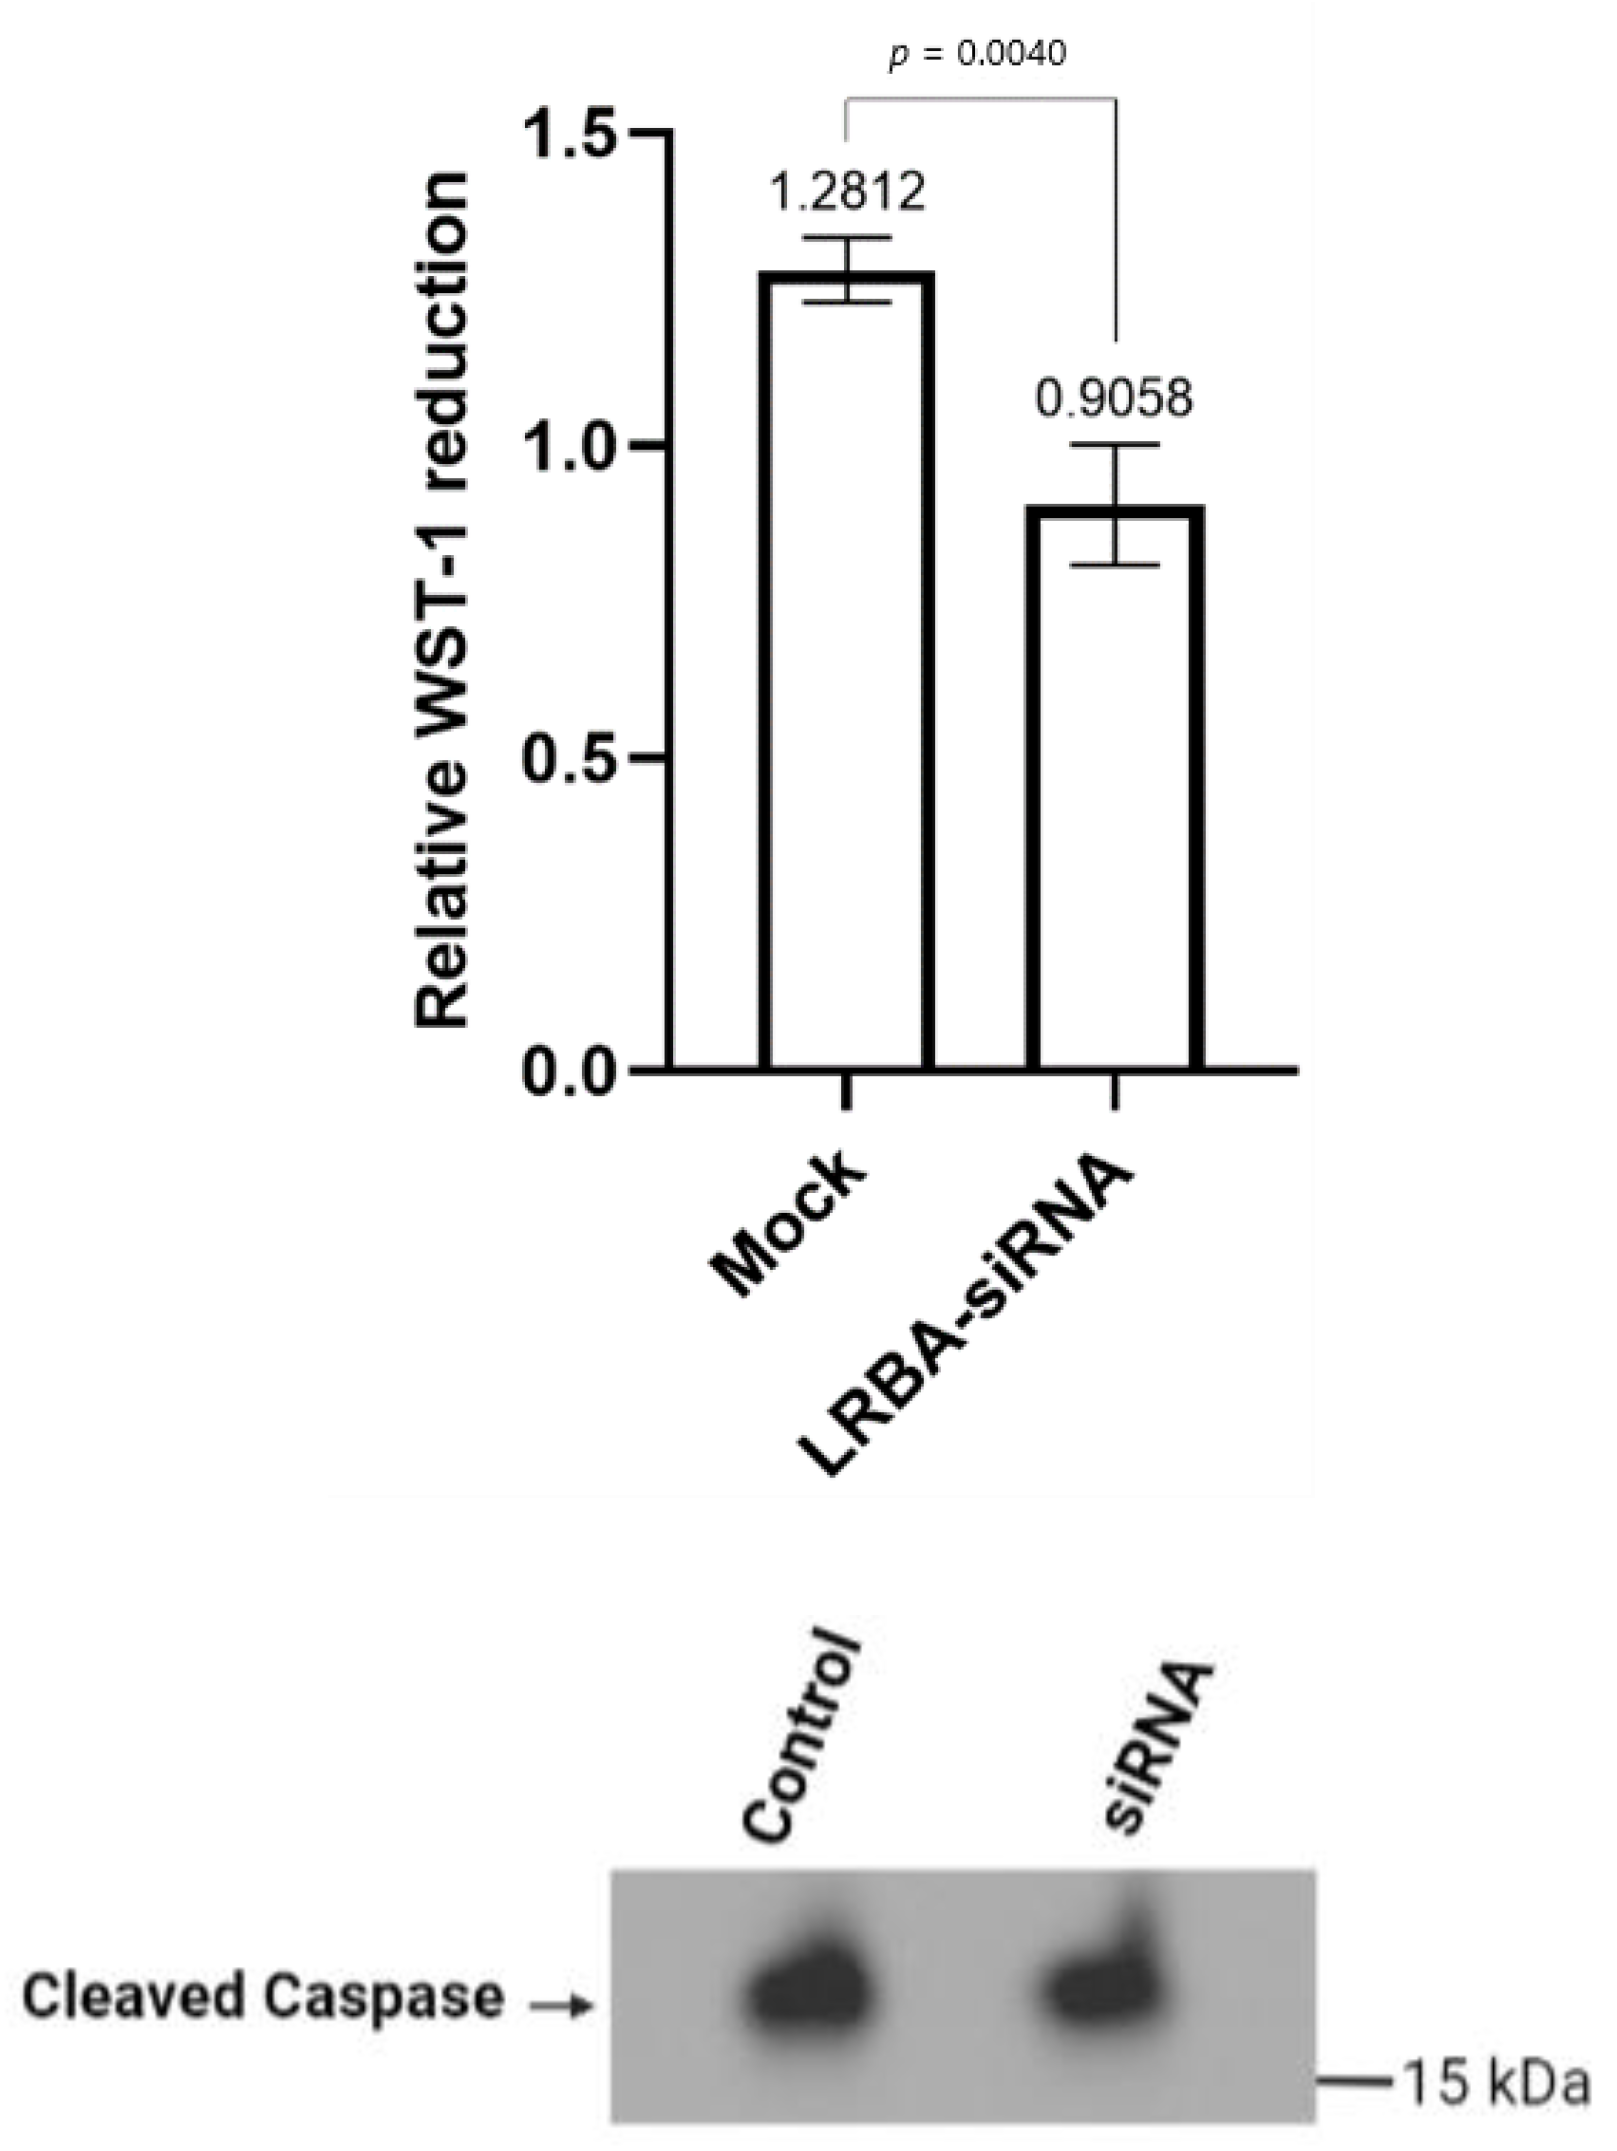
3.5. Knocking down LRBA in MIN6 β-Cells Reduces Cellular Glucose Metabolism while Not Directly Inducing Cells Death
4. Discussion
5. Conclusions
Supplementary Materials
Author Contributions
Funding
Institutional Review Board Statement
Informed Consent Statement
Data Availability Statement
Conflicts of Interest
References
- Haris, B.; Saraswathi, S.; Al-Khawaga, S.; Hasnah, R.; Saeed, A.; Mundekkadan, S.; Hamed, N.; Afyouni, H.; Abdel-Karim, T.; Mohammed, S.; et al. Epidemiology, genetic landscape and classification of childhood diabetes mellitus in the State of Qatar. J. Diabetes Investig. 2021, 12, 2141–2148. [Google Scholar] [CrossRef] [PubMed]
- Riddle, M.C.; Philipson, L.H.; Rich, S.S.; Carlsson, A.; Franks, P.W.; Greeley, S.A.W.; Nolan, J.J.; Pearson, E.R.; Zeitler, P.S.; Hattersley, A.T. Monogenic Diabetes: From Genetic Insights to Population-Based Precision in Care. Reflections From a Diabetes Care Editors’ Expert Forum. Diabetes Care 2020, 43, 3117–3128. [Google Scholar] [CrossRef] [PubMed]
- Katsarou, A.; Gudbjörnsdottir, S.; Rawshani, A.; Dabelea, D.; Bonifacio, E.; Anderson, B.J.; Jacobsen, L.M.; Schatz, D.A.; Lernmark, Å. Type 1 Diabetes mellitus. Nat. Rev. Dis. Primers 2017, 3, 17016. [Google Scholar] [CrossRef] [PubMed]
- Ziegler, A.G.; Rewers, M.; Simell, O.; Simell, T.; Lempainen, J.; Steck, A.; Winkler, C.; Ilonen, J.; Veijola, R.; Knip, M.; et al. Seroconversion to Multiple Islet Autoantibodies and Risk of Progression to Diabetes in Children. JAMA 2013, 309, 2473–2479. [Google Scholar] [CrossRef] [Green Version]
- Roep, B.O.; Peakman, M. Antigen Targets of Type 1 Diabetes Autoimmunity. Cold Spring Harb. Perspect. Med. 2012, 2, a007781. [Google Scholar] [CrossRef] [Green Version]
- Lebastchi, J.; Herold, K.C. Immunologic and Metabolic Biomarkers of β-Cell Destruction in the Diagnosis of Type 1 Diabetes. Cold Spring Harb. Perspect. Med. 2012, 2, a007708. [Google Scholar] [CrossRef]
- Willcox, A.; Richardson, S.J.; Bone, A.J.; Foulis, A.K.; Morgan, N.G. Analysis of islet inflammation in human type 1 diabetes. Clin. Exp. Immunol. 2009, 155, 173–181. [Google Scholar] [CrossRef]
- In’t Veld, P. Insulitis in human type 1 diabetes: The quest for an elusive lesion. Islets 2011, 3, 131–138. [Google Scholar] [CrossRef] [Green Version]
- Gámez-Díaz, L.; August, D.; Stepensky, P.; Revel-Vilk, S.; Seidel, M.G.; Noriko, M.; Morio, T.; Worth, A.J.; Blessing, J.; Van de Veerdonk, F.; et al. The extended phenotype of LPS-responsive beige-like anchor protein (LRBA) deficiency. J. Allergy Clin. Immunol. 2016, 137, 223–230. [Google Scholar] [CrossRef] [Green Version]
- Habibi, S.; Zaki-Dizaji, M.; Rafiemanesh, H.; Lo, B.; Jamee, M.; Gámez-Díaz, L.; Salami, F.; Kamali, A.N.; Mohammadi, H.; Abolhassani, H.; et al. Clinical, Immunologic, and Molecular Spectrum of Patients with LPS-Responsive Beige-Like Anchor Protein Deficiency: A Systematic Review. J. Allergy Clin. Immunol. Pract. 2019, 7, 2379–2386.e5. [Google Scholar] [CrossRef]
- Al Sukaiti, N.; Abdelrahman, K.; Alshekaili, J.; Al Oraimi, S.; Al Sinani, A.; Al Rahbi, N.; Cho, V.; Field, M.; Cook, M.C. Agammaglobulinaemia despite terminal B-cell differentiation in a patient with a novel LRBA mutation. Clin. Transl. Immunol. 2017, 6, e144. [Google Scholar] [CrossRef] [PubMed]
- Hawari, I.; Haris, B.; Mohammed, I.; Ericsson, J.; Khalifa, A.; Hussain, K. Infancy onset diabetes mellitus in a patient with a novel homozygous LRBA mutation. J. Clin. Transl. Endocrinol. Case Rep. 2022, 23, 100108. [Google Scholar] [CrossRef]
- Cullinane, A.R.; Schäffer, A.A.; Huizing, M. The BEACH Is Hot: A LYST of Emerging Roles for BEACH-Domain Containing Proteins in Human Disease. Traffic 2013, 14, 749–766. [Google Scholar] [CrossRef] [PubMed] [Green Version]
- Wang, X.; Herberg, F.W.; Laue, M.M.; Wüllner, C.; Hu, B.; Petrasch-Parwez, E.; Kilimann, M.W. Neurobeachin: A Protein Kinase A-Anchoring, beige/Chediak-Higashi Protein Homolog Implicated in Neuronal Membrane Traffic. J. Neurosci. 2000, 20, 8551–8565. [Google Scholar] [CrossRef] [PubMed] [Green Version]
- Steffens, A.; Bräutigam, A.; Jakoby, M.; Hülskamp, M. The BEACH Domain Protein SPIRRIG Is Essential for Arabidopsis Salt Stress Tolerance and Functions as a Regulator of Transcript Stabilization and Localization. PLoS Biol. 2015, 13, e1002188. [Google Scholar] [CrossRef] [PubMed]
- Krummel, M.F.; Allison, J.P. CD28 and CTLA-4 have opposing effects on the response of T cells to stimulation. J. Exp. Med. 1995, 182, 459–465. [Google Scholar] [CrossRef] [Green Version]
- Chambers, C.A.; Krummel, M.E.; Boitel, B.; Hurwitz, A.; Sullivan, T.J.; Fournier, S.; Cassell, D.; Brunner, M.; Allison, J.P. The Role of CTLA-4 in the Regulation and Initiation of T-Cell Responses. Immunol. Rev. 1996, 153, 27–46. [Google Scholar] [CrossRef]
- Kavvoura, F.K.; Ioannidis, J.P.A. CTLA-4 Gene Polymorphisms and Susceptibility to Type 1 Diabetes Mellitus: A HuGE Review and Meta-Analysis. Am. J. Epidemiol. 2005, 162, 3–16. [Google Scholar] [CrossRef] [Green Version]
- Lühder, F.; Höglund, P.; Allison, J.P.; Benoist, C.; Mathis, D. Cytotoxic T Lymphocyte-associated Antigen 4 (CTLA-4) Regulates the Unfolding of Autoimmune Diabetes. J. Exp. Med. 1998, 187, 427–432. [Google Scholar] [CrossRef] [Green Version]
- You, S.; Alyanakian, M.-A.; Segovia, B.; Damotte, D.; Bluestone, J.; Bach, J.-F.; Chatenoud, L. Immunoregulatory Pathways Controlling Progression of Autoimmunity in NOD Mice. Ann. N. Y. Acad. Sci. 2008, 1150, 300–310. [Google Scholar] [CrossRef] [Green Version]
- Lo, B.; Zhang, K.; Lu, W.; Zheng, L.; Zhang, Q.; Kanellopoulou, C.; Zhang, Y.; Liu, Z.; Fritz, J.M.; Marsh, R.; et al. Patients with LRBA deficiency show CTLA4 loss and immune dysregulation responsive to abatacept therapy. Science 2015, 349, 436–440. [Google Scholar] [CrossRef] [PubMed] [Green Version]
- Hou, T.Z.; Verma, N.; Wanders, J.; Kennedy, A.; Soskic, B.; Janman, D.; Halliday, N.; Rowshanravan, B.; Worth, A.; Qasim, W.; et al. Identifying functional defects in patients with immune dysregulation due to LRBA and CTLA-4 mutations. Blood 2017, 129, 1458–1468. [Google Scholar] [CrossRef] [PubMed]
- Altman, M.C.; Rinchai, D.; Baldwin, N.; Toufiq, M.; Whalen, E.; Garand, M.; Kabeer, B.; Alfaki, M.; Presnell, S.R.; Khaenam, P.; et al. Development of a fixed module repertoire for the analysis and interpretation of blood transcriptome data. Nat. Commun. 2021, 12, 4385. [Google Scholar] [CrossRef] [PubMed]
- Ai, W.; Li, H.; Song, N.; Li, L.; Chen, H. Optimal Method to Stimulate Cytokine Production and Its Use in Immunotoxicity Assessment. Int. J. Environ. Res. Public Health 2013, 10, 3834–3842. [Google Scholar] [CrossRef] [Green Version]
- Hattersley, A.T.; Patel, K.A. Precision diabetes: Learning from monogenic diabetes. Diabetologia 2017, 60, 769–777. [Google Scholar] [CrossRef] [Green Version]
- Marucci, A.; Rutigliano, I.; Fini, G.; Pezzilli, S.; Menzaghi, C.; Di Paola, R.; Trischitta, V. Role of Actionable Genes in Pursuing a True Approach of Precision Medicine in Monogenic Diabetes. Genes 2022, 13, 117. [Google Scholar] [CrossRef]
- Mitsuiki, N.; Schwab, C.; Grimbacher, B. What did we learn from CTLA-4 insufficiency on the human immune system? Immunol. Rev. 2019, 287, 33–49. [Google Scholar] [CrossRef]
- Salami, F. Normal Expression of Cytotoxic T-lymphocyte- As-sociated Protein4 (CTLA4) in a Lipopolysaccharide-Responsive and Beige-like Anchor Protein (LRBA) Deficient Patient. Immunol. Genet. J. 2020, 3, 53–58. [Google Scholar] [CrossRef]
- Grzywa, T.M.; Nowis, D.; Golab, J. The role of CD71+ erythroid cells in the regulation of the immune response. Pharmacol. Ther. 2021, 228, 107927. [Google Scholar] [CrossRef]
- Rudd, B.D. Neonatal T Cells: A Reinterpretation. Annu. Rev. Immunol. 2020, 38, 229–247. [Google Scholar] [CrossRef]
- Elahi, S.; Vega-López, M.A.; Herman-Miguel, V.; Ramírez-Estudillo, C.; Mancilla-Ramírez, J.; Motyka, B.; West, L.; Oyegbami, O. CD71+ Erythroid Cells in Human Neonates Exhibit Immunosuppressive Properties and Compromise Immune Response Against Systemic Infection in Neonatal Mice. Front. Immunol. 2020, 11, 597433. [Google Scholar] [CrossRef] [PubMed]
- Xie, L.; Dai, Z.; Pang, C.; Lin, D.; Zheng, M. Cellular glucose metabolism is essential for the reduction of cell-impermeable water-soluble tetrazolium (WST) dyes. Int. J. Biol. Sci. 2018, 14, 1535–1544. [Google Scholar] [CrossRef] [PubMed] [Green Version]


Publisher’s Note: MDPI stays neutral with regard to jurisdictional claims in published maps and institutional affiliations. |
© 2022 by the authors. Licensee MDPI, Basel, Switzerland. This article is an open access article distributed under the terms and conditions of the Creative Commons Attribution (CC BY) license (https://creativecommons.org/licenses/by/4.0/).
Share and Cite
Hawari, I.; Ericsson, J.; Kabeer, B.S.A.; Chaussabel, D.; Alsulaiti, A.; Sharari, S.A.; Maccalli, C.; Khan, F.A.; Hussain, K. Understanding the Mechanism of Diabetes Mellitus in a LRBA-Deficient Patient. Biology 2022, 11, 612. https://doi.org/10.3390/biology11040612
Hawari I, Ericsson J, Kabeer BSA, Chaussabel D, Alsulaiti A, Sharari SA, Maccalli C, Khan FA, Hussain K. Understanding the Mechanism of Diabetes Mellitus in a LRBA-Deficient Patient. Biology. 2022; 11(4):612. https://doi.org/10.3390/biology11040612
Chicago/Turabian StyleHawari, Iman, Johan Ericsson, Basirudeen Syed Ahamed Kabeer, Damien Chaussabel, Asma Alsulaiti, Sanaa A. Sharari, Cristina Maccalli, Faiyaz Ahmad Khan, and Khalid Hussain. 2022. "Understanding the Mechanism of Diabetes Mellitus in a LRBA-Deficient Patient" Biology 11, no. 4: 612. https://doi.org/10.3390/biology11040612
APA StyleHawari, I., Ericsson, J., Kabeer, B. S. A., Chaussabel, D., Alsulaiti, A., Sharari, S. A., Maccalli, C., Khan, F. A., & Hussain, K. (2022). Understanding the Mechanism of Diabetes Mellitus in a LRBA-Deficient Patient. Biology, 11(4), 612. https://doi.org/10.3390/biology11040612