Article

Temperature- and Nutrients-Induced Phenotypic Changes of Antarctic Green Snow Bacteria Probed by High-Throughput FTIR Spectroscopy

1
Faculty of Science and Technology, Norwegian University of Life Sciences, 1432 Aas, Norway
2
Faculty of Biology, Belarussian State University, 220030 Minsk, Belarus
*
Author to whom correspondence should be addressed.
Biology 2022, 11(6), 890; https://doi.org/10.3390/biology11060890
Submission received: 14 March 2022 / Revised: 21 May 2022 / Accepted: 8 June 2022 / Published: 9 June 2022
(This article belongs to the Special Issue Microbial Ecology and Evolution in Extreme Environments)

Abstract

:

Simple Summary

Green snow microorganisms play an important role in biogeochemical cycle and carbon sink processes and they can be a source of biotechnologically interesting cell factories. A wide temperature tolerance is a unique property of bacteria isolated from cold environments, which has received great attention in the last years. The present paper examines the growth and chemical profile flexibility for green snow bacteria exposed to different temperature and nutrient fluctuations. By applying high-throughput chemical phenotyping with FTIR spectroscopy we discovered chemical changes possessed by green snow bacteria when grown at high/low temperature and rich/minimal media.

Abstract

Temperature fluctuations and nutrient composition are the main parameters influencing green snow microbiome. In this study we investigated the influence of temperature and nutrient conditions on the growth and cellular chemical profile of bacteria isolated from green snow. Chemical profiling of the green snow bacteria was done by high-throughput FTIR spectroscopy combined with multivariate data analysis. We showed that temperature and nutrients fluctuations strongly affect growth ability and chemical profile of the green snow bacteria. The size of colonies for green snow bacteria grown at higher (25 °C) and lower (4 °C and 10 °C) than optimal temperature (18 °C) was smaller. All isolates grew on rich medium, and only 19 isolates were able to grow on synthetic minimal media. Lipid and mixed spectral regions showed to be phylogeny related. FTIR fingerprinting indicates that lipids are often affected by the temperature fluctuations. Growth on different media resulted in the change of the whole chemical profile, where lipids showed to be more affected than proteins and polysaccharides. Correlation analysis showed that nutrient composition is clearly strongly influencing chemical changes in the cells, followed by temperature.

1. Introduction

Climate change and global warming lead to the accelerated melting of glaciers, coastal snow fields, and overall decrease in the snow cover in Antarctica. This creates favorable conditions for blooming of snow algae, resulting in the appearance of green snow areas. The blooming of snow algae in Antarctica was recorded for the first time during expeditions in the 1950s [1]. Due to that, warming in the Antarctic Peninsula has already exceeded 1.5 °C [2,3] and an increased spreading of green snow areas throughout the continent has been recorded. During the spring-summer periods, green snow areas can occupy hundreds of square meters [4]. Thus, it is an important ecosystem with a role in the global biogeochemical cycle and terrestrial carbon sink [5].
Green snow is characterized by the presence of a complex microbiome, where algae are the main colonizers and bacteria, archaea, and fungi are co-colonizing microorganisms [6,7,8]. Green snow is a highly mobile ecosystem with continuously changing physicochemical parameters, where temperature and nutrient composition are the main parameters influencing green snow microbiome. While green snow algae have been studied extensively, bacteria co-colonizing green snow have been studied to a very limited extent. In our recent study [9] we performed identification and complex phenotypic characterization of 45 fast-growing bacterial isolates from green snow collected during the 7th Belarussian Antarctic expedition (2014–2015). 16S rRNA sequencing of the isolated green snow bacteria identified their belonging to the phyla Actinobacteria and Proteobacteria, and genera Arthrobacter, Cryobacterium, Leifsonia, Salinibacterium, Paeniglutamicibacter, Rhodococcus, Polaromonas, Pseudomonas, and Psychrobacter. Interestingly, despite originating from the cold environment, all green snow bacteria were characterized by a wide range of temperature tolerance from 4 °C to 25 °C, and the optimum growth temperature of 18 °C.
A wide temperature tolerance is a unique property of bacteria isolated from cold environments that has received great attention in the last years [10,11]. For example, low temperature tolerant bacteria, called psychrophilic, could be a source of cold-active enzymes, polyunsaturated fatty acids, exopolysaccharides, cold-shock, cold-acclimation, and antifreeze proteins with the applications in agriculture, medicine, and biotechnology [12,13,14]. In addition, some psychrophilic bacteria from phyla Proteobacteria and Bacteroides can degrade hydrocarbons and are applied in the biodegradation of oils and petroleum and bioremediation as a treatment of contaminated wastewater [14,15,16]. Adaptation of bacteria to different temperatures is a complex cellular process involving several metabolic pathways, often resulting in changes of chemical phenotype. For example, it has been shown that bacteria isolated from ice and melted snow possess changes in the membrane lipid composition, enzyme secretion, and pigments accumulation when grown under different temperatures [17,18,19,20,21]. Nutrient composition and availability may influence the temperature adaptation mechanisms in bacteria. Thus, it has been reported that mineral composition of growth medium affected the synthesis of cold-adaptive proteases in Pseudomonas arctica isolated from the soil in King George Island, Antarctica [22]. Due to the rising temperature fluctuations in Antarctica, understanding temperature and nutrient-induced changes of chemical phenotype of green snow bacteria could provide forecasting information, predicting their further contribution to the biogeochemical cycle. In addition, these chemical changes might be interesting from a biotechnological point of view as they could be represented by the accumulation and production of highly valuable chemical components.
The main aim of this study was to examine, in detail, the influence of different temperatures and nutrients on the growth ability and cellular chemical profile of the Antarctic fast-growing green snow bacteria. Bacteria were grown on rich complex medium—brain heart infusion (BHI) and minimal media with the different carbon sources and mineral composition. Growth on the selected media was done at 4, 10, 18, and 25 °C. For the profiling of the cellular chemical profile, Fourier transform infrared (FTIR) spectroscopy was utilized. FTIR spectroscopy is a rapid, non-destructive next-generation phenotyping technique widely used in medicine [23,24,25,26,27,28], food industry [29,30], and biotechnology [31,32,33,34] for discrimination, identification, and characterization of different microorganisms [9,33,35,36,37,38,39,40,41,42,43,44,45,46,47,48,49,50]. FTIR spectroscopy can be applied in a high-throughput set-up and there are automated sample preparation systems for FTIR available [51,52,53]. Previously, we successfully applied this technique for the biochemical fingerprinting of the same bacterial strains cultivated on broth and agar media and identified a possible accumulation of intracellular polymer polyhydroxyalkanoates (PHA) and lipids for some isolates [9]. In this study we combined FTIR spectroscopy with the multivariate data analysis for detecting temperature and nutrient-induced changes of the chemical phenotype of the Antarctic green snow bacteria.

2. Materials and Methods

2.1. Antarctic Green Snow Bacterial Isolates

Forty-five fast-growing bacteria were isolated from the two green snow samples collected during the 7th Belarussian Antarctic Expedition (2014–2015). Identification of the isolated bacteria was performed by 16S rRNA gene sequencing, and characterization of enzymatic activity, optimum growth temperature and biochemical phenotyping by FTIR spectroscopy was reported previously [9]. Bacterial isolates were deposited at the Belarussian Collection of Non-pathogenic Microorganisms (Institute of Microbiology of the National Academy of Sciences of Belarus) (Table 1).

2.2. Cultivation of Bacteria

Cultivation of bacteria was performed on five agar media: complex medium brain heart infusion (BHI) (Sigma-Aldrich, India), two types of minimal media with different nitrogen and phosphorus content and two different carbon sources, glucose and glycerol. For preparing minimal media, two types of salt solutions, M9 [54] and a modification of M9 salts solution—X9, were used. M9 stock solution was prepared as follows (g/L): Na2HPO4—24, KH2PO4—15; NaCl—2.5; NH4Cl—5. MGU minimal medium was prepared by mixing of 300 mL of 20% agar, 100 mL of M9 stock solution, 4 mL of 20% glucose, 4 mL of 0.1 M (CaCl2) and 4 mL of 0.1 M (MgSO4). X9 stock solution was prepared as follows (g/L): NH4Cl—20; NH4NO3—4; Na2SO4 × 10H2O—8; K2HPO4—12; KH2PO4—4; MgSO4 × 7H2O—0.4. XGU minimal medium was prepared by mixing of 300 mL of 20% agar, 100 mL of X9 salt stock solution and 4 mL of 20% glucose. All media components were autoclaved at 115 °C for 15 min. Two analogous minimal media, MGY and XGY, with glycerol as carbon source were prepared by added 4 mL of 20% glycerol instead of glucose (Table 2).
Cultivations were performed at four temperatures: 4 °C, 10 °C, 18 °C, and 25 °C by streaking cultures on all five agar-based media. The ability to grow on different media and at different temperatures was determined by daily visual evaluation of the growth at four areas of the streak plates: (1) area of inoculation and first streaks, (2) area of second streaks, (3) area of third streaks, and (4) area of fourth streaks. The evaluation of the growth was performed according to the score-based scale were score “0” indicates the absence of growth on all areas of the streak plates, score “1–2” indicates a growth only at the area of inoculation and first streaks but without single colonies, score “3–4” indicates a growth at the area of inoculation and first streaks and area of second streaks with single colonies below 0.5 mm in diameter, score “5–6” was for the growth at all areas of the streak plates with single colonies 0.5–1.0 mm in diameter, score “7–8” when the diameter of the colonies was 1.5–2.0 mm, and score “9–10” for colonies with a diameter higher than 2.5 mm. The cultivation time was for 3–12 days depending on the cultivation conditions and strains (Table S1). Agar cultivation for FTIR phenotyping of green snow bacteria was chosen due to the better growth than in broth media and higher differences in cellular biochemical profile for some isolates, as reported previously [9]. All agar cultivations were done in three biological replicates—independent agar cultivations performed on different days.

2.3. FTIR Spectroscopy Analysis

Sample preparation for FTIR spectroscopy measurements was done as previously described [9]: (1) bacterial biomass was collected from agar plates after cultivation and washed three times with 50–100 µL of distilled water by applying centrifugation at 25,200× g, 4 °C for 5 min; (2) at the last washing step, 50–100 µL of distilled water was added for resuspending the cell pellet; (3) 8–10 µL of the obtained cell suspension was transferred onto IR-light-transparent silicon 384-well microplate (Bruker Optics GmbH, Ettlingen, Germany) in three technical replicates; (4) samples were dried at room temperature for 1 h.
FTIR spectroscopy analysis was performed using the High-throughput Screening eXTension (HTS-XT) unit coupled to the Vertex 70 FTIR spectrometer (both Bruker Optics GmbH, Ettlingen, Germany) allowing to perform High-throughput Screening (HTS) transmission mode measurements. The spectra were recorded in the region between 4000 and 500 cm−1 with a spectral resolution of 6 cm−1 and an aperture of 5.0 mm.

2.4. Data Analysis

Prior to data analysis, the spectral data were quality checked. A quality test has been applied to pre-select good quality spectra for further analysis. This was done using the method published by Tafintseva et al. [55,56,57]. The quality checked spectra were preprocessed and analyzed by multi-block PCA [58,59,60,61] as described further. For data modelling, spectra were split into the following regions: lipid region at 3050–2800 cm−1 and 1800–1700 cm−1, protein region at 1700–1500 cm−1, mixed region at 1500–1200 cm−1, and polysaccharide region at 1200–700 cm−1. Each of the spectral regions were preprocessed separately as follows: (1) second derivative spectra were obtained by the Savitzky–Golay algorithm [62,63] with window sizes of 13, 17 and 21 for lipid, mixed, and protein regions, respectively, and with window size 13 for the polysaccharide region, using a polynomial of second order; (2) spectra were normalized by Extended Multiplicative Signal Correction (EMSC) with linear and quadratic terms [64,65]; (3) average of all replicates was calculated providing one spectrum per strain and each temperature condition. Further, multi-block PCA was applied separately on each spectral region fusing data of all five media. Thus, the data of each medium represented a separate block in multi-block PCA. Three multi-block PCA models were built, with one for each spectral region. Multi-block analysis requires sample-to-sample correspondence across different blocks of data. Averaging of spectral replicates that cannot be coupled to each other from different blocks is a prerequisite necessary for meaningful multi-block analysis. In our case, samples from different media should correspond to each other. Replicates were, therefore, averaged and samples which were not available in one of the five blocks (for example due to poor growth or poor spectral quality) were removed completely from the multi-block PCA analysis. In total, 67 samples were used in multi-block PCA after averaging and data fusion.
Correlation analysis was done to detect the effect of nutrients and temperature on different strains. To do that, all the data representing different growth conditions were analyzed together (put together as rows), as opposed to multi-block setting where data is put next to each other as separate blocks (put together as columns). The spectra were preprocessed as follows: the spectral regions 3050–2800 and 1800–900 cm−1 were selected, and spectra were normalized by EMSC [64,65]. PCA analysis was done on the preprocessed spectra of each genus separately and correlation loading plots were obtained to find correlations between design parameters such as temperature and media, and spectral variables. Only the subset of spectral variables (peaks) was plotted on the correlation loading plots. To find peaks, the minima were obtained by using the second derivative of the Savitzky–Golay algorithm [62] with 13, 17, 21, and 13 windows sizes for lipid, mixed, protein, and polysaccharide regions, respectively, and second order polynomial. For some genera we had only spectra from BHI medium since there was no growth on the minimal media observed. For the correlation analysis the following IR peaks were selected: for the lipid region—2962 cm−1, 2927 cm−1, 2925 cm−1, and 2854 cm−1 peaks representing –C–H (CH3)/–C–H (CH2)/CH2/CH3 stretching, and 1745 cm−1, 1743 cm−1, and 1741 cm−1 representing ester bond stretching, for mixed—1456 cm−1, 1454 cm−1, 1394 cm−1, 1380 cm−1, 1338 cm−1, 1336 cm−1, 1313 cm−1, 1311 cm−1, and 1305 cm−1 peaks representing CH2/CH3 bending modes or deformation of this functional groups modes, 1404 cm−1, 1402 cm−1, and 1400 cm−1 representing C=O symmetric stretching vibrations of COO functional groups and 1243 cm−1, 1242 cm−1, and 1240 cm−1 representing –P=O stretching vibrations of phosphodiesters; and, for proteins, 1654 cm−1, 1548 cm−1, and 1546 cm−1 peaks characterizing the Amide I and Amide II bands of proteins [66]. Peaks from the polysaccharide region were not included in the correlation analysis as we did not observe any nutrient- and temperature-induced changes when using this region.

3. Results

3.1. Growth Ability under Different Nutrient and Temperature Conditions

The ability of the green snow bacteria to grow on different media and temperatures was analyzed by the daily growth evaluation and it was expressed by the score-based scale (Table 3). All bacterial isolates showed a good growth on rich complex BHI agar at 18 °C with colonies in the diameter from 1.5 to 2.0 mm to higher than 2.5 mm depending on the isolate, except Polaromonas sp. BIM B-1676, which had relatively small size colonies of about 0.5–1.0 mm in a diameter. Cultivation of isolates on BHI agar at 10 °C and 4 °C provided slightly smaller colonies and, in some cases, a considerable growth reduction was observed, as for example for Salinibacterium isolates (Table 3). Similar results were obtained for bacteria grown on BHI at 25 °C, where there was a noticeable decrease in the colony size for all green snow bacteria, except for Pseudomonas isolates, and some of Rhodococcus and Arthrobacter isolates. Interestingly, Pseudomonas isolates, when grown on BHI agar, were characterized by the equally good growth ability at all tested temperatures.
Cultivating the green snow bacteria on synthetic minimal agar media showed that all isolates of genera Arthrobacter, Pseudomonas, Rhodococcus (except Rhodococcus yunnanensis BIM B-1621), and isolate Leifsonia antarctica BIM B-1671 had a good growth, while all isolates of Cryobacterium, Paeniglutamicibacter, Polaromonas, Psychrobacter, Salinibacterium, Leifsonia (except Leifsonia antarctica BIM B-1671), and isolate Rhodococcus yunnanensis BIM B-1621 had little to no growth (Table 3). Generally, the size of colonies for bacteria grown on synthetic minimal agar was smaller than when grown on rich complex BHI agar, except for Pseudomonas isolates, which showed equally good growth ability on all media and temperatures. Similarly, as on BHI agar, an increase in the temperature up to 25 °C resulted in smaller colonies than at lower temperatures (Table 3). Isolates of Arthrobacter could be characterized by a quite diverse isolate-specific growth ability, where isolates Arthrobacter cryoconiti BIM B-1627 and Arthrobacter sp. BIM B-1666 were not able to grow on minimal media at 25 °C and Arthrobacter oryzae BIM B-1663 was not able to grow on minimal media at 4 °C. All isolates were able to utilize glucose and glycerol, except Paeniglutamicibacter antarcticus and Salinibacterium sp., which, according to the literature, are not able to utilize these carbon sources [67,68,69]. Interestingly, isolate Leifsonia antarctica BIM B-1671 grew well on the minimal media at lower temperatures but not at 25 °C, while other Leifsonia isolates were not able to grow at minimal media.
In addition to the growth ability, we evaluated the cultivation time, which differed depending on the type of the medium and temperature. Cultivation on BHI agar showed faster growth than cultivation on the minimal media (Table S1). The fastest growth was detected for almost all bacteria cultivated on BHI agar at the optimum growth temperature of 18 °C (Table S1), while cultivation on the minimal media had the longest growth time, especially at low temperature (Table S1).

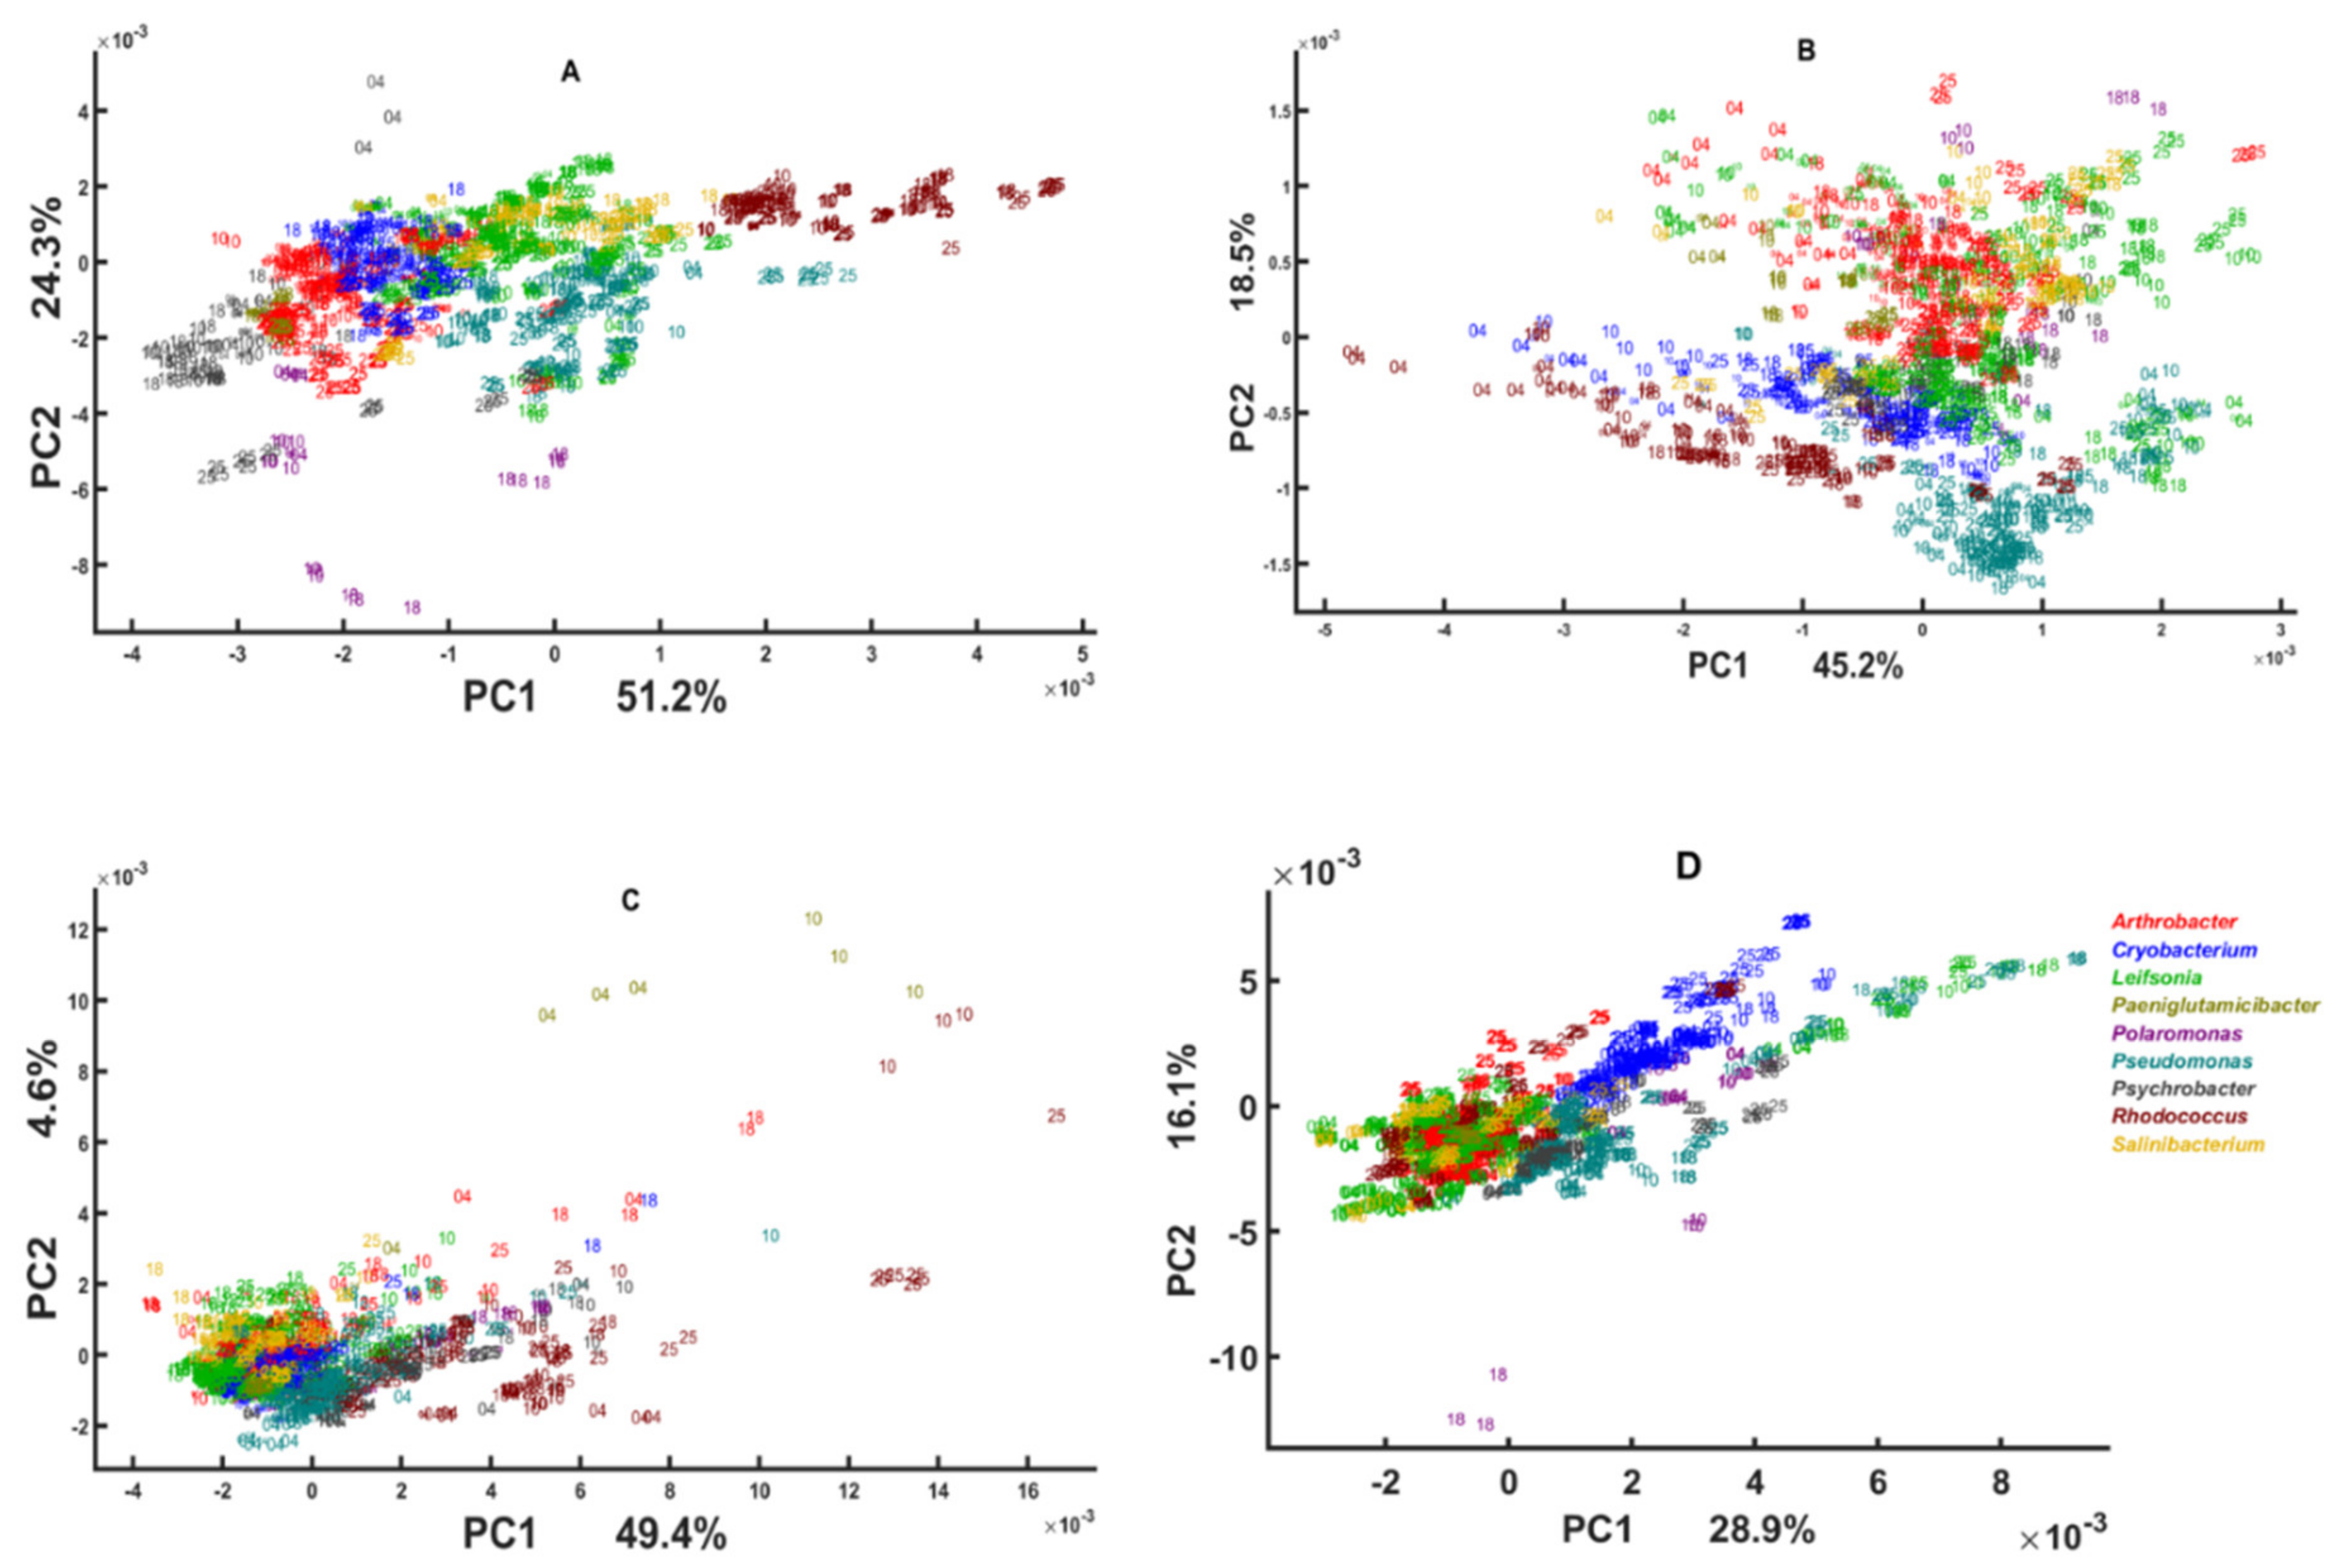
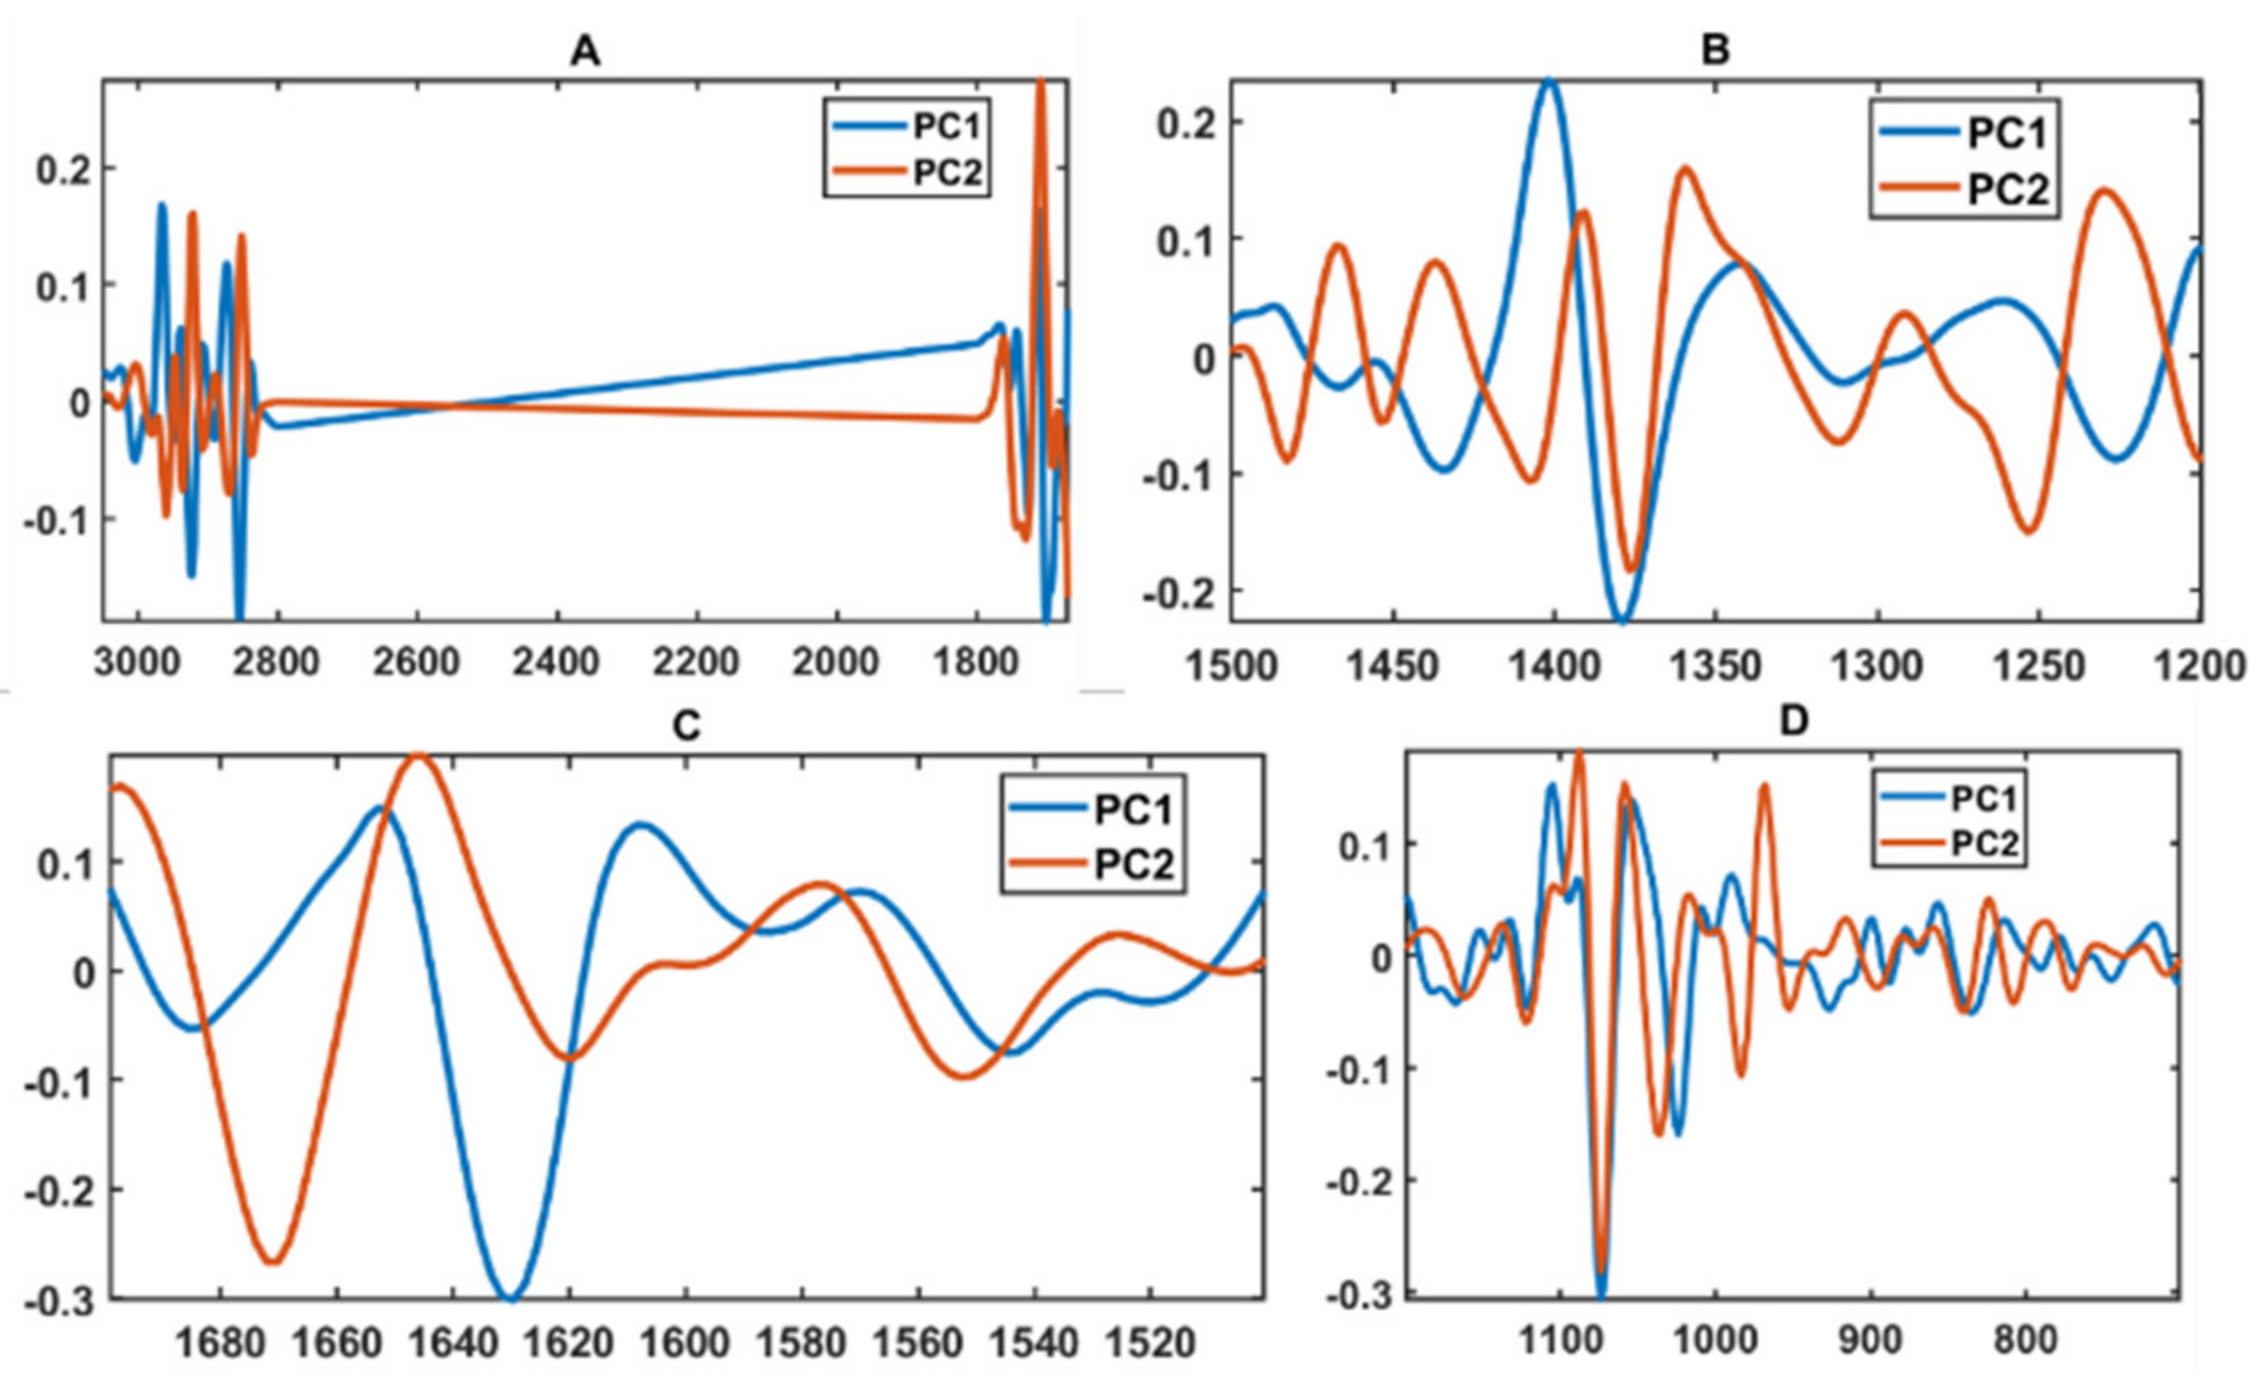
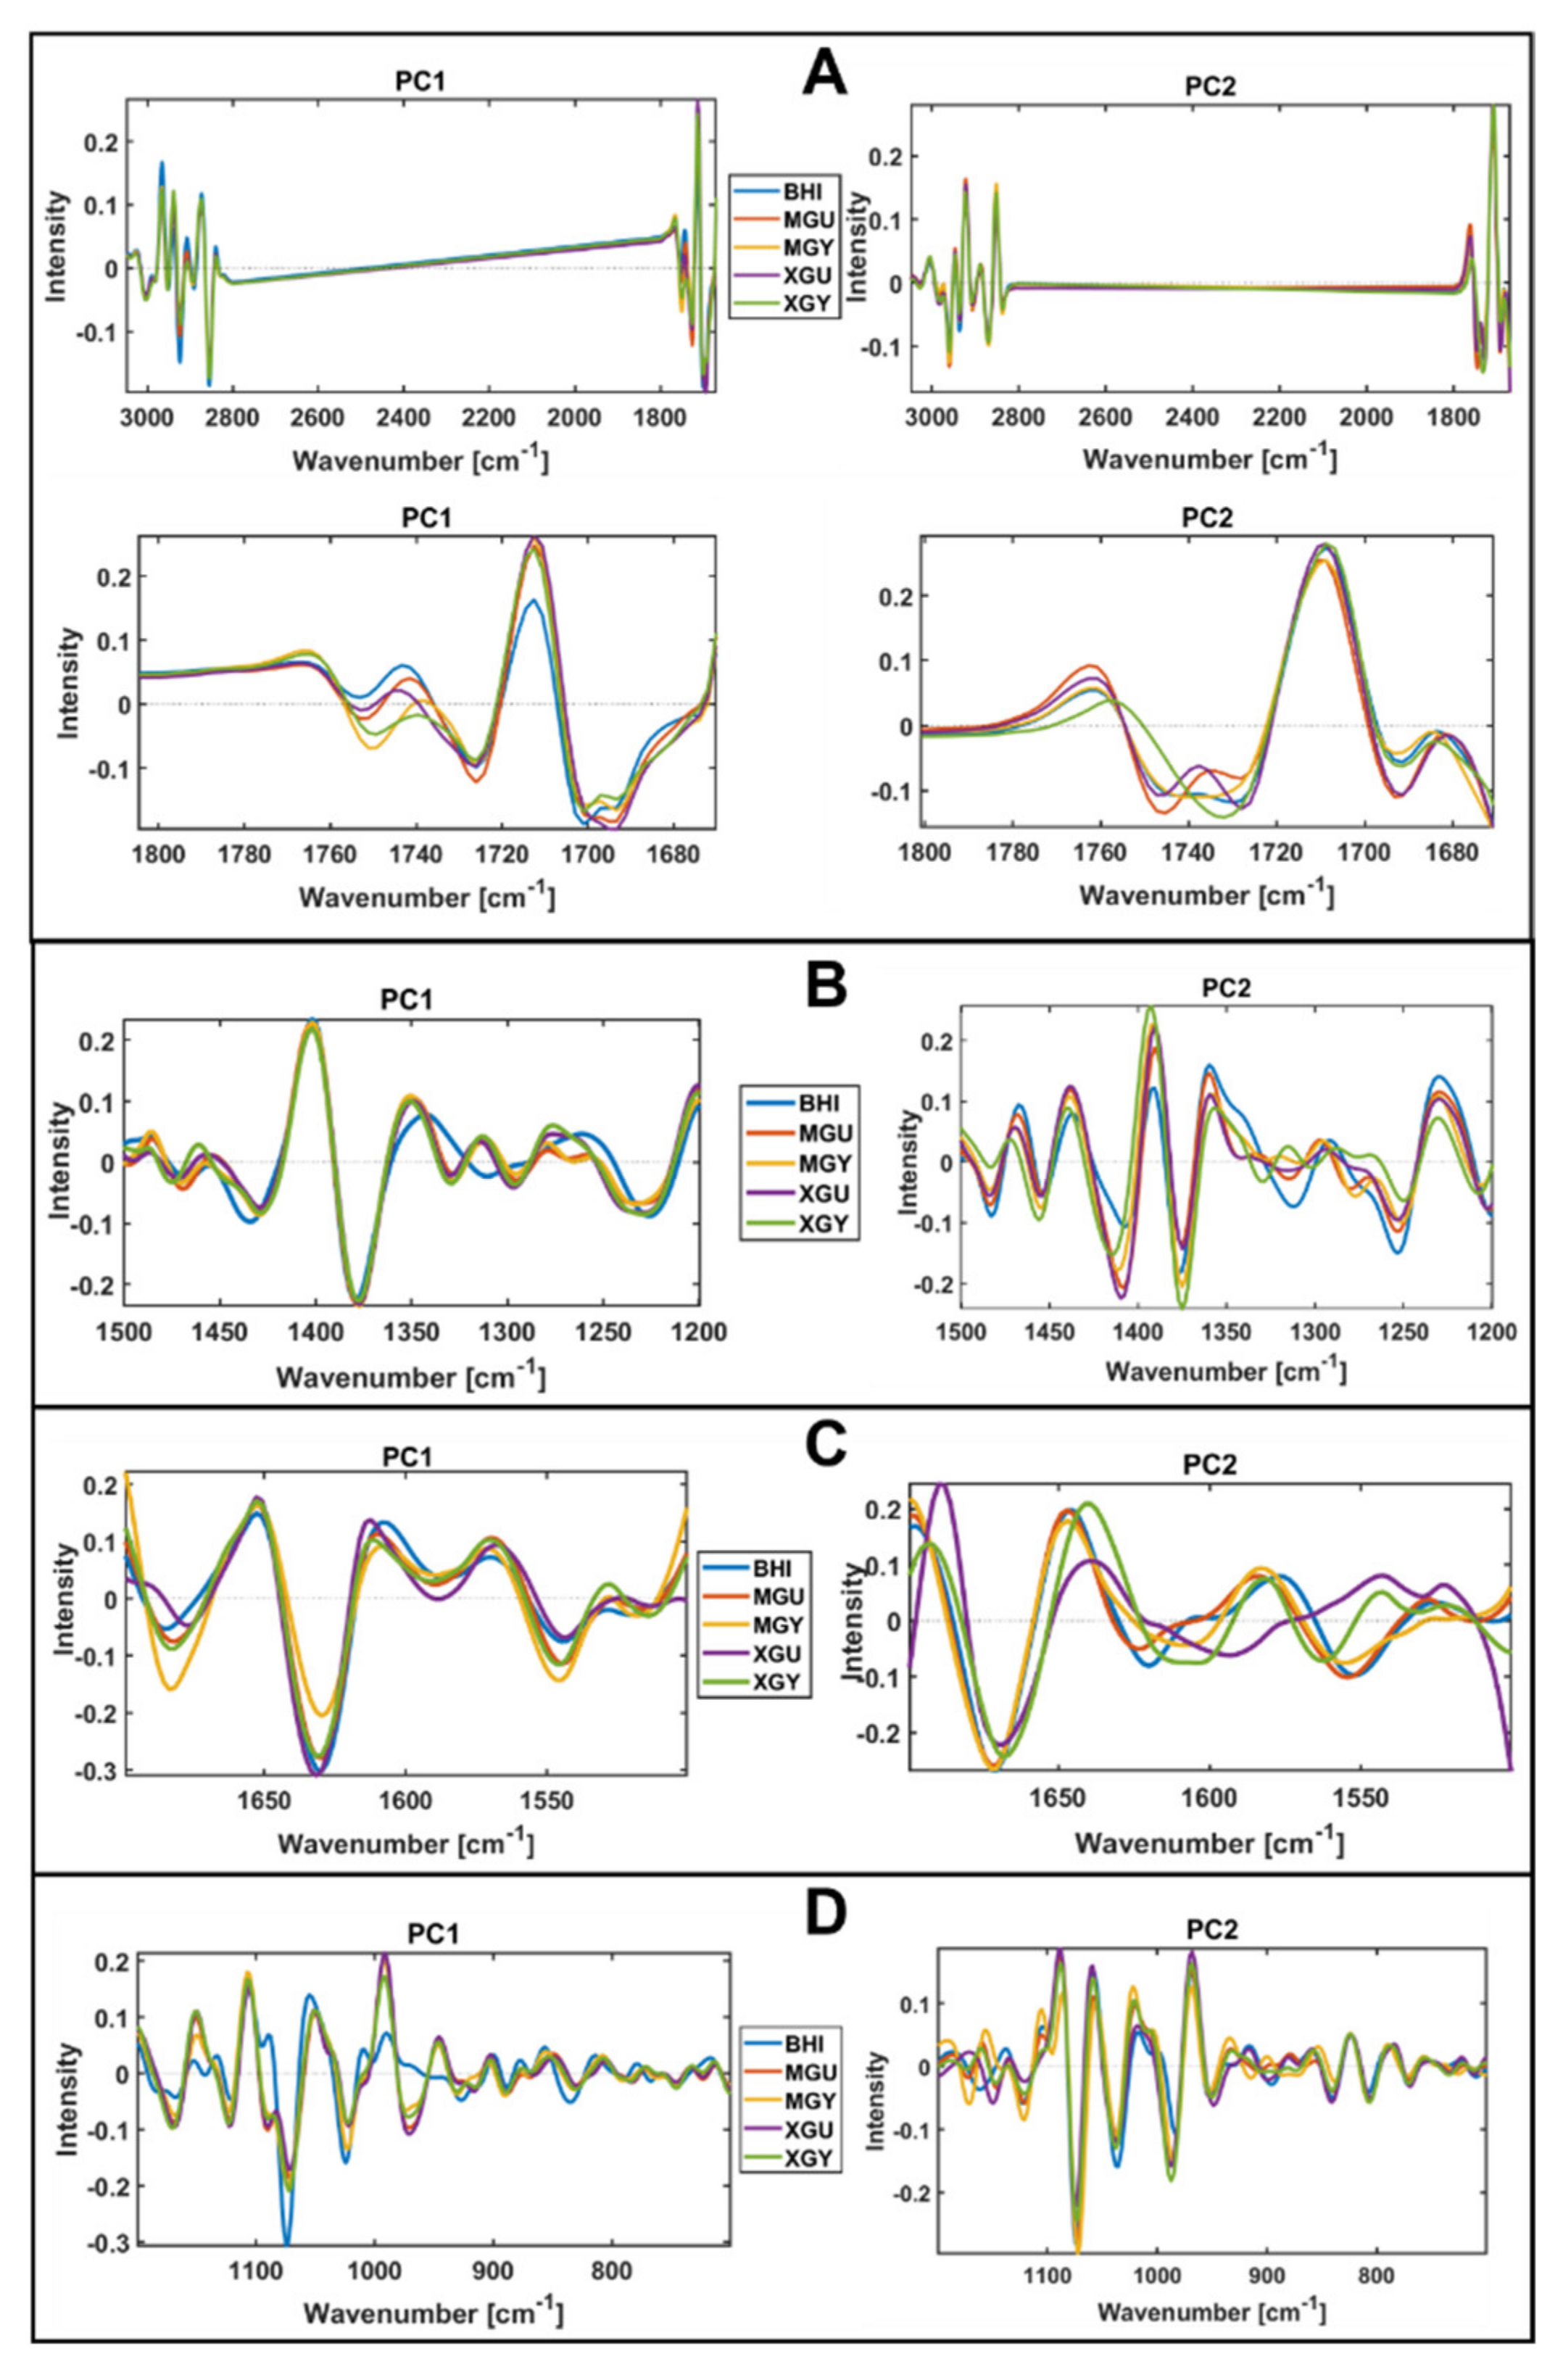
3.2. Chemical Profile Changes under Different Temperatures and Media

FTIR spectroscopy chemical profiling was performed for all isolates cultivated on BHI agar and cultivation on the minimal media was done only for 19 isolates from the genera Arthrobacter (9 isolates), Pseudomonas (6 isolates), Rhodococcus (3 isolates), and Leifsonia antarctica BIM B-1671 since other 26 isolates from genera Crybacterium (6), Salinibacterium (4), Psychrobacter (3), Paeniglutamicibacter antarcticus BIM B-1657, Polaromonas sp. BIM B-1676 and Rhodococcus yunnanensis BIM B-1621 (1) were not able to grow on these media.
In order to get a general overview over the chemical differences based on phylogeny, we performed multi-block principal component analysis (also called consensus PCA or CPCA [70]) using different media as blocks. CPCA analysis was done separately for different IR spectral regions: lipid, protein, mixed, and polysaccharide. The CPCA models were built using the averaged spectra of the samples’ replicates, both biological and technical. Thus, one spectrum is obtained for each strain cultivated under one growth condition. This was due to the nature of the multi-block analysis where each sample in one block, representing one medium, should correspond to one sample in another block. Since many strains did not grow on all five media, many spectra were removed, and only those which were obtained for all media were used for the analysis.
The BHI medium block scores of three multi-block models are presented in Figure 1 and loadings on Figure 2. To obtain these plots with isolates of all genera present, all samples with their replicates were projected onto the multi-block block scores corresponding to BHI medium. As it can be seen, the multi-block scores obtained from the lipid spectral region (Figure 1A) provide the best phylogeny-based separation on the genus level, where bacterial isolates of the genera Rhodococcus, Psychrobacter, Pseudomonas, and Polaromonas are clustered out from the main cloud formed by Cryobacterium, Leifsonia, Arthrobacter, Paeniglutamicibacter, and Salinibacterium isolates. In the main cloud we see that Arthrobacter and Cryobacterium isolates organized into two distinct clusters close to each other and Cryobacterium isolates clustered close to the Leifsonia, Paeniglutamicibacter, and Salinibacterium isolates, which did not show any clear clustering and were completely overlapping (Figure 1A). It should be noted that, while Rhodococcus and Polaromonas isolates are distinctly clustered out of the main cloud, isolates of Psychrobacter were closely positioned to Arthrobacter and Pseudomonas to Leifsonia isolates. BHI block scores of the mixed region shows a different clustering where only Rhodococcus and Pseudomonas are distinctly clustered out of the main cloud and Cryobacterium and Arthrobacter isolates are clearly separated, while overlapping with Leifsonia, Paeniglutamicibacter, Polaromonas, Psychrobacter, and Salinibacterium isolates (Figure 1B). CPCA loading plots for the lipid region (PC1/PC2) identify lipid-associated peaks responsible for the obtained clustering: (1) –C–H stretching vibrations of –CH3 and >CH3 at 2955 cm−1, 2869 cm−1, and 2937 cm−1, respectively [71]; (2) –C–H stretching vibrations of –CH2 at 2925 cm−1 and 2854 cm−1; (3) C=O stretching at 1743 cm−1 and 1739 cm−1 (Figure 2A). Also, lipid-associated bands such as –C–H stretching bands (1408 cm−1 and 1377 cm−1) identified to be significant on the loading plots for the mixed region. In addition, PO−2 asymmetric stretching of phosphodiesters in phospholipids at ~1230 cm−1 (PC1) and ~1250 cm−1 (PC2) is shown to be significant in this region (Figure 2B).
Multi-block analysis of the protein region does not show any discriminative clustering in the BHI block scores and only some species of Rhodococcus, Paeniglutamicibacter, Arthrobacter, and Cryobacterium grown on certain temperatures were clustered out (Figure 1C), which could be due to some differences in proteins structure and/or profile, as the loading plots identify several peaks in the Amide I (1620–1700 cm−1) and Amide II (~1550 cm−1) region as significant ones (Figure 2C). Similarly, as for the protein region, the polysaccharide region did not provide a clear phylogeny-based differentiation of the green snow bacteria, and only bacteria from genera Cryobacterium, Pseudomonas, and Polaromonas and some Leifsonia isolates were clustered out of the main cloud (Figure 1D). Loading plots of the polysaccharide region identified only P=O stretching band at 1078 cm−1 related to phospholipid and phosphodiester compounds [71] and some peaks of C–O–C and C–O ring vibrations in various polysaccharides (1120 cm−1, 1037 cm−1 (PC2) and 1024 cm−1 (PC1), and 980 cm−1) (Figure 2D).
Interestingly, the CPCA analysis shows that Rhodococcus and Cryobacterium isolates have very different lipid profile (Figure 1A), while the polysaccharide and protein profile of these isolates looks more similar (Figure 1C,D).
All spectral regions show significant temperature-based differences for isolates of different genera. Thus, for the lipid region, Psychrobacter, Pseudomonas and Rhodococcus isolates cultivated at 25 °C are separated from the ones grown at the lower temperatures (Figure 1A). For the mixed region, all the isolates cultivated at lower temperatures 4 °C and 10 °C clustered separately from the ones cultivated at higher temperatures (Figure 1B). For the protein region, temperature-induced differences can be observed for Paeniglutamicibacter isolates cultivated on 4 °C and 10 °C, and some Rhodococcus isolates cultivated on 4 °C, 10 °C, and 25 °C (Figure 1C). Cultivation at higher temperatures such as 25 °C and 18 °C for some isolates from genera Cryobacterium, Rhodococcus, and Polaromonas resulted in chemical differences observed at polysaccharide spectral region (Figure 1D).
Global scores and supper weights of three multi-block models of lipid, mixed, protein, and polysaccharide regions of the spectra of Arthrobacter, Leifsonia, Pseudomonas and Rhodococcus isolates cultivated on all agar media are presented in Figure 3, while the models’ block scores are presented in Figure 4, Figure 5, Figure 6 and Figure 7 and loading plots for the models’ block scores are presented in Figure 8. The other genera are not represented since they did not grow under these conditions and therefore could not be analyzed in a multi-block setting. Global scores represent the samples’ pattern in a global space of the multi-block model, while the weights plot suggests what blocks contributed most to this pattern. The global scores and weights are shown for the first principal components (PC1 ad PC2). The media far along the x-axis are the highest, contributing to the pattern in the global scores along the first component, PC1. The media far along the y-axis are the highest, contributing to the pattern in the global scores along the second component, PC2. Generally, the global score plots show that lipid and mixed spectral regions provide the best phylogenetic separation of the isolates on the genus level (Figure 3A,C). Somewhat worse separation was observed for the protein region, and use of the polysaccharide region showed the least discrimination on the genus level, where only Pseudomonas isolates clustered out (Figure 3E,G). One isolate of Pseudomonas overlaps with the Leifsonia isolate (Figure 3A,C,G) and shows a considerably different lipid, mixed, and polysaccharide profile from other Pseudomonas isolates. In addition, for this Pseudomonas isolate, significant temperature-induced changes were observed at the lipid region, where the lipid profile of the cells cultivated at 4 °C and 25 °C is different from the ones obtained after cultivation at 10 °C and 18 °C (Figure 3A,C). A slightly less pronounced, but similar results can be observed for this strain in a mixed region: the cells cultivated at 4 °C and 10 °C differ from the ones obtained at 25 °C and 18 °C (Figure 3B). Further, we can see that Arthrobacter isolates possess the highest variations in lipid profile when cultivated at 25 °C (Figure 3A,C). Rhodococcus isolates and overlapping isolates of Pseudomonas and Leifsonia, when grown at 4 °C, exhibit some distortions in polysaccharides (Figure 3D).
The difference in the score patterns was mostly induced by the media XGY and MGY for the lipid region (Figure 3B), BHI and XGY for the mixed region (Figure 3D), XGY and XGU for the protein region (Figure 3F), and BHI and minimal media for the polysaccharide region (Figure 3H).
Block scores of the multi-block models established using different spectral regions show that green snow bacteria grown in complex BHI medium and synthetic minimal media have various cellular chemical profiles probed by FTIR spectroscopy (Figure 4, Figure 5, Figure 6 and Figure 7). Thus, similarity of the lipid profile of Rhodococcus, Leifsonia, and Pseudomonas isolates grown on BHI agar was higher than when grown on synthetic minimal media (Figure 4 and Figure 5). According to the loading plots, such a variation in lipids when bacteria were grown on different synthetic minimal media is associated mainly with the shifts of the ester peak (C=O) between 1743 cm−1 and 1739 cm−1 depending on the media. Thus, for bacteria grown on BHI and XGU media, the ester peak was at 1743 cm−1, for MGU at 1741 cm−1 and for MGY and XGY at 1739 cm−1 (Figure 8A). In addition, loading plots of the lipid region show differences in intensity for the –C–H stretching bands of –CH3 and >CH3 and –CH2 in the region 3050–2800 cm−1 and for the C=O stretching in free fatty acids at 1710 cm−1 (Figure 8A).
When using mixed spectral region, we also observed a higher similarity of the biochemical profile for the cells grown on BHI and the cells grown on the minimal media were more distinctly different (Figure 5). Loading plots of this region show that lipid-associated bands such as –C–H stretching bands (1408 cm−1 and 1377 cm−1) and PO−2 asymmetric stretching of phosphodiesters in phospholipids at ~1230 cm−1 (PC1) and ~1250 cm−1 (PC2) are responsible for the distinctions of the cells grown on the minimal media (Figure 8B). Interestingly, cells cultivated on BHI showed different peaks identified as significant in the Amide III region (1350–1280 cm−1) (Figure 8B).
Alike lipids, the protein profile was significantly less different when these isolates were grown on BHI agar, while growth on some minimal media provided more protein-related differences as for example in the case of MGU and MGY (Figure 6). The loading plot for the protein region did not identify anything except difference in intensities and some shifts for Amide I (1620–1700 cm−1) and Amide II (~1550 cm−1) regions, indicating a change in the protein structure and profile (Figure 8C). Further, it is obvious that the lipid profile of Arthrobacter, Pseudomonas, and Rhodococcus isolates differs distinctly when grown on the synthetic minimal media (Figure 4A–D and Figure 5A–D), while less significant protein profile differences could be observed between Arthrobacter, Pseudomonas, and Rhodoccocus isolates grown on MGU and XGU media (Figure 6A,C).
The polysaccharide profile of Arthrobacter and Rhodococcus isolates grown on different media was very similar and only MGU and XGU media provided a slightly different biochemical profile for the cells (Figure 7A,C). Meanwhile Pseudomonas isolates showed to have a very distinct polysaccharide composition on all media. Loading plots of the polysaccharide region showed P=O stretching peak at 1078 cm−1 related to phospholipid and phosphodiester compounds [71] and some peaks of C–O–C and C–O ring vibrations in various polysaccharides (1120 cm−1, 1037 cm−1, and 980 cm−1) as the most significant (Figure 8D).
The cellular chemical profile of the green snow isolates of genus Arthrobacter grown on minimal agar was more strongly affected by different temperatures than when grown on complex BHI agar, while the differences between various minimal media were less significant. Growth at different temperatures showed a strain-specific effect on the chemical profile of the green snow bacteria where some isolates were affected to a higher extent and others to a lesser extent. Proteins showed to be quite consistent at different temperature and nutrient conditions, except for the XGU medium. Rhodococcus and Pseudomonas isolates showed quite consistent cell chemistry, which was not very affected by the temperatures, while all Arthrobacter isolates had a considerable change in the lipid and polysaccharide profile when grown on minimal agar at 25 °C and some isolates at 10 °C and 18 °C (Figure 4A–D and Figure 7A–D). Rhodococcus isolates and two overlapping isolates of Leifsonia and Pseudomonas had some temperature-induced changes in polysaccharides when grown at 4 °C (Figure 7) and in proteins when grown on XGU agar (Figure 6C). Lipids and polysaccharides of the isolate Leifsonia antarctica BIM B-1671 showed to be affected by the temperatures and nutrient alterations, while proteins were quite stable (Figure 4, Figure 5, Figure 6 and Figure 7).

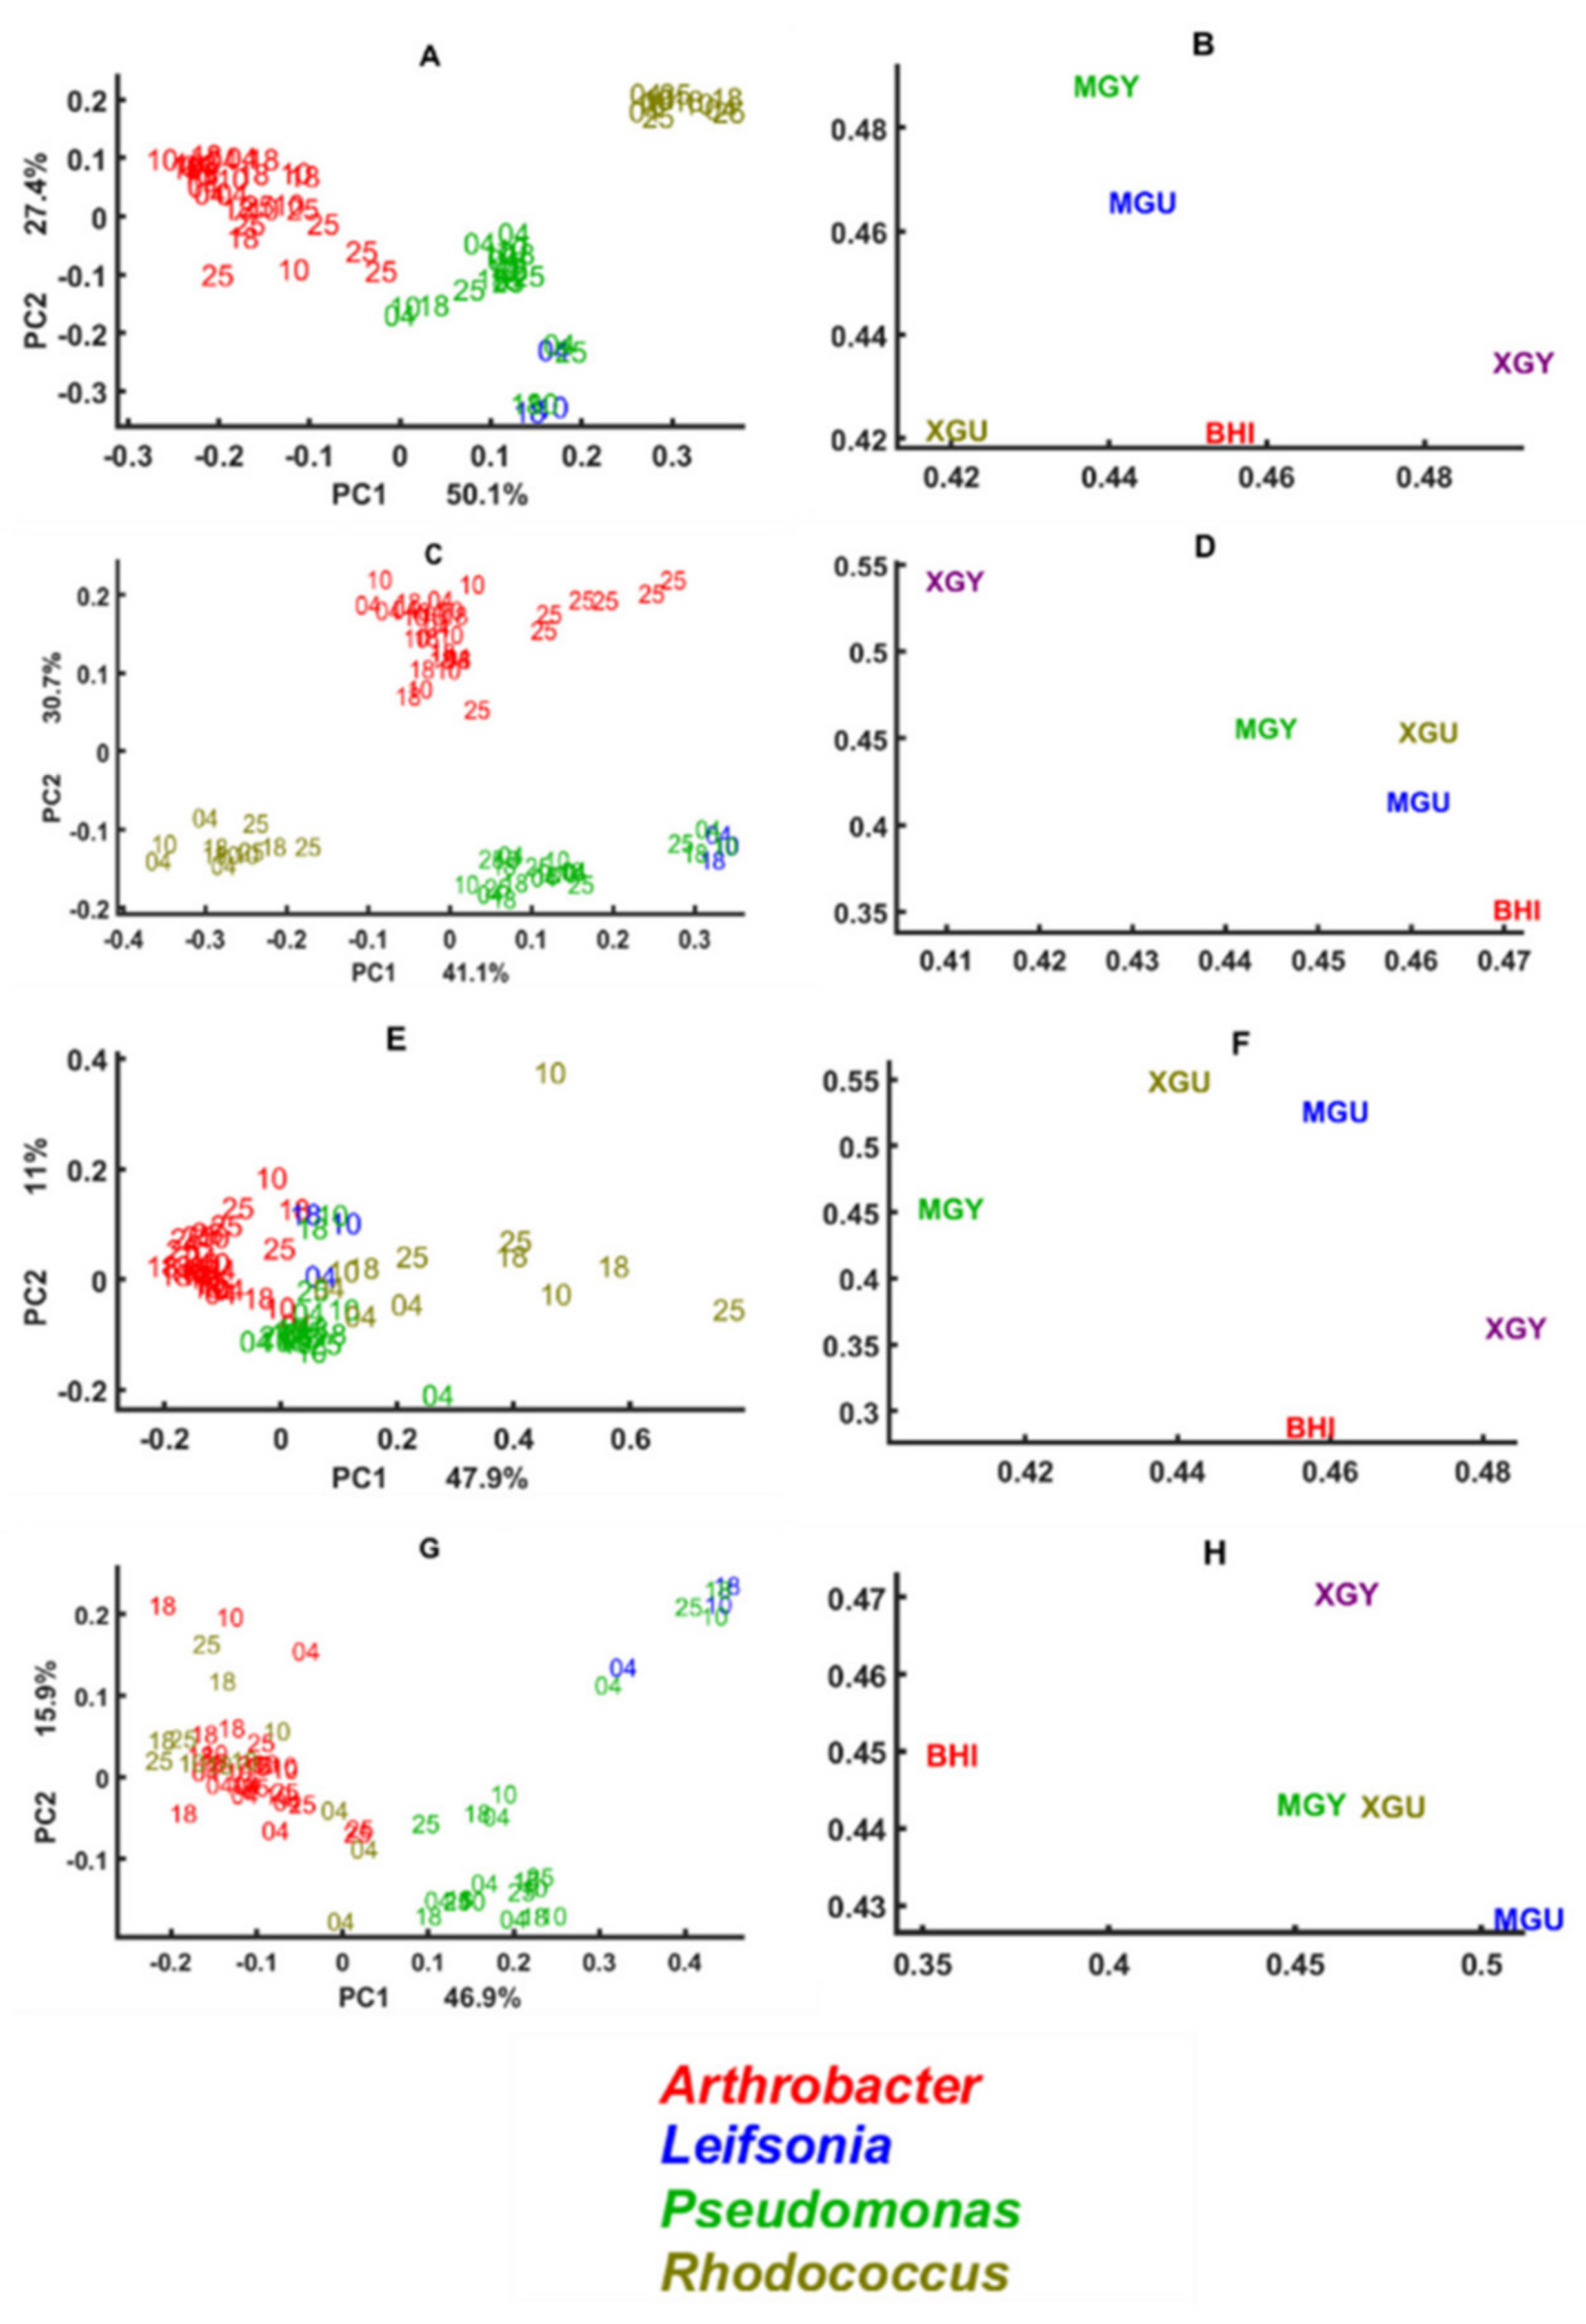
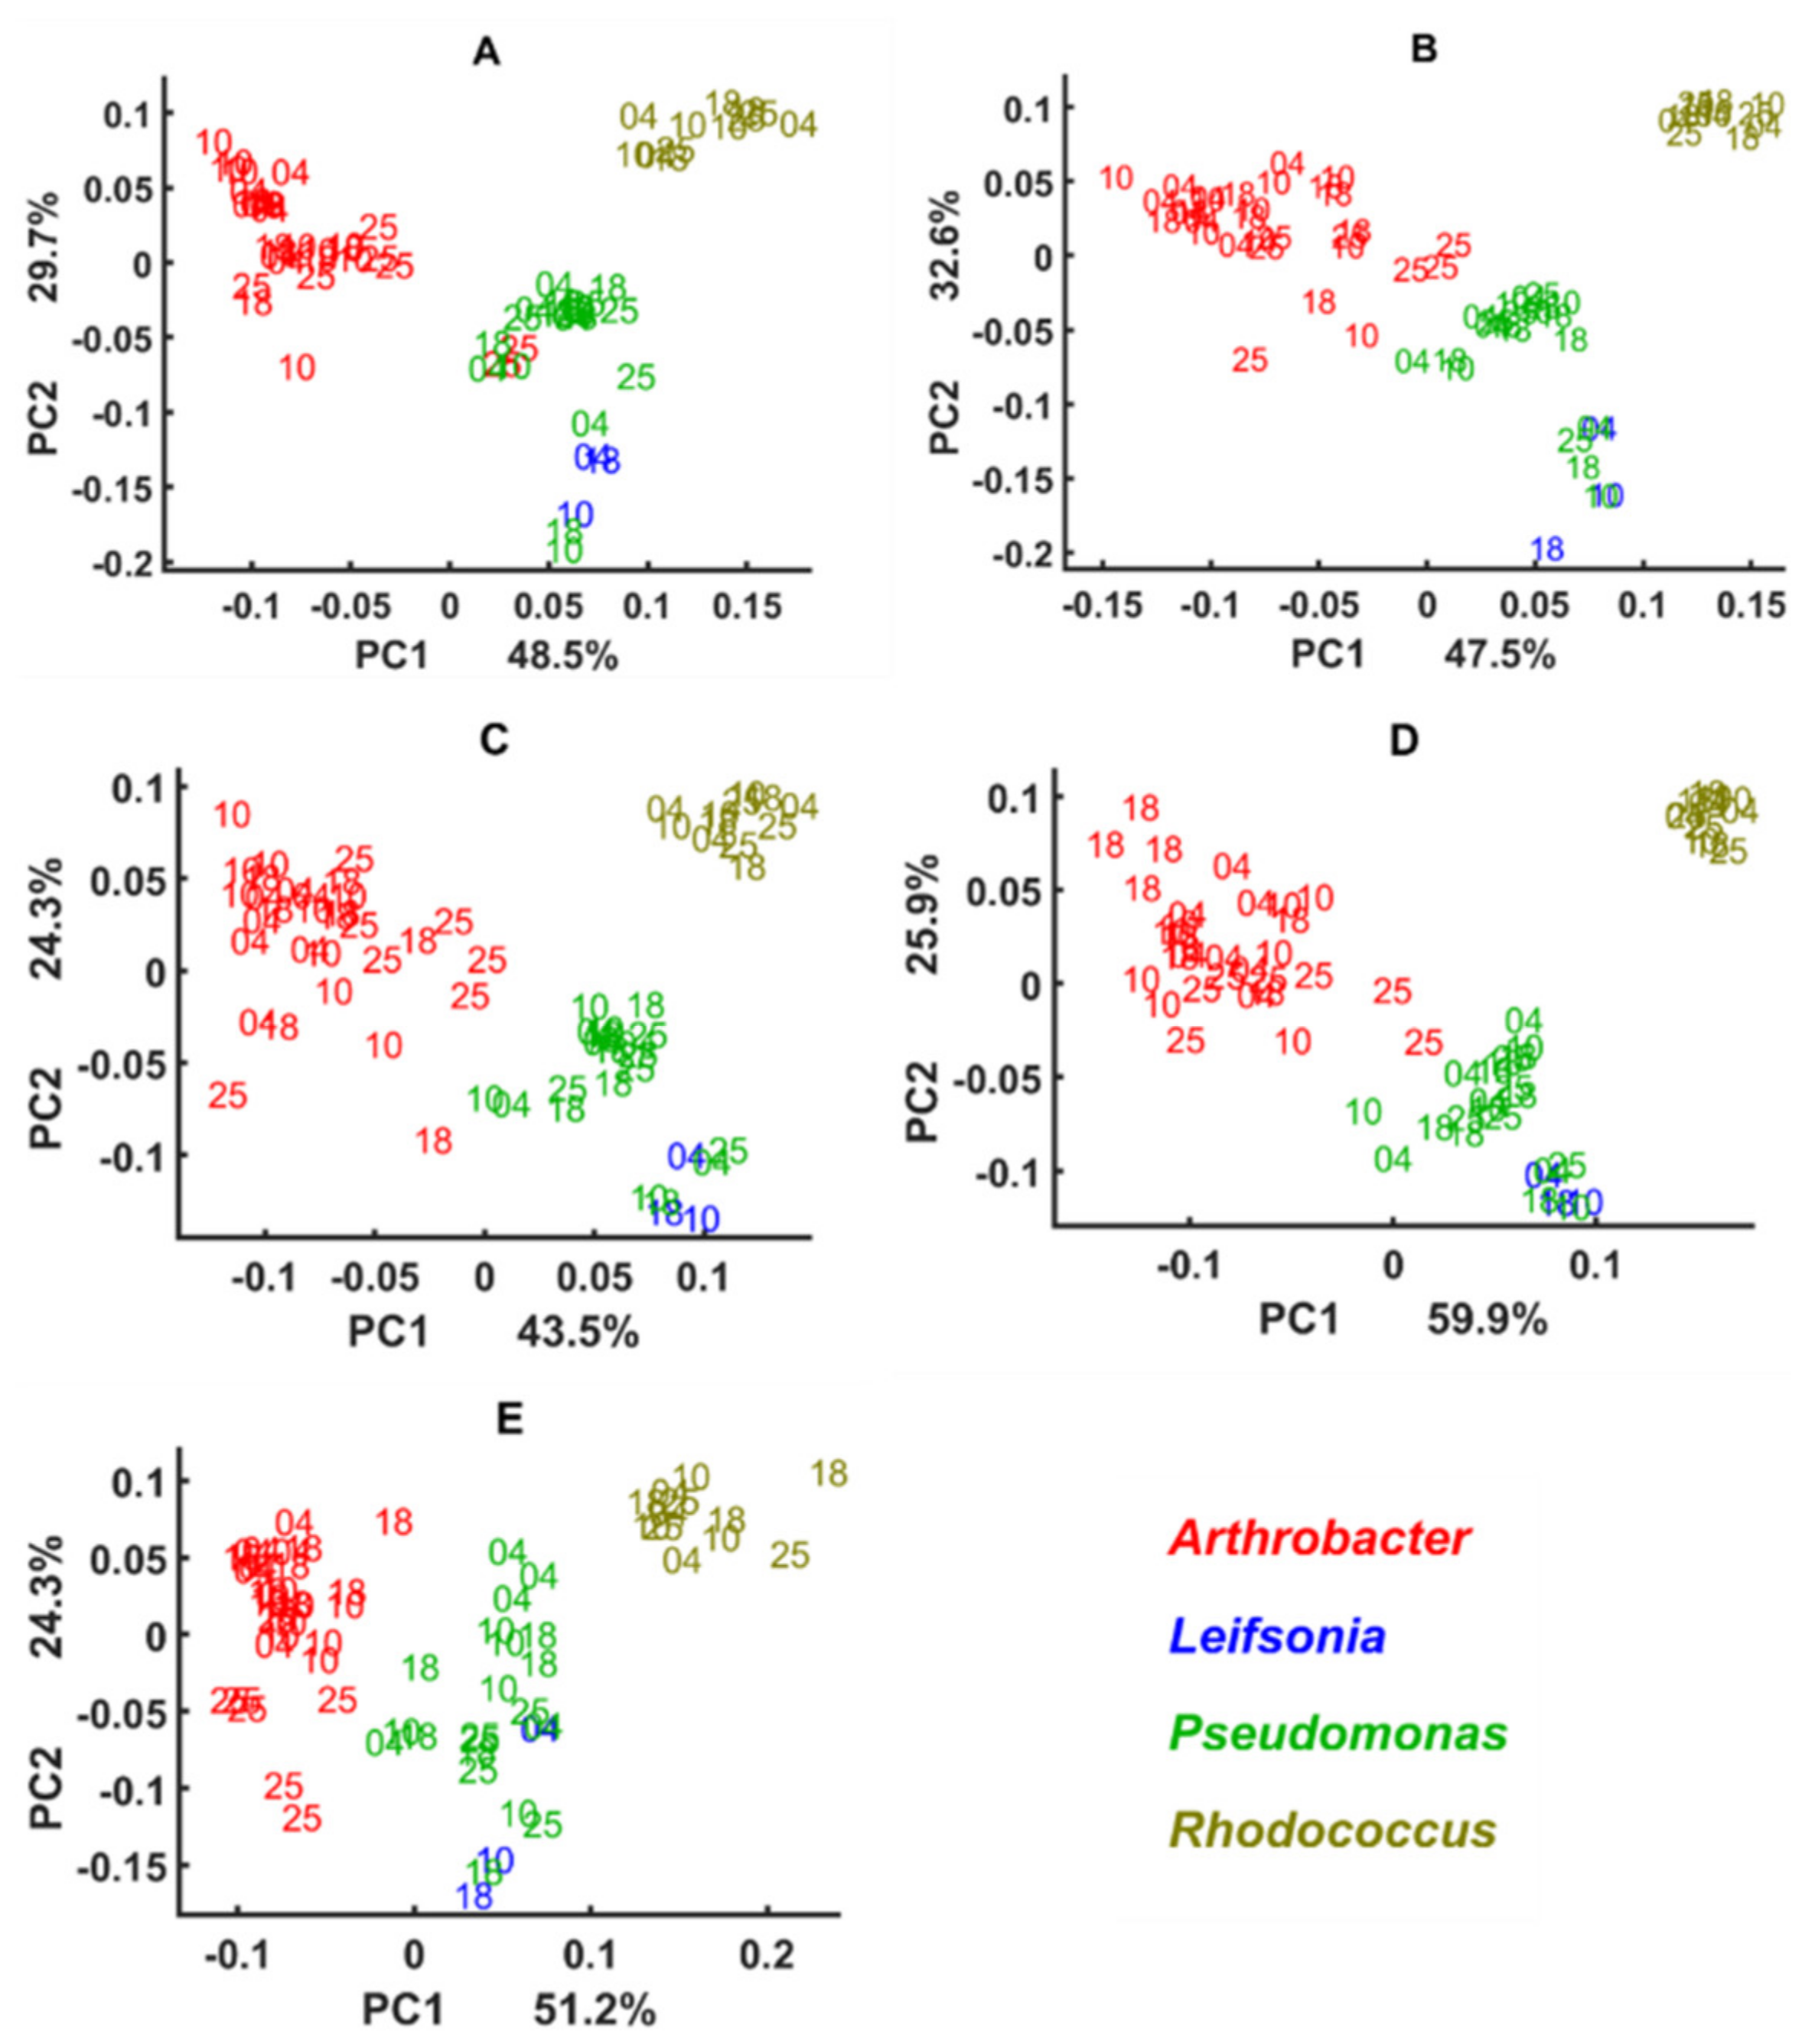
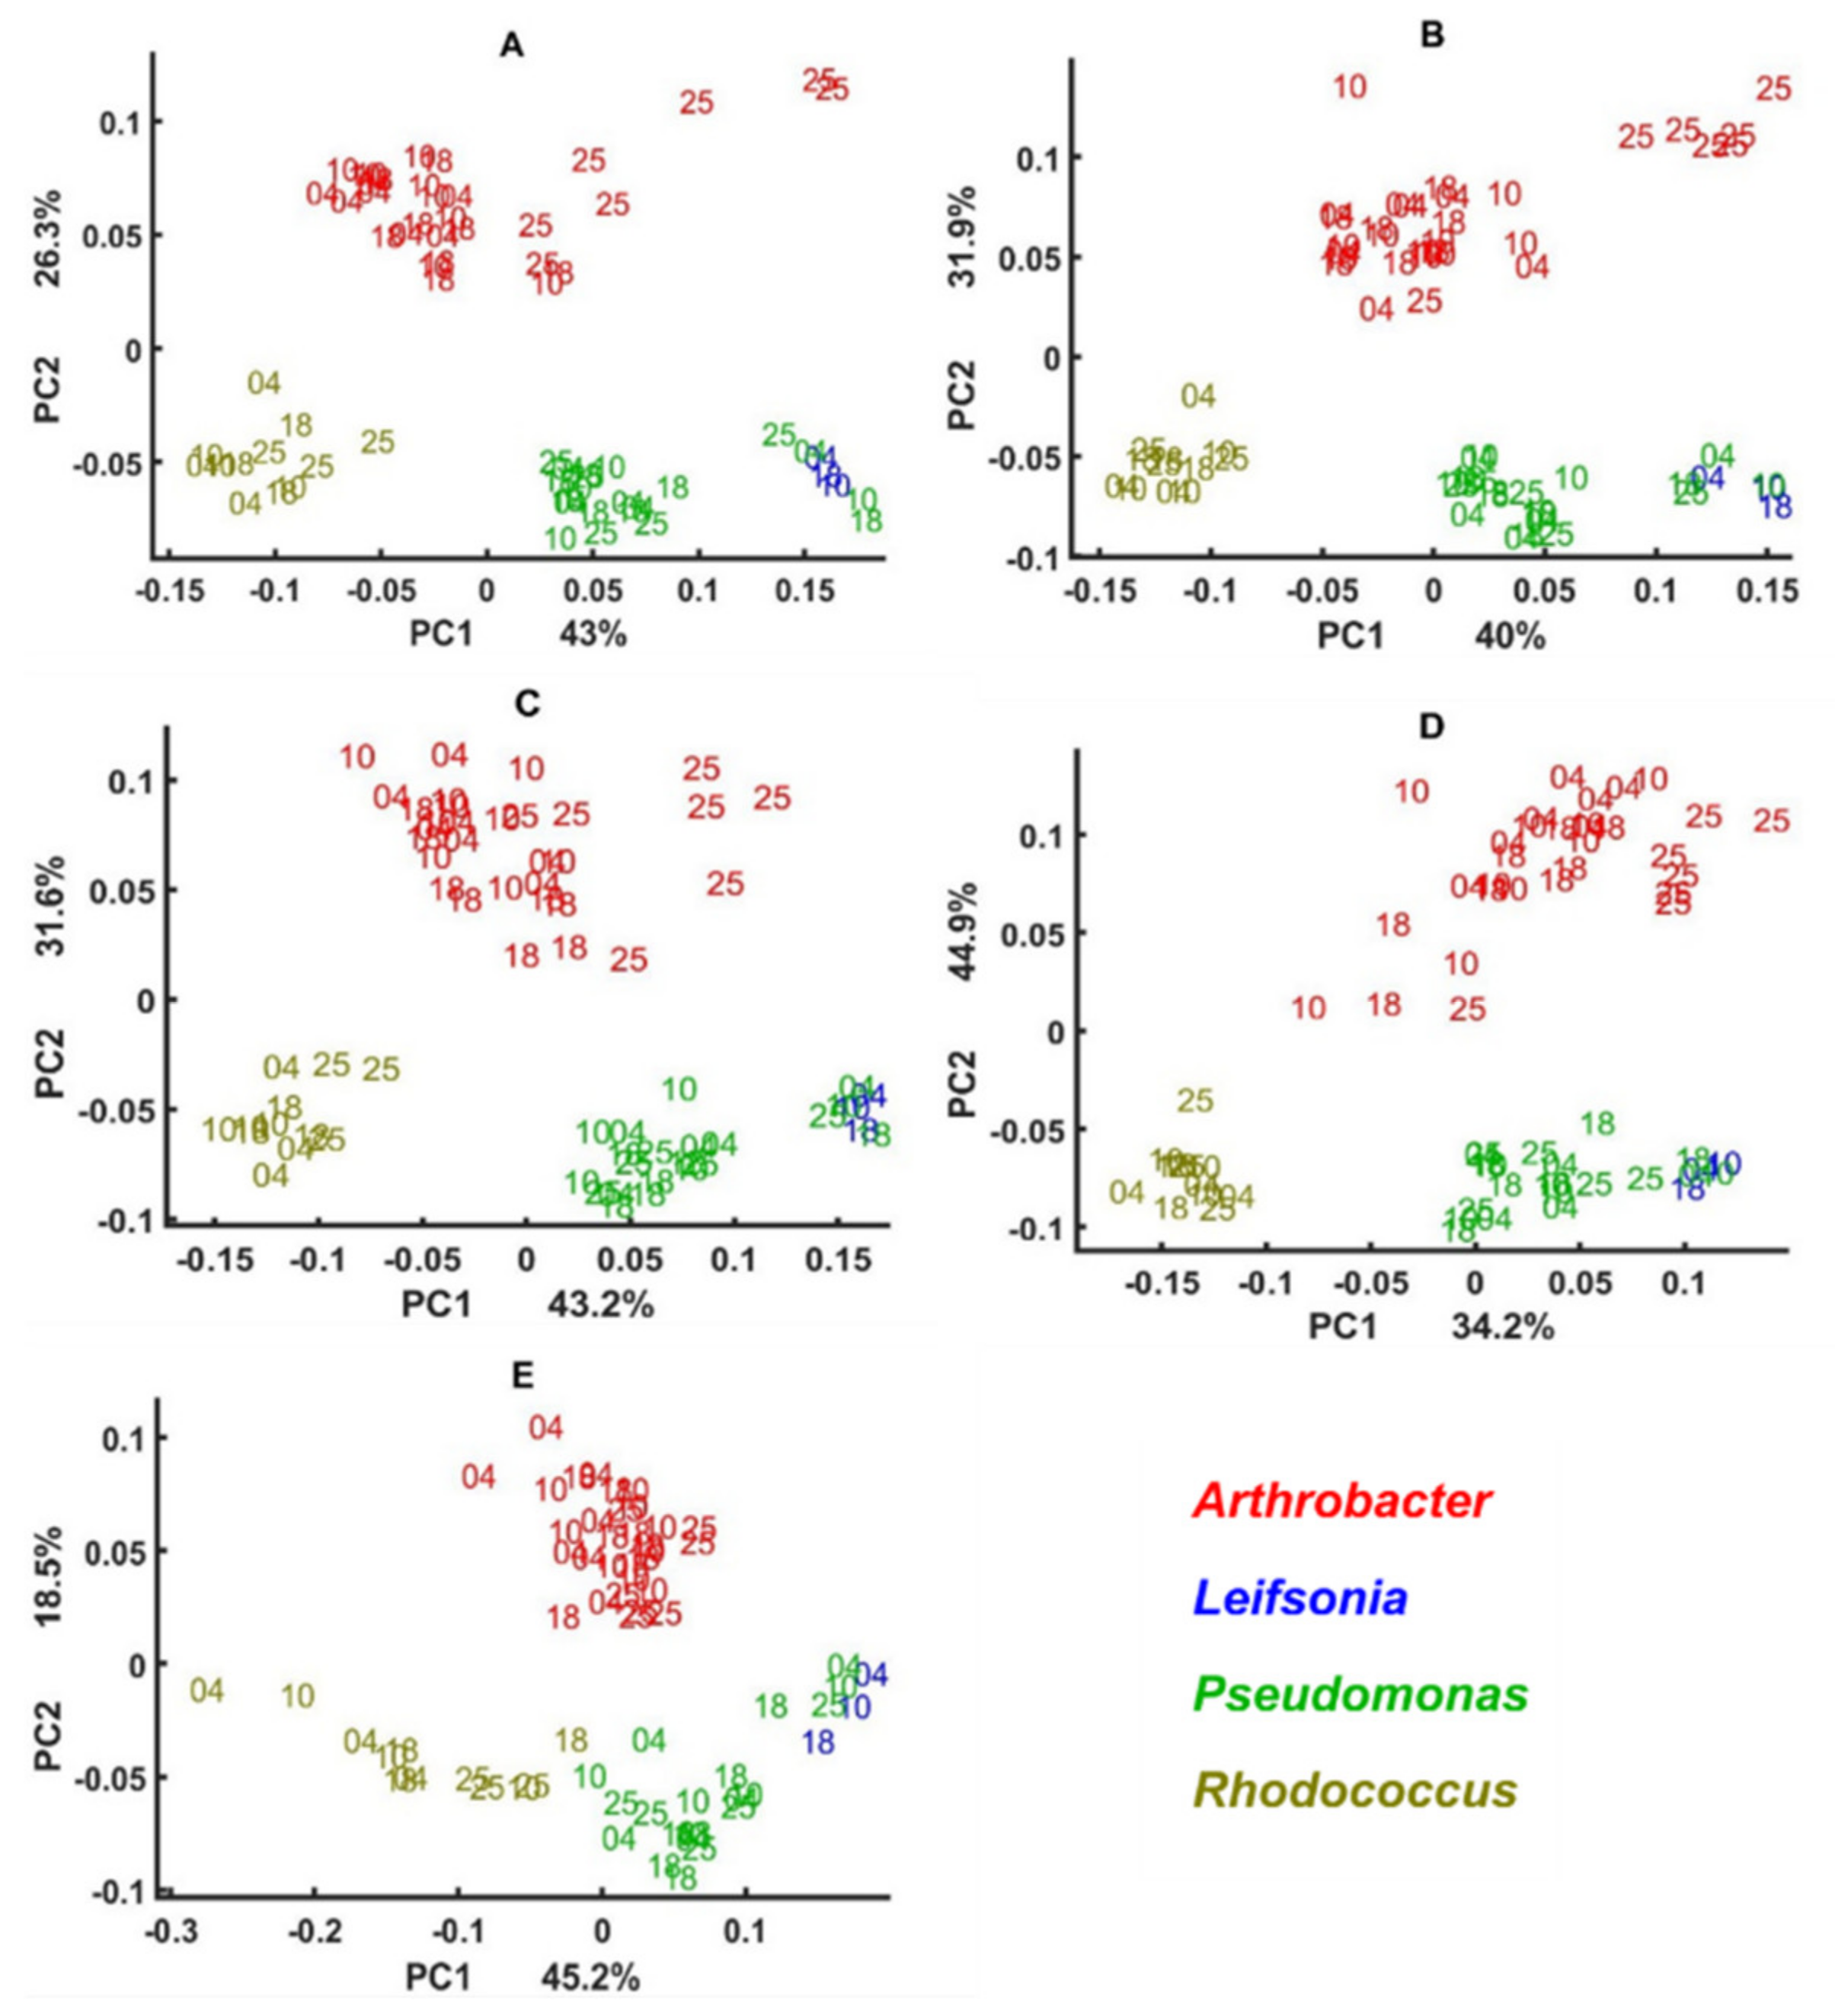
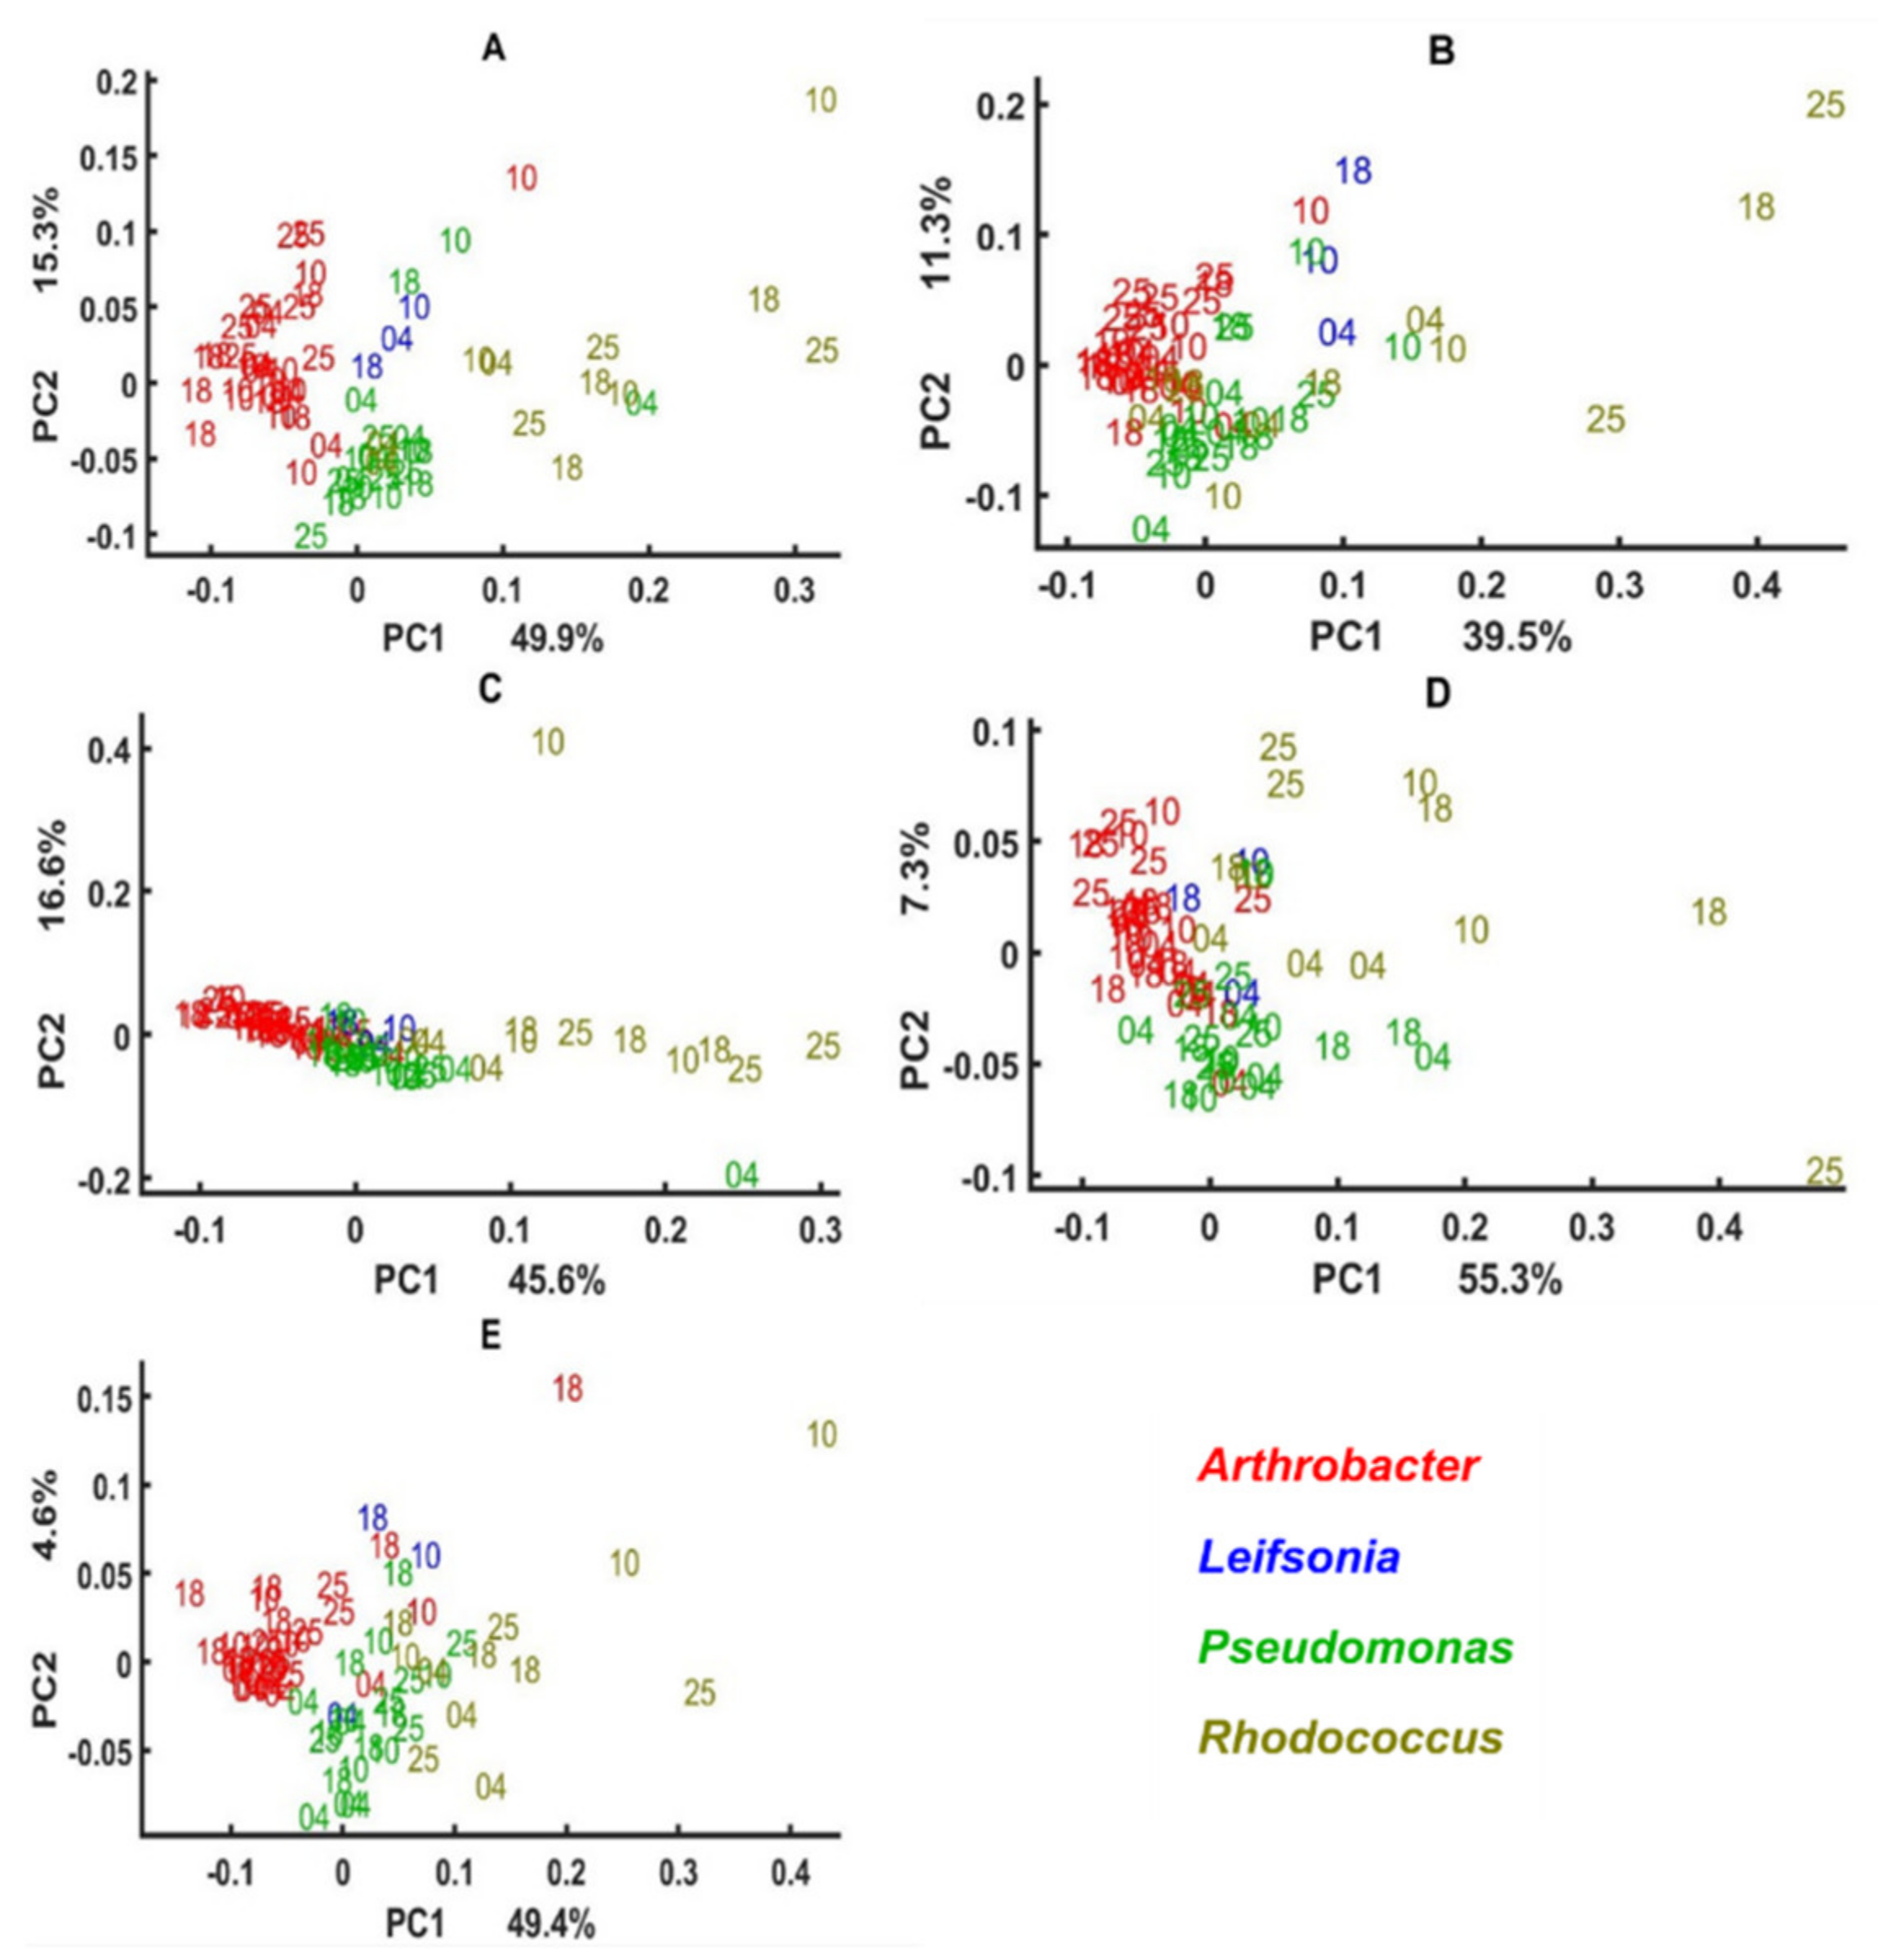
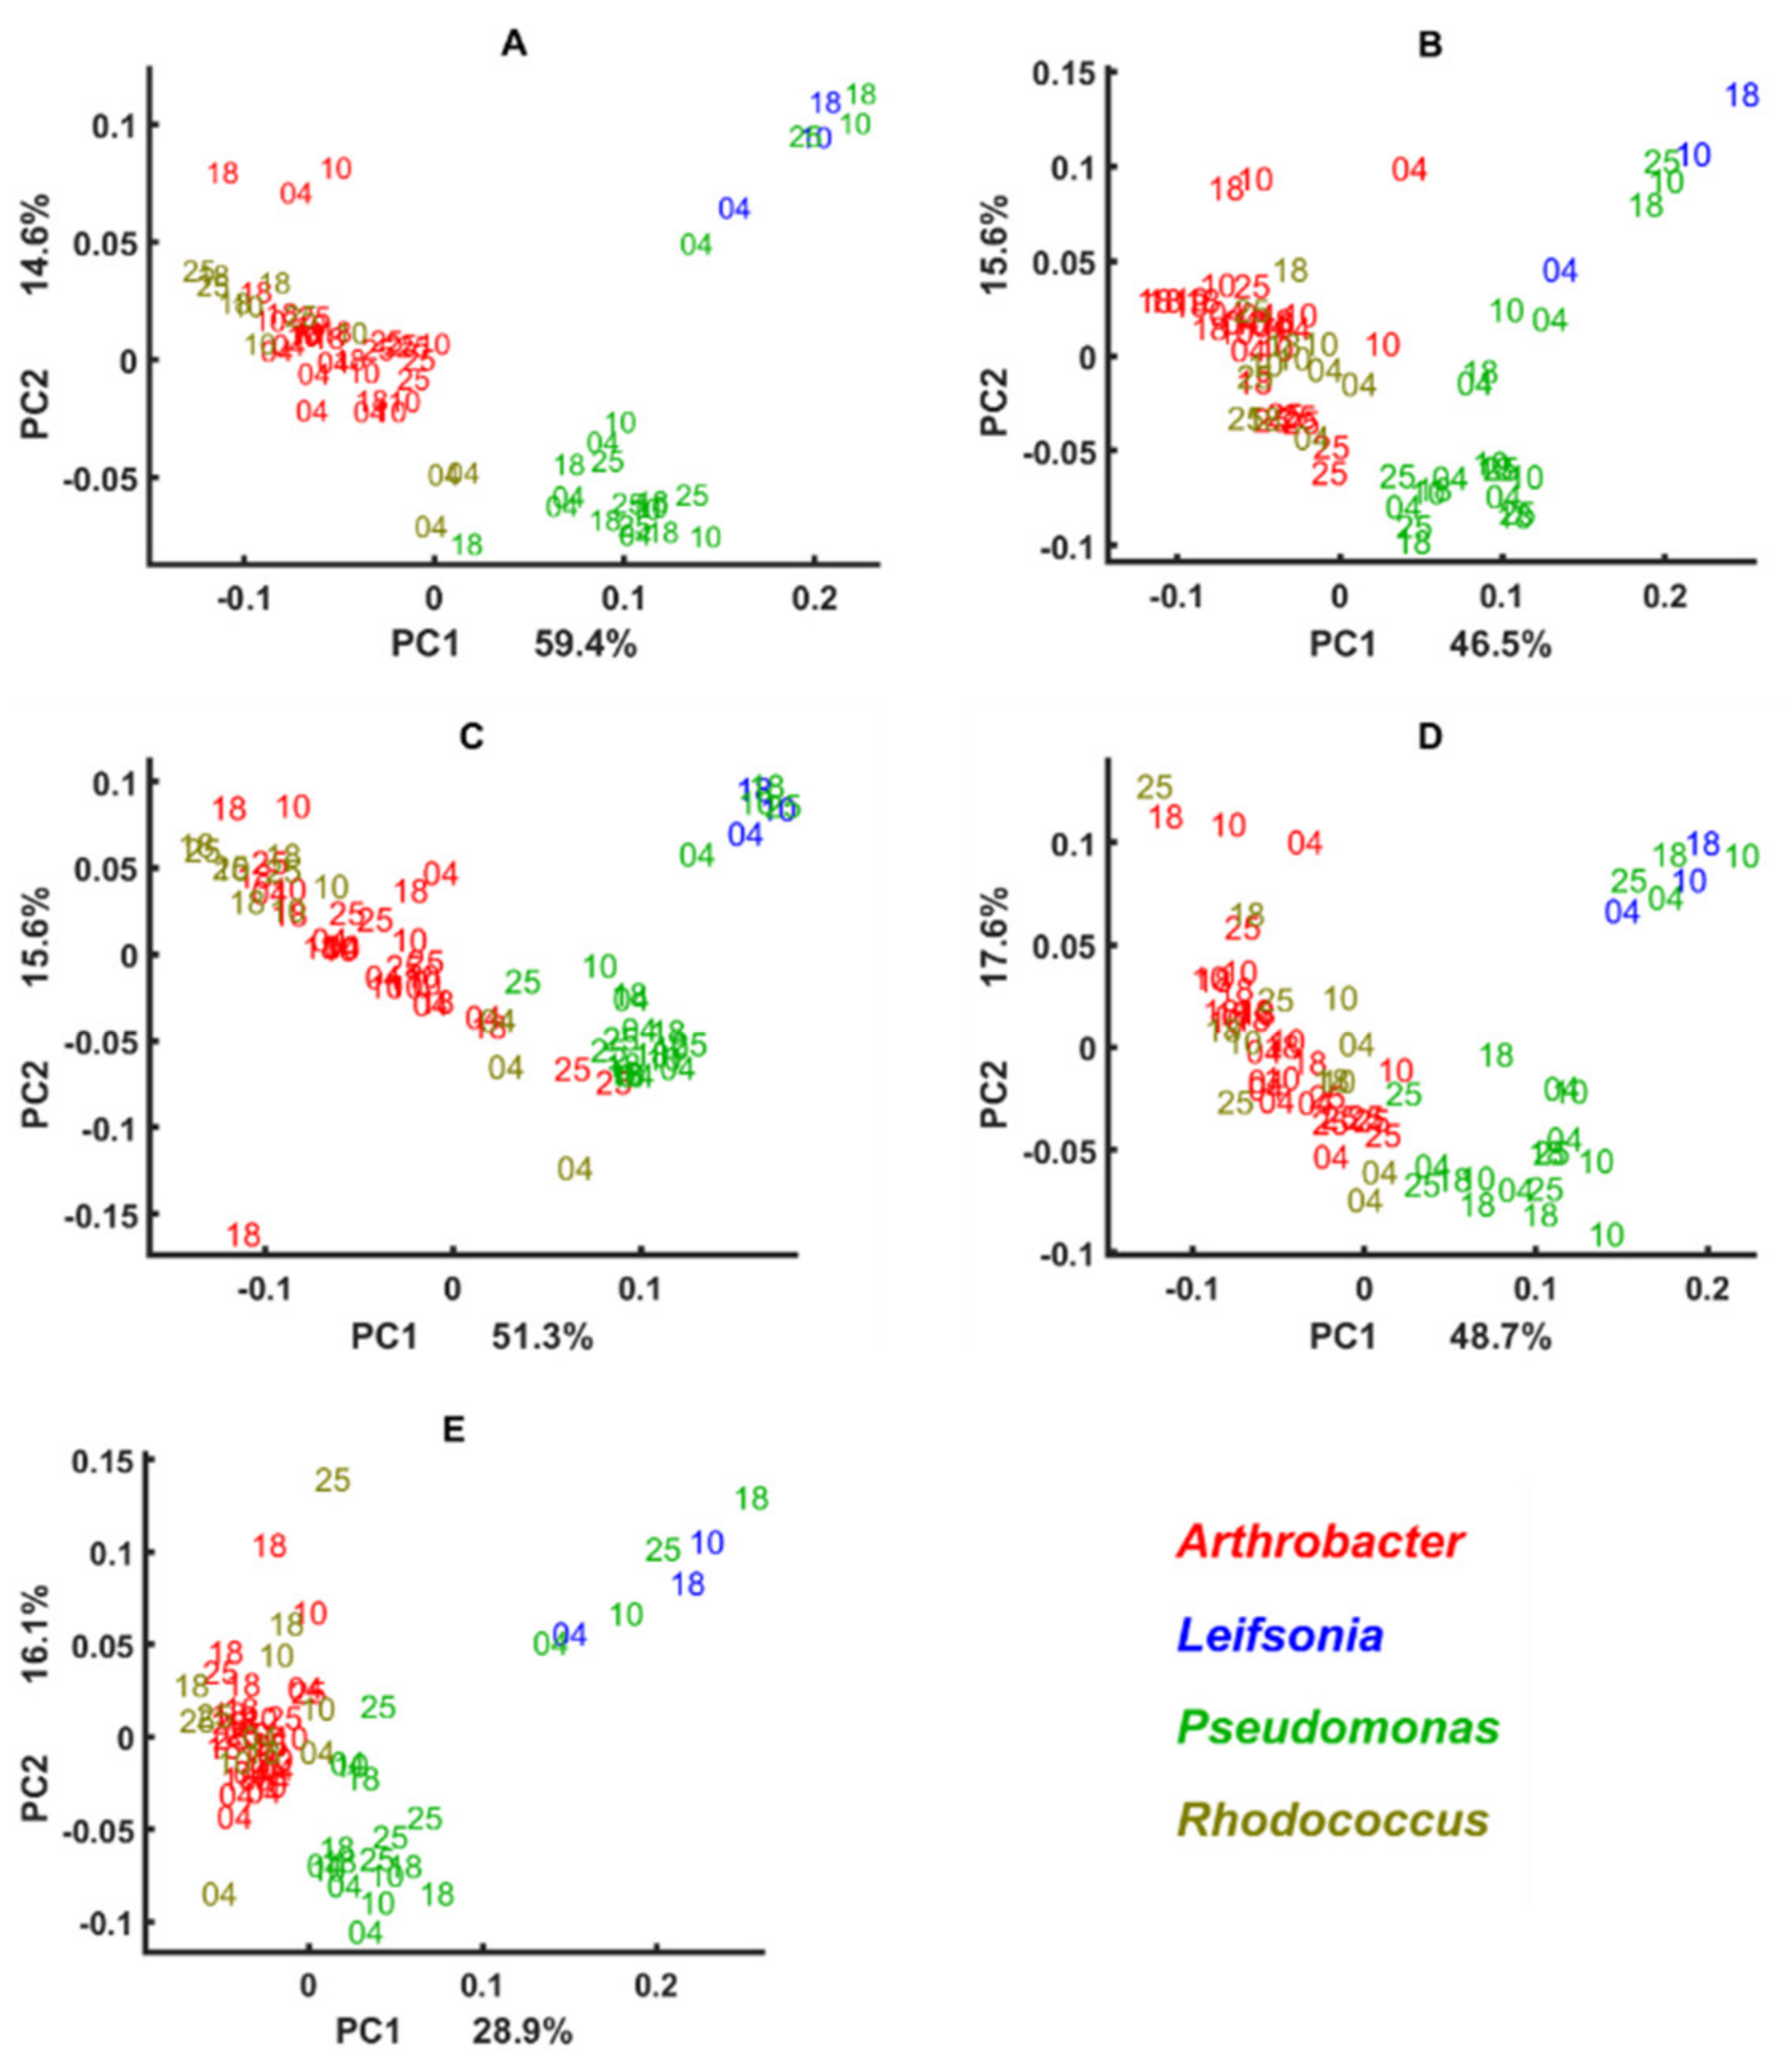
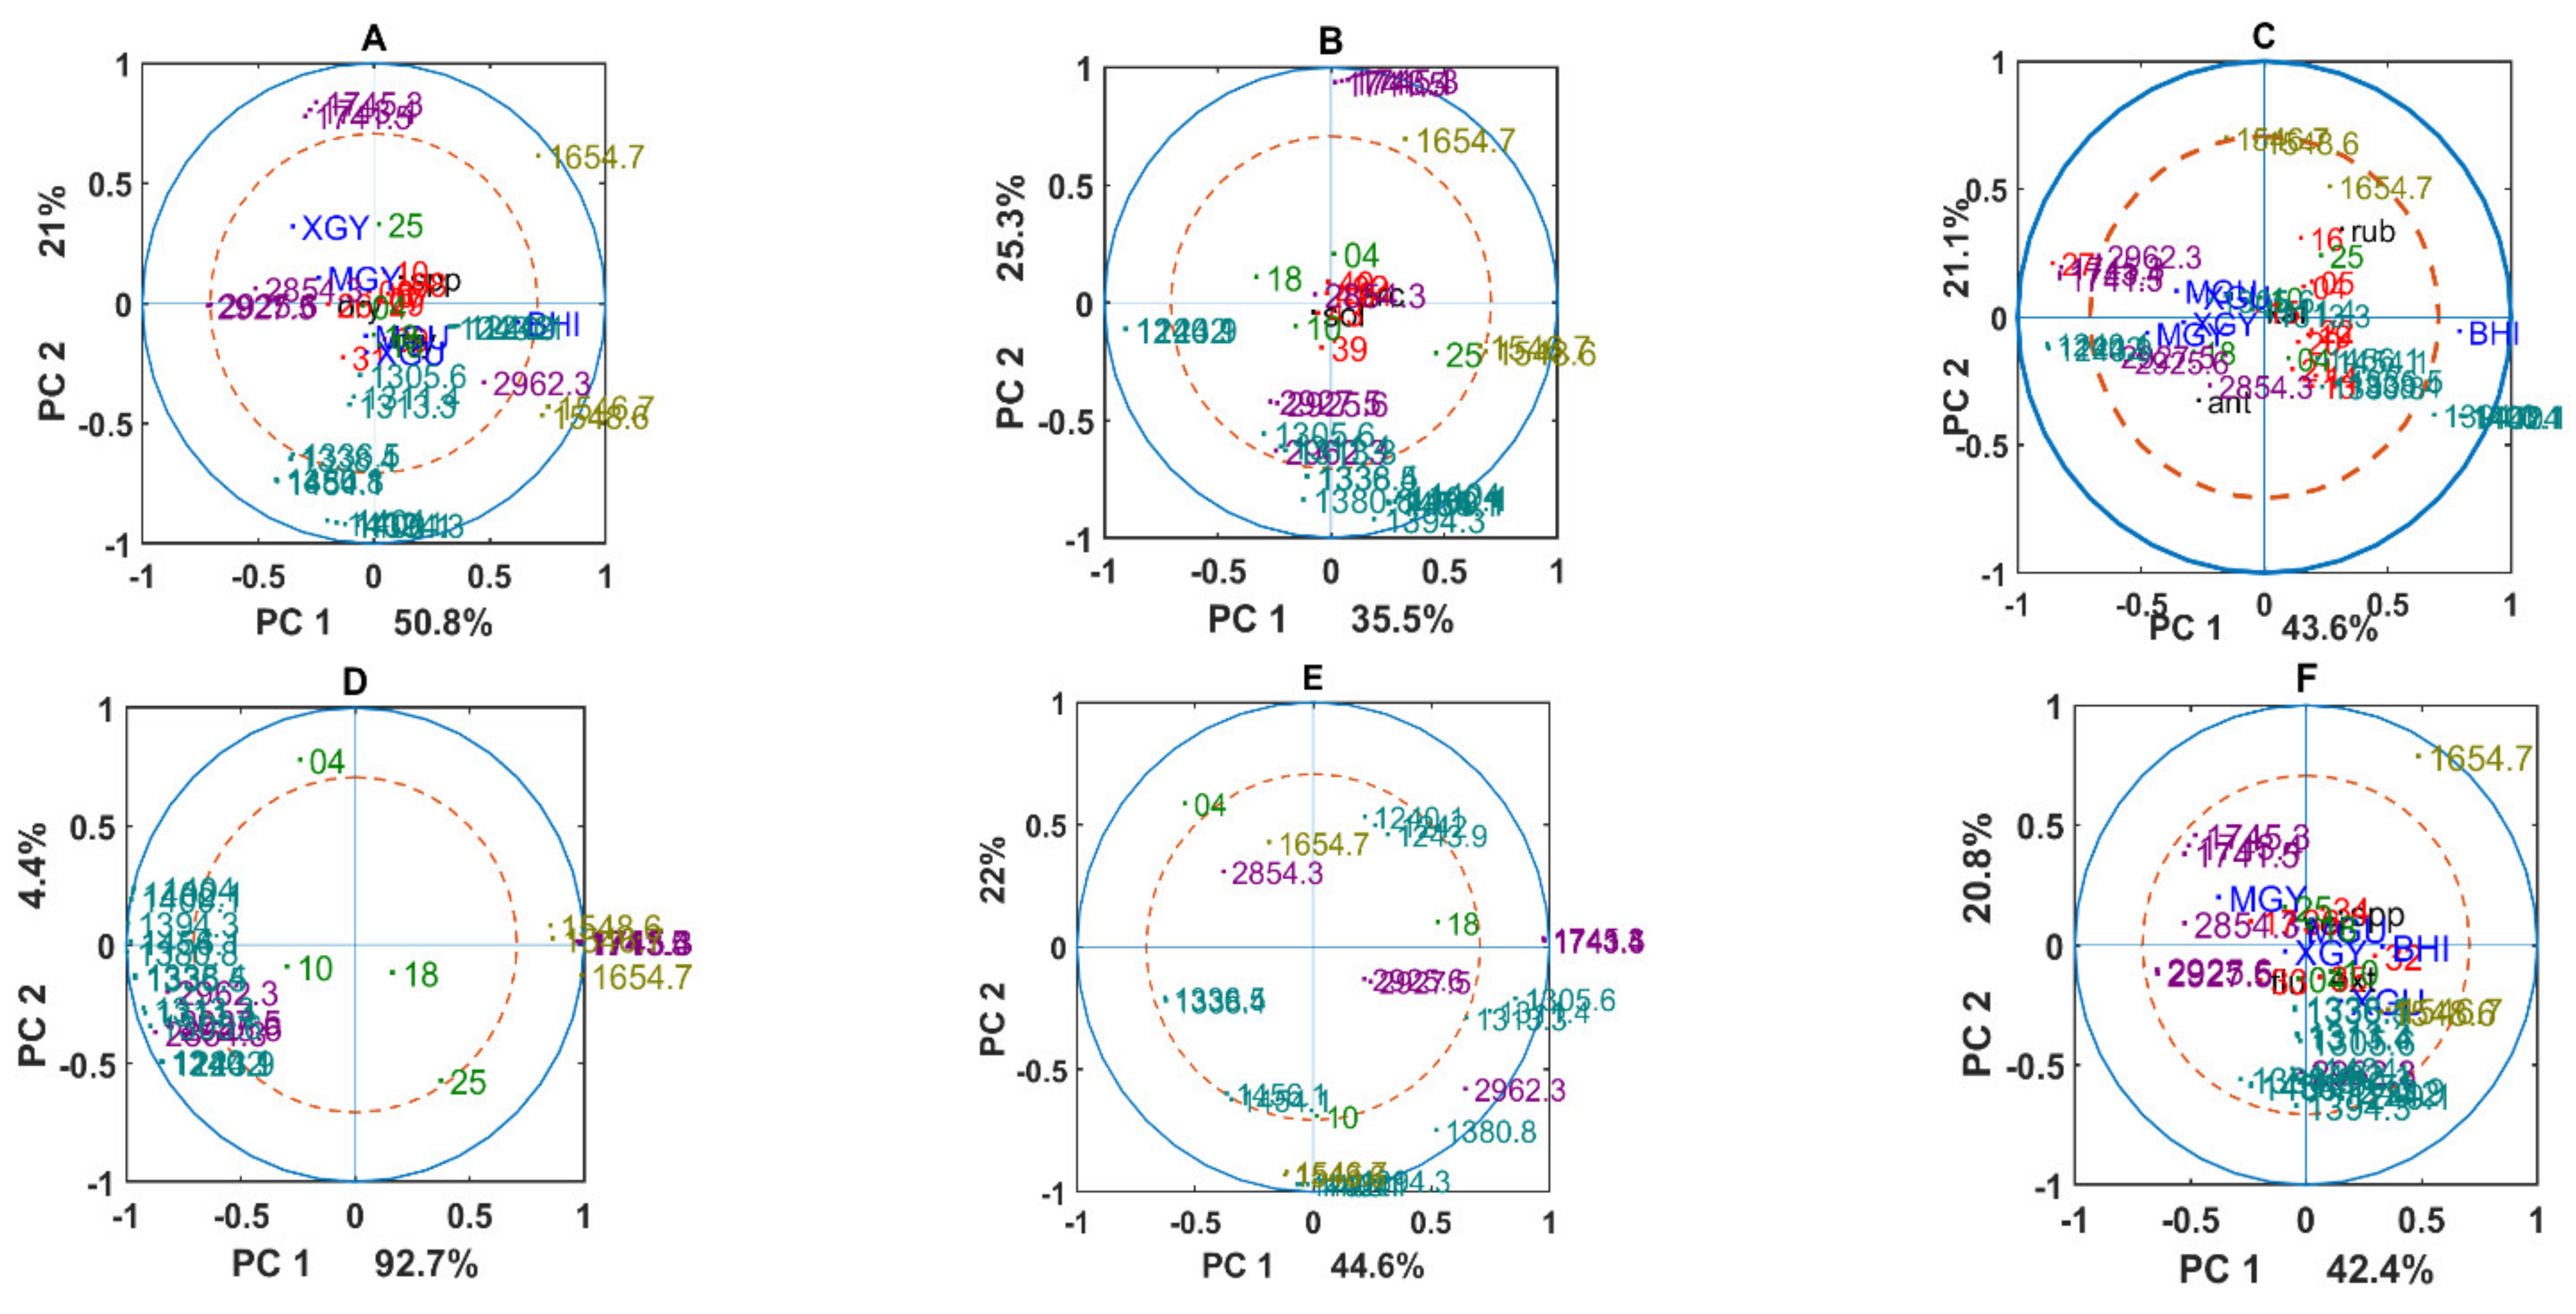
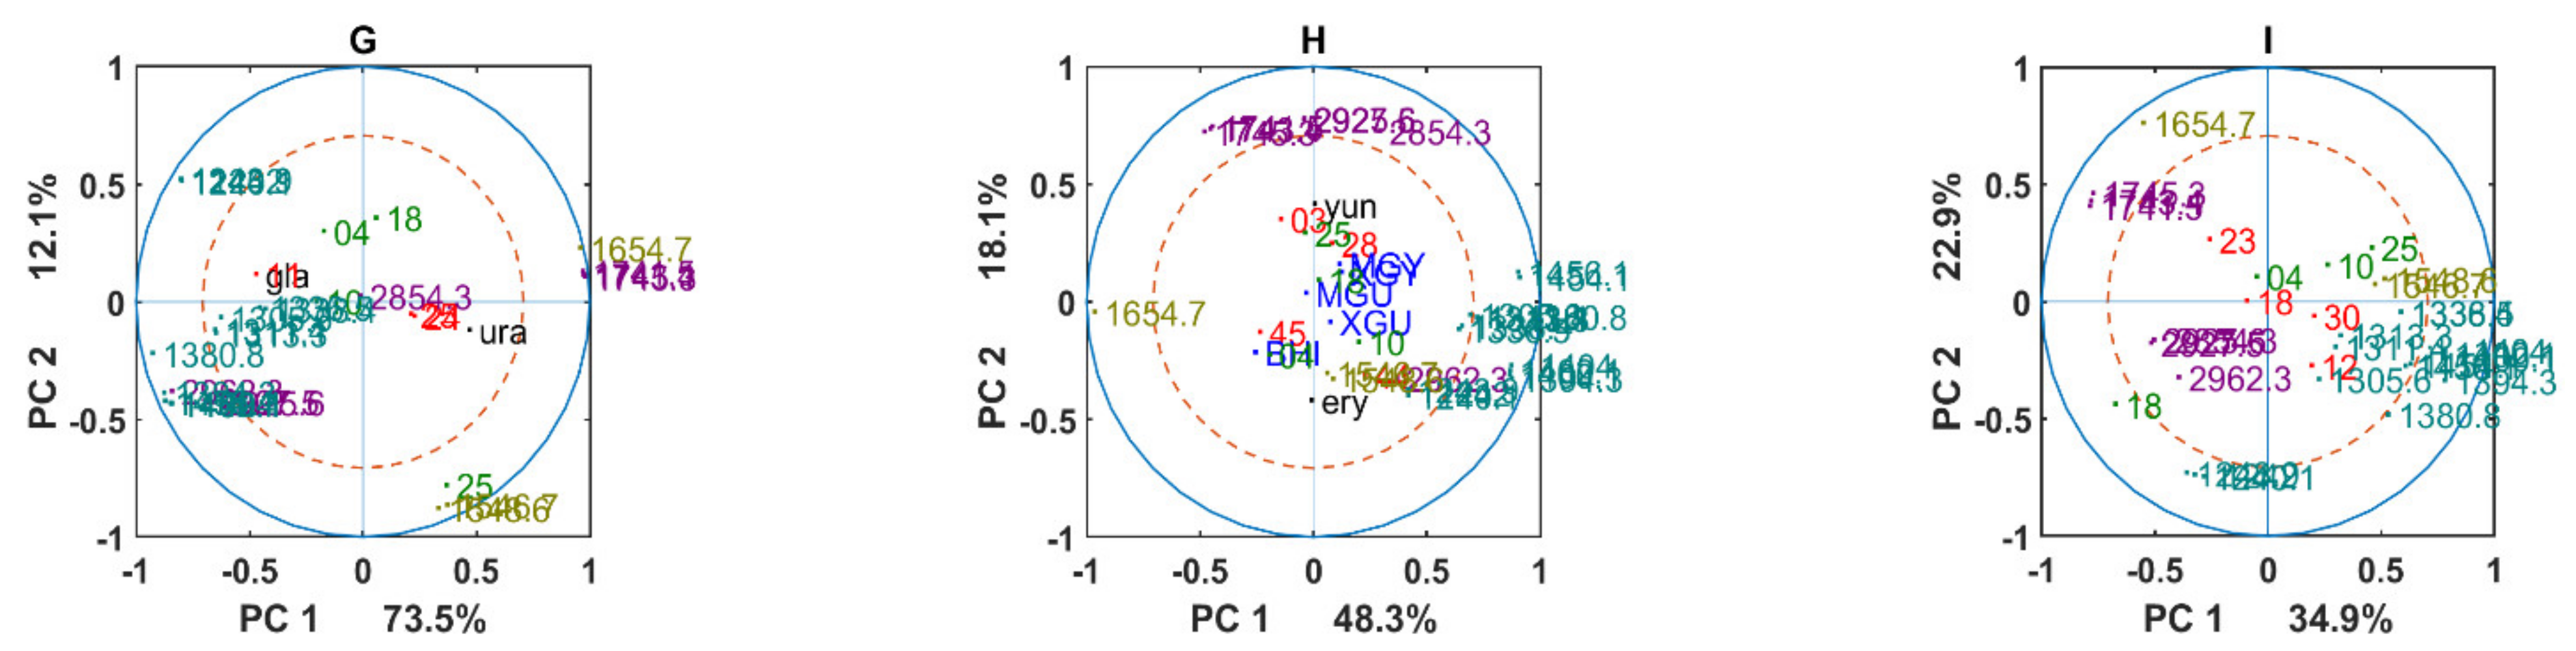
3.3. Genus Specific Responses to Fluctuations in Temperature and Nutrient Conditions

To understand cellular phenotypic responses represented by the change in the chemical profile introduced by different temperature and nutrient conditions, we performed correlation analysis using standard PCA. Correlation analysis was done separately for each genus, pulling all the spectra of different media together. Correlation loading plots allow representation of the correlations among all variables available for the analysis, including spectral variables (peaks), design variables (media, temperature, bacterial genera, and strains) and any other variables available for the samples. We are especially interested to see the influence of temperature fluctuations for each genus and each isolate. When analyzing correlation loading plots presented in Figure 9, we evaluated correlation between nutrients/temperature conditions and selected IR peaks, which is an indication of change in the amount and profile of the corresponding chemical components. It is important to mention that genera Cryobacterium, Paeniglutamicibacter, Polaromonas, Psychrobacter, and Salinibacterium were only grown on BHI medium. Therefore, a parameter representing medium is missing on the correlation loading plots for these genera. The effect of temperature was observed for the genera which were grown on BHI only. Isolates from the genera Arthrobacter, Pseudomonas, Rhodococcus, and Leifsonia, which were able to grow on all media, are much more strongly affected by the media differences. Therefore, all temperatures are close to the middle of the plot. It can be seen that the cellular chemical profile of bacterial isolates was affected by temperature and nutrients differently, and some bacteria, as for example chemical profile of Arthrobacter, Pseudomonas, Leifsonia, and Rhodococcus, did not show any correlation between the temperatures they were exposed to (Figure 9A,C,F,H). Interestingly, these isolates did also not show some changes in the chemical cellular profile when grown on different nutrients (Figure 9A,F,H). Some negative correlation between BHI and XGY media associated with lipid and protein related bands indicating differences in the total lipid content and lipid profile in the cells (1741 cm−1, 1743 cm−1, 1745 cm−1, 2925 cm−1, 2927 cm−1) and in the protein profile (1546 cm−1 and 1548 cm−1) was observed for Arthrobacter (Figure 9A). For Leifsonia in Figure 9C, some negative correlation between BHI and MGY media associated with lipid and polysaccharide related bands indicating difference in total lipid content and lipid profile in the cells (1741 cm−1, 1743 cm−1, 1745 cm−1, 2925 cm−1, 2927 cm−1, 2962 cm−1) and polysaccharide profile (1394 cm−1, 1249 cm−1) was observed.
The most significant changes of the cellular chemical phenotype were observed when bacteria were exposed to very high and very low temperatures such as 25 °C and 4 °C. Thus, being exposed to 25 °C contributes to the possible changes in the protein and polysaccharide content and profile, as a clear correlation between these temperatures and protein related bands 1546 cm−1 and 1548 cm−1 and negative correlation with polysaccharide related bands 1240–1243 cm−1 was observed for Cryobacterium, Paeniglutamicibacter, and Psychrobacter (Figure 9B,D,G). The low growth temperature 4 °C often shows correlation with the wavenumber related to –CH2 and –CH3 stretching in lipids (2854 cm−1, 2962 cm−1, 2927 cm−1, 1394–1405 cm−1) as it was observed for Cryobacterium, Polaromonas, Psychrobacter, and Salinibacterium (Figure 9B,E,G,I). Interestingly, temperatures 10 °C and 18 °C had the strongest effect on Polaromonas and Salinibacterium isolates, which showed changes in lipid, polysaccharides, and protein composition (Figure 9E,I).

4. Discussion

Temperature and nutrients’ availability fluctuations are some of the main factors affecting the microbiome of polar regions. For understanding the influence of these parameters on the growth ability and cellular chemical profile of the Antarctic fast-growing green snow bacteria, we have selected two groups of cultivation media including rich complex and synthetic minimal media and four temperatures ranging from 4 to 25 °C. As a complex and rich medium, we used BHI agar, which is based on the brain-heart infusion and containing all macro- and micronutrients, and as synthetic minimal media we used a set of media containing two types of carbon source (glucose or glycerol), inorganic nitrogen, phosphorus, and some salts. These media and range of temperatures were chosen to mimic the availability of two nutrients and temperature scenarios in Antarctica, where minimal media and lower temperatures of 4 °C and 10 °C represent the current low nutrients’ availability and temperature scenario, and where rich complex medium and higher temperatures of 18 °C and 25 °C represent the scenario of elevated nutrients availability and temperature in the case of active snow melting due to the global temperature increase. In addition, these conditions are relevant for exploring the biotechnological potential of these bacteria.
The obtained results show that most of the Antarctic green snow bacteria grow on the rich complex medium, while only a limited number of the isolates were able to grow on the synthetic minimal media. In addition, bacteria grown on the synthetic minimal media were characterized by smaller colonies and longer growth time. This could be an indication of a high level of nutrients’ requirements for the studied green snow bacteria, which in the case of minimal media were obviously lacking, for example some vitamins, trace elements, amino acids, etc. [67,69,72,73]. Further, we observed that most of the bacteria grown on the minimal media were able to utilize both glucose and glycerol, indicating that these bacteria could possess some metabolic flexibility of a carbon source utilization, as previously reported [72,74,75,76].
The studied green snow bacteria could be considered as psychrotolerant as the best growth ability with the isolated colonies of a good size was observed at 18 °C. They could be characterized by a wide range of temperature tolerances; however, growth at lower and higher temperatures were suboptimal. It is important to note that growth reduction at lower temperatures (4 °C and 10 °C) was less significant than at a higher temperature (25 °C). It is well known that the size of colonies are determined by the individual cell metabolic kinetics, enzymatic activity, and cell population responses to environmental conditions [77]. This could be one of the main reasons of the observed low bacterial activity in green snow at lower temperatures. In a scenario such as global warming, with the moderate temperature increase and higher snow melting rate, we may expect elevated nutrient availability in green snow areas, subsequently causing an increase in bacterial activity, while high temperatures such as 25 °C will negatively impact the green snow bacterial populations by inhibiting their metabolic kinetics, which may result in the disappearance of some species.
The temperature-induced growth response of the studied green snow bacteria was genus and species-specific. Thus, among the studied green snow bacteria, almost all Pseudomonas isolates showed equally good growth ability on all tested media and temperatures. The isolate Pseudomonas sp. BIM B-1635 was characterized by a lower growth ability at 4 °C and 10 °C when cultivated on BHI agar and absence of growth when cultivated on minimal media. Therefore, we assume that this isolate is distinctly different from other Pseudomonas isolates. Such growth behavior is common for Pseudomonas bacteria as they are usually characterized by a wide growth temperature tolerance and are able to grow on complex and synthetic media [78]. Thus, it has been previously reported that the optimum growth temperature for most of the Pseudomonas species is 28 °C, while they can tolerate temperatures as low as 4 °C and as high as 45 °C [79]. Unusual growth ability was observed for Arthrobacter bacteria, which showed good growth at 4–18 °C and reduced growth at 25 °C, while temperatures of 20–30 °C were often reported as optimum for these bacteria isolated from non-polar regions [80,81]. The same was observed for Psychrobacter and Salinibacterium bacteria, for which the often reported optimum temperature is above 20 °C [68,82,83]. Interesting results were observed for Leifsonia isolates, where Leifsonia antarctica BIM B-1671 did not grow on minimal media while other isolates did. According to the previously reported studies, most of the Leifsonia species usually grow well on media containing rich organic nitrogen sources—yeast extract or peptone—but some species require the presence of growth factors such as amino acids or vitamins [84]. Thus, we can hypothesize that isolate Leifsonia antarctica BIM B-1671 belongs to another species.
High-throughput FTIR spectroscopy combined with the multivariate data analysis was utilized to investigate temperature and nutrients-induced changes of the cellular biochemical profile of the green snow bacteria. FTIR spectroscopy is a next-generation phenotypic technique widely used for rapid, non-invasive biochemical phenotyping of microorganisms [32,85,86]. In our previous study we utilized FTIR for total cellular biochemical phenotyping of the green snow bacteria grown on BHI agar [9]. In this study, we applied FTIR for profiling cellular chemical responses towards temperature and nutrients fluctuations. Multi-block analysis of IR spectra was used for understanding phenotypic relationships between the isolates grown on different temperatures and nutrients and identifying the most significant chemical components involved. In the multi-block analysis we used spectra of bacteria grown on different media to compare and combine the information.
The analysis showed that the chemical profile differences related to phylogeny were observed among bacteria grown on BHI medium. For example: (1) Gram-negative bacteria represented by genera Psychrobacter, Pseudomonas, and Polaromonas were clearly separated from the Gram-positive genera; (2) Rhodococcus isolates clustered out of the main cloud because they phylogenetically belong to the order Mycrobacteriales, while other genera belong to the order Micrococcales; (3) overlapping of genera Leifsonia and Salinibacterium can be explained by the previously reported phylogenetic similarity between these two genera, especially between Salinibacterium species and species Leifsonia rubra and Leifsonia aurea [69], and (4) the overlapping of Paeniglutamicibacter and Arthrobacter isolates could be due to the re-classification of Arthrobacter antarcticus to Paeniglutamicibacter antarcticus [87]. The clearest clustering according to the phylogeny was observed using lipid and mixed regions, where the fatty acid chain length, total content, and profile of lipids are the most significant parameters according to the loading plots. The differences observed in lipid IR region is in accordance with the previously reported findings, where it has been shown that membrane fatty acids could be considered as a phenotypic biomarkers of the bacterial polyphasic taxonomy, which integrates phylogenetic relationships with phenotypic marker analysis [88]. Interestingly, the FTIR protein profile showed much smaller contributions to the phylogenetic distribution of the studied bacteria. This could be due to protein profile probed by FTIR being much less specific to be used as a taxonomic biomarker. The protein profile used for polyphasic taxonomy is usually measured by gel electrophoresis techniques [89]. Multi-block score plots showed that isolate Pseudomonas fluorescence BIM B-1668 clustered out from all other Pseudomonas isolates and overlapped with isolate Leifsonia antarctica BIM B-1671 could be explained by potentially sequencing-related misidentification. Taxonomic differences in polysaccharides are more known for fungi, and in the case of bacteria, differences in the polysaccharides were reported mainly associated with the cell-wall structure [66]. In this study, we show that the phylogenetic clustering of the green snow bacteria is little associated with changes in polysaccharides.
Under different nutrients and temperature conditions, the most considerable changes in the cellular chemical profile were associated with different media and, when only one medium was used, then low and high temperatures had a strong effect, which was often associated with lipid-related FTIR bands and lesser associated with protein and polysaccharide bands. The correlation analysis indicated that the whole chemical composition is changing under different nutrients and temperature growth conditions. Correlation analysis showed that nutrients are clearly a stronger parameter influencing chemical changes in the cells, followed by temperature. It is known that temperature may considerably affect the amount and profile of the intracellular metabolites in microorganisms [90,91,92]. Psychrophilic bacteria have a series of adaptation mechanisms for surviving in cold environments, and one of them is related to the alteration in the membrane fatty acids’ content and composition [93] and the expression of heat/cold shock proteins [94,95]. For example, it was reported that Gram-negative bacteria grown at low temperatures (5 °C and 15 °C) have a high quantity of n-MUFAs, which decreases when grown at high temperatures (25 °C and 35 °C), while for Gram-positive bacteria a high level of br-SFAs in the cell membrane was recorded at high temperatures (25 °C and 35 °C), which decreased at lower temperatures [19]. In addition, it is worth mentioning that changes in lipids were generally observed for all green snow isolates, where the main correlation was with bands of ester bond stretching bands 1741 cm−1, 1743 cm−1, and 1745 cm−1, indicating a possible change in the total lipid content and, possibly, a type of produced lipids. In addition, it was correlated/negatively correlated with CH2 and CH3 stretching bands, indicating a change in the lipids’ length and branching. Thus, it could be concluded that lipids might be one of the main cellular building blocks involved in the nutrients/temperature adaptations. Further, the response to temperature fluctuations was more pronounced when bacteria were grown on the synthetic minimal media than on complex BHI agar. This is in accordance with the previously published reports, which showed that cultivation in rich complex media alters mainly the total lipid content and the length of the fatty acids chain, but there are no changes in a proportion of branched-chain fatty acids and fatty acid profile in general. In minimal synthetic media, though, there are changes in the pattern of fatty acids branching regarding the amount of branched-chain fatty acids compared to straited-chain saturated and unsaturated fatty acids [96]. However, in general, temperature fluctuations affected cellular chemical composition to a lower extent than nutrients.
Our study shows that under the temperature rising conditions, green snow bacteria will contribute to the microbial flora of Antarctic regions as they are able to grow at higher temperatures and can utilize different carbon sources. Due to the fact that the overall cellular chemical profile was changing to a different extent under various temperatures, further study would be needed to understand in detail how these green snow bacteria alter their chemical composition. Changes in lipid profile and content are especially interesting.

5. Conclusions

In conclusion, we identified that Antarctic green snow bacteria are psychrotolerant and able to grow at lower and higher temperatures. All bacteria were able to grow on complex rich medium, and only few of them grew on minimal synthetic media. Alteration in nutrients induced bigger changes in the cellular chemical profile than temperature. The most significant taxonomic differences were observed in lipids, while smaller differences were observed in proteins and polysaccharides. It could be concluded that lipids might be one of the main cellular building blocks involved in the nutrients/temperature adaptations.

Supplementary Materials

The following supporting information can be downloaded at: https://www.mdpi.com/article/10.3390/biology11060890/s1, Table S1: Cultivation time of green snow bacteria at different temperature and nutrient conditions (grey color indicates the absence or very little growth with a growth ability score lower than 4).

Author Contributions

Data curation, M.S., V.T. and V.S.; Formal analysis, M.S., V.T., A.K. and V.S.; Investigation, M.S.; Visualization, M.S.; Writing—original draft, M.S., V.T., A.K. and V.S.; Software, V.T.; Funding acquisition, A.K. and V.S.; Project administration, A.K. and V.S.; Supervision, U.M.; Conceptualization, V.S.; Methodology, V.S. All authors have read and agreed to the published version of the manuscript.

Funding

This research was funded by the Norwegian Agency for International Cooperation and Quality Enhancement in High Education, grant numbers CPEA-LT-2016/10126, CPEA-STA-2019/10025.

Institutional Review Board Statement

Not applicable.

Informed Consent Statement

Not applicable.

Data Availability Statement

Data provided in this paper are available in the Zenodo repository at https://doi.org/10.5281/zenodo.6444884 (accessed on 9 March 2022).

Acknowledgments

The research was headed by Project “Belanoda—Multidisciplinary graduate and post-graduate education in big data analysis for life sciences” (CPEA-LT-2016/10126) and “Belanoda—Digital learning platform for boosting multidisciplinary education in data analysis for life sciences in Eurasia region” (CPEA-STA-2019/10025), funded by the Eurasia program, Norwegian Agency for International Cooperation and Quality Enhancement in Higher Education (DIKU).

Conflicts of Interest

The authors declare no conflict of interest.

References

  1. Llano, G.A. The flora of Antarctica. Antarctica 1965, 13, 331–350. [Google Scholar]
  2. Allen, M.; Babiker, M.; Chen, Y.; de Coninck, H.; Conors, S. Global warming of 1.5 C. IPCC Spec. Rep. 2018, 26, 1–36. [Google Scholar]
  3. Hoegh-Guldberg, O.; Jacob, D.; Taylor, M.; Bolaños, T.G.; Bindi, M.; Brown, S.; Camilloni, I.A.; Diedhiou, A.; Djalante, R.; Ebi, K. The human imperative of stabilizing global climate change at 1.5 C. Science 2019, 365, eaaw697. [Google Scholar] [CrossRef] [PubMed]
  4. Davey, M.P.; Norman, L.; Sterk, P.; Huete-Ortega, M.; Bunbury, F.; Loh, B.K.W.; Stockton, S.; Peck, L.S.; Convey, P.; Newsham, K.K. Snow algae communities in Antarctica: Metabolic and taxonomic composition. New Phytol. 2019, 222, 1242–1255. [Google Scholar] [CrossRef]
  5. Hodson, A.; Nowak, A.; Cook, J.; Sabacka, M.; Wharfe, E.; Pearce, D.; Convey, P.; Vieira, G. Microbes influence the biogeochemical and optical properties of maritime Antarctic snow. J. Geophys. Res. Biogeosci. 2017, 122, 1456–1470. [Google Scholar] [CrossRef]
  6. Dierssen, H.M.; Smith, R.C.; Vernet, M. Glacial meltwater dynamics in coastal waters west of the Antarctic peninsula. Proc. Natl. Acad. Sci. USA 2002, 99, 1790–1795. [Google Scholar] [CrossRef]
  7. Hodson, A.; Anesio, A.M.; Tranter, M.; Fountain, A.; Osborn, M.; Priscu, J.; Laybourn-Parry, J.; Sattler, B. Glacial ecosystems. Ecol. Monogr. 2008, 78, 41–67. [Google Scholar] [CrossRef]
  8. Boetius, A.; Anesio, A.M.; Deming, J.W.; Mikucki, J.A.; Rapp, J.Z. Microbial ecology of the cryosphere: Sea ice and glacial habitats. Nat. Rev. Microbiol. 2015, 13, 677–690. [Google Scholar] [CrossRef]
  9. Smirnova, M.; Miamin, U.; Kohler, A.; Valentovich, L.; Akhremchuk, A.; Sidarenka, A.; Dolgikh, A.; Shapaval, V. Isolation and characterization of fast-growing green snow bacteria from coastal East Antarctica. MicrobiologyOpen 2020, 10, e1152. [Google Scholar] [CrossRef]
  10. Russell, N.J. Molecular adaptations in psychrophilic bacteria: Potential for biotechnological applications. Biotechnol. Extrem. 1998, 61, 1–21. [Google Scholar]
  11. Pucciarelli, S.; Devaraj, R.R.; Mancini, A.; Ballarini, P.; Castelli, M.; Schrallhammer, M.; Petroni, G.; Miceli, C. Microbial consortium associated with the Antarctic marine ciliate Euplotes focardii: An investigation from genomic sequences. Microb. Ecol. 2015, 70, 484–497. [Google Scholar] [CrossRef] [PubMed]
  12. Saxena, A.; Yadav, A.N.; Rajawat, M.; Kaushik, R.; Kumar, R.; Kumar, M.; Prasanna, R.; Shukla, L. Microbial diversity of extreme regions: An unseen heritage and wealth. Indian J. Plant Genet. Resour. 2016, 29, 246–248. [Google Scholar] [CrossRef]
  13. Yadav, A.N.; Sachan, S.G.; Verma, P.; Kaushik, R.; Saxena, A.K. Cold active hydrolytic enzymes production by psychrotrophic Bacilli isolated from three sub-glacial lakes of NW Indian Himalayas. J. Basic Microbiol. 2016, 56, 294–307. [Google Scholar] [CrossRef] [PubMed]
  14. Brakstad, O.G.; Lofthus, S.; Ribicic, D.; Netzer, R. Biodegradation of petroleum oil in cold marine environments. In Psychrophiles: From Biodiversity to Biotechnology; Springer: Berlin/Heidelberg, Germany, 2017; pp. 613–644. [Google Scholar]
  15. Si-Zhong, Y.; Hui-Jun, J.; Zhi, W.; Rui-Xia, H.; Yan-Jun, J.; Xiu-Mei, L.; Shao-Peng, Y. Bioremediation of oil spills in cold environments: A review. Pedosphere 2009, 19, 371–381. [Google Scholar]
  16. Gerday, C.; Aittaleb, M.; Bentahir, M.; Chessa, J.-P.; Claverie, P.; Collins, T.; D’Amico, S.; Dumont, J.; Garsoux, G.; Georlette, D. Cold-adapted enzymes: From fundamentals to biotechnology. Trends Biotechnol. 2000, 18, 103–107. [Google Scholar] [CrossRef]
  17. Huston, A.L.; Krieger-Brockett, B.B.; Deming, J.W. Remarkably low temperature optima for extracellular enzyme activity from Arctic bacteria and sea ice. Environ. Microbiol. 2000, 2, 383–388. [Google Scholar] [CrossRef]
  18. Groudieva, T.; Kambourova, M.; Yusef, H.; Royter, M.; Grote, R.; Trinks, H.; Antranikian, G. Diversity and cold-active hydrolytic enzymes of culturable bacteria associated with Arctic sea ice, Spitzbergen. Extremophiles 2004, 8, 475–488. [Google Scholar] [CrossRef]
  19. Hassan, N.; Anesio, A.M.; Rafiq, M.; Holtvoeth, J.; Bull, I.; Haleem, A.; Shah, A.A.; Hasan, F. Temperature driven membrane lipid adaptation in glacial psychrophilic bacteria. Front. Microbiol. 2020, 11, 824. [Google Scholar] [CrossRef]
  20. Yumoto, I.; Hirota, K.; Iwata, H.; Akutsu, M.; Kusumoto, K.; Morita, N.; Ezura, Y.; Okuyama, H.; Matsuyama, H. Temperature and nutrient availability control growth rate and fatty acid composition of facultatively psychrophilic Cobetia marina strain L-2. Arch. Microbiol. 2004, 181, 345–351. [Google Scholar] [CrossRef]
  21. Fong, N.; Burgess, M.; Barrow, K.; Glenn, D. Carotenoid accumulation in the psychrotrophic bacterium Arthrobacter agilis in response to thermal and salt stress. Appl. Microbiol. Biotechnol. 2001, 56, 750–756. [Google Scholar] [CrossRef]
  22. Han, S.J.; Park, H.; Kim, S.; Kim, D.; Park, H.J.; Yim, J.H. Enhanced production of protease by Pseudoalteromonas arctica PAMC 21717 via statistical optimization of mineral components and fed-batch fermentation. Prep. Biochem. Biotechnol. 2016, 46, 328–335. [Google Scholar] [CrossRef] [PubMed]
  23. Movasaghi, Z.; Rehman, S.; ur Rehman, D.I. Fourier transform infrared (FTIR) spectroscopy of biological tissues. Appl. Spectrosc. Rev. 2008, 43, 134–179. [Google Scholar] [CrossRef]
  24. Paraskevaidi, M.; Martin-Hirsch, P.L.; Martin, F.L. ATR-FTIR spectroscopy tools for medical diagnosis and disease investigation. In Nanotechnology Characterization Tools for Biosensing and Medical Diagnosis; Springer: Berlin/Heidelberg, Germany, 2018; pp. 163–211. [Google Scholar]
  25. Ollesch, J.; Drees, S.L.; Heise, H.M.; Behrens, T.; Brüning, T.; Gerwert, K. FTIR spectroscopy of biofluids revisited: An automated approach to spectral biomarker identification. Analyst 2013, 138, 4092–4102. [Google Scholar] [CrossRef] [PubMed]
  26. Taha, M.; Hassan, M.; Essa, S.; Tartor, Y. Use of Fourier transform infrared spectroscopy (FTIR) spectroscopy for rapid and accurate identification of Yeasts isolated from human and animals. Int. J. Vet. Sci. Med. 2013, 1, 15–20. [Google Scholar] [CrossRef]
  27. Figoli, C.B.; Garcea, M.; Bisioli, C.; Tafintseva, V.; Shapaval, V.; Peña, M.G.; Gibbons, L.; Althabe, F.; Yantorno, O.M.; Horton, M. A robust metabolomics approach for the evaluation of human embryos from in vitro fertilization. Analyst 2021, 146, 6156–6169. [Google Scholar] [CrossRef] [PubMed]
  28. Virtanen, V.; Nippolainen, E.; Shaikh, R.; Afara, I.O.; Töyräs, J.; Solheim, J.; Tafintseva, V.; Zimmermann, B.; Kohler, A.; Saarakkala, S. Infrared Fiber-Optic Spectroscopy Detects Bovine Articular Cartilage Degeneration. Cartilage 2021, 13, 285S–294S. [Google Scholar] [CrossRef] [PubMed]
  29. Valderrama, A.C.S.; De, G.C.R. Traceability of active compounds of essential oils in antimicrobial food packaging using a chemometric method by ATR-FTIR. Am. J. Anal. Chem. 2017, 8, 726. [Google Scholar] [CrossRef]
  30. Wang, Y.-D.; Li, X.-L.; Liu, Z.-X.; Zhang, X.-X.; Hu, J.; Lü, J.-H. Discrimination of foodborne pathogenic bacteria using synchrotron FTIR microspectroscopy. Nucl. Sci. Tech. 2017, 28, 49. [Google Scholar] [CrossRef]
  31. Zeng, W.; Guo, L.; Xu, S.; Chen, J.; Zhou, J. High-throughput screening technology in industrial biotechnology. Trends Biotechnol. 2020, 38, 888–906. [Google Scholar] [CrossRef]
  32. Brown, C.; Martin, A.P.; Grof, C.P. The application of Fourier transform mid-infrared (FTIR) spectroscopy to identify variation in cell wall composition of Setaria italica ecotypes. J. Integr. Agric. 2017, 16, 1256–1267. [Google Scholar] [CrossRef]
  33. Kosa, G.; Shapaval, V.; Kohler, A.; Zimmermann, B. FTIR spectroscopy as a unified method for simultaneous analysis of intra-and extracellular metabolites in high-throughput screening of microbial bioprocesses. Microb. Cell Factories 2017, 16, 195. [Google Scholar] [CrossRef] [PubMed]
  34. Magazù, S.; Calabrò, E.; Caccamo, M. Experimental study of thermal restraint in bio-protectant disaccharides by FTIR spectroscopy. Open Biotechnol. J. 2018, 12, 123–133. [Google Scholar] [CrossRef]
  35. Lin, M.; Al-Holy, M.; Chang, S.-S.; Huang, Y.; Cavinato, A.G.; Kang, D.-H.; Rasco, B.A. Rapid discrimination of Alicyclobacillus strains in apple juice by Fourier transform infrared spectroscopy. Int. J. Food Microbiol. 2005, 105, 369–376. [Google Scholar] [CrossRef] [PubMed]
  36. Al-Qadiri, H.M.; Lin, M.; Cavinato, A.G.; Rasco, B.A. Fourier transform infrared spectroscopy, detection and identification of Escherichia coli O157: H7 and Alicyclobacillus strains in apple juice. Int. J. Food Microbiol. 2006, 111, 73–80. [Google Scholar] [CrossRef]
  37. Harz, M.; Rösch, P.; Popp, J. Vibrational spectroscopy—A powerful tool for the rapid identification of microbial cells at the single-cell level. Cytom. Part A J. Int. Soc. Anal. Cytol. 2009, 75, 104–113. [Google Scholar] [CrossRef]
  38. Shapaval, V.; Møretrø, T.; Suso, H.P.; Åsli, A.W.; Schmitt, J.; Lillehaug, D.; Martens, H.; Böcker, U.; Kohler, A. A high-throughput microcultivation protocol for FTIR spectroscopic characterization and identification of fungi. J. Biophotonics 2010, 3, 512–521. [Google Scholar] [CrossRef]
  39. Amamcharla, J.K.; Panigrahi, S.; Logue, C.M.; Marchello, M.; Sherwood, J.S. Fourier transform infrared spectroscopy (FTIR) as a tool for discriminating Salmonella typhimurium contaminated beef. Sens. Instrum. Food Qual. Saf. 2010, 4, 1–12. [Google Scholar] [CrossRef]
  40. Kiefer, J.; Ebel, N.; Schlücker, E.; Leipertz, A. Characterization of Escherichia coli suspensions using UV/Vis/NIR absorption spectroscopy. Anal. Methods 2010, 2, 123–128. [Google Scholar] [CrossRef]
  41. Shapaval, V.; Walczak, B.; Gognies, S.; Møretrø, T.; Suso, H.; Åsli, A.W.; Belarbi, A.; Kohler, A. FTIR spectroscopic characterization of differently cultivated food related yeasts. Analyst 2013, 138, 4129–4138. [Google Scholar] [CrossRef]
  42. Shapaval, V.; Schmitt, J.; Møretrø, T.; Suso, H.; Skaar, I.; Åsli, A.; Lillehaug, D.; Kohler, A. Characterization of food spoilage fungi by FTIR spectroscopy. J. Appl. Microbiol. 2013, 114, 788–796. [Google Scholar] [CrossRef]
  43. Shapaval, V.; Afseth, N.K.; Vogt, G.; Kohler, A. Fourier transform infrared spectroscopy for the prediction of fatty acid profiles in Mucor fungi grown in media with different carbon sources. Microb. Cell Factories 2014, 13, 86. [Google Scholar] [CrossRef] [PubMed]
  44. Kohler, A.; Böcker, U.; Shapaval, V.; Forsmark, A.; Andersson, M.; Warringer, J.; Martens, H.; Omholt, S.W.; Blomberg, A. High-throughput biochemical fingerprinting of Saccharomyces cerevisiae by Fourier transform infrared spectroscopy. PLoS ONE 2015, 10, e0118052. [Google Scholar] [CrossRef] [PubMed]
  45. Shapaval, V.; Møretrø, T.; Wold Åsli, A.; Suso, H.-P.; Schmitt, J.; Lillehaug, D.; Kohler, A. A novel library-independent approach based on high-throughput cultivation in Bioscreen and fingerprinting by FTIR spectroscopy for microbial source tracking in food industry. Lett. Appl. Microbiol. 2017, 64, 335–342. [Google Scholar] [CrossRef] [PubMed]
  46. Colabella, C.; Corte, L.; Roscini, L.; Shapaval, V.; Kohler, A.; Tafintseva, V.; Tascini, C.; Cardinali, G. Merging FT-IR and NGS for simultaneous phenotypic and genotypic identification of pathogenic Candida species. PLoS ONE 2017, 12, e0188104. [Google Scholar] [CrossRef] [PubMed]
  47. Kosa, G.; Zimmermann, B.; Kohler, A.; Ekeberg, D.; Afseth, N.K.; Mounier, J.; Shapaval, V. High-throughput screening of Mucoromycota fungi for production of low-and high-value lipids. Biotechnol. Biofuels 2018, 11, 1–17. [Google Scholar] [CrossRef] [PubMed]
  48. Shapaval, V.; Brandenburg, J.; Blomqvist, J.; Tafintseva, V.; Passoth, V.; Sandgren, M.; Kohler, A. Biochemical profiling, prediction of total lipid content and fatty acid profile in oleaginous yeasts by FTIR spectroscopy. Biotechnol. Biofuels 2019, 12, 1–12. [Google Scholar] [CrossRef]
  49. Dzurendova, S.; Zimmermann, B.; Kohler, A.; Tafintseva, V.; Slany, O.; Certik, M.; Shapaval, V. Microcultivation and FTIR spectroscopy-based screening revealed a nutrient-induced co-production of high-value metabolites in oleaginous Mucoromycota fungi. PLoS ONE 2020, 15, e0234870. [Google Scholar] [CrossRef]
  50. Liland, K.H.; Kohler, A.; Shapaval, V. Hot PLS—A framework for hierarchically ordered taxonomic classification by partial least squares. Chemom. Intell. Lab. Syst. 2014, 138, 41–47. [Google Scholar] [CrossRef]
  51. Li, J.; Shapaval, V.; Kohler, A.; Talintyre, R.; Schmitt, J.; Stone, R.; Gallant, A.J.; Zeze, D.A. A modular liquid sample handling robot for high-throughput Fourier transform infrared spectroscopy. In Advances in Reconfigurable Mechanisms and Robots II; Springer: Berlin/Heidelberg, Germany, 2016; pp. 769–778. [Google Scholar]
  52. Xiong, Y.; Shapaval, V.; Kohler, A.; Li, J.; From, P.J. A fully automated robot for the preparation of fungal samples for FTIR spectroscopy using deep learning. IEEE Access 2019, 7, 132763–132774. [Google Scholar] [CrossRef]
  53. Xiong, Y.; Shapaval, V.; Kohler, A.; From, P.J. A laboratory-built fully automated ultrasonication robot for filamentous fungi homogenization. SLAS Technol. Transl. Life Sci. Innov. 2019, 24, 583–595. [Google Scholar] [CrossRef]
  54. Bioquest, A. M9 Minimal Salts Preparation. Available online: https://www.aatbio.com/resources/buffer-preparations-and-recipes/m9-salts (accessed on 9 March 2022).
  55. Tafintseva, V.; Shapaval, V.; Smirnova, M.; Kohler, A. Extended multiplicative signal correction for FTIR spectral quality test and pre-processing of infrared imaging data. J. Biophotonics 2020, 13, e201960112. [Google Scholar] [CrossRef] [PubMed]
  56. Tafintseva, V.; Shapaval, V.; Blazhko, U.; Kohler, A. Correcting replicate variation in spectroscopic data by machine learning and model-based pre-processing. Chemom. Intell. Lab. Syst. 2021, 215, 104350. [Google Scholar] [CrossRef]
  57. Tafintseva, V.; Vigneau, E.; Shapaval, V.; Cariou, V.; Qannari, E.M.; Kohler, A. Hierarchical classification of microorganisms based on high-dimensional phenotypic data. J. Biophotonics 2018, 11, e201700047. [Google Scholar] [CrossRef] [PubMed]
  58. Wold, S.; Hellberg, S.; Lundstedt, T.; Sjostrom, M.; Wold, H. Theory and application. In Proceedings of the Symposium on PLS Model Building, Frankfurt am Main, Germany, 23–25 September 1987. [Google Scholar]
  59. Hanafi, M.; Kohler, A.; Qannari, E.M. Shedding new light on hierarchical principal component analysis. J. Chemom. 2010, 24, 703–709. [Google Scholar] [CrossRef]
  60. Diehn, S.; Zimmermann, B.; Tafintseva, V.; Seifert, S.; Bağcıoğlu, M.; Ohlson, M.; Weidner, S.; Fjellheim, S.; Kohler, A.; Kneipp, J. Combining chemical information from grass pollen in multimodal characterization. Front. Plant Sci. 2020, 10, 1788. [Google Scholar] [CrossRef]
  61. Blazhko, U.; Shapaval, V.; Kovalev, V.; Kohler, A. Comparison of augmentation and pre-processing for deep learning and chemometric classification of infrared spectra. Chemom. Intell. Lab. Syst. 2021, 215, 104367. [Google Scholar] [CrossRef]
  62. Savitzky, A.; Golay, M.J. Smoothing and differentiation of data by simplified least squares procedures. Anal. Chem. 1964, 36, 1627–1639. [Google Scholar] [CrossRef]
  63. Zimmermann, B.; Kohler, A. Optimizing Savitzky-Golay parameters for improving spectral resolution and quantification in infrared spectroscopy. Appl. Spectrosc. 2013, 67, 892–902. [Google Scholar] [CrossRef]
  64. Martens, H.; Stark, E. Extended multiplicative signal correction and spectral interference subtraction: New preprocessing methods for near infrared spectroscopy. J. Pharm. Biomed. Anal. 1991, 9, 625–635. [Google Scholar] [CrossRef]
  65. Kohler, A.; Solheim, J.H.; Tafintseva, V.; Zimmermann, B.; Shapaval, V. Model-based pre-processing in vibrational spectroscopy. In Comprehensive Chemometrics: Chemical and Biochemical Data Analysis, 2nd ed.; Brown, S., Tauler, R., Walczak, B., Eds.; Elsevier: New York, NY, USA, 2020; pp. 83–100. [Google Scholar]
  66. Naumann, D. Infrared spectroscopy in microbiology. Encycl. Anal. Chem. 2000, 102, 131. [Google Scholar]
  67. Busse, H.J.; Wieser, M. Paeniglutamicibacter. In Bergey’s Manual of Systematic Bacteriology; Wiley: Hoboken, NJ, USA, 2015; pp. 1–9. [Google Scholar]
  68. Han, S.K.; Nedashkovskaya, O.I.; Mikhailov, V.V.; Kim, S.B.; Bae, K.S. Salinibacterium amurskyense gen. nov., sp. nov., a novel genus of the family Microbacteriaceae from the marine environment. Int. J. Syst. Evol. Microbiol. 2003, 53, 2061–2066. [Google Scholar] [CrossRef] [PubMed]
  69. Kim, S.B.; Nedashkovskaya, O.I. Salinibacterium. In Bergey’s Manual of Systematics of Archaea and Bacteria; Trujillo, M.E., Dedysh, S., DeVos, P., Hedlund, B., Kämpfer, P., Rainey, F.A., Whitman, W.B., Eds.; Wiley: Hoboken, NJ, USA, 2015. [Google Scholar] [CrossRef]
  70. Westerhuis, J.A.; Kourti, T.; MacGregor, J.F. Analysis of multiblock and hierarchical PCA and PLS models. J. Chemom. J. Chemom. Soc. 1998, 12, 301–321. [Google Scholar] [CrossRef]
  71. Faghihzadeh, F.; Anaya, N.M.; Schifman, L.A.; Oyanedel-Craver, V. Fourier transform infrared spectroscopy to assess molecular-level changes in microorganisms exposed to nanoparticles. Nanotechnol. Environ. Eng. 2016, 1, 1. [Google Scholar] [CrossRef]
  72. Bajerski, F.; Ganzert, L.; Mangelsdorf, K.; Lipski, A.; Wagner, D. Cryobacterium arcticum sp. nov., a psychrotolerant bacterium from an Arctic soil. Int. J. Syst. Evol. Microbiol. 2011, 61, 1849–1853. [Google Scholar] [CrossRef] [PubMed]
  73. Bowman, J.P.; Cavanagh, J.; Austin, J.J.; Sanderson, K. Novel Psychrobacter species from Antarctic ornithogenic soils. Int. J. Syst. Evol. Microbiol. 1996, 46, 841–848. [Google Scholar] [CrossRef]
  74. Amaresan, N.; Kumar, M.S.; Annapurna, K.; Kumar, K.; Sankaranarayanan, A. Beneficial Microbes in Agro-Ecology: Bacteria and Fungi; Academic Press: Cambridge, MA, USA, 2020. [Google Scholar]
  75. López, N.I.; Pettinari, M.J.; Stackebrandt, E.; Tribelli, P.M.; Põtter, M.; Steinbüchel, A.; Méndez, B.S. Pseudomonas extremaustralis sp. nov., a poly (3-hydroxybutyrate) producer isolated from an Antarctic environment. Curr. Microbiol. 2009, 59, 514–519. [Google Scholar] [CrossRef]
  76. Zhang, Y.-Q.; Li, W.-J.; Kroppenstedt, R.M.; Kim, C.-J.; Chen, G.-Z.; Park, D.-J.; Xu, L.-H.; Jiang, C.-L. Rhodococcus yunnanensis sp. nov., a mesophilic actinobacterium isolated from forest soil. Int. J. Syst. Evol. Microbiol. 2005, 55, 1133–1137. [Google Scholar] [CrossRef]
  77. Kutalik, Z.; Razaz, M.; Baranyi, J. Connection between stochastic and deterministic modelling of microbial growth. J. Theor. Biol. 2005, 232, 285–299. [Google Scholar] [CrossRef]
  78. Palleroni, N.J. The genus Pseudomonas. In Practical Handbook of Microbiology; CRC Press: Boca Raton, FL, USA, 2008; pp. 251–262. [Google Scholar]
  79. Palleroni, N.J. Pseudomonas. In Bergey’s Manual of Systematic Bacteriology; Wiley: Hoboken, NJ, USA, 2015; Volume 1. [Google Scholar]
  80. Singh, R.N.; Gaba, S.; Yadav, A.N.; Gaur, P.; Gulati, S.; Kaushik, R.; Saxena, A.K. First high quality draft genome sequence of a plant growth promoting and cold active enzyme producing psychrotrophic Arthrobacter agilis strain L77. Stand. Genom. Sci. 2016, 11, 54. [Google Scholar] [CrossRef]
  81. Ding, L.; Hirose, T.; Yokota, A. Four novel Arthrobacter species isolated from filtration substrate. Int. J. Syst. Evol. Microbiol. 2009, 59, 856–862. [Google Scholar] [CrossRef]
  82. Bakermans, C.; Nealson, K.H. Relationship of critical temperature to macromolecular synthesis and growth yield in Psychrobacter cryopegella. J. Bacteriol. 2004, 186, 2340–2345. [Google Scholar] [CrossRef] [PubMed]
  83. Goordial, J.; Raymond-Bouchard, I.; Zolotarov, Y.; de Bethencourt, L.; Ronholm, J.; Shapiro, N.; Woyke, T.; Stromvik, M.; Greer, C.W.; Bakermans, C. Cold adaptive traits revealed by comparative genomic analysis of the eurypsychrophile Rhodococcus sp. JG3 isolated from high elevation McMurdo Dry Valley permafrost, Antarctica. FEMS Microbiol. Ecol. 2016, 92, fiv154. [Google Scholar] [PubMed]
  84. Evtushenko, L.I. Leifsonia. In Bergey’s Manual of Systematic Bacteriology; Wiley: Hoboken, NJ, USA, 2015; pp. 1–32. [Google Scholar]
  85. Simonescu, C.M. Application of FTIR spectroscopy in environmental studies. Adv. Asp. Spectrosc. 2012, 29, 77–86. [Google Scholar]
  86. Alvarez-Ordonez, A.; Mouwen, D.; Lopez, M.; Prieto, M. Fourier transform infrared spectroscopy as a tool to characterize molecular composition and stress response in foodborne pathogenic bacteria. J. Microbiol. Methods 2011, 84, 369–378. [Google Scholar] [CrossRef]
  87. Busse, H.-J. Review of the taxonomy of the genus Arthrobacter, emendation of the genus Arthrobacter sensu lato, proposal to reclassify selected species of the genus Arthrobacter in the novel genera Glutamicibacter gen. nov., Paeniglutamicibacter gen. nov., Pseudoglutamicibacter gen. nov., Paenarthrobacter gen. nov. and Pseudarthrobacter gen. nov., and emended description of Arthrobacter roseus. Int. J. Syst. Evol. Microbiol. 2016, 66, 9–37. [Google Scholar]
  88. Guckert, J.B.; Ringelberg, D.B.; White, D.C.; Hanson, R.S.; Bratina, B.J. Membrane fatty acids as phenotypic markers in the polyphasic taxonomy of methylotrophs within the Proteobacteria. Microbiology 1991, 137, 2631–2641. [Google Scholar] [CrossRef]
  89. Zahran, H.; Abdel-Fattah, M.; Ahmad, M.; Zaky, A. Polyphasic taxonomy of symbiotic rhizobia from wild leguminous plants growing in Egypt. Folia Microbiol. 2003, 48, 510–520. [Google Scholar] [CrossRef]
  90. Abdulrasheed, M.; Zakaria, N.N.; Roslee, A.F.A.; Shukor, M.Y.; Zulkharnain, A.; Napis, S.; Convey, P.; Alias, S.A.; Gonzalez-Rocha, G.; Ahmad, S.A. Biodegradation of diesel oil by cold-adapted bacterial strains of Arthrobacter spp. from Antarctica. Antarct. Sci. 2020, 32, 341–353. [Google Scholar] [CrossRef]
  91. Ibrahim, S.; Abdul Khalil, K.; Zahri, K.N.M.; Gomez-Fuentes, C.; Convey, P.; Zulkharnain, A.; Sabri, S.; Alias, S.A.; González-Rocha, G.; Ahmad, S.A. Biosurfactant production and growth kinetics studies of the waste canola oil-degrading bacterium Rhodococcus erythropolis AQ5-07 from Antarctica. Molecules 2020, 25, 3878. [Google Scholar] [CrossRef]
  92. Roslee, A.F.A.; Zakaria, N.N.; Convey, P.; Zulkharnain, A.; Lee, G.L.Y.; Gomez-Fuentes, C.; Ahmad, S.A. Statistical optimisation of growth conditions and diesel degradation by the Antarctic bacterium, Rhodococcus sp. strain AQ5–07. Extremophiles 2020, 24, 277–291. [Google Scholar] [CrossRef]
  93. Sinensky, M. Homeoviscous adaptation—A homeostatic process that regulates the viscosity of membrane lipids in Escherichia coli. Proc. Natl. Acad. Sci. USA 1974, 71, 522–525. [Google Scholar] [CrossRef] [PubMed]
  94. Georlette, D.; Blaise, V.; Collins, T.; D’Amico, S.; Gratia, E.; Hoyoux, A.; Marx, J.-C.; Sonan, G.; Feller, G.; Gerday, C. Some like it cold: Biocatalysis at low temperatures. FEMS Microbiol. Rev. 2004, 28, 25–42. [Google Scholar] [CrossRef] [PubMed]
  95. Siddiqui, K.S.; Williams, T.J.; Wilkins, D.; Yau, S.; Allen, M.A.; Brown, M.V.; Lauro, F.M.; Cavicchioli, R. Psychrophiles. Annu. Rev. Earth Planet. Sci. 2013, 41, 87–115. [Google Scholar] [CrossRef]
  96. Fukunaga, N.; Russell, N.J. Membrane lipid composition and glucose uptake in two psychrotolerant bacteria from Antarctica. Microbiology 1990, 136, 1669–1673. [Google Scholar] [CrossRef]
Figure 1. CPCA scatter plot of IR spectra of the green snow bacteria grown on BHI medium. The scores are calculated by using the BHI block of the multi-block PCA model built on the (A) lipid region (3050–2800 cm−1 and 1800–1700 cm−1); (B) mixed region (1500–1200 cm−1); (C) protein region (1700–1500 cm−1); and (D) polysaccharide region (1200–700 cm−1). Numbers correspond to the temperatures used in the study.
Biology 11 00890 g001
Figure 2. CPCA loading plots of IR spectra of the green snow bacteria grown on BHI medium. (A) Lipid region (3050–2800 cm−1 and 1800–1700 cm−1); (B) mixed region (1500–1200 cm−1); (C) protein region (1700–1500 cm−1); (D) polysaccharide region (1200–700 cm−1).
Biology 11 00890 g002
Figure 3. Global scores and super weights for multi-block models using lipid (A,B), mixed (C,D), protein (E,F), and polysaccharide (G,H) spectral regions. Different media represent different blocks in a multi-block model. Numbers 04, 10, 18, and 25 correspond to the cultivation temperatures. Colors on the plots A, C, E, and G correspond to the genera: red—Arthrobacter, blue—Leifsonia, green—Pseudomonas, olive—Rhodococcus. Other genera were not represented since they did not grow under these conditions.
Biology 11 00890 g003
Figure 4. Block scores of the multi-block models built using lipid region of bacteria cultivated on different media and temperatures. Different media represent different blocks in a multi-block model: (A) MGU, (B) MGY, (C) XGU, (D) XGY, (E) BHI. Numbers 04, 10, 18, and 25 correspond to the cultivation temperatures. Colors on the plots correspond to the genera: red—Arthrobacter, blue—Leifsonia, green—Pseudomonas, olive—Rhodococcus.
Biology 11 00890 g004
Figure 5. Block scores of the multi-block models built using a mixed region of bacteria cultivated on different media and temperatures. Different media represent different blocks in a multi-block model: (A) MGU, (B) MGY, (C) XGU, (D) XGY, (E) BHI. Numbers 04, 10, 18, and 25 correspond to the cultivation temperatures. Colors on the plots correspond to the genera: red—Arthrobacter, blue—Leifsonia, green—Pseudomonas, olive—Rhodococcus.
Biology 11 00890 g005
Figure 6. Block scores of the multi-block models built using the protein region of bacteria cultivated on different media and temperatures. Different media represent different blocks in a multi-block model: (A) MGU, (B) MGY, (C) XGU, (D) XGY, (E) BHI. Numbers 04, 10, 18, and 25 correspond to the cultivation temperatures. Colors on the plots correspond to the genera: red—Arthrobacter, blue—Leifsonia, green—Pseudomonas, olive—Rhodococcus.
Biology 11 00890 g006
Figure 7. Block scores of the multi-block models built using polysaccharide region of bacteria cultivated on different media and temperatures. Different media represent different blocks in a multi-block model: (A) MGU, (B) MGY, (C) XGU, (D) XGY, (E) BHI. Numbers 04, 10, 18, and 25 correspond to the cultivation temperatures. Colors on the plots correspond to the genera: red—Arthrobacter, blue—Leifsonia, green—Pseudomonas, olive—Rhodococcus.
Biology 11 00890 g007
Figure 8. Block loading plots for PC1 and PC2 of IR spectra of the green snow bacteria grown on different media. (A) Lipid region (3050–2800 cm−1 and 1800–1700 cm−1); (B) mixed region (1500–1200 cm−1); (C) protein region (1700–1500 cm−1); (D) polysaccharide region (1200–700 cm−1).
Biology 11 00890 g008
Figure 9. Correlation loading plots for PC1/PC2 for the genera: (A) Arhtrobacter; (B) Cryobacterium; (C) Leifsonia; (D) Paeniglutamicibacter; (E) Polaromonas; (F) Pseudomonas; (G) Psychrobacter; (H) Rhodococcus; (I) Salinibacterium. Red—isolate number; black—species; blue—media, green—temperature; purple—lipid/ester region; teal—mixed region; olive—protein region. Plots (B,D,E,G,I) contain no information about media since these genera were not growing on minimal media and the data are from bacteria grown on BHI agar medium.
Biology 11 00890 g009aBiology 11 00890 g009b
Table 1. List of Antarctic bacterial isolates used in the study.
Bacterial Isolate NameCollection No/Samples Number [9]
Arthrobacter cryoconitiBIM B-1627/G.S.9
Arthrobacter oryzaeBIM B-1663/G.S.26
Arthrobacter sp.BIM B-1624/G.S.6
Arthrobacter sp.BIM B-1625/G.S.7
Arthrobacter sp.BIM B-1626/G.S.8
Arthrobacter sp.BIM B-1628/G.S.10
Arthrobacter sp.BIM B-1664/G.S.29
Arthrobacter sp.BIM B-1666/G.S.31
Arthrobacter sp.BIM B-1656/G.S.37
Cryobacterium arcticumBIM B-1619/G.S.1
Cryobacterium arcticumBIM B-1620/G.S.2
Cryobacterium soliBIM B-1658/G.S.39
Cryobacterium soliBIM B-1659/G.S.40
Cryobacterium soliBIM B-1677/G.S.41
Cryobacterium soliBIM B-1675/G.S.43
Leifsonia antarcticaBIM B-1631/G.S.13
Leifsonia antarcticaBIM B-1632/G.S.14
Leifsonia antarcticaBIM B-1637/G.S.19
Leifsonia antarcticaBIM B-1638/G.S.20
Leifsonia antarcticaBIM B-1639/G.S.21
Leifsonia antarcticaBIM B-1669/G.S.22
Leifsonia antarcticaBIM B-1671/G.S.27
Leifsonia kafniensisBIM B-1633/G.S.15
Leifsonia rubraBIM B-1622/G.S.4
Leifsonia rubraBIM B-1623/G.S.5
Leifsonia rubraBIM B-1634/G.S.16
Paeniglutamicibacter antarcticusBIM B-1657/G.S.38
Polaromonas sp.BIM B-1676/G.S.42
Pseudomonas extremaustralisBIM B-1672/G.S.35
Pseudomonas fluorescensBIM B-1668/G.S.33
Pseudomonas sp.BIM B-1635/G.S.17
Pseudomonas sp.BIM B-1667/G.S.32
Pseudomonas sp.BIM B-1673/G.S.34
Pseudomonas versutaBIM B-1674/G.S.36
Psychrobacter glacinicolaBIM B-1629/G.S.11
Psychrobacter urativoransBIM B-1655/G.S.24
Psychrobacter urativoransBIM B-1662/G.S.25
Rhodococcus yunnanensisBIM B-1621/G.S.3
Rhodococcus yunnanensisBIM B-1670/G.S.28
Rhodococcus erythropolisBIM B-1660/G.S.44
Rhodococcus erythropolisBIM B-1661/G.S.45
Salinibacterium sp.BIM B-1630/G.S.12
Salinibacterium sp.BIM B-1636/G.S.18
Salinibacterium sp.BIM B-1654/G.S.23
Salinibacterium sp.BIM B-1665/G.S.30
Table 2. Chemical composition of the cultivation media used in the study.
Composition of Salt Solution (g/L)MGUMGYXGUXGYBHI
Na2HPO42424---
KH2PO4121244-
K2HPO4--1212-
NaCl2.52.5---
NH4Cl552020-
NH4NO3--44-
Na2SO4 × 10H2O--88-
MgSO4 × 7H2O--0.40.4-
Commercial powder----37
Media composition (mL)
Salt solution100100100100-
20% agar3003003003001000
0.1 M CaCl244---
0.1 M MgSO444---
20% glucose4-4--
20% glycerol-4-4-
Table 3. Growth ability of the green snow bacteria on different media and temperatures (samples marked with colors based on grade scale: 0–2—red, 3–4—orange, 5–6—yellow, 7–8—blue, 9–10—green).
Arthrobacter
1624 *
G.S.6
1625
G.S.7
1626
G.S.8
1627
G.S.9
1628
G.S.10
1663
G.S.26
1664
G.S.29
1666
G.S.31
1656
G.S.37
BHI4 °C
10 °C
18 °C
25 °C
XGU4 °C
10 °C
18 °C
25 °C
XGY4 °C
10 °C
18 °C
25 °C
MGU4 °C
10 °C
18 °C
25 °C
MGY4 °C
10 °C
18 °C
25 °C
Pseudomonas Rhodococcus
1635
G.S.17
1667
G.S.32
1668
G.S.33
1673
G.S.34
1672
G.S.35
1674
G.S.36
1621
G.S.3
1670
G.S.28
1660
G.S.44
1661
G.S.45
BHI4 °C
10 °C
18 °C
25 °C
XGU4 °C
10 °C
18 °C
25 °C
XGY4 °C
10 °C
18 °C
25 °C
MGU4 °C
10 °C
18 °C
25 °C
MGY4 °C
10 °C
18 °C
25 °C
Cryobacterium Salinibacterium
1619
G.S.1
1620
G.S.2
1658
G.S.39
1659
G.S.40
1677
G.S.41
1675
G.S.43
1630
G.S.12
1636
G.S.18
1654
G.S.23
1665
G.S.30
BHI4 °C
10 °C
18 °C
25 °C
XGU
XGY
MGU
MGY
4 °C
10 °C
18 °C
25 °C
Leifsonia
1622
G.S.4
1623
G.S.5
1631
G.S.13
1632
G.S.14
1633
G.S.15
1634
G.S.16
1637
G.S.19
1638
G.S.20
1639
G.S.21
1669
G.S.22
1671
G.S.27
BHI4 °C
10 °C
18 °C
25 °C
XGU
XGY
MGU
MGY
4 °C
10 °C
18 °C
25 °C
Psychrobacter Paeniglutamicibcter antarcticus 1657
G.S.38
Polaromonas sp.
1676
G.S.42
1629
G.S.11
1655
G.S.24
1662
G.S.25
BHI4 °C
10 °C
18 °C
25 °C
XGU
XGY
MGU
MGY
4 °C
10 °C
18 °C
25 °C
* Numbers are according to the registration number BIM B-XXXX at the Belarussian Collection of Non-pathogenic Microorganisms (Institute of Microbiology of the National Academy of Sciences of Belarus) (Table 1).
Publisher’s Note: MDPI stays neutral with regard to jurisdictional claims in published maps and institutional affiliations.

