Maximum Entropy Modeling the Distribution Area of Morchella Dill. ex Pers. Species in China under Changing Climate
Abstract
:Simple Summary
Abstract
1. Introduction
2. Materials and Methods
2.1. Source of Species Distribution Data
2.2. Environmental Factor Acquisition and Pretreatment
2.3. MaxEnt Model Analysis
2.3.1. Model Parameter Selection
2.3.2. Model and Environmental Variable Evaluation
2.3.3. Suitable Region Classification
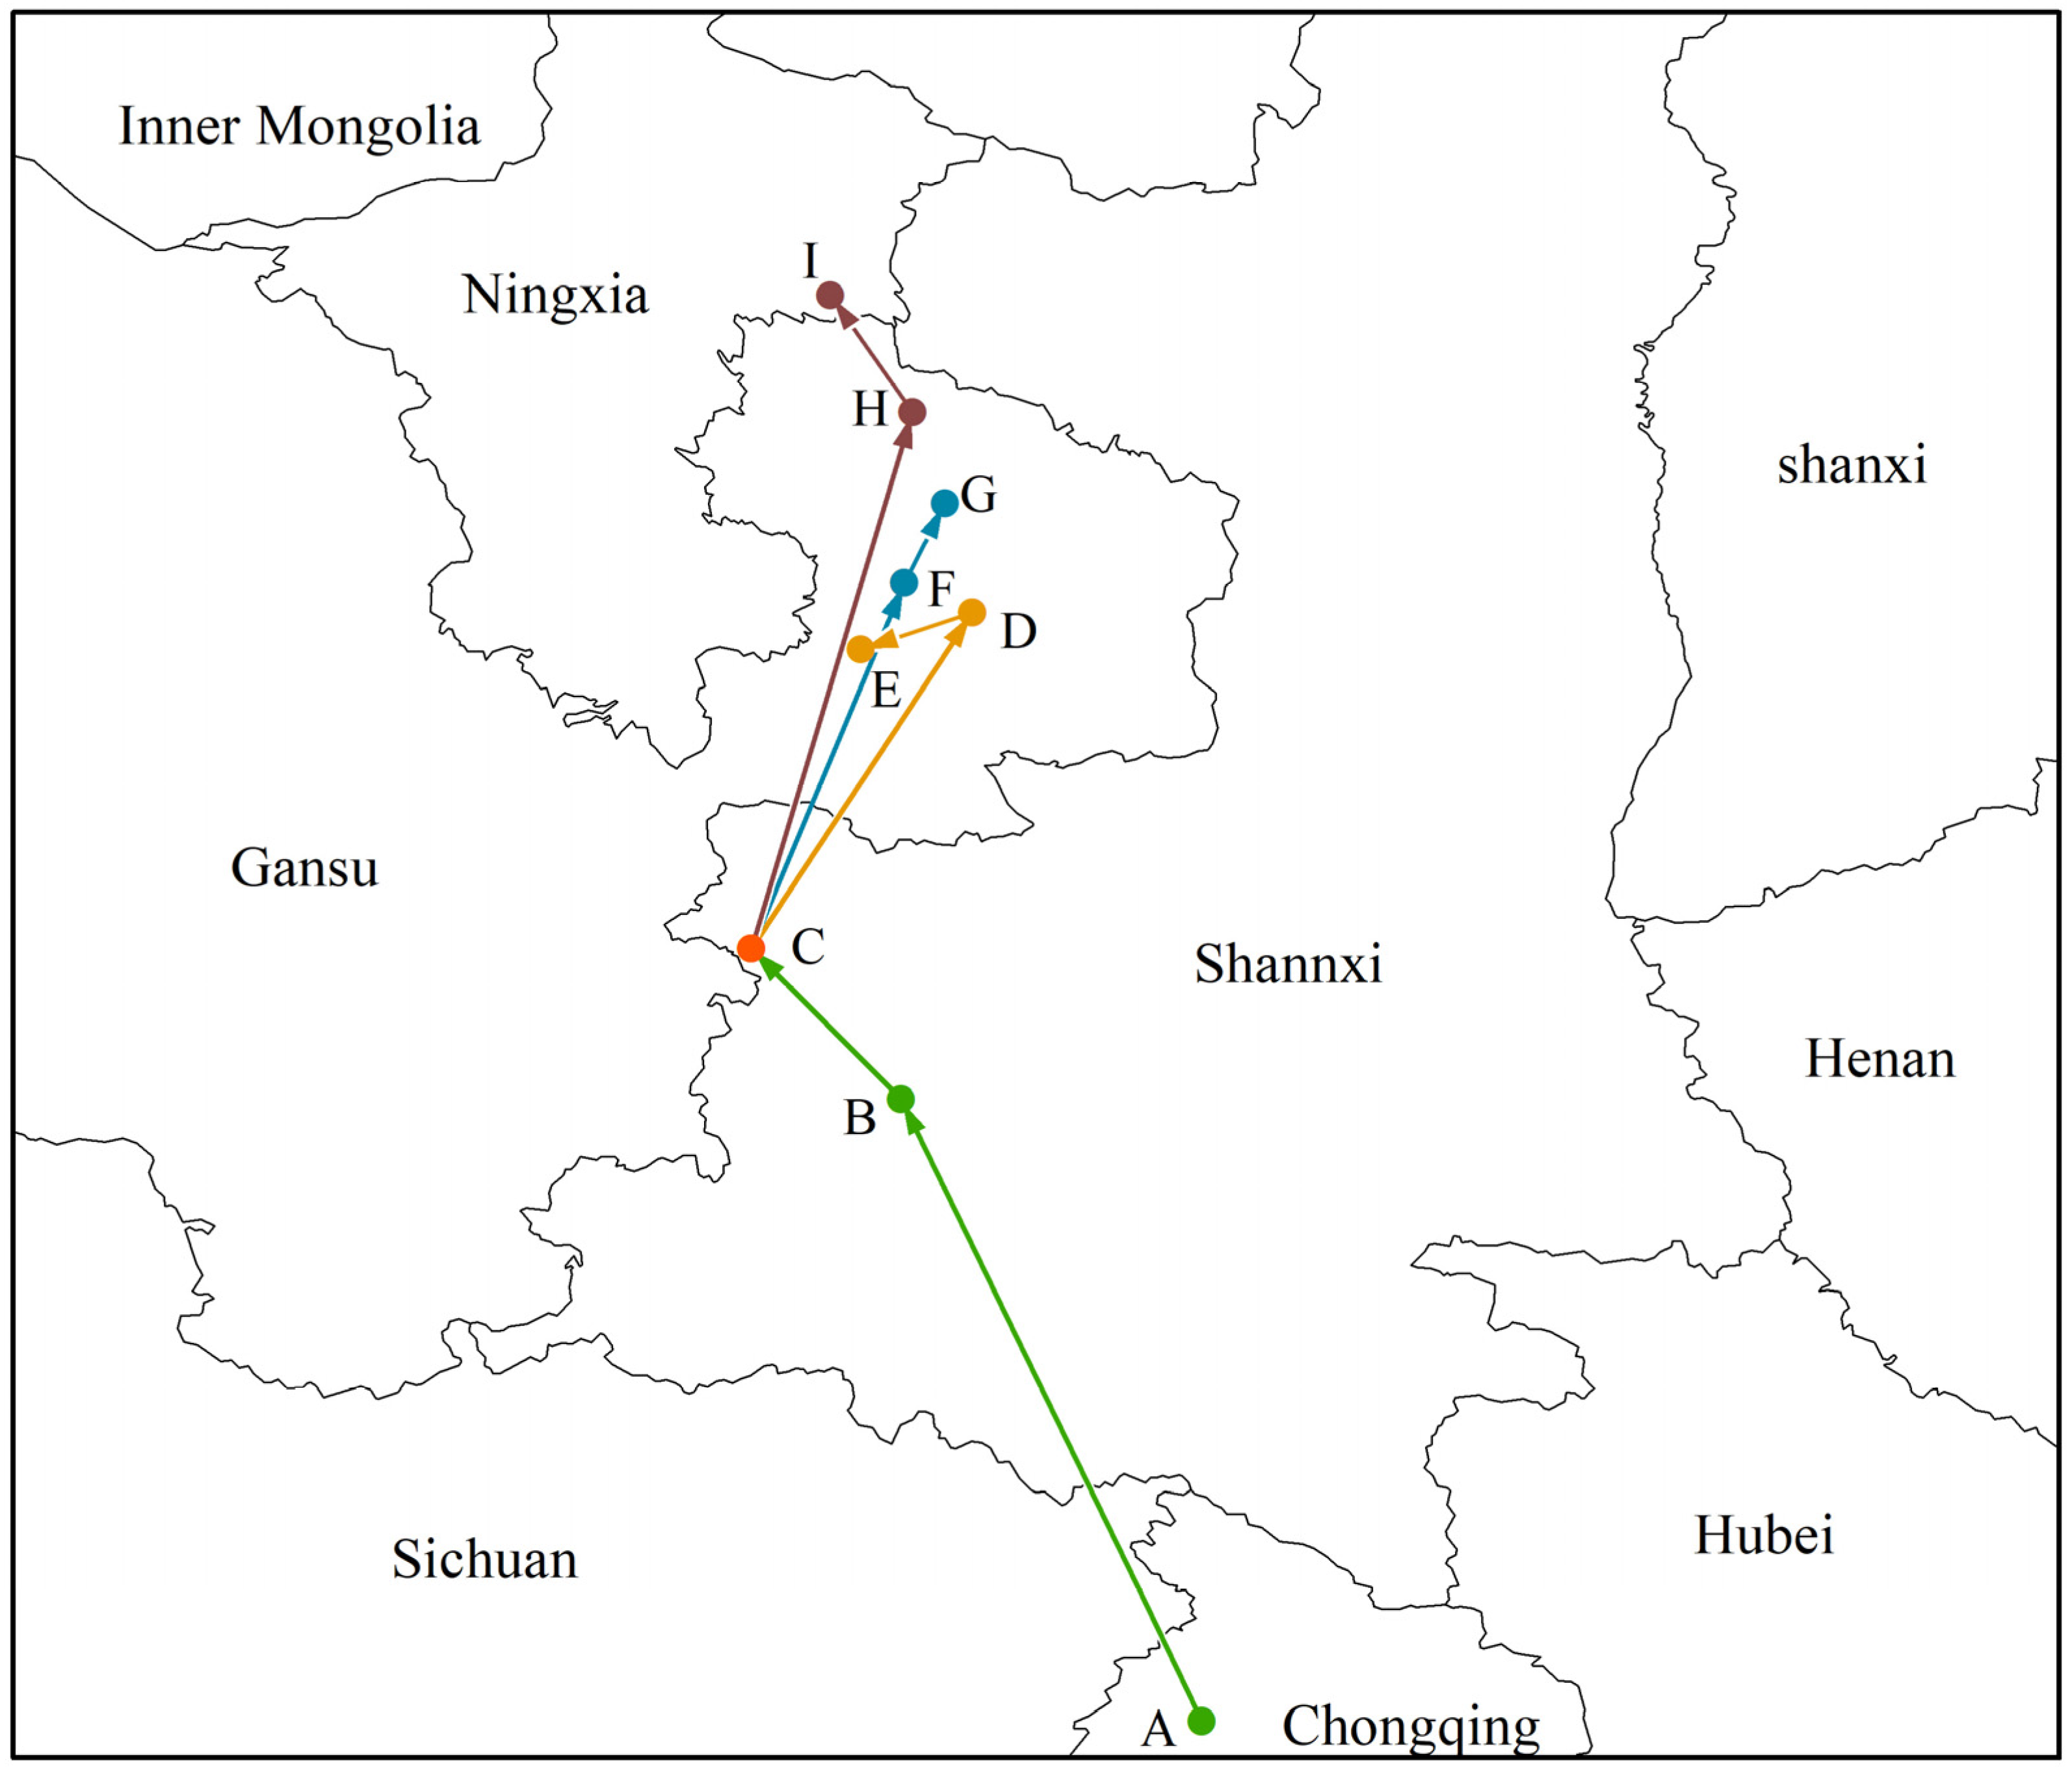
2.3.4. Change in Distribution Center of Morchella
3. Results
3.1. Evaluation of the Accuracy of the Model
3.2. Dominant Environmental Factors
3.3. Potential Geographical Distribution and Evaluation of Suitable Areas of Morchella
3.3.1. Suitable Areas in the Past
3.3.2. Suitable Areas of Current Times
3.3.3. Evaluation of Potential Distribution Areas of Morchella in the Future
3.4. Possible Influence of Climate Change on the Geographic Distribution of Morchella
3.5. Change in Morchella Distribution Center of Suitable Areas
4. Discussion
4.1. Change in Geographic Distributions
4.2. Climate Effects
4.3. Limitation
5. Conclusions
Supplementary Materials
Author Contributions
Funding
Institutional Review Board Statement
Informed Consent Statement
Data Availability Statement
Conflicts of Interest
References
- Cristian, R.P. Recent responses to climate change reveal the drivers of species extinction and survival. Proc. Natl. Acad. Sci. USA 2020, 117, 4211–4217. [Google Scholar]
- Taheri, S.; Naimi, B.; Rahbek, C.; Araújo, M. Improvements in reports of species redistribution under climate change are required. Sci. Adv. 2021, 7, eabe1110. [Google Scholar] [CrossRef] [PubMed]
- Chen, I.C.; Hill, J.K.; Ohlemuller, R.; Roy, D.B.; Thomas, C.D. Rapid range shifts of species associated with high levels of climate warming. Science 2011, 333, 1024–1026. [Google Scholar] [CrossRef] [PubMed]
- Dawson, T.P. Beyond predictions: Biodiversity conservation in a changing climate. Science 2011, 332, 664. [Google Scholar]
- Thapa, A.; Wu, R.; Hu, Y.; Nie, Y.; Singh, P.B.; Khatiwada, J.R.; Yan, L.; Gu, X.; Wei, F. Predicting the potential distribution of the endangered red panda across its entire range using MaxEnt modeling. Ecol. Evol. 2018, 8, 10542–10554. [Google Scholar] [CrossRef]
- Huang, X.; Ma, L.; Chen, C.; Zhou, H.; Ma, Z. Predicting the Suitable Geographical Distribution of Sinadoxa Corydalifolia under Different Climate Change Scenarios in the Three-River Region Using the MaxEnt Model. Plants 2020, 9, 1015. [Google Scholar] [CrossRef]
- Qin, Z.; Zhang, J.; DiTommaso, A.; Wang, R.; Wu, R. Predicting invasions of Wedelia trilobata (L.) Hitchc. with Maxent and GARP models. J. Plant Res. 2015, 128, 763–775. [Google Scholar]
- Soberón, J.M. Niche and area of distribution modeling: A population ecology perspective. Ecography 2010, 33, 159–167. [Google Scholar] [CrossRef]
- Anderson, R.P. A framework for using niche models to estimate impacts of climate change on species distributions. Ann. N.Y. Acad. Sci. 2013, 1297, 8–28. [Google Scholar] [CrossRef]
- Ranc, N.; Santini, L.; Rondinini, C.; Boitani, L.; Poitevin, F.; Angerbjörn, A.; Maiorano, L. Performance tradeoffs in target-group bias correction for species distribution models. Ecography 2017, 40, 1076–1087. [Google Scholar] [CrossRef]
- Elith, J.; Leathwick, J.R. Species distribution models: Ecological explanation and prediction across space and time. Annu. Rev. Ecol. Evol. Syst. 2009, 40, 677–697. [Google Scholar] [CrossRef]
- Guisan, A.; Zimmermann, N.E. Predictive habitat distribution models in ecology. Ecol. Model. 2000, 135, 147–186. [Google Scholar] [CrossRef]
- Thibaud, E.; Petitpierre, B.; Broennimann, O.; Davison, A.C.; Guisan, A. Measuring the relative effect of factors affecting species distribution model predictions. Methods Ecol. Evol. 2015, 5, 947–955. [Google Scholar] [CrossRef]
- Qiao, H.; Soberón, J.; Peterson, A.T. No silver bullets in correlative ecological niche modelling: Insights from testing among many potential algorithms for niche estimation. Methods Ecol. Evol. 2015, 6, 1126–1136. [Google Scholar] [CrossRef]
- Phillips, S.J.; Anderson, R.P.; Schapire, R.E. Maximum entropy modeling of species geographic distributions. Ecol. Model. 2006, 190, 231–259. [Google Scholar] [CrossRef] [Green Version]
- Phillips, S.J.; Dudík, M.; Schapire, R.E. A Maximum Entropy Approach to Species Distribution Modeling. Proc. Twenty-First Int. Conf. Mach. Learn. 2004, 472–486. [Google Scholar] [CrossRef] [Green Version]
- Hernandez, P.A.; Graham, C.H.; Master, L.L.; Albert, D.L. The effect of sample size and species characteristics on performance of different species distribution modeling methods. Ecography 2006, 29, 773–785. [Google Scholar] [CrossRef]
- Sun, X.; Long, Z.; Jia, J. A multi-scale Maxent approach to model habitat suitability for the giant pandas in the Qionglai mountain, China. Glob. Ecol. Conserv. 2021, 30, e01766. [Google Scholar] [CrossRef]
- Liu, L.; Guan, L.; Zhao, H.; Huang, Y.; Mou, Q.; Liu, K.; Chen, T.; Wang, X.; Zhang, Y.; Wei, B. Modeling habitat suitability of Houttuynia cordata Thunb (Ceercao) using MaxEnt under climate change in China. Ecol. Inform. 2021, 63, 101324. [Google Scholar] [CrossRef]
- Yuan, H.; Wei, Y.; Wang, X. Maxent modeling for predicting the potential distribution of Sanghuang, an important group of medicinal fungi in China. Fungal Ecol. 2015, 17, 140–145. [Google Scholar] [CrossRef]
- Phanpadith, P.; Yu, Z.; Li, T. High diversity of Morchella and a novel lineage of the Esculenta clade from the north Qinling Mountains revealed by GCPSR-based study. Sci. Rep. 2019, 9, 19856. [Google Scholar] [CrossRef] [PubMed] [Green Version]
- Wu, H.; Chen, J.; Li, J.; Liu, Y.; Park, H.J.; Yang, L. Recent advances on bioactive ingredients of Morchella esculenta. Appl. Biochem. Biotechnol. 2021, 193, 4197–4213. [Google Scholar] [CrossRef] [PubMed]
- Wen, Y.; Bi, S.; Hu, X.; Yang, J.; Li, C.; Li, H.; Yu, D.; Zhu, J.; Song, L.; Yu, R. Structural characterization and immunomodulatory mechanisms of two novel glucans from Morchella importuna fruiting bodies. Int. J. Biol. Macromol. 2021, 183, 145–157. [Google Scholar] [CrossRef] [PubMed]
- Wang, Z.; Wang, H.; Kang, Z.; Wu, Y.; Xing, Y.; Yang, Y. Antioxidant and anti-tumour activity of triterpenoid compounds isolated from Morchella mycelium. Arch. Microbiol. 2020, 202, 1677–1685. [Google Scholar] [CrossRef] [PubMed]
- Tang, Y.; Chen, J.; Li, F.; Yang, Y.; Wu, S.; Ming, J. Antioxidant and antiproliferative activities of modified polysaccharides originally isolated from Morchella Angusticepes Peck. J. Food Sci. 2019, 84, 448–456. [Google Scholar] [CrossRef] [PubMed]
- Du, X.; Zhao, Q.; Yang, Z. A review on research advances, issues, and perspectives of morels. Mycology 2015, 6, 78–85. [Google Scholar] [CrossRef] [Green Version]
- Du, X.; Zhao, Q.; O’Donnell, K.; Rooney, A.P.; Yang, Z. Multigene molecular phylogenetics reveals true morels (Morchella) are especially species-rich in China. Fungal Genet. Biol. 2012, 49, 455–469. [Google Scholar] [CrossRef]
- Du, X.; Zhao, Q.; Xu, J.; Yang, Z. High inbreeding, limited recombination and divergent evolutionary patterns between two sympatric morel species in China. Sci. Rep. 2016, 6, 22434. [Google Scholar] [CrossRef] [Green Version]
- Hussain, S.; Sher, H. Ecological characterization of Morel (Morchella spp.) habitats: A multivariate comparison from three forest types of district Swat, Pakistan. Acta Ecol. Sin. 2021, 41, 1–9. [Google Scholar]
- Davidson, E.A. Representative concentration pathways and mitigation scenarios for nitrous oxide. Environ. Res. Lett. 2012, 7, 024005. [Google Scholar]
- Fotheringham, A.S.; Oshan, T.M. Geographically weighted regression and multicollinearity: Dispelling the myth. J. Geogr. Syst. 2016, 18, 303–329. [Google Scholar] [CrossRef]
- Garza, G.; Rivera, A.; Venegas Barrera, C.S.; Martinez-Ávalos, J.G.; Dale, J.; Feria Arroyo, T.P. Potential effects of climate change on the geographic distribution of the endangered plant species Manihot walkerae. Forests 2020, 11, 689. [Google Scholar]
- Dormann, C.F.; Elith, J.; Bacher, S.; Buchmann, C.; Carl, G.; Carré, G.; Marquéz, J.R.G.; Gruber, B.; Lafourcade, B.; Leitão, P.J.; et al. Collinearity: A review of methods to deal with it and a simulation study evaluating their performance. Ecography 2013, 36, 27–46. [Google Scholar] [CrossRef]
- Dai, X.; Wu, W.; Ji, L.; Tian, S.; Yang, B.; Guan, B.; Wu, D. MaxEnt model-based prediction of potential distributions of Parnassiawightiana (Celastraceae) in China. Biodvers. Data. J. 2022, 10, e81073. [Google Scholar] [CrossRef] [PubMed]
- Fielding, A.H.; Bell, J.F. A review of methods for the assessment of prediction errors in conservation presence/absence models. Environ. Conserv. 1997, 24, 38–49. [Google Scholar] [CrossRef]
- Swets, J.A. Measuring the accuracy of diagnostic systems. Science 1988, 240, 1285–1293. [Google Scholar] [CrossRef] [Green Version]
- Aven, T.; Renn, O. An evaluation of the treatment of risk and uncertainties in the IPCC reports on climate change. Risk Anal. 2015, 35, 701–712. [Google Scholar] [CrossRef]
- Cao, C.; Tao, J. Predicting the areas of suitable distribution for Zelkova serrata in China under climate change. Sustainability 2021, 13, 1493. [Google Scholar] [CrossRef]
- Gao, L.; Wang, X.; Liu, B. Research progress on genetic diversity and cultivation of Morchella. Hans J. Agric. Sci. 2020, 10, 138–143. [Google Scholar]
- Wei, Y.; Zhang, L.; Wang, J.; Wang, W.; Niyati, N.; Guo, Y.; Wang, X. Chinese caterpillar fungus (Ophiocordyceps sinensis) in China: Current distribution, trading, and futures under climate change and overexploitation. Sci. Total Environ. 2021, 755, 142548. [Google Scholar] [CrossRef]
- Elith, J.; Phillips, S.J.; Hastie, T.; Dudík, M.; Chee, Y.E.; Yates, C.J. A statistical explanation of MaxEnt for ecologists. Divers. Distrib. 2011, 17, 43–57. [Google Scholar] [CrossRef]
- Pachauri, R.K.; Allen, M.R.; Barros, V.R.; Broome, J.; Cramer, W.; Christ, R.; Church, J.A.; Clarke, L.; Dahe, Q.; Dasgupta, P.; et al. Climate Change 2014: Synthesis Report. Contribution of Working Groups I, II and III to the fifth Assessment Report of The Intergovernmental Panel on Climate Change; IPCC: Geneva, Switzerland, 2014. [Google Scholar]
- Moss, R.H.; Edmonds, J.A.; Hibbard, K.A.; Manning, M.R.; Rose, S.K.; van Vuuren, D.P.; Carter, T.R.; Emori, S.; Kainuma, M.; Kram, T.; et al. The next generation of scenarios for climate change research and assessment. Nature 2010, 463, 747–756. [Google Scholar] [CrossRef] [PubMed]
- Lu, K.; He, Y.; Mao, W.; Du, Z.; Wang, L.; Liu, G.; Feng, W.; Duan, Y. Potential geographical distribution and changes of Artemisia ordosica in China under future climate change. Chin. J. Appl. Ecol. 2020, 31, 3758–3766. [Google Scholar]
- Pan, J.; Fan, X.; Luo, S.; Zhang, Y.; Yao, S.; Guo, Q.; Qian, Z. Predicting the potential distribution of two varieties of Litsea coreana (Leopard-Skin Camphor) in China under climate change. Forests 2020, 11, 1159. [Google Scholar] [CrossRef]
- Angert, A.L.; Crozier, L.G.; Rissler, L.J.; Gilman, S.E.; Tewksbury, J.J.; Chunco, A.J. Do species’ traits predict recent shifts at expanding range edges? Ecol. Lett. 2011, 14, 677–689. [Google Scholar] [CrossRef] [PubMed]
- Liu, H.; Gong, H.; Qi, X.; Li, Y.; Lin, Z. Relative importance of environmental variables for the distribution of the invasive marsh species Spartina alterniflora across different spatial scales. Mar. Freshw. Res. 2018, 69, 790–801. [Google Scholar] [CrossRef]
- Bie, J.; Zheng, K.; Gao, X.; Liu, B.; Ma, J.; Hayat, M.A.; Xiao, J.; Wang, H. Spatial risk analysis of Batrachochytrium dendrobatidis, a global emerging fungal pathogen. EcoHealth 2021, 18, 3–12. [Google Scholar] [CrossRef]
- Jin, L.; Chao, Y.; Ke, Z.; Dong, Y. Climate suitability analysis and application of Morchella cultivation in Wangcang. Plateau Mountain Meteor. Res. 2020, 40, 79–81. [Google Scholar]
- Mackey, B.G.; Lindenmayer, D.B. Towards a hierarchical framework for modelling the spatial distribution of animals. J. Biogeogr. 2001, 28, 1147–1166. [Google Scholar]
- Mihail, J.D.; Bruhn, J.N.; Bonello, P. Spatial and temporal patterns of morel fruiting. Mycol. Res. 2007, 111, 339–346. [Google Scholar] [CrossRef]
- Landi, M.; Salerni, E.; Ambrosio, E.; D’Aguanno, M.; Nucci, A.; Saveri, C.; Perini, C.; Angiolini, C. Concordance between vascular plant and macrofungal community composition in broadleaf deciduous forests in central Italy. Iforest 2015, 8, 279–286. [Google Scholar] [CrossRef] [Green Version]
- O’Donnell, K.; Rooney, A.P.; Mills, G.L.; Kuo, M.; Weber, N.S.; Rehner, S.A. Phylogeny and historical biogeography of true morels (Morchella) reveals an early Cretaceous origin and high continental endemism and provincialism in the Holarctic. Fungal Genet. Biol. 2011, 48, 252–265. [Google Scholar] [CrossRef]
- Engler, R.; Randin, C.F.; Vittoz, P.; Czã¡Ka, T.; Beniston, M.; Zimmermann, N.E.; Guisan, A. Predicting future distributions of mountain plants under climate change: Does dispersal capacity matter? Ecography 2010, 32, 34–45. [Google Scholar] [CrossRef] [Green Version]
- Malcolm, J.R.; Markham, A.; Neilson, R.P.; Garaci, M. Estimated migration rates under scenarios of global climate change. J. Biogeogr. 2002, 29, 835–849. [Google Scholar] [CrossRef] [Green Version]
- Engler, R.; Hordijk, W.; Guisan, A. The MIGCLIM R package—Seamless integration of dispersal constraints into projections of species distribution models. Ecography 2012, 35, 872–878. [Google Scholar] [CrossRef]
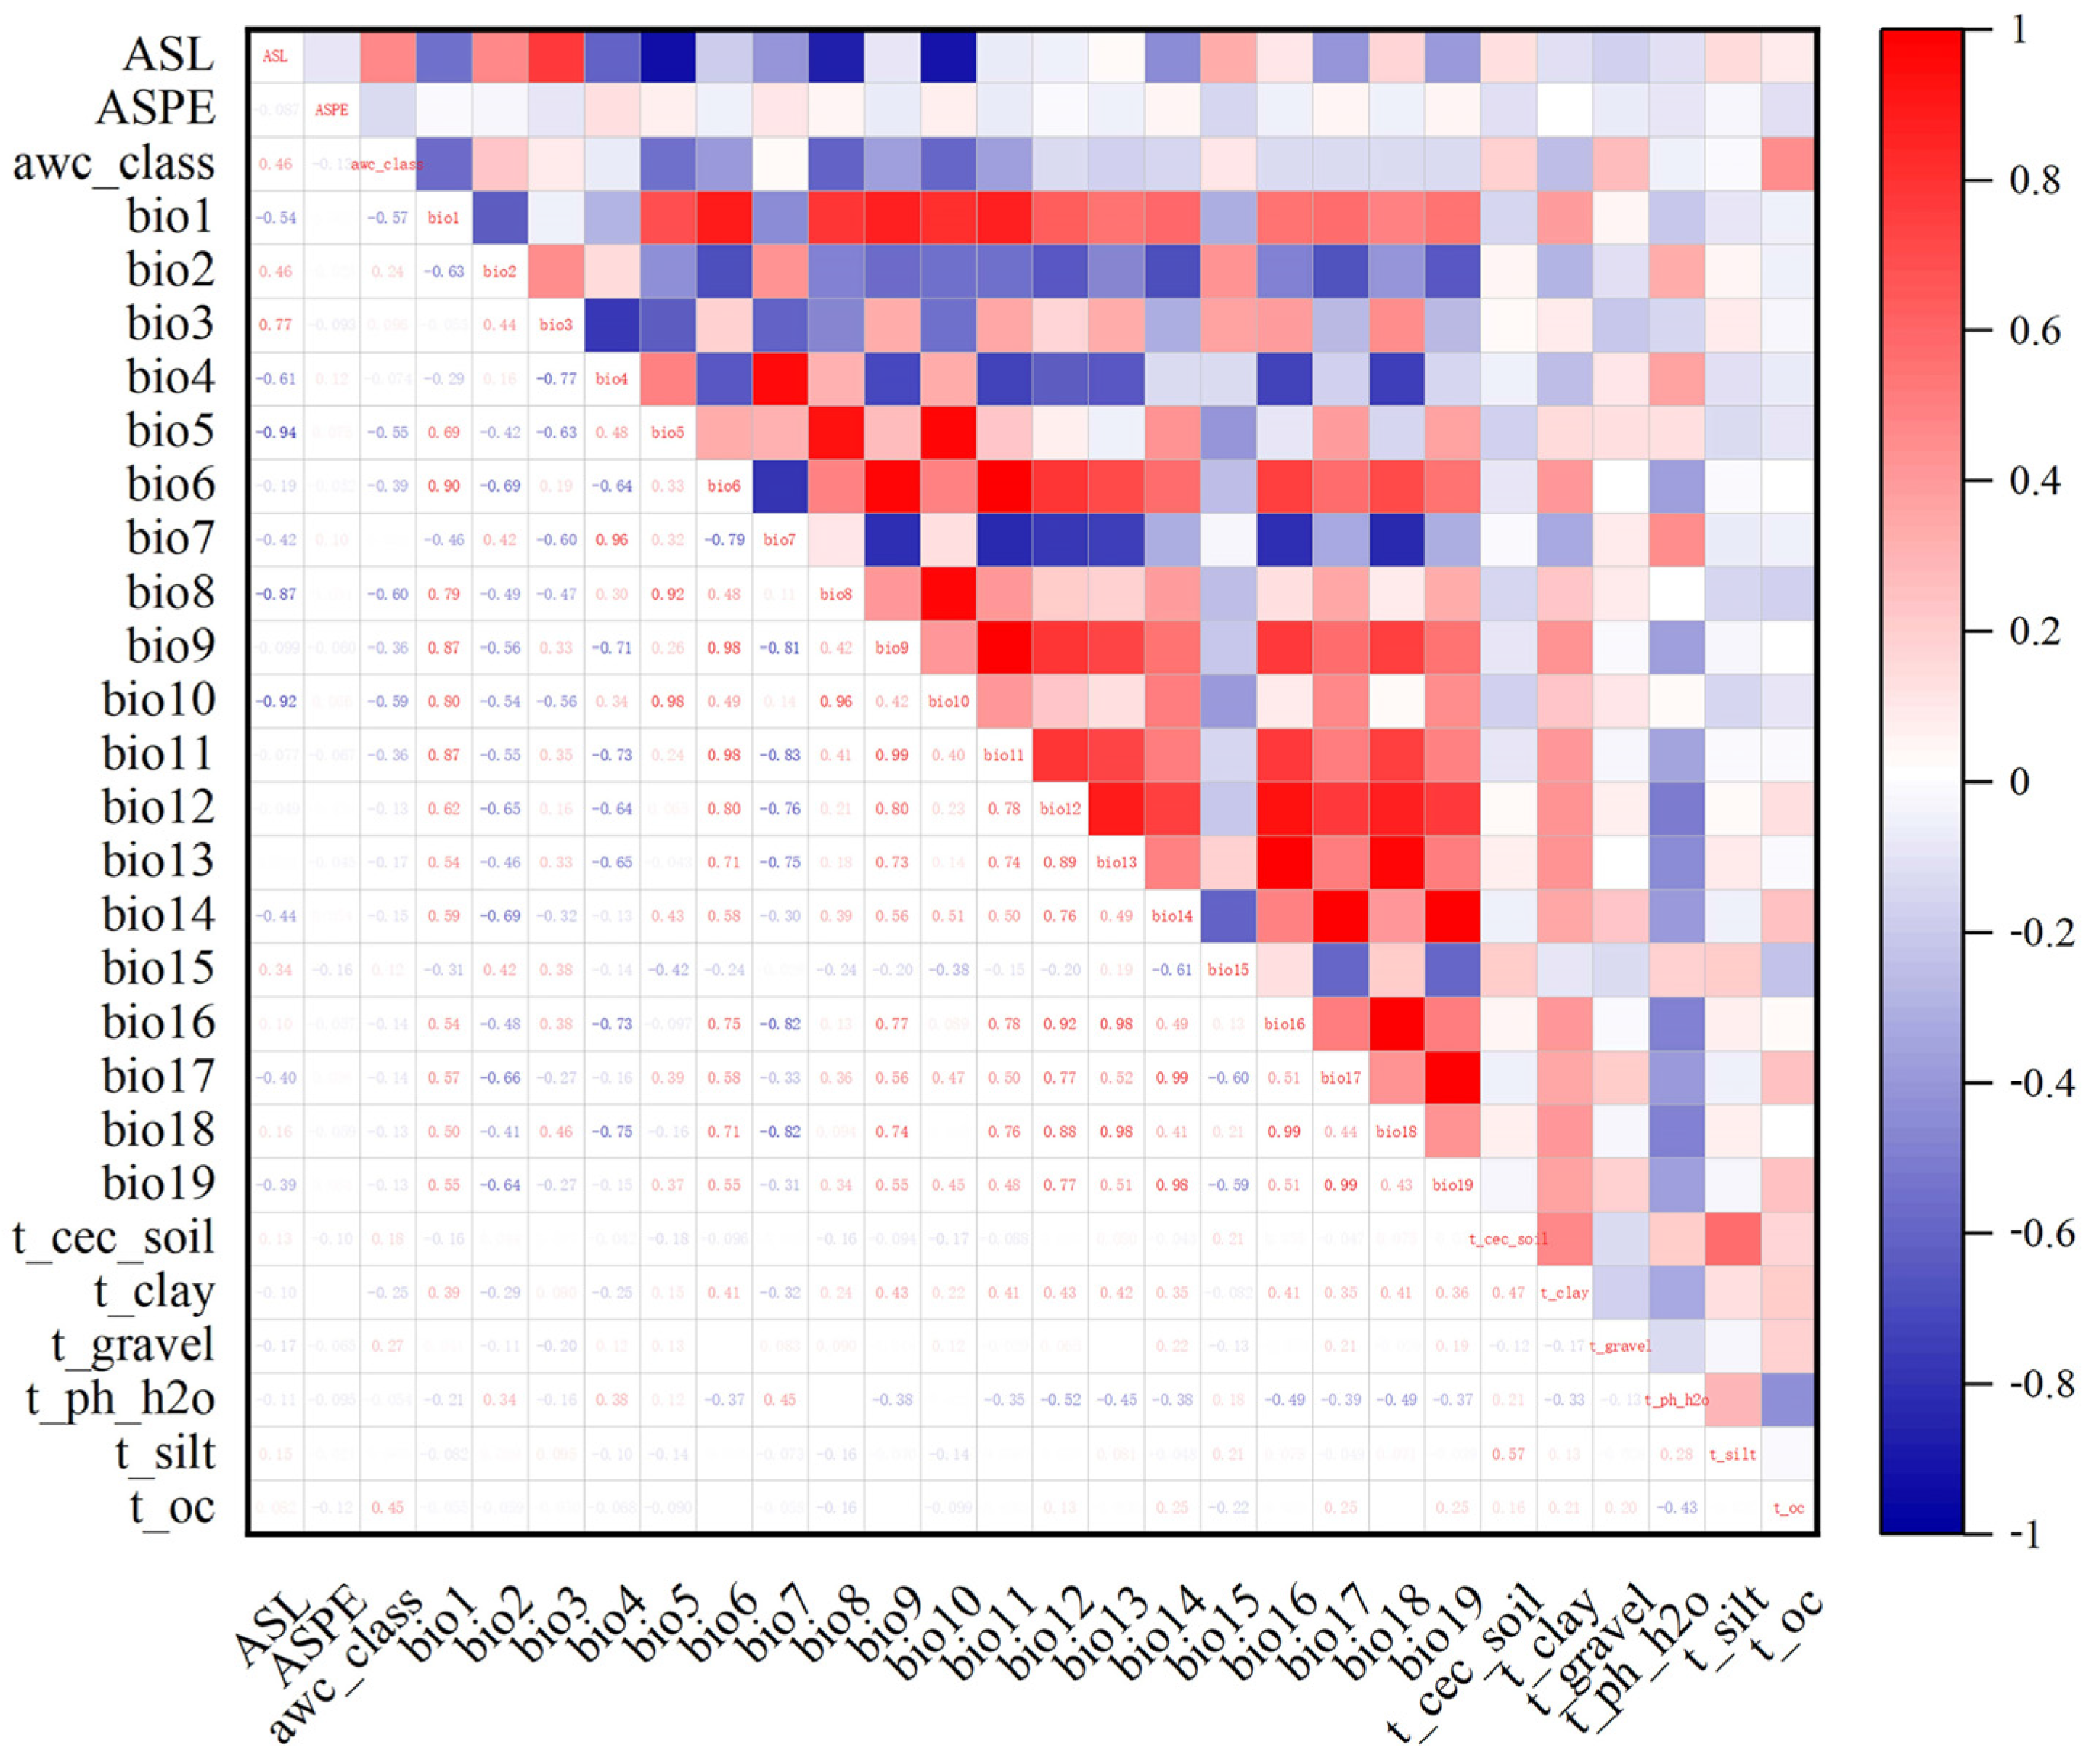
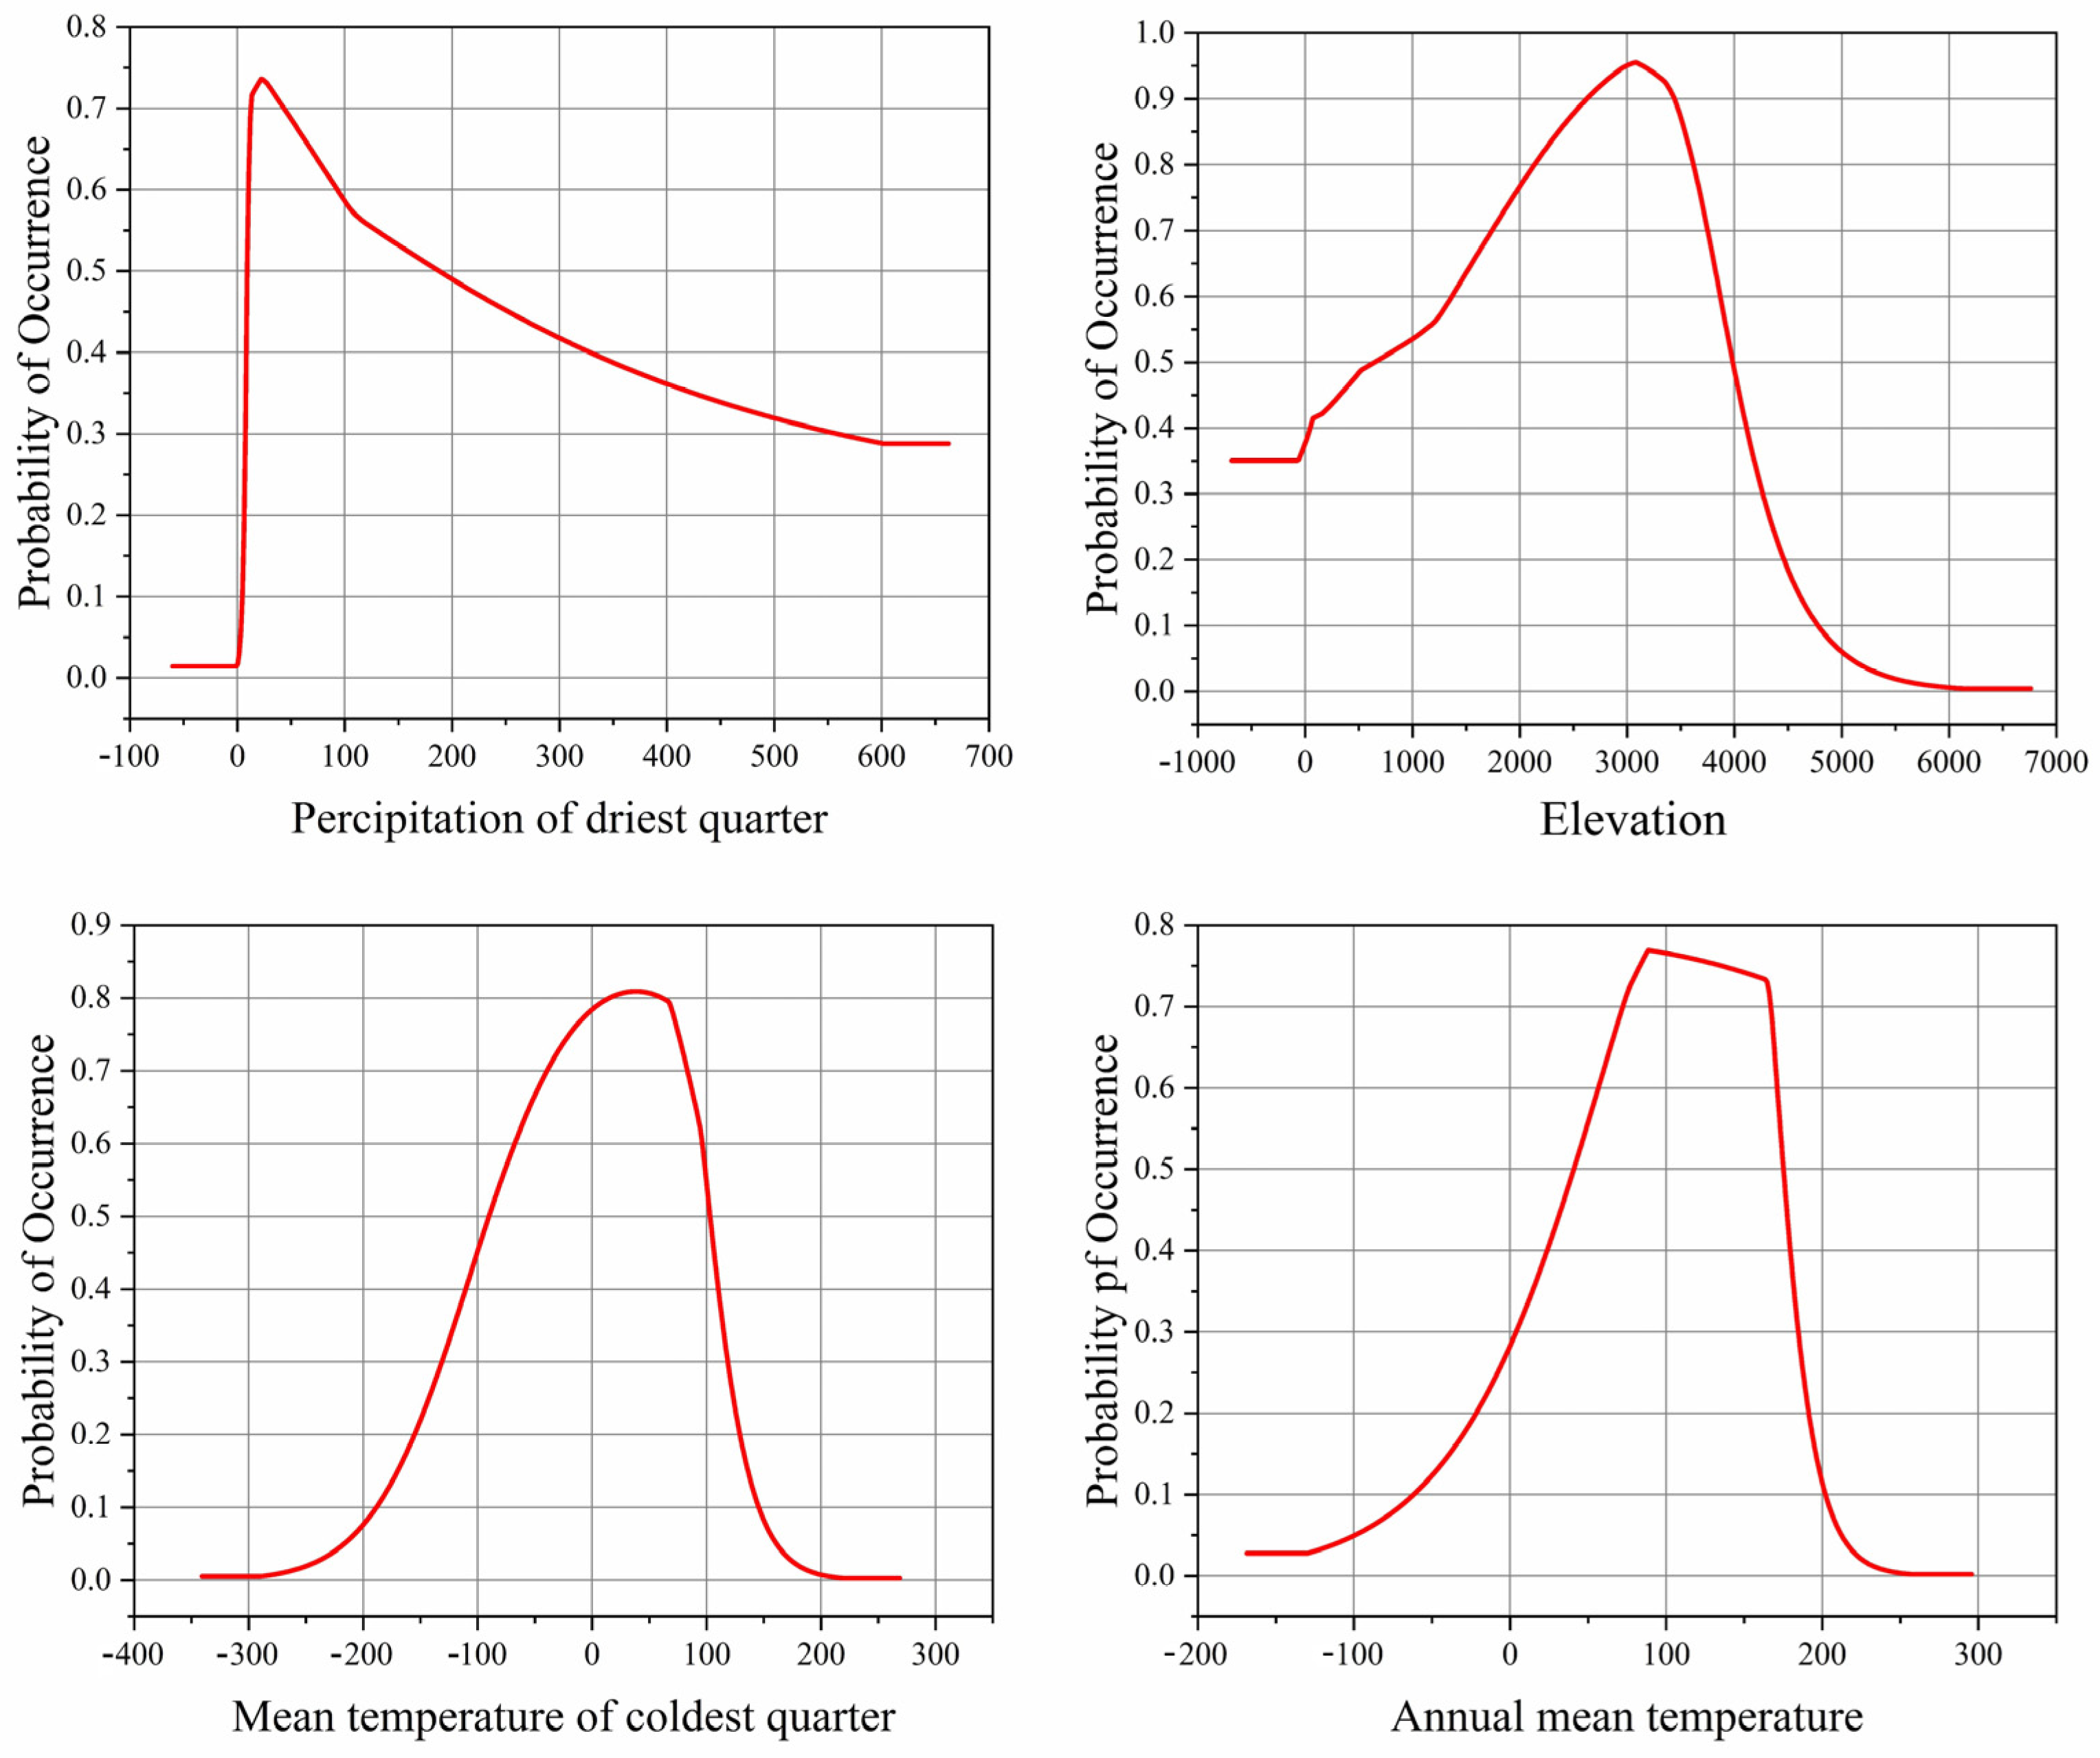
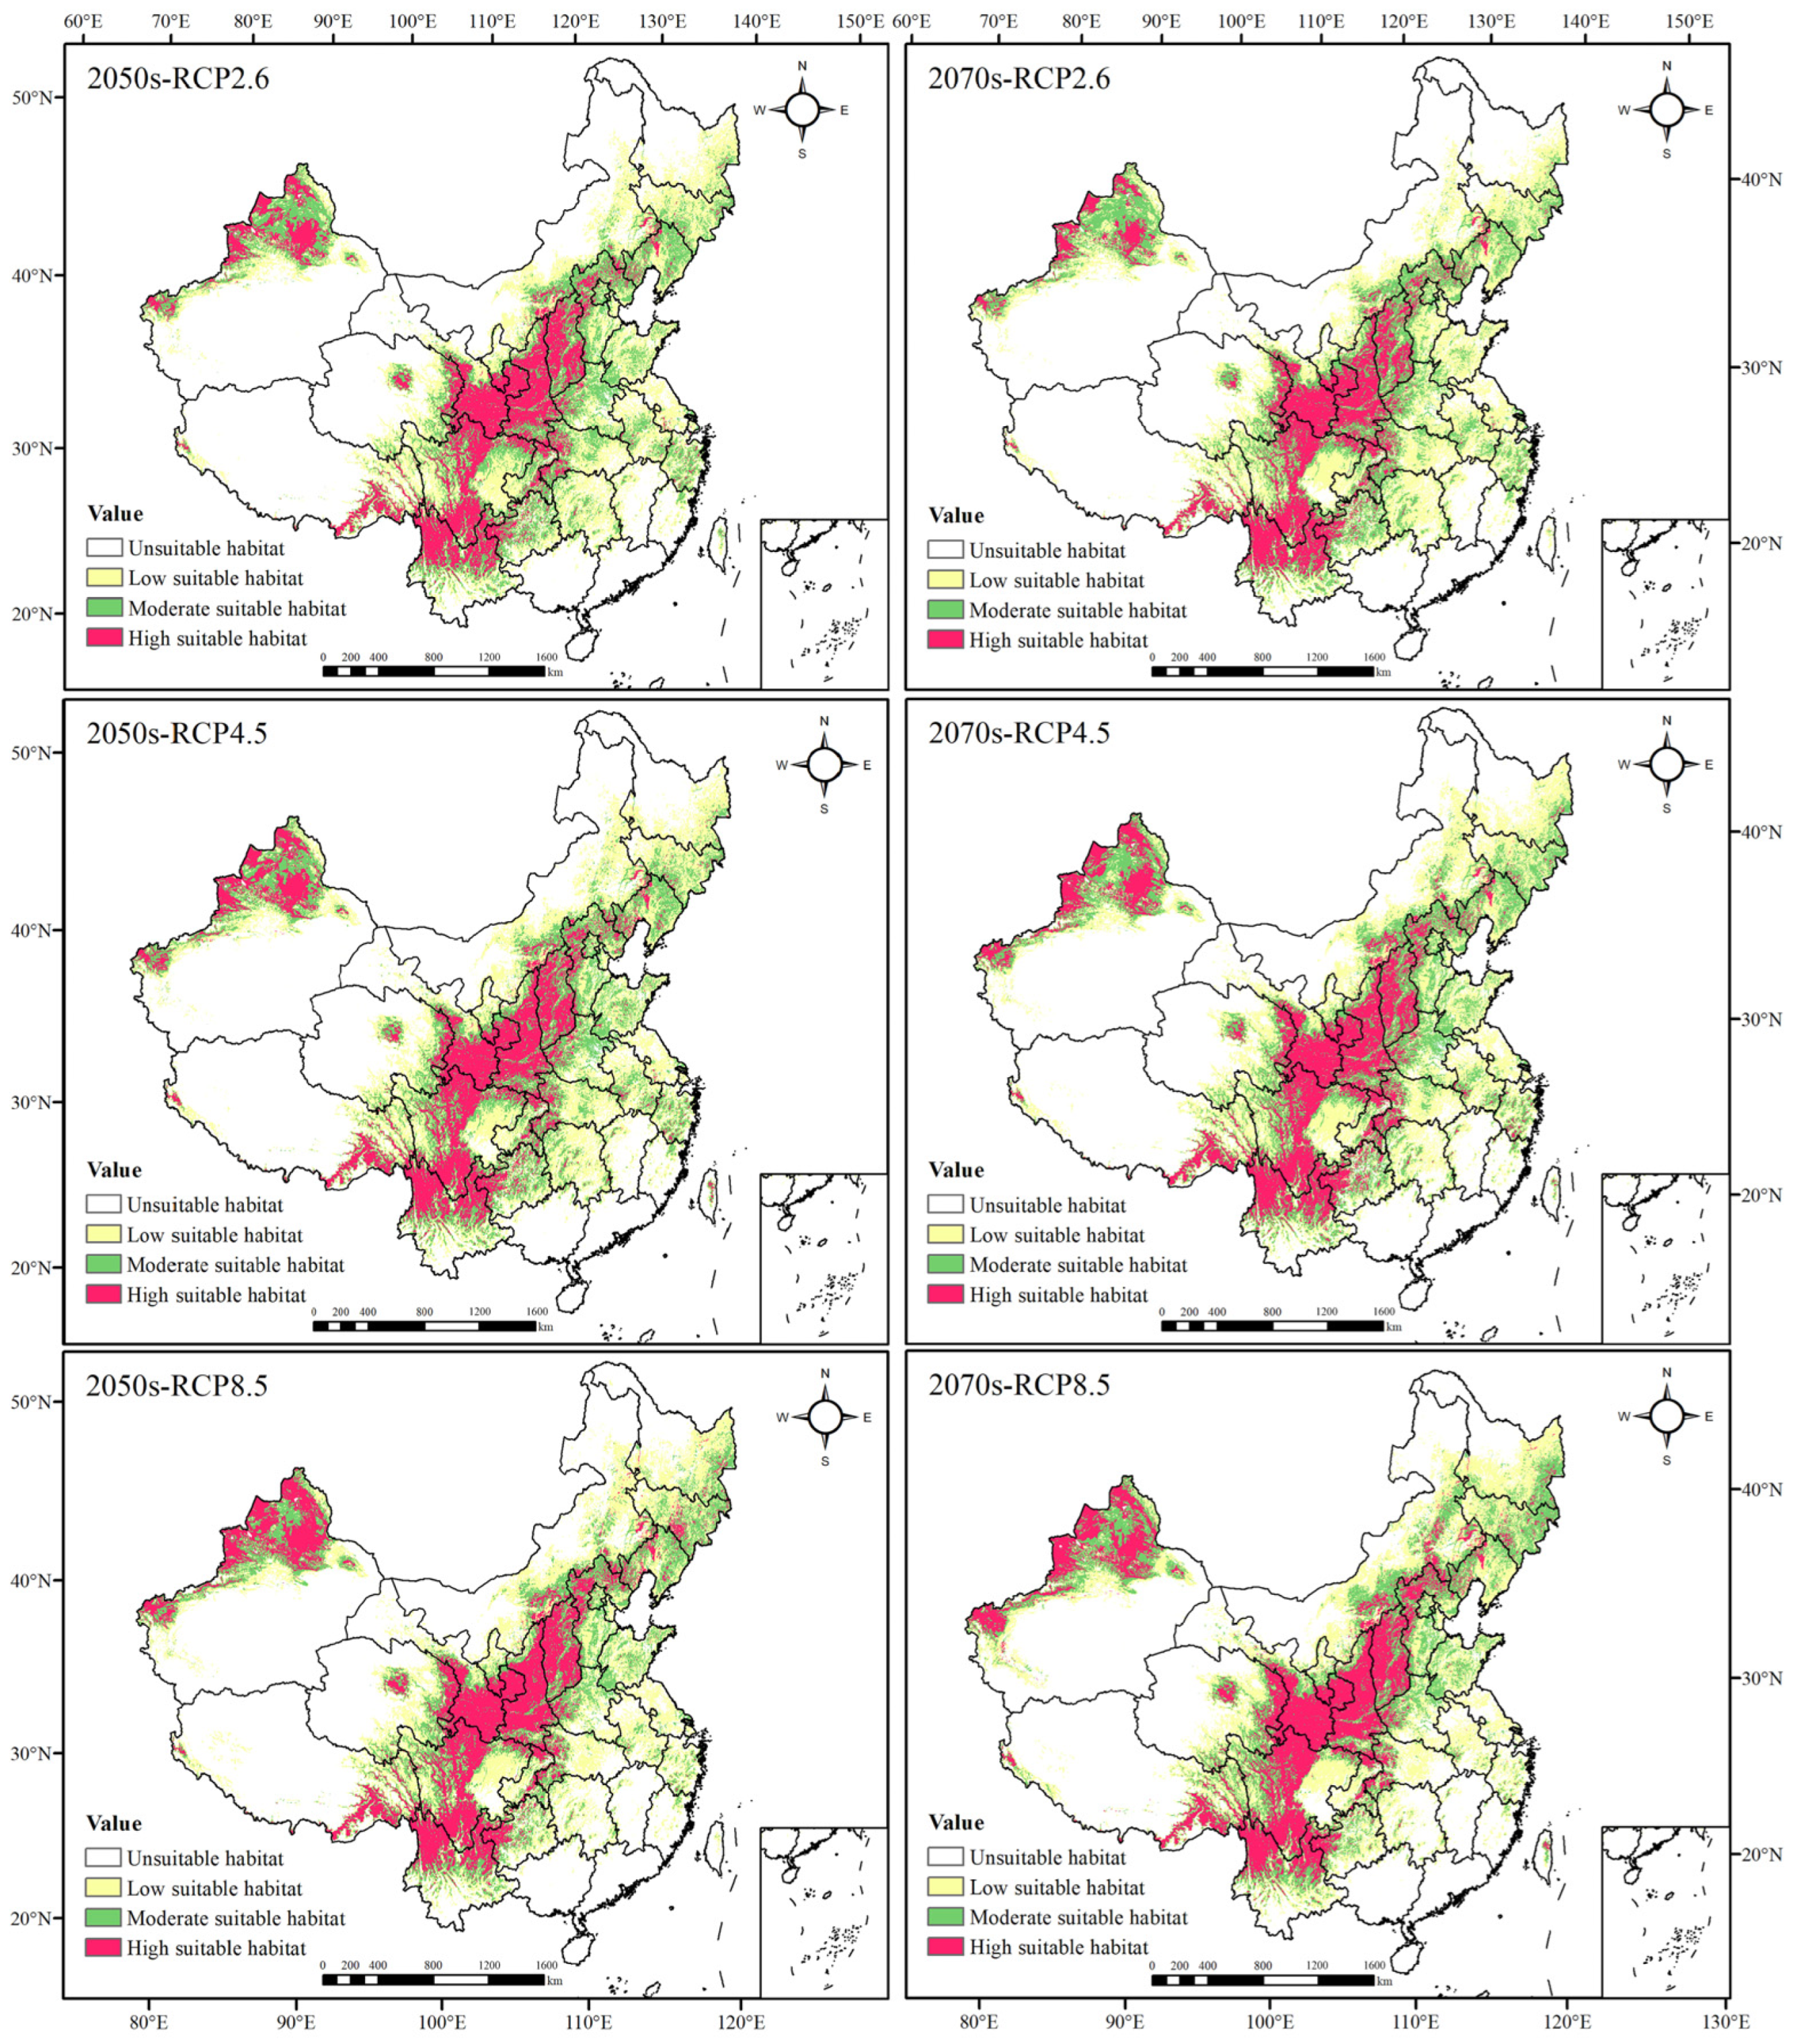
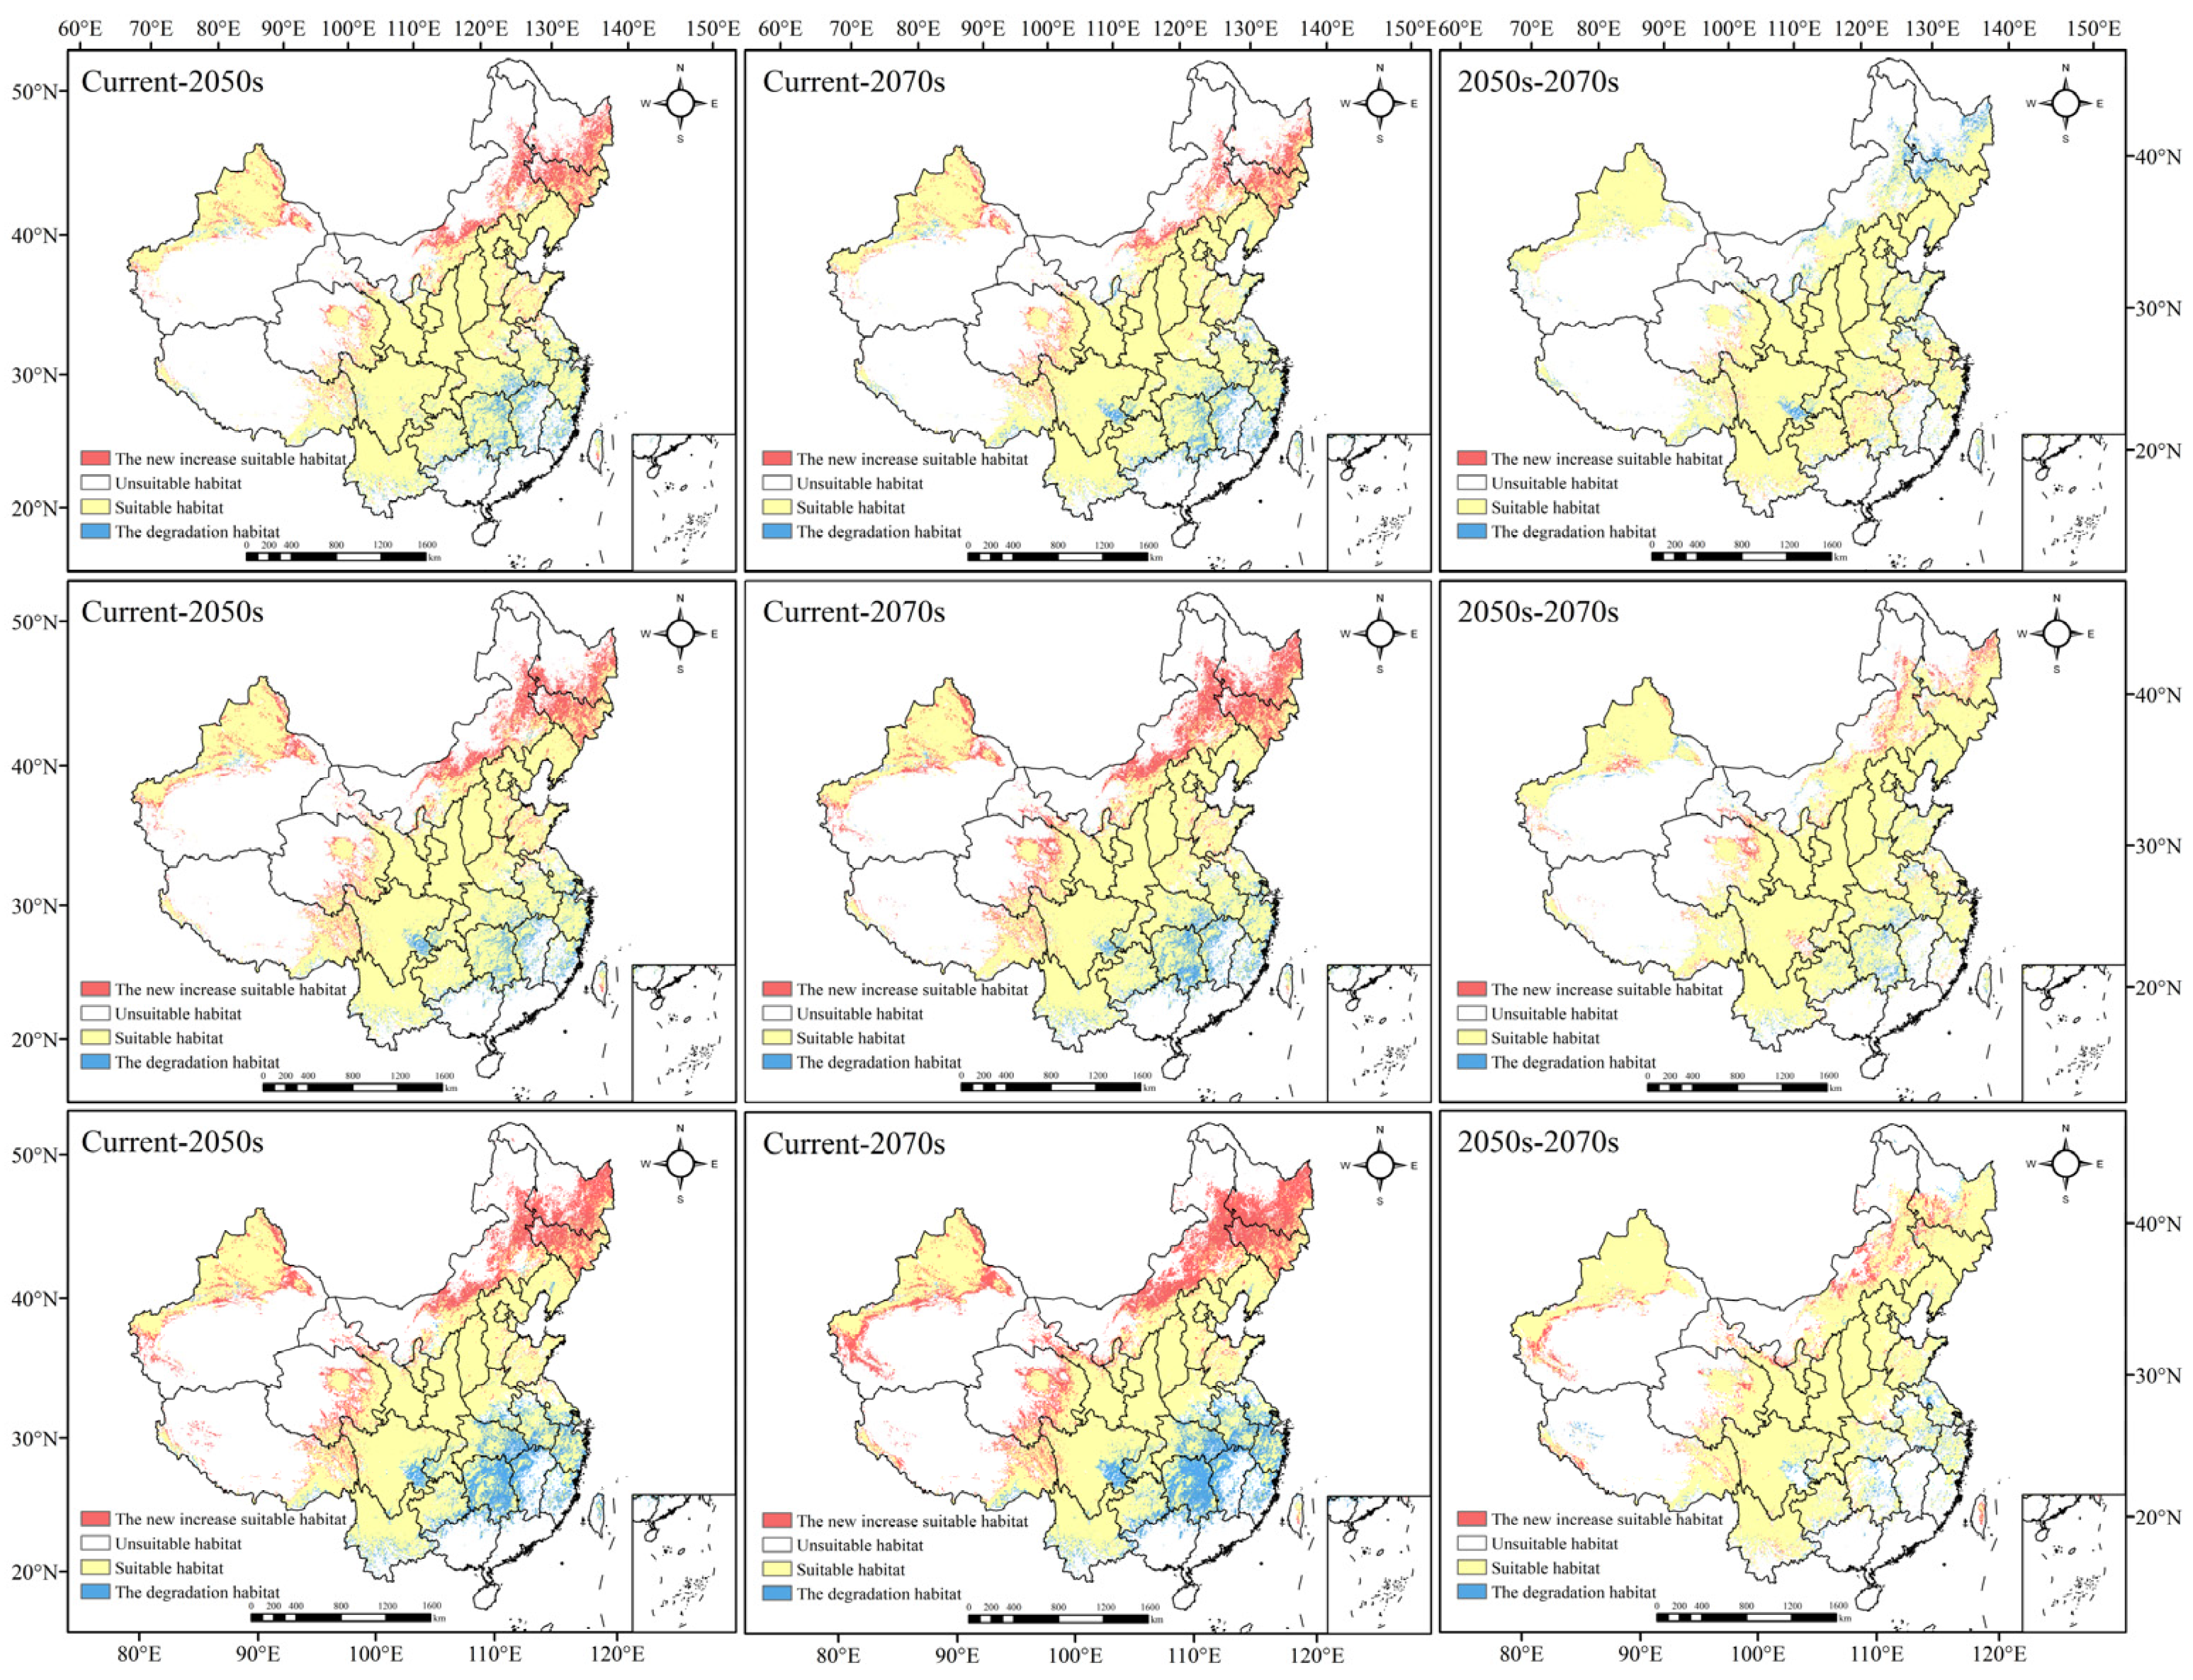
| Abbreviation | Description | Unit |
|---|---|---|
| ASL | Elevation | m |
| ASPE | Aspect | ° |
| awc_class | AWC range | Code |
| Bio1 | Annual mean temperature | °C |
| Bio2 | Mean diurnal range | °C |
| Bio3 | Isothermality (Bio2/Bio7) (×100) | % |
| Bio4 | Temperature seasonality (standard deviation ×100) | °C |
| Bio5 | Max temperature of warmest month | °C |
| Bio6 | Min temperature of coldest month | °C |
| Bio7 | Temperature annual range (Bio5-Bio6) | °C |
| Bio8 | Mean temperature of wettest quarter | °C |
| Bio9 | Mean temperature of driest quarter | °C |
| Bio10 | Mean temperature of warmest quarter | °C |
| Bio11 | Mean temperature of coldest quarter | °C |
| Bio12 | Annual precipitation | mm |
| Bio13 | Precipitation of wettest month | mm |
| Bio14 | Precipitation of driest month | mm |
| Bio15 | Precipitation seasonality | mm |
| Bio16 | Precipitation of wettest quarter | mm |
| Bio17 | Precipitation of driest quarter | mm |
| Bio18 | Precipitation of warmest quarter | mm |
| Bio19 | Precipitation of coldest quarter | mm |
| t_ph_h2o | Topsoil pH (H2O) | −log (H+) |
| t_oc | Topsoil organic carbon | % weight |
| t_cec_soil | Topsoil CEC (soil) | cmol/kg |
| t_clay | Topsoil clay fraction | %wt. |
| t_gravel | Topsoil gravel content | %vol. |
| t_silt | Topsoil silt fraction | %wt. |
| LGM | Mid Holocene | Current | 2050s | 2070s | |||||
|---|---|---|---|---|---|---|---|---|---|
| RCP2.6 | RCP4.5 | RCP8.5 | RCP2.6 | RCP4.5 | RCP8.5 | ||||
| Training data AUC | 0.906 | 0.908 | 0.905 | 0.905 | 0.902 | 0.904 | 0.905 | 0.899 | 0.905 |
| Test data AUC | 0.849 | 0.844 | 0.852 | 0.842 | 0.856 | 0.841 | 0.839 | 0.849 | 0.858 |
| LGM | Mid Holocene | Current | 2050s | 2070s | |||||
|---|---|---|---|---|---|---|---|---|---|
| RCP 2.6 | RCP 4.5 | RCP 8.5 | RCP 2.6 | RCP 4.5 | RCP 8.5 | ||||
| Bio17 | 33.9 | 33.2 | 31.2 | 33.4 | 33.6 | 33.6 | 32.3 | 31.5 | 32.3 |
| ASL | 20.7 | 18.4 | 19.7 | 18.9 | 17.1 | 19.2 | 20.7 | 20.0 | 19.7 |
| Bio11 | 13.7 | 18.1 | 11.6 | 15.3 | 17.0 | 13.5 | 16.2 | 14.2 | 17.5 |
| Bio1 | 7.3 | 10.2 | 8.1 | 7.0 | 9.8 | 8.3 | 7.6 | 8.3 | 10.5 |
| Bio6 | 5.1 | 1.8 | 6.2 | 7.0 | 4.0 | 5.1 | 3.2 | 5.3 | 2.2 |
| Bio12 | 2.5 | 1.7 | 5.4 | 1.9 | 2.1 | 2.0 | 3.4 | 3.7 | 3.2 |
| Bio15 | 2.9 | 2.6 | 3.3 | 2.0 | 2.1 | 2.9 | 3.3 | 2.5 | 3.4 |
| ASPE | 3.1 | 3.0 | 3.2 | 3.4 | 3.5 | 3.0 | 2.8 | 3.4 | 3.0 |
| t_gravel | 2.4 | 2.2 | 2.2 | 1.9 | 2.1 | 2.0 | 2.2 | 2.1 | 1.8 |
| t_ph_h2o | 2.3 | 2.5 | 1.9 | 3.2 | 2.2 | 2.9 | 2.7 | 2.2 | 2.6 |
| awc_class | 1.6 | 0.9 | 1.7 | 1.5 | 1.3 | 1.1 | 1.1 | 1.8 | 1.2 |
| t_cec_soil | 0.9 | 1.0 | 1.3 | 1.1 | 1.2 | 1.2 | 0.7 | 0.7 | 1.4 |
| Bio4 | 1.0 | 1.8 | 1.3 | 1.0 | 1.2 | 1.6 | 1.4 | 1.7 | 1.1 |
| t_clay | 0.7 | 0.9 | 0.9 | 0.7 | 0.9 | 0.9 | 0.7 | 0.8 | 0.9 |
| t_silt | 0.8 | 0.9 | 0.8 | 0.9 | 1.0 | 1.3 | 0.6 | 0.9 | 1.2 |
| Bio3 | 0.8 | 0.5 | 0.7 | 0.7 | 0.5 | 1.1 | 0.6 | 0.6 | 0.7 |
| t_oc | 0.1 | 0.2 | 0.3 | 0.2 | 0.2 | 0.1 | 0.1 | 0.1 | 0.1 |
| Bio2 | 0.1 | 0.2 | 0.1 | 0.2 | 0.2 | 0.2 | 0.1 | 0.3 | 0.2 |
| Area of Each Suitable Habitat (The Change in Area Compared with Current, 104 km2) | |||||
|---|---|---|---|---|---|
| Period | Low Suitable Habitat | Moderate Suitable Habitat | High Suitable Habitat | Total Suitable Habitat | |
| LGM | 136.3351 (−46.7500) | 111.2656 (−23.8021) | 39.1337 (−48.5330) | 286.7344 (−119.0851) | |
| Mid Holocene | 162.0469 (−21.0382) | 134.5938 (−0.4793) | 92.0747 (+4.4080) | 388.7154 (−17.1041) | |
| Current | 183.0851 (0.00) | 135.0677 (0.00) | 87.6667 (0.00) | 405.8195 (0.00) | |
| 2050s | RCP2.6 | 195.4167 (+12.3316) | 135.4514 (+0.3837) | 112.1997 (+24.5330) | 443.0678 (+37.2483) |
| RCP4.5 | 198.1111 (+15.0260) | 135.0417 (−0.0260) | 120.0156 (+32.3489) | 453.1684 (+47.3489) | |
| RCP8.5 | 191.5990 (+8.5139) | 123.6476 (11.4201) | 135.5119 (+47.8452) | 450.7585 (+44.9390) | |
| 2070s | RCP2.6 | 197.7118 (+14.6267) | 128.5017 (−6.5660) | 99.7847 (+12.1180) | 425.9982 (+20.1787) |
| RCP4.5 | 200.8351 (+17.7500) | 137.6337 (+2.5660) | 125.2517 (+37.5850) | 463.7205 (+57.9010) | |
| RCP8.5 | 196.1979 (+13.1128) | 133.2396 (−1.8281) | 140.7188 (+53.0521) | 470.1563 (+64.3368) | |
| Area of Each Suitable Habitat (The Change in Area Compared with Current, %) | |||||
|---|---|---|---|---|---|
| Period | Low Suitable Habitat | Moderate Suitable Habitat | High Suitable Habitat | Total Suitable Habitat | |
| LGM | 14.22 (−4.88) | 11.61 (−2.48) | 4.08 (−5.07) | 29.91 (−12.43) | |
| Mid Holocene | 16.90 (−2.20) | 14.04 (−0.05) | 9.61 (+0.46) | 40.55 (−1.79) | |
| Current | 19.10 (0.00) | 14.09 (0.00) | 9.15 (0.00) | 42.34 (0.00) | |
| 2050s | RCP2.6 | 20.39 (+1.29) | 14.13 (+0.04) | 11.70 (+2.55) | 46.22 (+3.88) |
| RCP4.5 | 20.67 (+1.57) | 14.08 (−0.01) | 12.52 (+3.37) | 47.27 (+4.93) | |
| RCP8.5 | 19.99 (+0.89) | 12.90 (−1.19) | 14.14 (+4.99) | 47.03 (+4.69) | |
| 2070s | RCP2.6 | 20.62 (+1.52) | 13.41 (−0.68) | 10.41 (+1.26) | 44.44 (+2.10) |
| RCP4.5 | 20.95 (+1.85) | 14.36 (+0.27) | 13.07 (+3.92) | 48.38 (+6.04) | |
| RCP8.5 | 20.47 (+1.37) | 13.90 (−0.19) | 14.68 (+5.53) | 49.05 (+6.71) | |
Publisher’s Note: MDPI stays neutral with regard to jurisdictional claims in published maps and institutional affiliations. |
© 2022 by the authors. Licensee MDPI, Basel, Switzerland. This article is an open access article distributed under the terms and conditions of the Creative Commons Attribution (CC BY) license (https://creativecommons.org/licenses/by/4.0/).
Share and Cite
Cao, Y.-T.; Lu, Z.-P.; Gao, X.-Y.; Liu, M.-L.; Sa, W.; Liang, J.; Wang, L.; Yin, W.; Shang, Q.-H.; Li, Z.-H. Maximum Entropy Modeling the Distribution Area of Morchella Dill. ex Pers. Species in China under Changing Climate. Biology 2022, 11, 1027. https://doi.org/10.3390/biology11071027
Cao Y-T, Lu Z-P, Gao X-Y, Liu M-L, Sa W, Liang J, Wang L, Yin W, Shang Q-H, Li Z-H. Maximum Entropy Modeling the Distribution Area of Morchella Dill. ex Pers. Species in China under Changing Climate. Biology. 2022; 11(7):1027. https://doi.org/10.3390/biology11071027
Chicago/Turabian StyleCao, Yu-Ting, Zhao-Ping Lu, Xin-Yu Gao, Mi-Li Liu, Wei Sa, Jian Liang, Le Wang, Wei Yin, Qian-Han Shang, and Zhong-Hu Li. 2022. "Maximum Entropy Modeling the Distribution Area of Morchella Dill. ex Pers. Species in China under Changing Climate" Biology 11, no. 7: 1027. https://doi.org/10.3390/biology11071027
APA StyleCao, Y.-T., Lu, Z.-P., Gao, X.-Y., Liu, M.-L., Sa, W., Liang, J., Wang, L., Yin, W., Shang, Q.-H., & Li, Z.-H. (2022). Maximum Entropy Modeling the Distribution Area of Morchella Dill. ex Pers. Species in China under Changing Climate. Biology, 11(7), 1027. https://doi.org/10.3390/biology11071027


