
Mediterranean Spur-Thighed Tortoises (Testudo graeca) Have Optimal Speeds at Which They Can Minimise the Metabolic Cost of Transport, on a Treadmill


Abstract
:Simple Summary
Abstract
1. Introduction
2. Materials and Methods
2.1. Study Species and Husbandry
2.2. Experimental Protocol
2.3. Respirometry
2.4. Kinematics
2.5. Statistical Analyses
3. Results
Energetics and Kinematics of Locomotion
4. Discussion
5. Conclusions
Supplementary Materials
Author Contributions
Funding
Institutional Review Board Statement
Data Availability Statement
Acknowledgments
Conflicts of Interest
References
- Joyce, W.G.; Gauthier, J.A. Paleoecology of Triassic stem turtles sheds new light on turtle origins. Proc Roy. Soc. B. 2004, 271, 1–5. [Google Scholar] [CrossRef] [Green Version]
- Li, C.; Wu, X.-C.; Rieppel, O.; Wang, L.-T.; Zhao, L.-J. An ancestral turtle from the Late Triassic of southwestern China. Nature 2008, 465, 497–501. [Google Scholar] [CrossRef] [PubMed]
- Lyson, T.R.; Schachner, E.R.; Botha-Brink, J.; Scheyer, T.M.; Lambertz, M.; Bever, G.S.; Rubidge, B.S.; de Queiroz, K. Origin of the unique ventilatory apparatus of turtles. Nat. Commun. 2014, 5, 5211. [Google Scholar] [CrossRef] [PubMed] [Green Version]
- Gillis, G.B.; Blob, R.W. How muscles accommodate movement in different physical environments: Aquatic vs. terrestrial locomotion in vertebrates. Comp. Biochem. Physiol. 2001, 131, 61–75. [Google Scholar] [CrossRef]
- Cavagna, G.A.; Kaneko, M. Mechanical work and efficiency in level walking and running. J. Physiol. 1977, 268, 467–481. [Google Scholar] [CrossRef]
- Alexander, R.M. Principles of Animal Locomotion; Princeton University Press: Princeton, NJ, USA, 2003. [Google Scholar]
- Alexander, R.M. Gaits of Mammals and Turtles. J. Roy. Soc. Jap. 1993, 11, 314–319. [Google Scholar] [CrossRef] [Green Version]
- Jayes, A.S.; Alexander, R.M. The gaits of chelonians: Walking techniques for very low speeds. J. Zool. 1980, 191, 353–378. [Google Scholar] [CrossRef]
- Woledge, R.C. The energetics of tortoise muscle. J. Physiol. 1968, 197, 685–707. [Google Scholar] [CrossRef]
- Baudinette, R.V.; Miller, A.M.; Sarre, M.P. Aquatic and Terrestrial Locomotory Energetics in a Toad and a Turtle: A Search for Generalisations among Ectotherms. Physiol. Biochem. Zool. 2000, 73, 672–682. [Google Scholar] [CrossRef]
- Zani, P.A.; Kram, R. Low metabolic cost of locomotion in ornate box turtles, Terrapene ornata. J. Exp. Biol. 2008, 211, 3671–3676. [Google Scholar] [CrossRef] [Green Version]
- Ewart, H.E.; Tickle, P.G.; Sellers, W.I.; Lambertz, M.; Crossley, N.D.A.; Codd, J.R. The metabolic cost of turning right side up in the Mediterranean spur-thighed tortoise (Testudo graeca). Sci. Rep. 2022, 12, 431. [Google Scholar] [CrossRef] [PubMed]
- Tucker, V.A. Energetic cost of locomotion in animals. Comp. Biochem. Physiol. 1970, 34, 841–846. [Google Scholar] [CrossRef]
- Nudds, R.L.; Codd, J.R.; Sellers, W.I. Evidence for a mass dependent step-change in the scaling of efficiency in terrestrial locomotion. PLoS ONE 2009, 4, e6927. [Google Scholar] [CrossRef] [PubMed] [Green Version]
- Shepard, E.; Wilson, R.; Rees, W.G.; Edward, G.; Sergio, A.L.; Simon, B.V.; Associate Editor: Robert, D.; Editor: Judith, L.B. Energy Landscapes Shape Animal Movement Ecology. Am. Nat. 2013, 182, 298–312. [Google Scholar] [CrossRef] [PubMed] [Green Version]
- Mosser, A.; Avgar, T.; Brown, G.; Walker, C.; Fryxell, J. Towards an energetic landscape: Broad-scale accelerometry in woodland caribou. J. Anim. Ecol. 2014, 83, 916–922. [Google Scholar] [CrossRef] [Green Version]
- Masello, J.F.; Kato, A.; Sommerfeld, J.; Mattern, T.; Quillfeldt, P. How animals distribute themselves in space: Variable energy landscapes. Front. Zool. 2017, 14, 33. [Google Scholar] [CrossRef] [Green Version]
- Wilson, R.; Flavio, Q.; Victoria, J.H. Construction of energy landscapes can clarify the movement and distribution of foraging animals. Proc. R. Soc. B Biol. Sci. 2012, 279, 975–980. [Google Scholar] [CrossRef]
- Wall, J.; Douglas-Hamilton, I.; Vollrath, F. Elephants avoid costly mountaineering. Curr. Biol. 2006, 16, R527–R529. [Google Scholar] [CrossRef] [Green Version]
- Brownscombe, J.W.; Gutowsky, L.F.G.; Danylchuk, A.J.; Cooke, S.J. Foraging behaviour and activity of a marine benthivorous fish estimated using tri-axial accelerometer biologgers. Mar. Ecol. Prog. Ser. 2014, 505, 241–251. [Google Scholar] [CrossRef] [Green Version]
- Amélineau, F.; Fort, J.; Mathewson, P.D.; Speirs, D.C.; Courbin, N.; Perret, S.; Porter, W.P.; Wilson, R.J.; Grémillet, D. Energyscapes and prey fields shape a North Atlantic seabird wintering hotspot under climate change. R. Soc. Open Sci. 2018, 5, 171883. [Google Scholar] [CrossRef] [Green Version]
- Marmol-Guijarro, A.C.; Nudds, R.L.; Marrin, J.C.; Folkow, L.P.; Codd, J.R. Terrestrial locomotion of the Svalbard rock ptarmigan: Comparing field and laboratory treadmill studies. Sci. Rep. 2019, 9, 11451–11459. [Google Scholar] [CrossRef] [PubMed]
- Lambert, M.R.K. Temperature, activity and field sighting in the mediterranean spur-thighed or common garden tortoise Testudo graeca L. Biol. Conserv. 1981, 21, 39–54. [Google Scholar] [CrossRef]
- Tracy, C.R.; Zimmerman, L.C.; Tracy, C.; Bradley, K.D.; Castle, K. Rates of Food Passage in the Digestive Tract of Young Desert Tortoises: Effects of Body Size and Diet Quality. Chelonian Conserv. Biol. 2006, 5, 269–273. [Google Scholar] [CrossRef]
- Lailvaux, S.P. Interactive effects of sex and temperature on locomotion in reptiles. Int. Comp. Biol. 2007, 47, 189–199. [Google Scholar] [CrossRef]
- Lighton, J.R. Measuring Metabolic Rates: A Manual for Scientists; Oxford University Press: Oxford, UK, 2008. [Google Scholar]
- Brody, S. Bioenergetics and Growth, with Special Reference to the Efficiency Complex in Domestic Animals; Reinhold: New York, NY, USA, 1945. [Google Scholar]
- Usherwood, J.R.; Self Davies, Z.T. Work minimization accounts for footfall phasing in slow quadrupedal gaits. eLife 2017, 6, e29495. [Google Scholar] [CrossRef]
- Alexander, R.M. Optimization of structure and movement of the legs of animals. J. Biomech. 1993, 26, 1–6. [Google Scholar] [CrossRef]
- Full, R.J. Mechanics and energetics of terrestrial locomotion: Bipeds to polypeds. In Energy Transformations in Cells and Organisms; Gnaiger, W.W.A.E., Ed.; Georg Thieme Verlag: Stuttgart, Germany, 1989; pp. 175–182. [Google Scholar]
- Hoyt, D.F.; Taylor, C.R. Gait and the energetics of locomotion in horses. Nature 1981, 292, 239–240. [Google Scholar] [CrossRef]
- Maloiy, G.M.O.; Rugangazi, B.M.; Rowe, M.F. Energy expenditure during level locomotion in large desert ungulates: The one-humped camel and the domestic donkey. J. Zool. 2009, 277, 248–255. [Google Scholar] [CrossRef]
- Margaria, R. Sulla fisiologia e specialmente sul consumo energetico della marcia e della corsa a varie velocita ed inclinazioni del terreno. Atti Accad. Naz. Lincei Memorie 1938, VI, 299–368. [Google Scholar]
- Margaria, R.; Cerretelli, P.; Aghemo, P.; Sassi, G. Energy cost of running. J. Appl. Physiol. 1963, 18, 367–370. [Google Scholar] [CrossRef]
- Watson, R.R.; Rubenson, J.; Coder, L.; Hoyt, D.F.; Propert, M.W.G.; Marsh, R.L. Gait-specific energetics contributes to economical walking and running in emus and ostriches. Proc. R. Soc. B Biol. Sci. 2011, 278, 2040–2046. [Google Scholar] [CrossRef] [PubMed] [Green Version]
- Nudds, R.L.; Gardiner, J.D.; Tickle, P.G.; Codd, J.R. Energetics and kinematics of walking in the barnacle goose (Branta leucopsis). Comp. Ciochem. Physiol. Part A Mol. Integr. Physiol. 2010, 156, 318–324. [Google Scholar] [CrossRef]
- Nudds, R.L.; Folkow, L.P.; Lees, J.J.; Tickle, P.G.; Stokkan, K.A.; Codd, J.R. Evidence for energy savings from aerial running in the Svalbard rock ptarmigan (Lagopus muta hyperborea). Proc. R. Soc. B Biol. Sci. 2011, 278, 2654–2661. [Google Scholar] [CrossRef] [PubMed] [Green Version]
- Sears, M.W.; Riddell, E.A.; Rusch, T.W.; Angilletta, M.J. The World Still Is Not Flat: Lessons Learned from Organismal Interactions with Environmental Heterogeneity in Terrestrial Environments. Int. Comp. Biol. 2019, 59, 1049–1058. [Google Scholar] [CrossRef] [PubMed] [Green Version]
- Anadón, J.D.; Giménez, A.; Martínez, M.; Martínez, J.; Pérez, I.; Esteve, M.A. Factors determining the distribution of the spur-thighed tortoise Testudo graeca in south-east spain: A hierarchical approach. Ecography 2006, 29, 339–346. [Google Scholar] [CrossRef]
- White, C.R.; Portugal, S.J.; Martin, G.R.; Butler, P.J. Respirometry: Anhydrous Drierite Equilibrates with Carbon Dioxide and Increases Washout Times. Physiol. Biochem. Zool. 2006, 79, 977–980. [Google Scholar] [CrossRef] [PubMed] [Green Version]
- Schmidt, M.; Mehlhorn, M.; Fischer, M.S. Shoulder girdle rotation, forelimb movement and the influence of carapace shape on locomotion in Testudo hermanni (Testudinidae). J. Exp. Biol. 2016, 219, 2693–2703. [Google Scholar] [CrossRef] [Green Version]
- Hildebrand, M. Analysis of Asymmetrical Gaits. J. Mammal. 1977, 58, 131–156. [Google Scholar] [CrossRef]
- Gray, J. Studies in the mechanics of the tetrapod skeleton. J. Exp. Biol. 1944, 20, 88–116. [Google Scholar] [CrossRef]
- McGhee, R.B.; Frank, A.A. On the stability properties of quadruped creeping gaits. Math. Biosci. 1968, 3, 331–351. [Google Scholar] [CrossRef]

| Dependent Variable | Equation Describing Line of Best Fit | Independent Variable | |
|---|---|---|---|
| Speed (U) | Body Mass | ||
| Energetics | |||
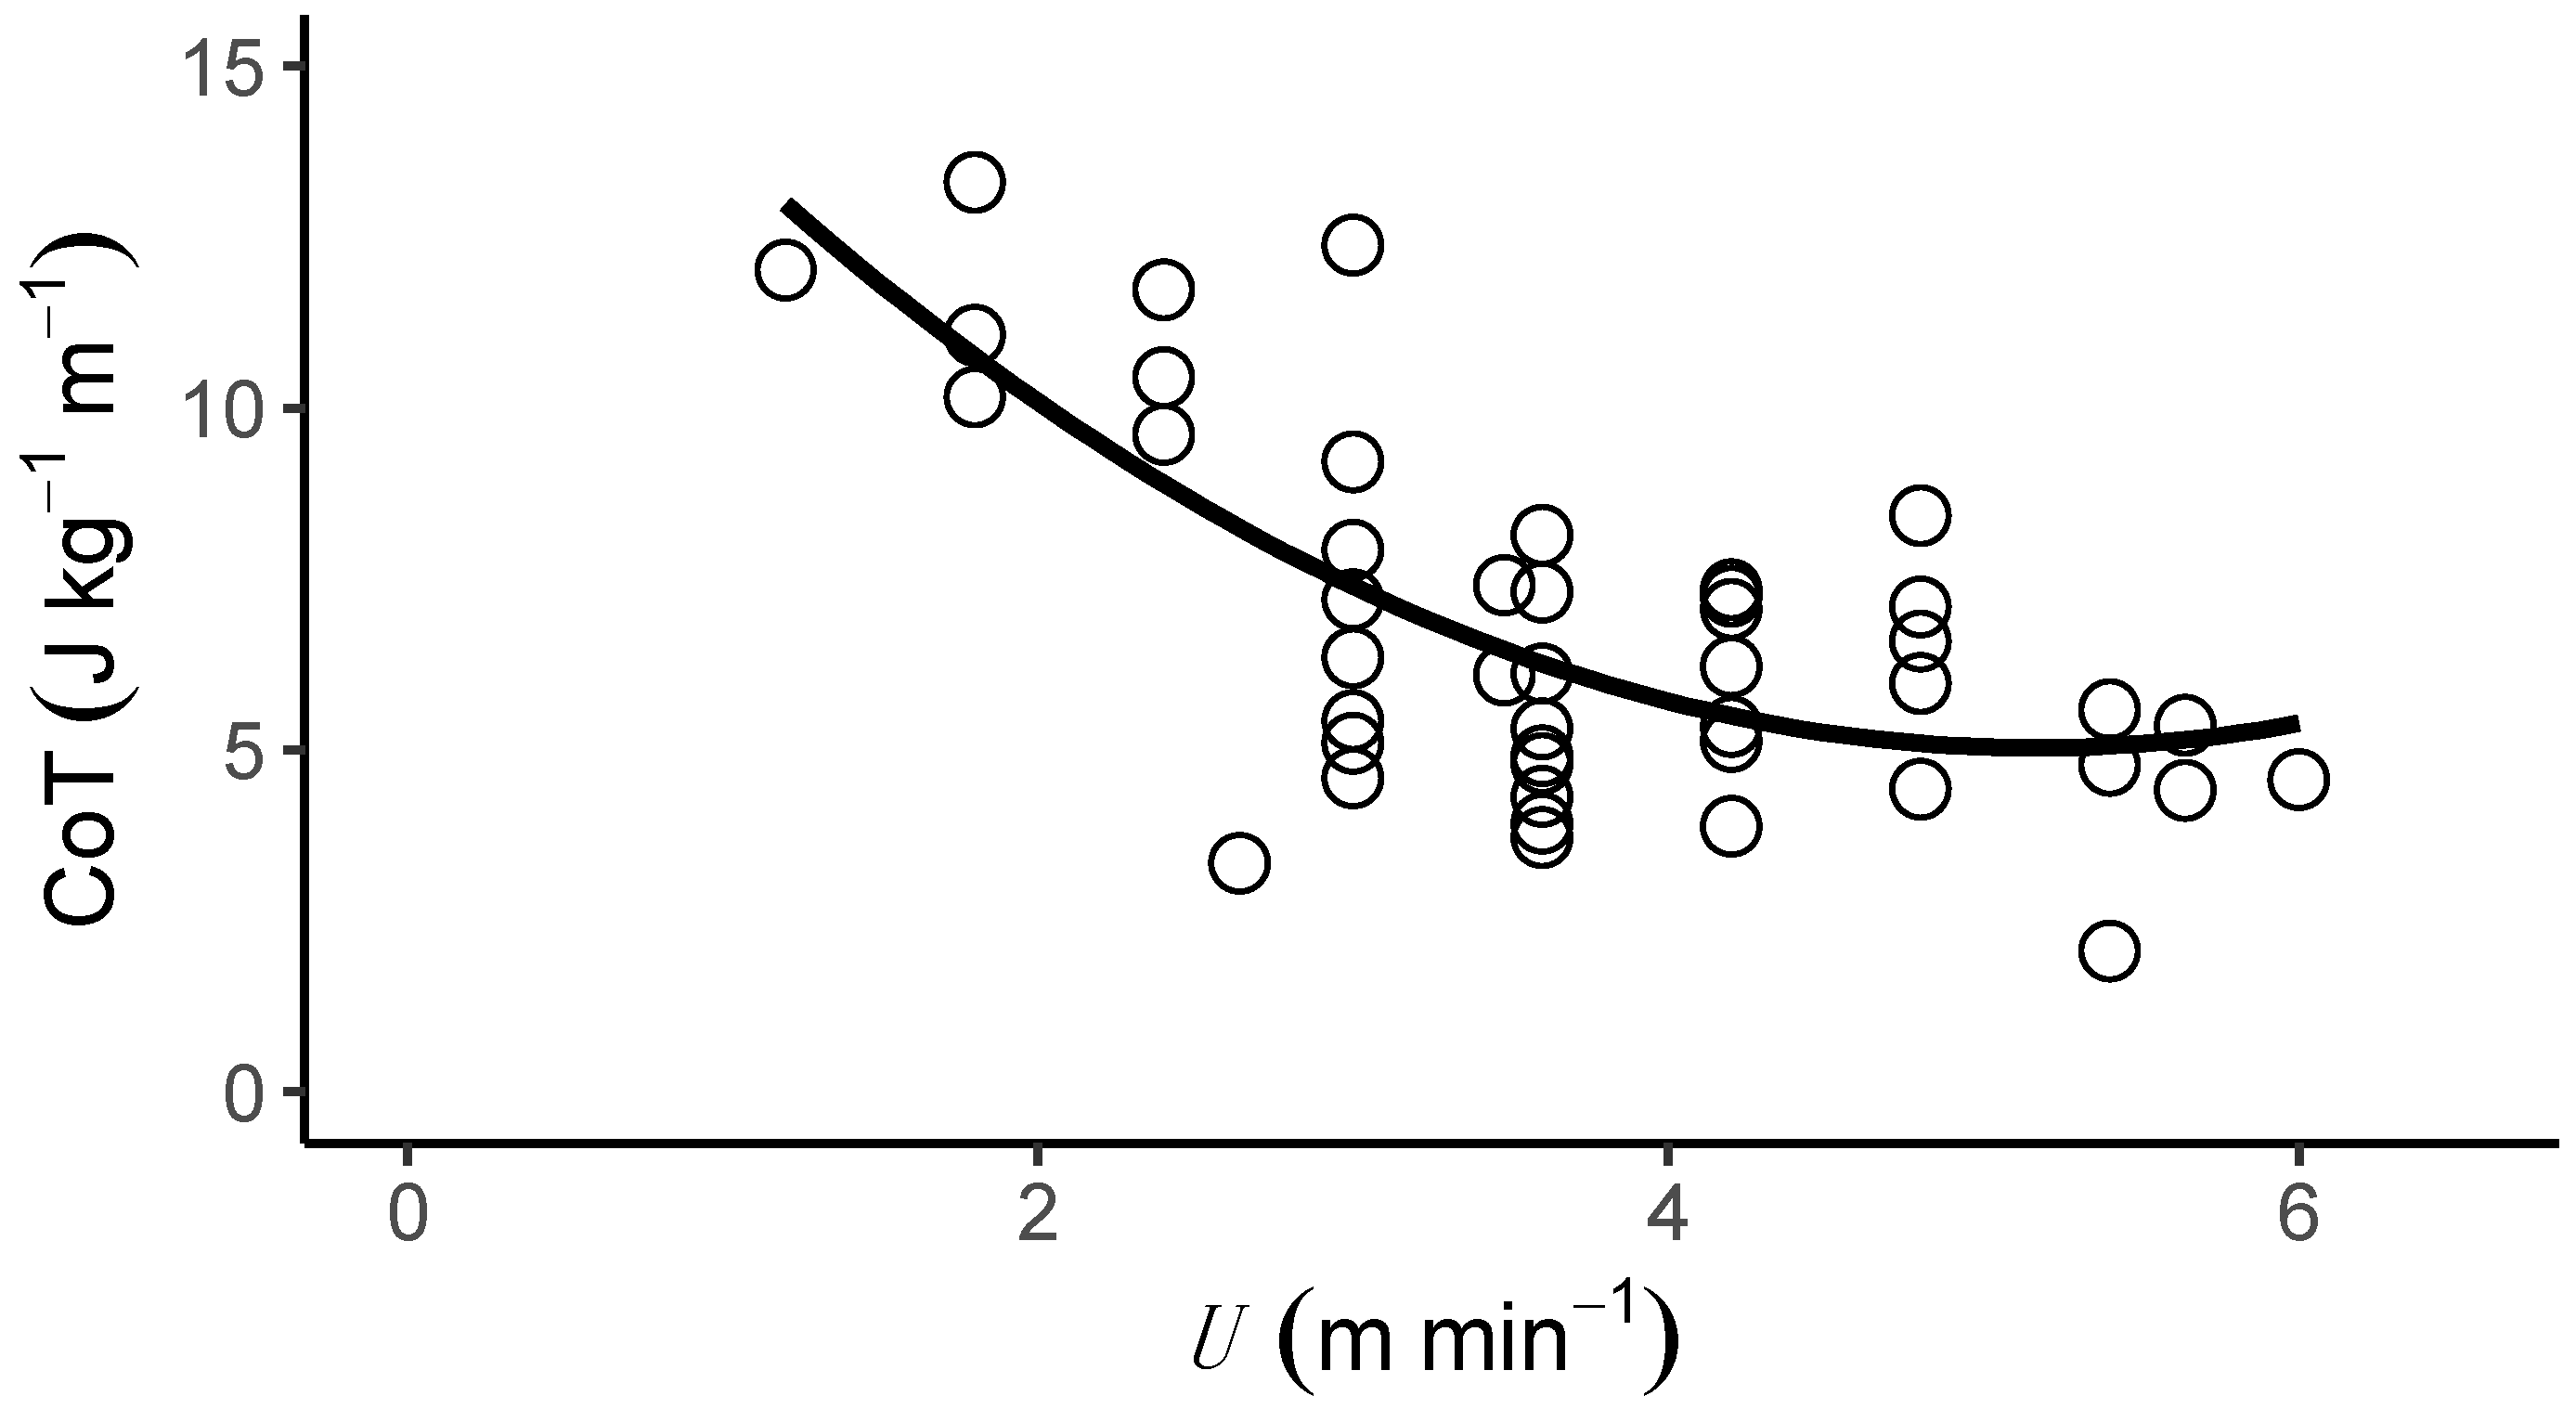
| CoT | y = −5.23x2 + 0.51x + 18.533 | F2,42 = 19.89 r2 = 0.462 p < 0.001 | |
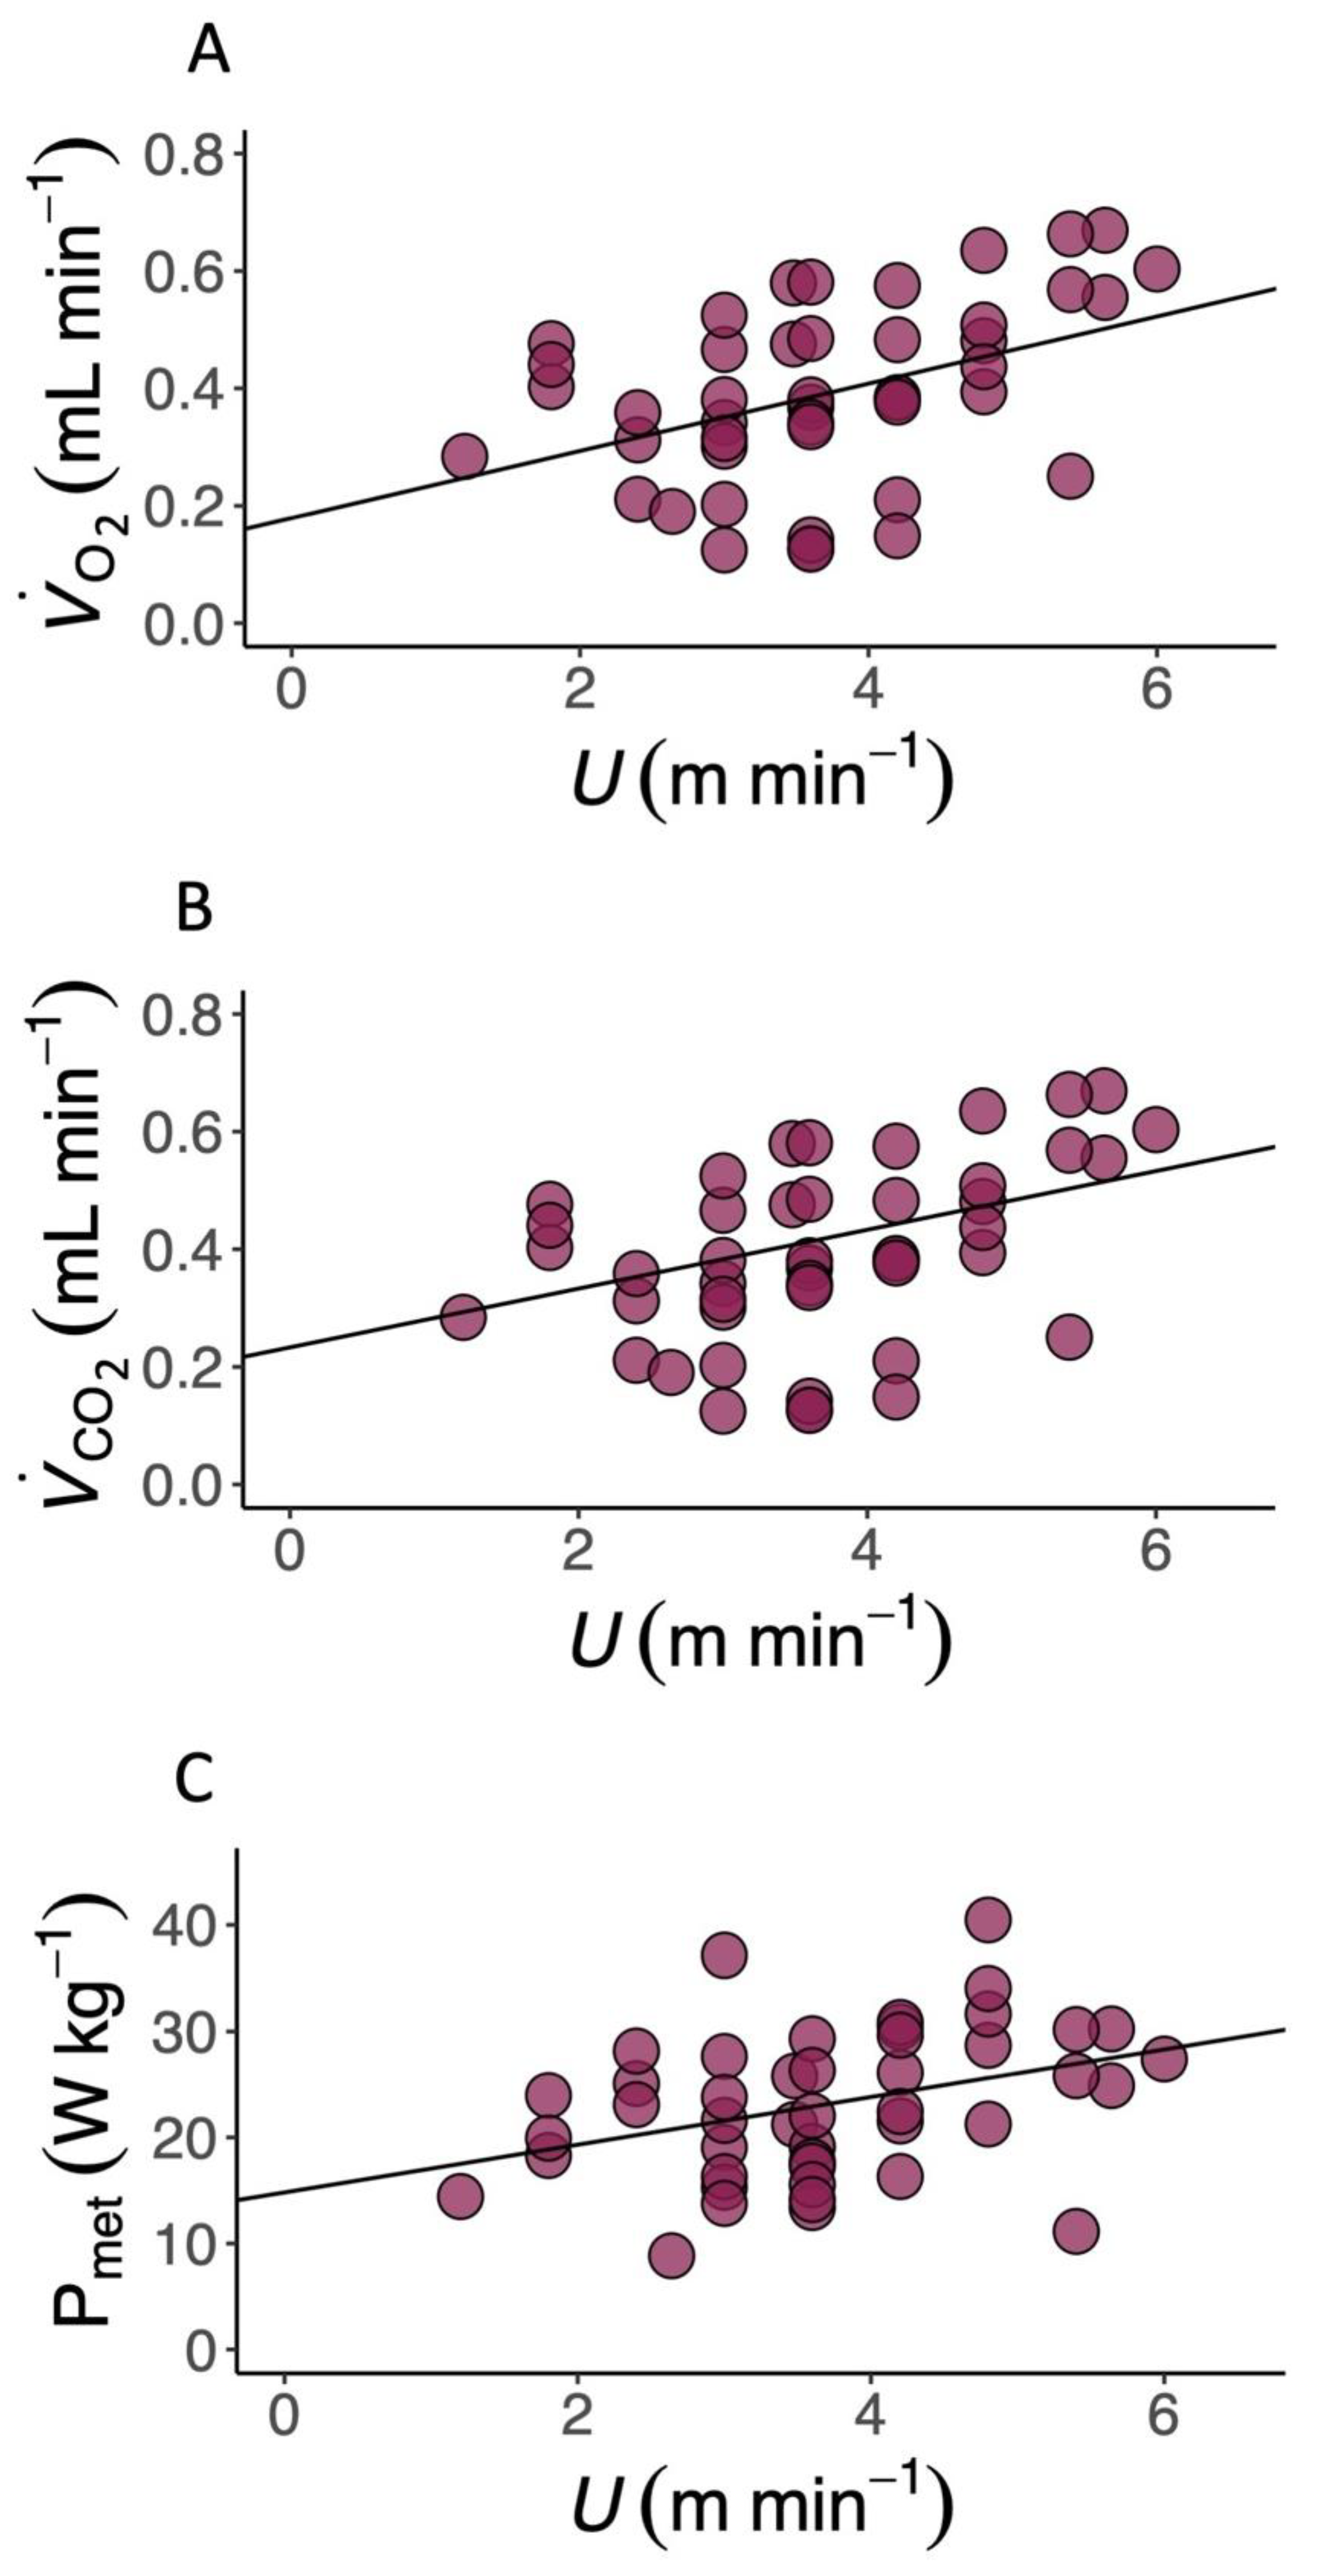
| y = 0.06x + 0.179 | F1,43 = 9.41 r2 = 0.160 p = 0.004 | F1,42 = 37.05 r2 = 0.412 p < 0.001 | |
| y = 0.05x + 0.233 | F1,43 = 5.95 r2 = 0.101 p = 0.019 | F1,42 = 39.38 r2 = 0.450 p < 0.001 | |
| Pmet | y = 2.25x + 14.81 | F1,43 = 6.58 r2 = 0.113 p = 0.014 | |
| RER | y = −0.02x + 1.154 | F1,43 = 1.78 r2 = 0.017 p = 0.190 | F1,42 = 1.15 r2 = 0.025 p = 0.290 |
| Kinematics | |||
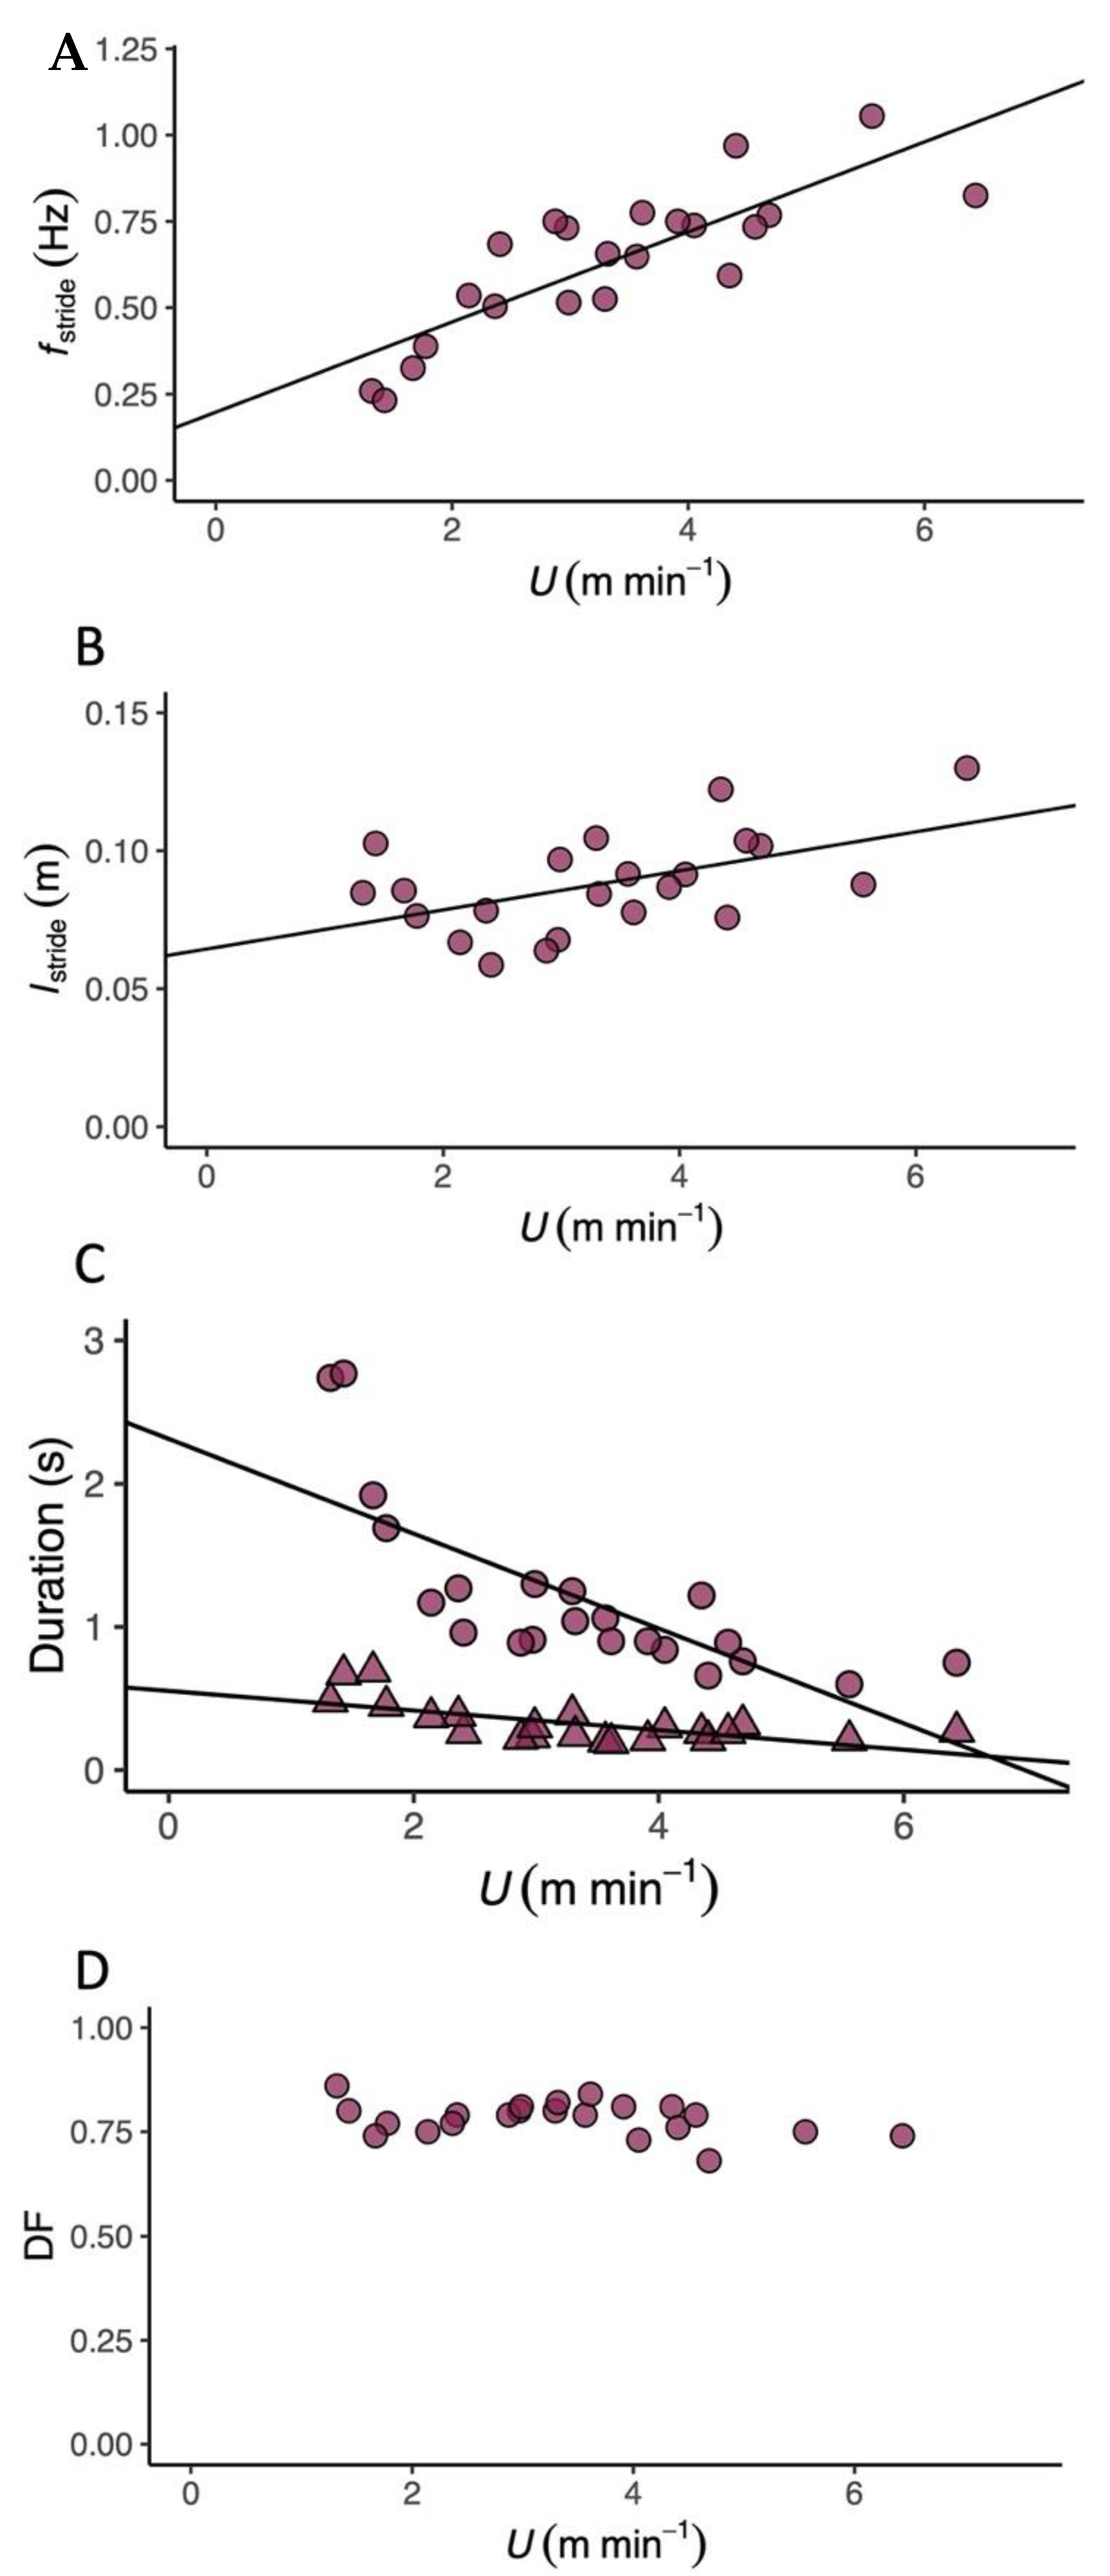
| fstride | y = 0.13x + 0.198 | F1,20 = 43.12 r2 = 0.667 p < 0.001 | F1,19 = 31.60 r2 = 0.195 p < 0.001 |
| lstride | y = 0.007x + 0.064 | F1,20 = 7.70 r2 = 0.242 p = 0.012 | F1,19 = 29.43 r2 = 0.444 p < 0.001 |
| tswing | y = −0.07x + 0.553 | F1,20 = 14.65 r2 = 0.394 p = 0.001 | F1,19 = 16.07 r2 = 0.261 p < 0.001 |
| tstance | y = −0.33x + 2.314 | F1,20 = 25.64 r2 = 0.540 p < 0.001 | F1,19 = 10.11 r2 = 0.151 p = 0.005 |
| DF | y = −0.01x + 0.818 | F1,20 = 3.02 r2 = 0.088 p = 0.098 | F1,19 = 0.90 r2 = 0.039 p = 0.355 |
Publisher’s Note: MDPI stays neutral with regard to jurisdictional claims in published maps and institutional affiliations. |
© 2022 by the authors. Licensee MDPI, Basel, Switzerland. This article is an open access article distributed under the terms and conditions of the Creative Commons Attribution (CC BY) license (https://creativecommons.org/licenses/by/4.0/).
Share and Cite
Ewart, H.; Tickle, P.; Nudds, R.; Sellers, W.; Crossley, D., II; Codd, J. Mediterranean Spur-Thighed Tortoises (Testudo graeca) Have Optimal Speeds at Which They Can Minimise the Metabolic Cost of Transport, on a Treadmill. Biology 2022, 11, 1052. https://doi.org/10.3390/biology11071052
Ewart H, Tickle P, Nudds R, Sellers W, Crossley D II, Codd J. Mediterranean Spur-Thighed Tortoises (Testudo graeca) Have Optimal Speeds at Which They Can Minimise the Metabolic Cost of Transport, on a Treadmill. Biology. 2022; 11(7):1052. https://doi.org/10.3390/biology11071052
Chicago/Turabian StyleEwart, Heather, Peter Tickle, Robert Nudds, William Sellers, Dane Crossley, II, and Jonathan Codd. 2022. "Mediterranean Spur-Thighed Tortoises (Testudo graeca) Have Optimal Speeds at Which They Can Minimise the Metabolic Cost of Transport, on a Treadmill" Biology 11, no. 7: 1052. https://doi.org/10.3390/biology11071052