Article

Seasonal Patterns of Picocyanobacterial Community Structure in the Kuroshio Current

1
Department of Microbiology, Soochow University, Taipei 11101, Taiwan
2
Institute of Marine Environment and Ecology, National Taiwan Ocean University, 2 Pei-Ning Road, Keelung 20224, Taiwan
3
Center of Excellence for the Oceans, National Taiwan Ocean University, 2 Pei-Ning Road, Keelung 20224, Taiwan
*
Author to whom correspondence should be addressed.
Biology 2023, 12(11), 1424; https://doi.org/10.3390/biology12111424
Submission received: 27 September 2023 / Revised: 3 November 2023 / Accepted: 10 November 2023 / Published: 13 November 2023
(This article belongs to the Special Issue Climate Change and Marine Plankton)

Abstract

:

Simple Summary

The cell enumeration, 16S rRNA phylogenetic analysis, and hydrography determination were conducted to reveal the ecology of prokaryotic picoplankton in the subtropical Kuroshio current. The picocyanobacteria (i.e., Synechococcus and Prochlorococcus), contributing more than 50% of chlorophyll a, were important primary producers in the subtropical Kuroshio current. The notable seasonal distributions of picocyanobacteria and hydrography were also well described. We suggested the ambient nutrient contents should be the crucial parameter to determine the seasonal patterns of Synechococccus and Prochlorococcus in the study area. Because of the ability to compete for nutrients in an oligotrophic environment, picocyanobacteria would become dominant primary producers in marine ecosystems under the scenario of global warming.

Abstract

The nutrient-scarce, warm, and high-salinity Kuroshio current has a profound impact on both the marine ecology of the northwestern Pacific Ocean and the global climate. This study aims to reveal the seasonal dynamics of picoplankton in the subtropical Kuroshio current. Our results showed that one of the picocyanobacteria, Synechococcus, mainly distributed in the surface water layer regardless of seasonal changes, and the cell abundance ranged from 104 to 105 cells mL−1. In contrast, the maximum concentration of the other picocyanobacteria, Prochlorococcus, was maintained at more than 105 cells mL−1 throughout the year. In the summer and the autumn, Prochlorococcus were mainly concentrated at the water layer near the bottom of the euphotic zone. They were evenly distributed in the euphotic zone in the spring and winter. The stirring effect caused by the monsoon determined their distribution in the water column. In addition, the results of 16S rRNA gene diversity analysis showed that the seasonal changes in the relative abundance of Synechococcus and Prochlorococcus in the surface water of each station accounted for 20 to 40% of the total reads. The clade II of Synechococcus and the High-light II of Prochlorococcus were the dominant strains in the waters all year round. Regarding other picoplankton, Proteobacteria and Actinobacteria occupied 45% and 10% of the total picoplankton in the four seasons. These data should be helpful for elucidating the impacts of global climate changes on marine ecology and biogeochemical cycles in the Western Boundary Currents in the future.

1. Introduction

Picophytoplankton, including picocyanobacteria and picoeukaryotes, are the phytoplankton whose cell size is smaller than 2 μm. Because of their high surface area to volume ratio, picophytoplankton prevail in diverse marine environments, especially thriving in oligotrophic oceans. Generally, marine phytoplankton contribute approximately half of global primary production, which is about 46 to 50 petagrams per year. Of these, picophytoplankton are responsible for approximately 24% of marine phytoplankton production [1,2]. In particular, picophytoplankton are the major primary producers in some marine provinces [3]. For example, picophytoplankton contribute to greater than 70% of the total primary production in the tropical Pacific Ocean [4]. Furthermore, picophytoplankton in the Mediterranean provided 31% to 92% of the primary productivity [5]. The biomass of picophytoplankton is rapidly consumed by heterotrophic microorganisms and enters the grazing food chain or the microbial loop. Several studies have predicted that ocean warming may cause the fraction of tiny phytoplankton (picophytoplankton) to increase over that of the larger group (>2 μm) [6,7]. This relatively rapid change might alter the phytoplankton communities toward picophytoplankton sizes. Then, it may further change the functioning and biogeochemistry of pelagic ecosystems. Therefore, picophytoplankton are important primary producers in marine ecosystems and global oceanic biogeochemistry cycles [3,8].
Synechococcus and Prochlorococcus are the significant members of picocyanobacteria. The abundances of Synechococcus and Prochlorococcus in the global oceans are approximately 104 to 106 cells mL−1 [9,10,11,12]. However, due to their different biological characteristics, Synechococcus and Prochlorococcus have been suggested to occupy diverse marine provinces. Synechococcus is distributed in the global oceans [9,13]. Based on genetic information, Synechococcus has been divided into fifteen clades and twenty-eight subclades [14]. Clades I and IV were found in cold and nutrient-rich waters, whereas Synechococcus clades II, III, V, VI, and VII frequently appear in tropical and subtropical waters [12]. Prochlorococcus usually distributed the euphotic zone of tropical and subtropical oligotrophic waters between latitudes 40° N and 40° S [15,16]. Based on their distribution in the water column, Prochlorococcus species are categorized into two groups: high-light (HL)- and low-light (LL)-adapted ecotypes [14]. These two ecotypes present distinct distributions across depths [17,18,19]. HL-adapted ecotypes have a lower divinyl chlorophyll b/divinyl chlorophyll a (Chl b/Chl a) ratio and are typically found in the surface waters of the open ocean [20]. LL-adapted ecotypes have a higher Chl b/Chl a ratio and usually grow in deep waters with much lower light intensities. In addition to the different distributions in the water column, the appearance of two Prochlorococcus ecotypes also exhibits distinct seasonal dynamics. For example, the abundance of LL-adapted ecotypes has no apparent seasonal variation in the northern Red Sea, in contrast to the distribution of HL-adapted ecotypes [21]. Moreover, the HL-adapted ecotypes are composed of six clades. HL clade II was found to dominate at low and midlatitudes but was changed by HL clade I at latitudes above 30° [16,22]. Furthermore, it has been demonstrated that sudden extreme climate events, such as Asian dust and typhoons, temporarily change the picophytoplankton community composition [23,24].
The Kuroshio current is one of the western boundary currents located in the Northwest Pacific Ocean. The westward-flowing North Equatorial Current runs into the Philippine coast and then bifurcates into northward (i.e., the Kuroshio current) and southward streams (i.e., the Mindanao Current). The Kuroshio current passes the east coast of Taiwan and southeast coast of Japan and then continues as the North Pacific Current [25,26]. The width of the Kuroshio mainstream in eastern Taiwan is approximately 100 km, the depth is around 800 to 1000 m, and the mainstream speed is approximately 1 to 1.5 m s−1. The Kuroshio water is high-temperature and high-salinity. In the subtropical segment of the Kuroshio, its temperature and salinity have no significant seasonal variation and remain at 26 °C to 30 °C and approximately 34.5, respectively [27]. The Kuroshio water in the euphotic zone is characterized as ultraoligotrophic [28,29]. However, when the Kuroshio current flows near the east coast of Taiwan, upwelling along the coastal region transports deep nutrients into the surface [29,30]. The uplift of deep seawater provides a large amount of nutrients to the Kuroshio euphotic zone when the Kuroshio invades the East China Sea shelf [31]. In addition, terrestrial material injection and vertical mixing caused by typhoons or the northeast monsoon provide nutrients to the Kuroshio current. These nutrient sources support primary productivity in the Kuroshio region [32,33]. The surface Kuroshio is oligotrophic and has low chlorophyll a (Chl a) concentrations of less than 0.2 mg m−3 [29,34,35,36,37]. The yearly primary production in the subtropical Kuroshio current is approximately 0.91 ± 0.47 mg carbon m−3 day−1 [36]. Several studies have presented a significantly positive correlation between Chl a and the abundance of picophytoplankton in the Kuroshio [37,38]. Furthermore, various models of global circulation have suggested that the abundance of picophytoplankton will increase significantly with the rise of seawater temperature [39,40]. According to the above information, we hypothesize that with the ecology of picophytoplankton and the biogeochemical cycles, their lead should change in the subtropical Kuroshio under the scenarios of global warming. However, the assemblage composition of picophytoplankton is very complicated, and the relationship between their community succession and the primary productivity in this area requires further careful exploration. The seasonal dynamics of picophytoplankton in the subtropical Kuroshio current were completely revealed in this study. Our results will facilitate future studies on the picophytoplankton ecology and their relationship with the marine biogeochemical cycles under global climate change.

2. Materials and Methods

2.1. Sampling Scheme

This study is a long-term observation of phytoplankton community composition in the subtropical Kuroshio Sea from 2009 to 2015. Intensive sampling in four seasons was conducted from 2012 to 2013. A total of nine stations across the Kuroshio current were visited onboard the research vessels Ocean Researcher I and Ocean Researcher II in October (defined as the autumn voyage) 2012, January (defined as the winter voyage) 2013, April (defined as the spring voyage) 2013, and July (defined as the summer voyage) 2013 (Figure 1). Temperature and salinity were continually recorded by a conductivity/temperature/depth recorder (CTD) (SBE9/11 plus) (Sea-Bird Electronics, Bellevue, WA, USA). The current velocity was measured by a 150 kHz shipboard acoustic Doppler current profiler (ADCP; Teledyne RD Instruments, Poway, CA, USA) [41]. To determine the concentrations of chlorophyll a (Chl a) and inorganic nutrients and the abundance of picophytoplankton, water samples were collected using 20-L GO-Flo bottles (General Oceanics, Miami, FL, USA) mounted on the CTD rosette sampler at six depths from 5 m to 300 m. Light intensity in water was continually measured by a photosynthetically active radiation irradiance sensor (PAR sensor) (Chelsea Technologies, Molesey, UK) equipped with a CTD. The water samples collected from surface (depth = 5 m) and the deep chlorophyll maxima (DCM), which was defined by the fluorescence profile determined by the fluorometer (AquaTracka III, Chelsea, London, UK), at Stations K2, K4, K5, K6, and K8 were used to isolate environmental DNA for analyzing the phylogenetic diversity of the 16S ribosomal RNA (rRNA) gene.

2.2. Determination of Chl a and Inorganic Nutrient Concentrations

The detailed methods for determining the concentrations of Chl a and inorganic nutrients are described in Chan et al. [42]. Briefly, one liter of water for Chl a analysis was immediately filtered through a GF/F class filter (Whatman, Maidstone, UK) and stored at −20 °C until analysis. The Chl a retained on the filter was extracted in 90% acetone. The Chl a concentration was determined by a fluorometer (10-AU-005) (Turner Design, Charlotte, NC, USA)) [42]. To evaluate the fraction of Chl a contributed by picocyanobacteria to the total Chl a concentration, we applied 1.258 femtograms (fg) Chl a cell−1 and 1.203 fg Chl a cell−1 as the conversion parameters for Prochlorococcus and Synechococcus, respectively, which were determined by the average values of the Chl a concentration of several algal strains measured by high-performance liquid chromatography (HPLC) [43].
To determine the concentrations of nitrate (NO3) and phosphate (PO4), the water sample (100 mL) was placed in a polypropylene bottle, immediately frozen with liquid nitrogen and stored at −20 °C until analysis. The NO3 and PO4 concentrations were measured by the pink azo dye and the molybdenum blue methods, respectively. The detection limits of NO3 and PO4 are 0.3 and 0.01 μM, respectively [44,45,46]. The nitracline depth was defined as the depth at which the NO3 concentration difference was 0.5 µM concerning the surface value [47,48,49].

2.3. Determination of Picophytoplankton Abundance

The cells were fixed with paraformaldehyde at a final concentration of 0.2% (w/v) and were preserved in liquid nitrogen. Different picophytoplankton populations were categorized with flow cytometry (FACSAria) (Becton-Dickinson, Franklin Lakes, NJ, USA) based on cell size and autofluorescence in the range of orange from phycoerythrin (575 ± 15 nm, for determining Synechococcus) and red from chlorophyll (>670 nm, for determining Prochlorococcus and photosynthetic picoeukaryotes) under excitation at 488 nm. A known number of fluorescent beads (TruCOUNT tube) (Becton-Dickinson, USA) were parallelly calculated to convert the original cell abundance in the sample [24]. The putative relationships between the picophytoplankton distribution and ambient hydrographic characteristics were analyzed by redundancy analysis (RDA) and the envfit function in the vegan package in R.

2.4. Picoplanktonic DNA Isolation

Seawater was filtered through a 5-µm mesh nylon net to remove larger plankton. The planktonic cells in the filtrate were collected by 0.2-µm pore size polycarbonate membranes (Nucleopore) (Whatman, Stockbridge, GA, USA) under gentle vacuum (≤100 mmHg). The membranes were immediately frozen in liquid nitrogen until DNA isolation. The cells retained on the membranes were disrupted with lysozyme (Roche, Basel, Switzerland) and proteinase K (Roche, Switzerland) treatments. After purification by hexadecyltrimethylammonium bromide and phenol/chloroform/isoamyl alcohol (25/24/1, v/v/v), the DNA pellet was precipitated using isopropanol and resuspended in Tris-EDTA buffer (pH 8.0) [24]. The DNA concentration and purity were determined by spectrophotometry (NanoDrop) (Thermo Scientific, Waltham, MA, USA)) at wavelengths of 230, 260, 280, and 320 nm.

2.5. The Diversity of Picoplankton Composition

DNA product (10 ng) was used as the template for the polymerase chain reaction (PCR) to specifically amplify the V3–V4 region fragments of 16S rRNA genes using the high-fidelity DNA polymerase 2× KAPA HiFi HotStart ReadyMix (Roche) and the forward primer 16SV3V4-F (5′-tcgtcggcagcgtcagatgtgtataagagac AGCCTACGGGNGGCWGCAG-3′) and the reverse primer 16SV3V4-R (5′-gtctcgtgggctcggagatgtgtataagagacAGGACTACHVGGGTATCTAATCC-3′) (the lowercase letters indicate the Illumina adaptor sequences; W=A or T; H=A, T or C; V=A, C or G; N=A, T, G or G) [50]. The amplicons were analyzed by the Illumina MiSeq high-throughput nucleotide sequencing platform (Illumina, San Diego, CA, USA)) using the pair-end method. After the removal of low-quality reads (quality score > Q20) and the trimming of adaptor and primer sequences by Cutadapt software 4.6 [51], the diversity of the resultant reads was analyzed by DADA2 software 1.26 [52]. The taxonomic assignment of representative amplicon sequence variants (ASVs) obtained by DADA2 analysis was further conducted with the 16S rRNA reference sequences in the Silva database (version 138). The ASVs of Synechococcus and Prochlorococcus were assigned following the previous study [53].
The indices of richness (abundance-based coverage estimator, ACE) and diversity (Shannon) were estimated by the sequences randomly subsampled (the size of the smallest library was used) from each sample 1000 times and were expressed as averages to avoid biases generated by differences in the sequencing depth. The beta diversity analysis was performed with hierarchical clustering to visualize the spatiotemporal distribution of the picoplankton community assemblage by PRIMER 6 software with the Bray–Curtis distance.

2.6. Nucleotide Sequence Deposition

The nucleotide sequences used in this study have been deposited in the Sequence Read Archive (SRA) database under BioProject accession number PRJNA904529.

3. Results

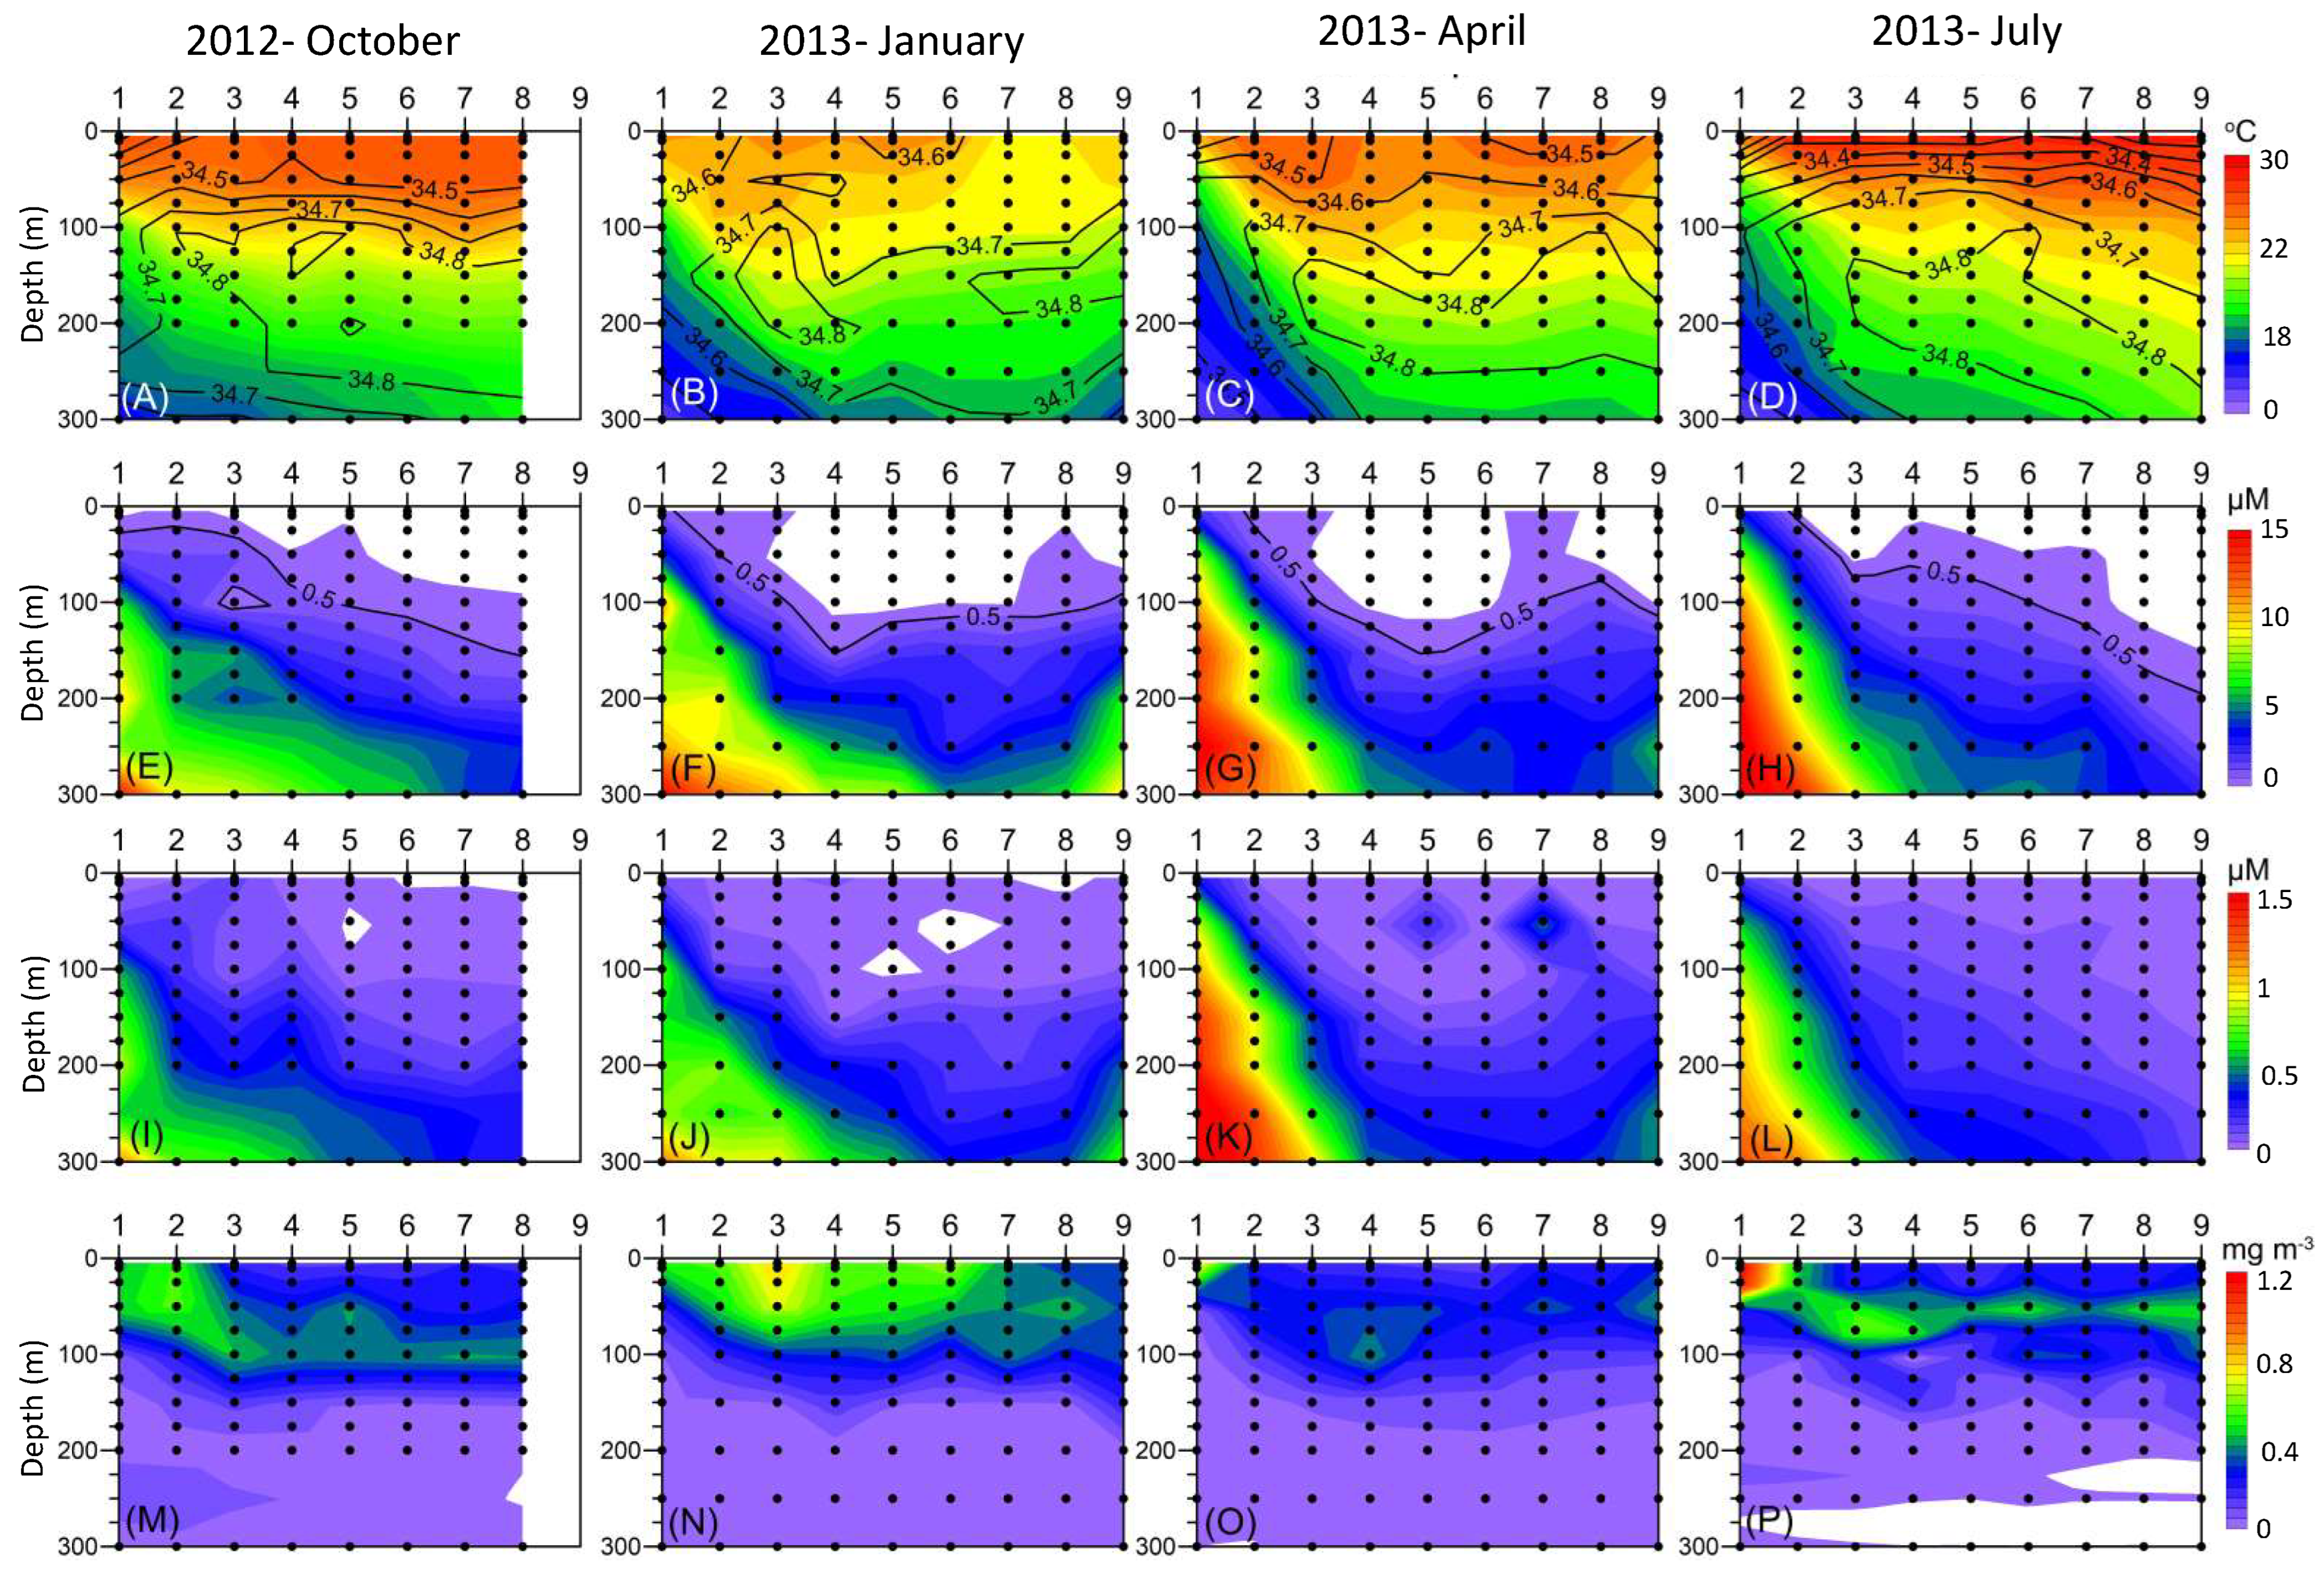
Based on physical characteristics such as current velocity, temperature, and salinity, stations were divided into four categories, namely: K1, which was the station with coastal upwelling; Stations K2 to K4, which were located at the mainstream of the Kuroshio current; and Stations K5 and K6, which were close to the Kuroshio, and their hydrological characteristics were affected by it. Stations K7 to K9 were located in the open ocean and were regarded as the reference, where they were not affected by the Kuroshio current [42,46]. The hydrography in the upper water column (≤100 m) of the Kuroshio is high-temperature, high-salinity, and low-nutrient content [46]. In addition to Station K1 being primarily affected by upwelling, the intensity of monsoon blowing determines the mixing grade of water columns at other stations. The northeast monsoon started in the autumn (October) and led to the occurrence of upper water column mixing (Figure 2A). This stirring effect was the most vigorous in the winter (January), and it resulted in the surface water temperatures reaching low values of 22 to 24 °C (Figure 2B). With the weakening of the monsoon, the water mixing gradually moderated in the spring (April). In the summer (July), significant stratification was observed and resulted in a high surface temperature greater than 29 °C (Figure 2C,D). Salinity was maintained above 34.5 at each station throughout the year (Figure 2A–D).
The nutrient distribution in the subtropical Kuroshio exhibited notably higher concentrations at the coastal upwelling stations. However, in the Kuroshio mainstream and oceanic province, the concentrations of both nutrients in the euphotic zones were extremely low (Figure 2E–L). In the autumn (i.e., October 2012) (Figure 2E) and the summer (i.e., July 2013) (Figure 2H), the depth of the nitracline gradually increased from the coast to the open sea. In contrast, in the winter (i.e., January 2013) (Figure 2F) and the spring (i.e., April 2013) (Figure 2G), except for the upwelling stations, the nitraclines were maintained at a depth of approximately 100 m. The seasonal distribution of PO4 was similar to that of NO3. The elevation of the nitracline derived from the mixing effect caused by the northeast monsoon in winter and spring would facilitate the upward transport of deep-sea nutrients. The chlorophyll was around 0.3 to 1.2 mg m−3 across four seasons. In the winter and spring, there was an even distribution of chlorophyll in the upper layer (Figure 2N,O). However, the maximum chlorophyll layer in the summer and autumn occurred at water depths of approximately 50 m and 100 m, except for that at the upwelling station (K1), which was found at the surface (1.29 mg Chl a m−3) (Figure 2M,P). Furthermore, the highest total content of Chl a (186.36 mg Chl a m−3) within the depth ≤ 100 m of most stations was found in the winter (Figure 2N).
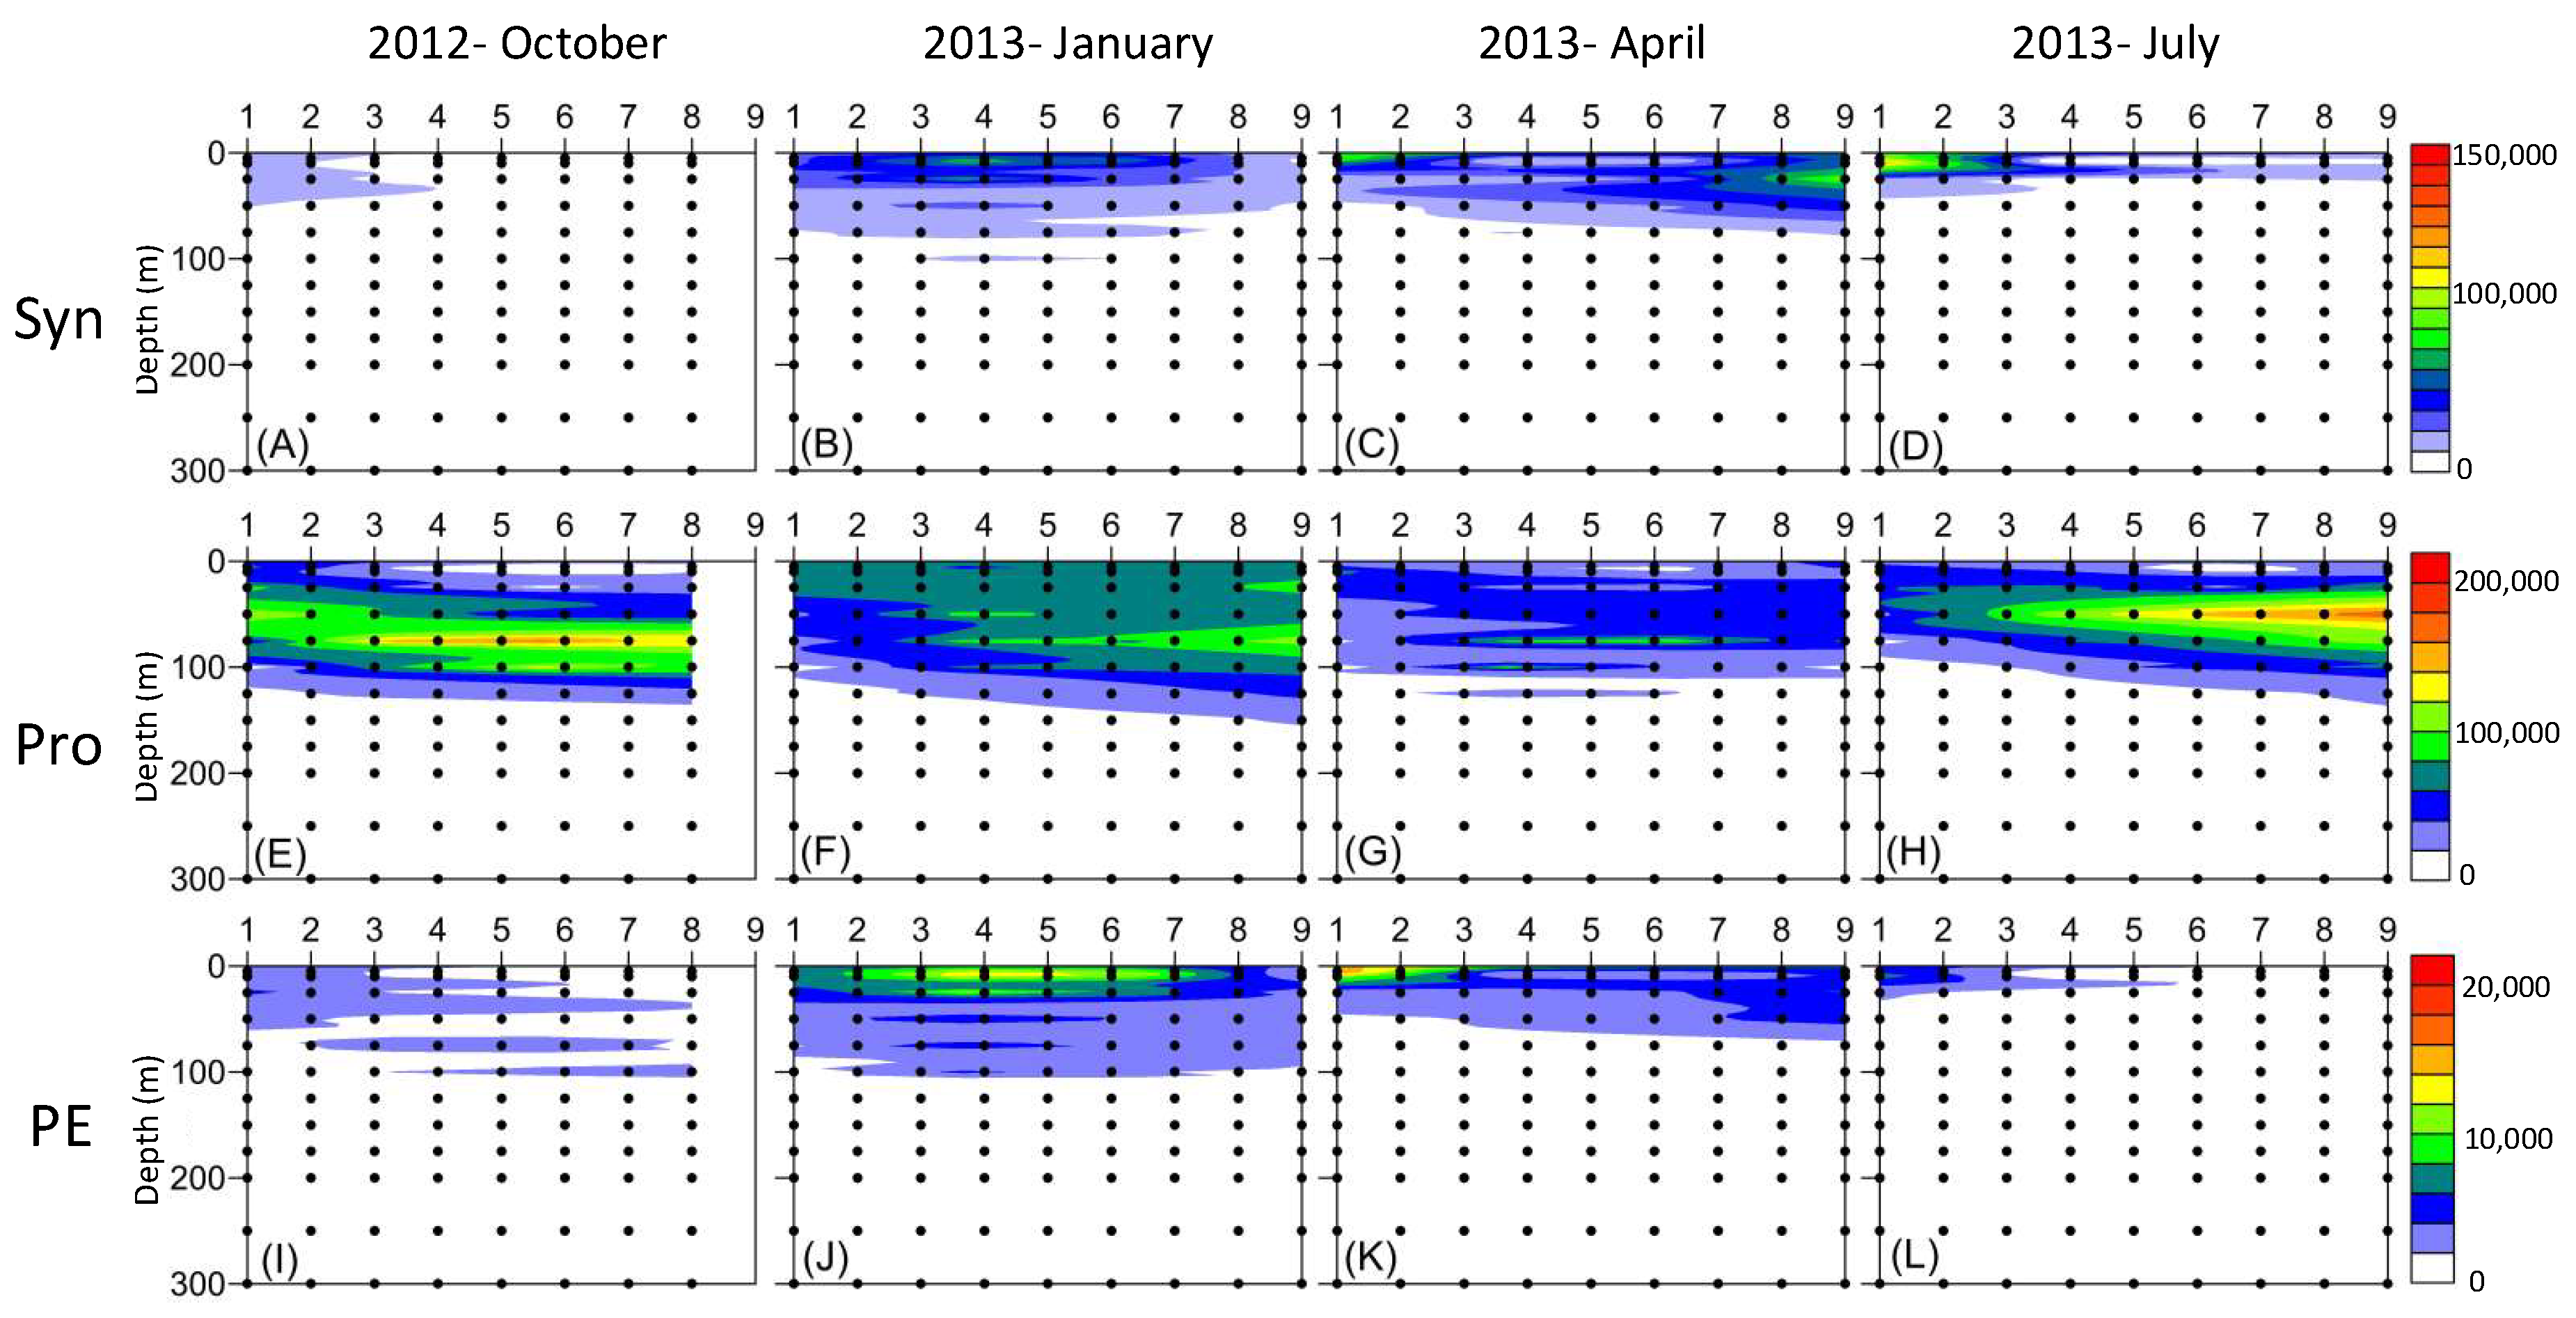
The dominance of Synechococcus and picoeukaryotes was found in the surface water in both the cold and warm seasons (Figure 3A–D,I–L). The highest abundance of Synechococcus and picoeukaryotes both occurred at 10 m at the K1 station in the summer and spring, respectively (1.5 × 10⁵ cells mL−1 and 2.2 × 10⁴ cells mL−1) (Figure 3C,D,K,L). However, the maximum total cell numbers of Synechococcus and picoeukaryotes in the upper water column (≤100 m) appeared in the winter (9.3 × 10⁸ cells cm−2 and 2.3 × 10⁸ cells cm−2) (Figure 3F,J). In contrast to Synechococcus and picoeukaryotes, Prochlorococcus was found in all seasons (Figure 3E–H). Especially high total Prochlorococcus concentrations in the upper water column (≤100 m) were present in summer and autumn (3.3 × 10⁹ cells cm−2 and 2.4 × 10⁹ cells cm−2) (Figure 3E,H). In addition, it had the highest number at specific depths (75 m and 50 m) in these two seasons. In contrast, the distribution of Prochlorococcus was more even at depths ≤100 m in winter than in summer and autumn, although the total concentration of Prochlorococcus in the upper water column (≤100 m) was the same as that in autumn (2.9 × 10⁹ cells cm−2) (Figure 3F). According to the conversion factors of Chl a concentration of Synechococcus and Prochlorococcus (1.065 fg Chl a cell−1 and 1.51 fg Chl a cell−1) [52], their contributions to total Chl a in the upper water column (≤100 m) at different sampling sites are shown in Figure 4. On average, picocyanobacteria (Synechococcus and Prochlorococcus) were responsible for approximately 30% to 50% of the total Chl a in the four seasons; the highest percentage was shown in September 2009 and August 2015 (Figure 4C). Synechococcus contributed the lowest percentage of total Chl a in October (1.5%), while the highest contribution was in September (Figure 4A). Prochlorococcus contributed the highest percentage of total Chl a in the summer (August, 31.7%) (Figure 4B).
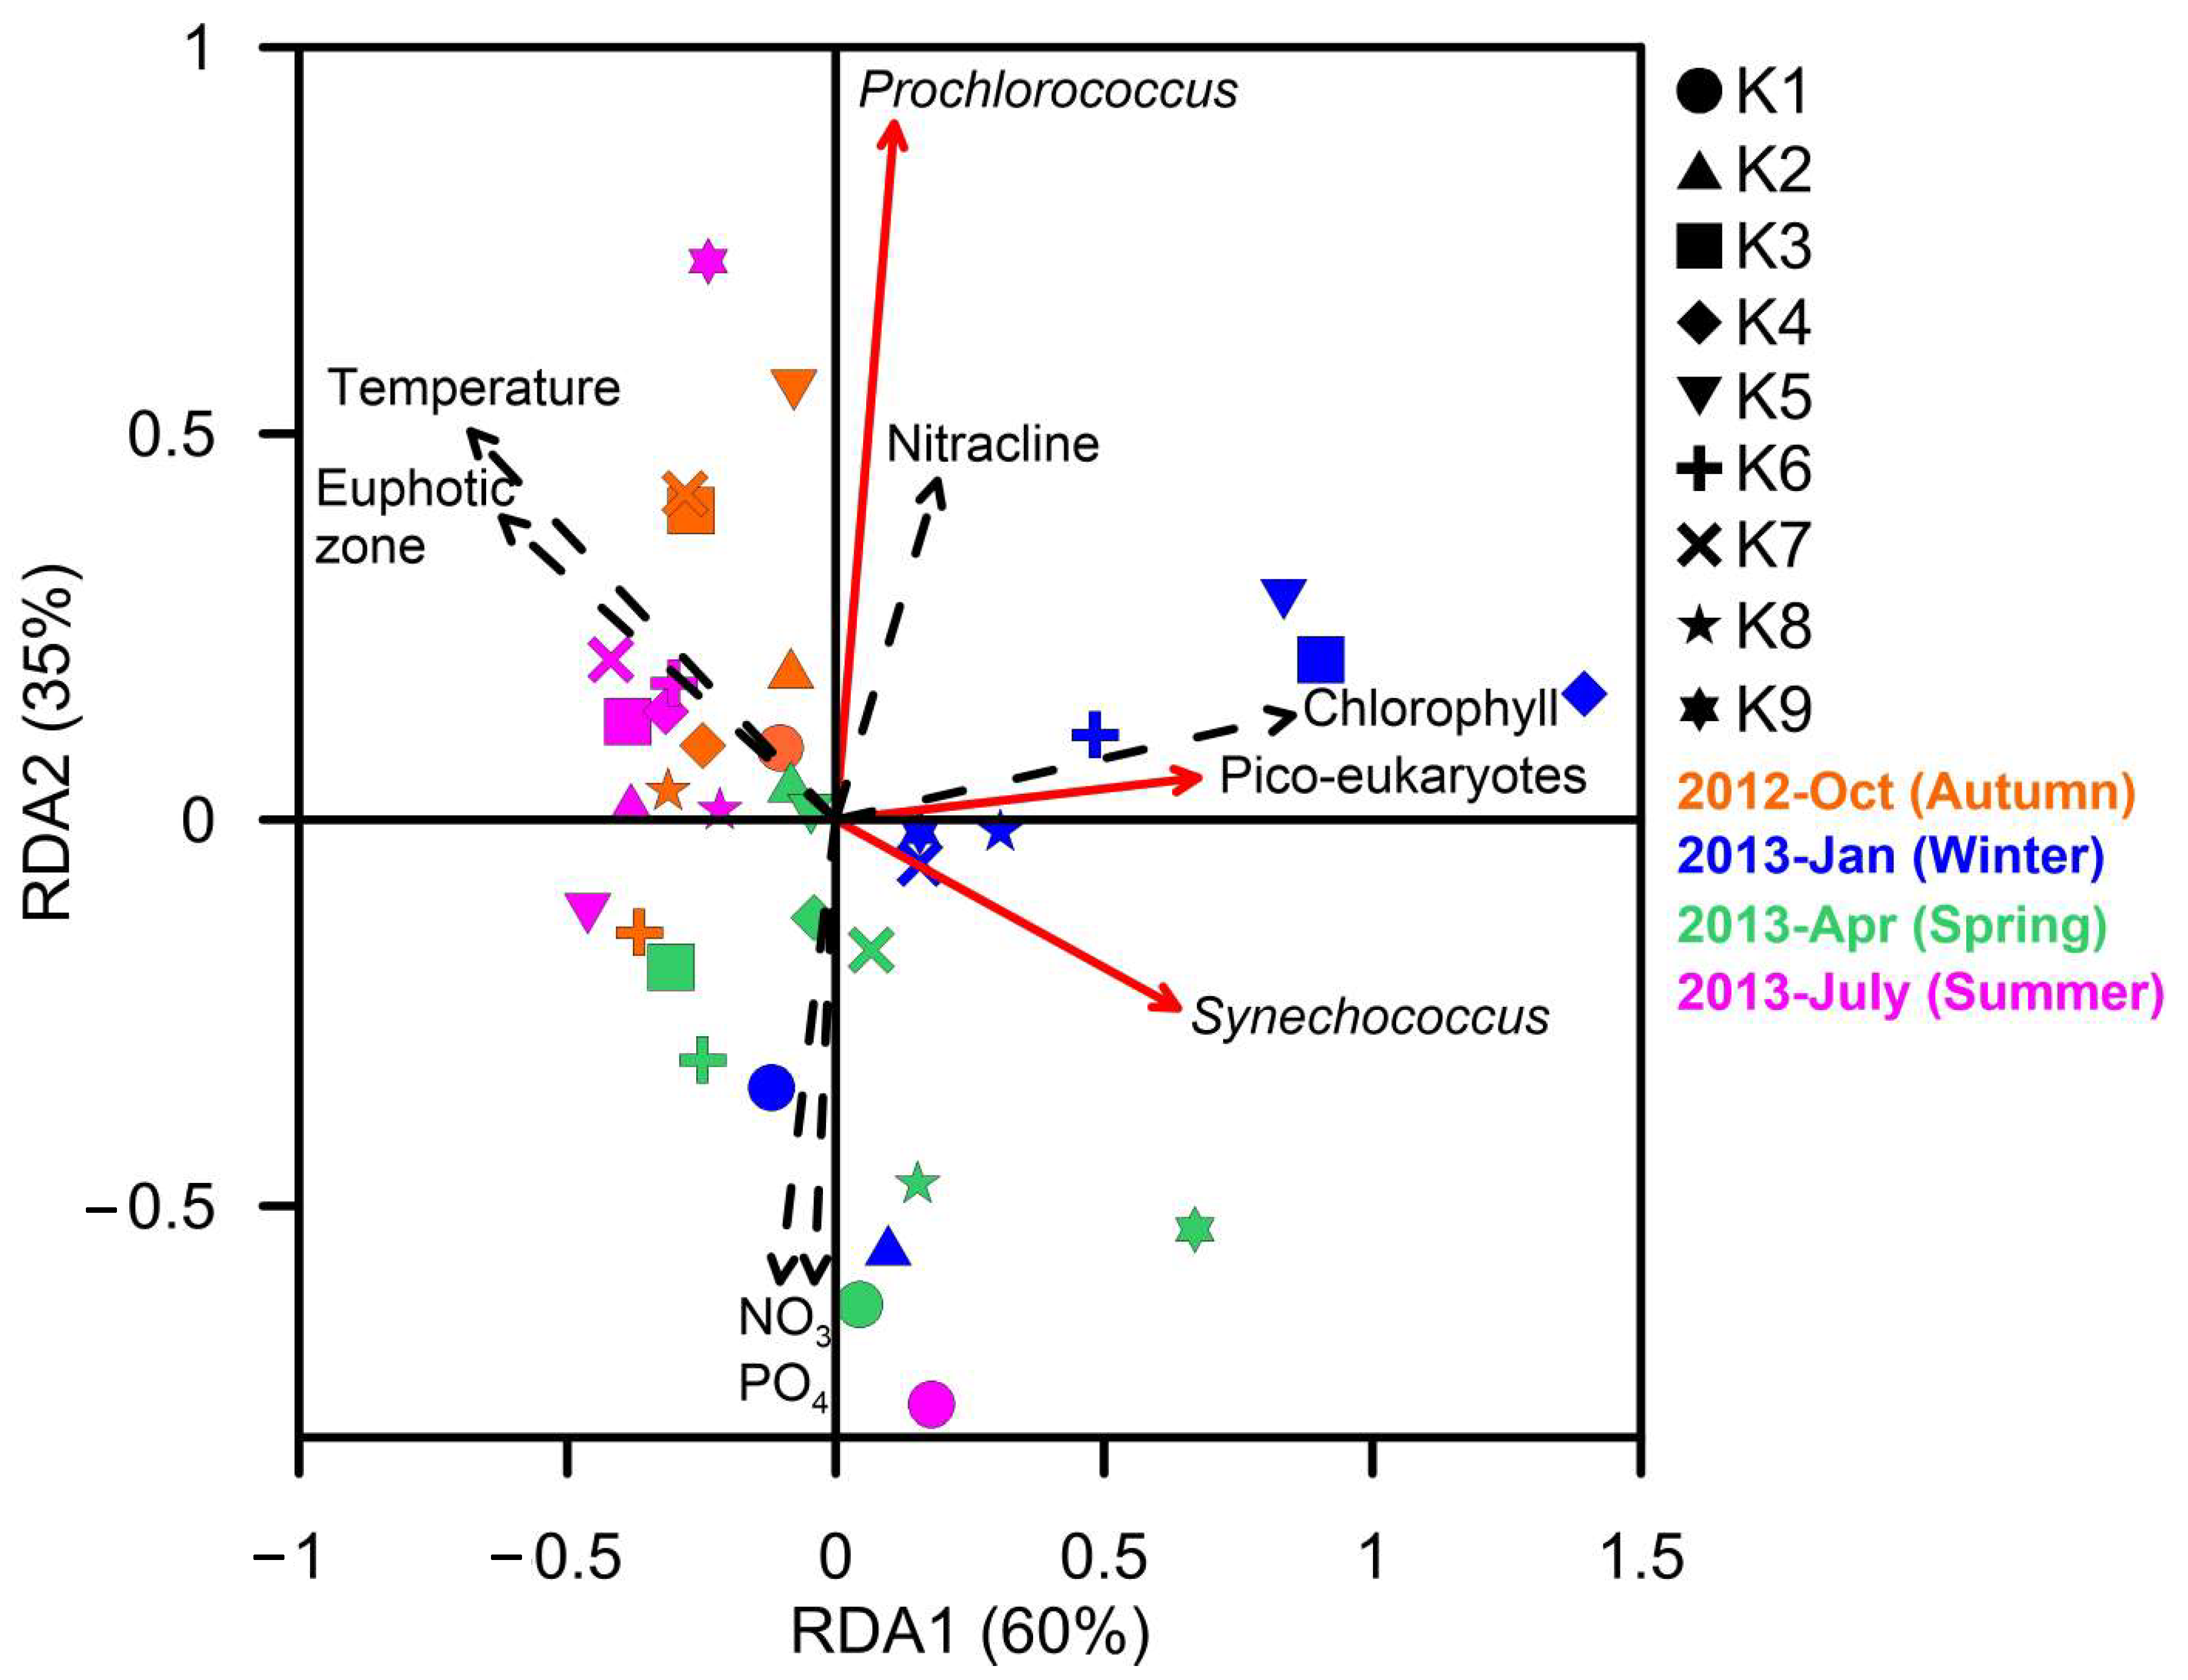
The total abundance of Prochlorococcus, Synechococcus, and picoeukaryotes at depths above 100 m had distinct correlations with biotic and abiotic environmental factors in the RDA (Figure 5). For example, Prochlorococcus was positively correlated with nitracline depth, while Synechococcus was negatively correlated with water temperature and the depth of the euphotic zone.
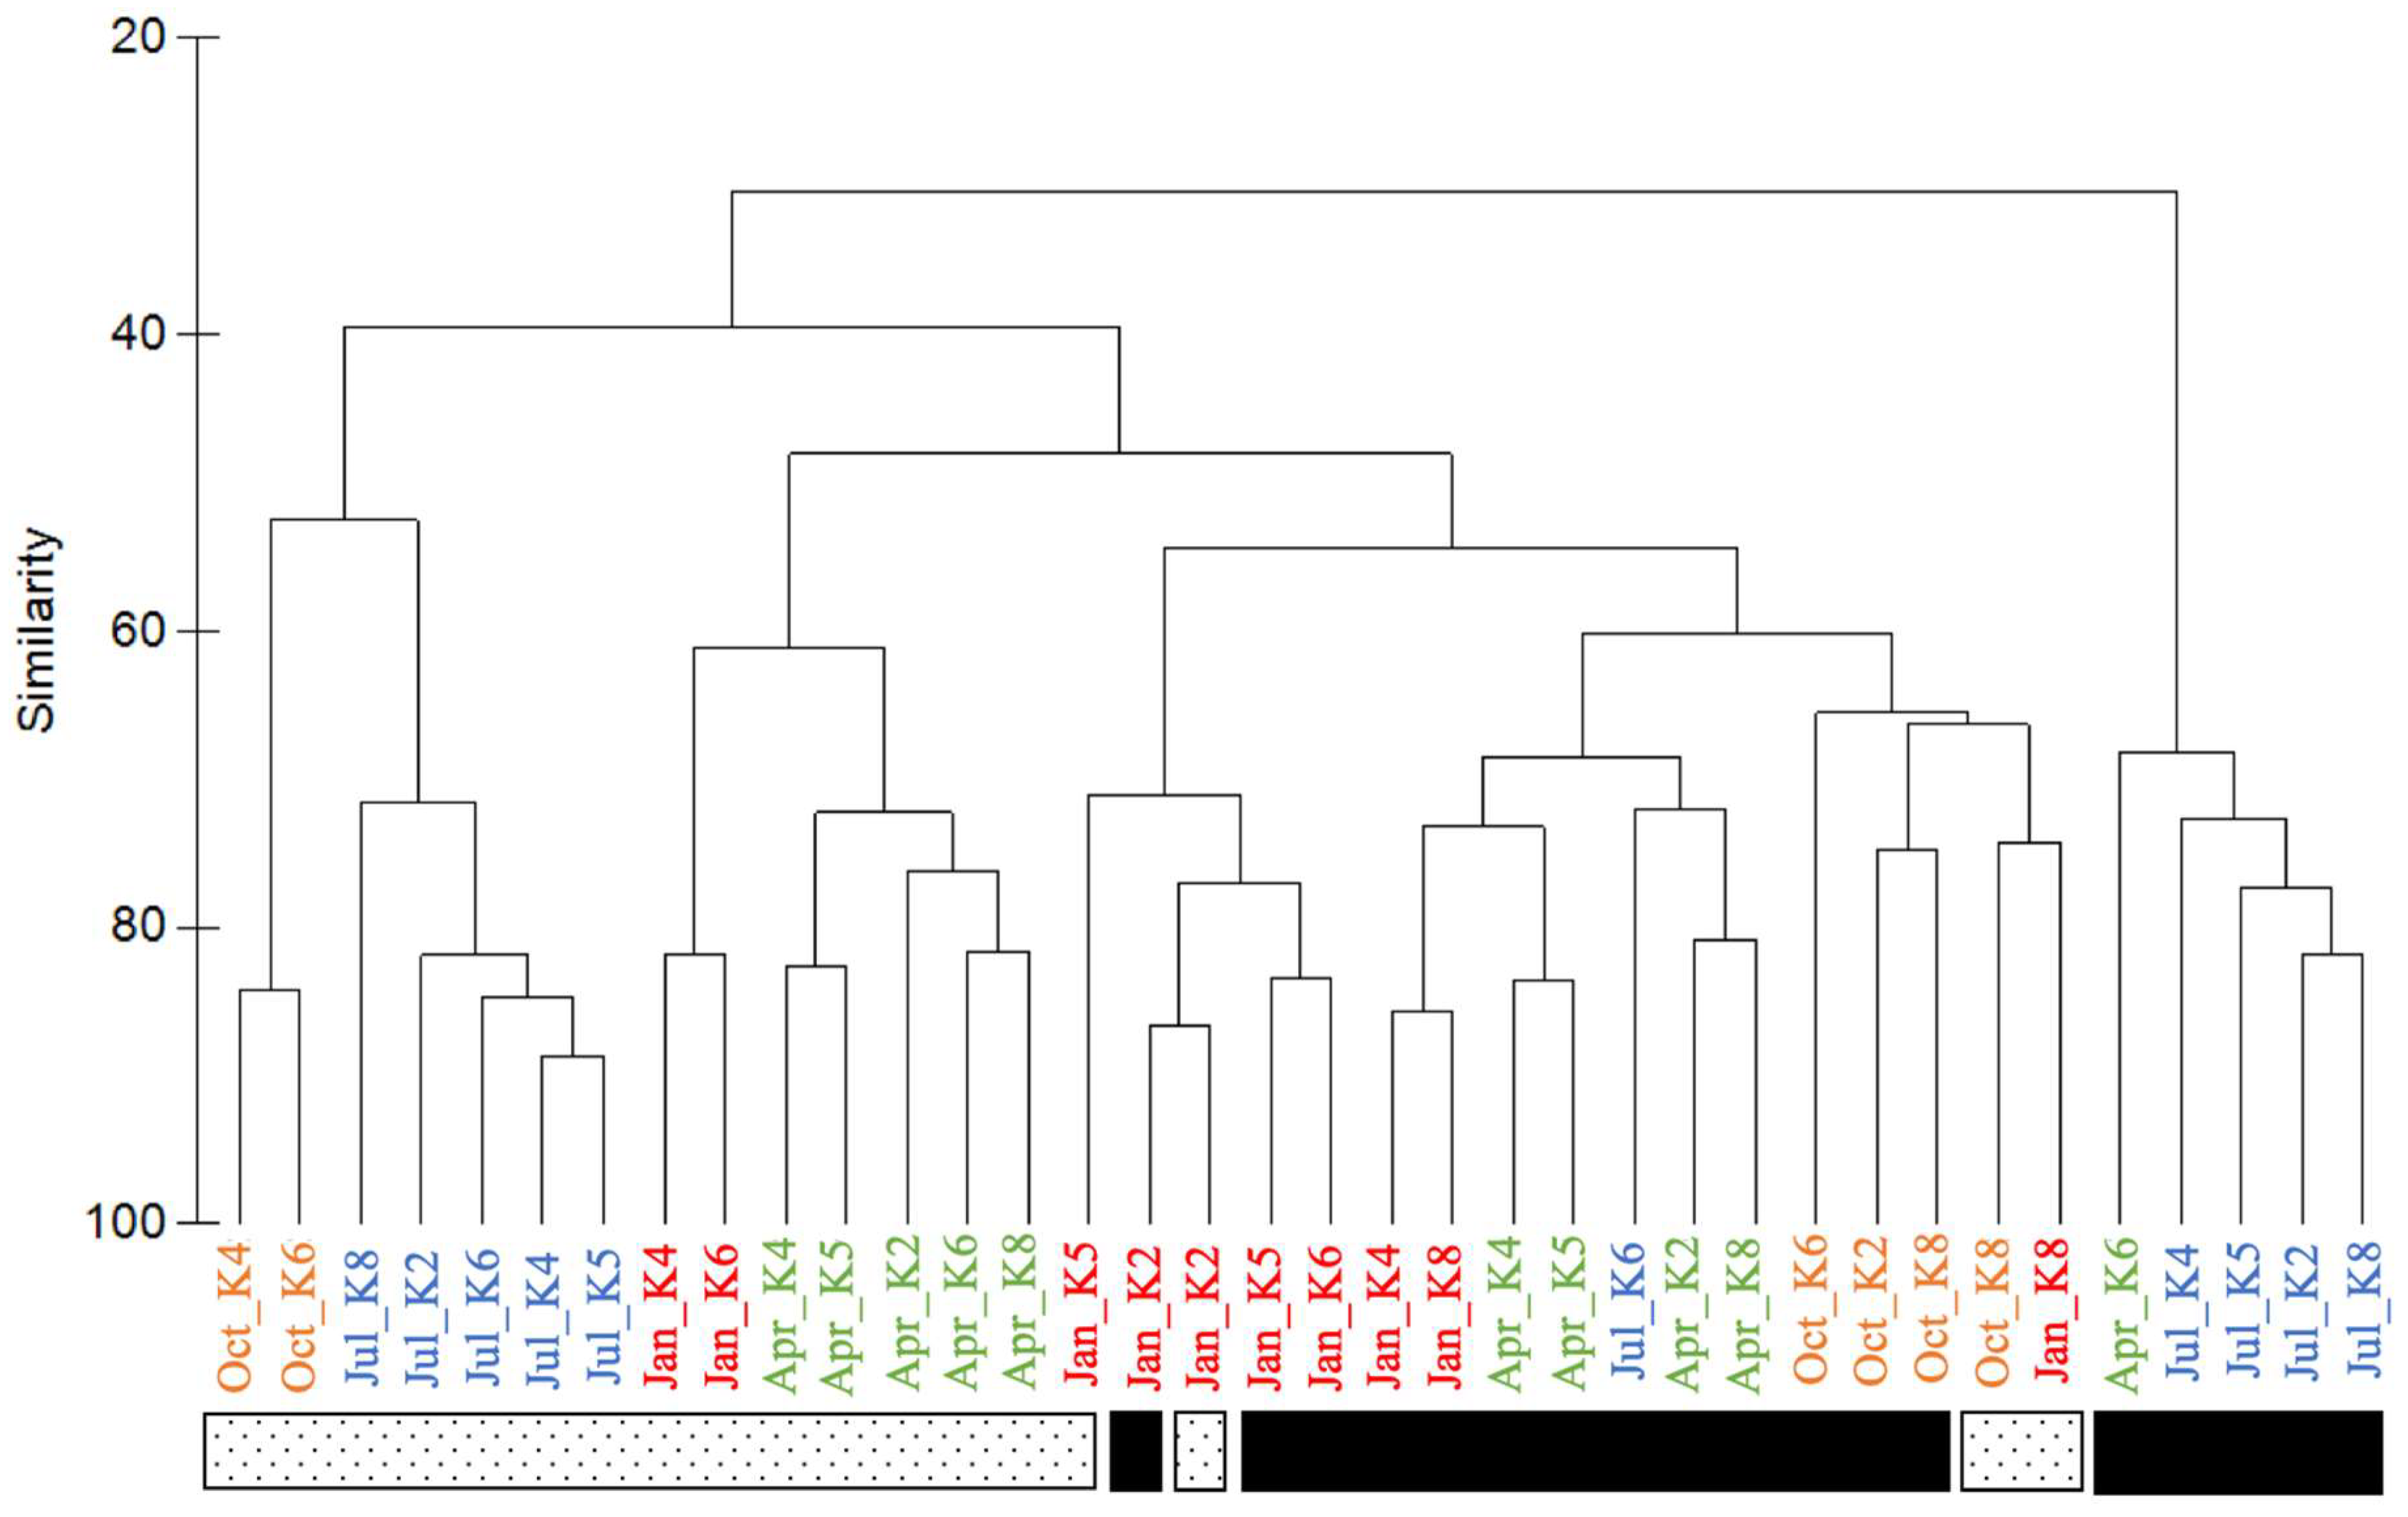
The environmental DNA was collected in K2 and K4 to represent the sample in the mainstream of the Kuroshio current when the K5 and K6 closed to the Kuroshio current. The K8 station was the oceanic station. A total of 4,410,567 high-quality reads were obtained after eliminating short- and low-quality sequences. The total reads had 1.6 to 9.8 × 10⁵ reads at each station. The overall coverage at each station was greater than 99%. Each station obtained 996 to 3012 ASVs (Table 1). The diversity and richness indices increased following the distance of the station away from the coast. Open ocean stations had higher diversity and richness indices of picoplankton compared with the stations affected by the Kuroshio current. Furthermore, the open ocean station (K8) had the highest richness and diversity indices, while the lowest indices were at the Kuroshio current station (K4) in the summer (Table 1). Hierarchical clustering analysis showed that the total bacterial community composition in the surface layer was different from that in the DCM layer (Figure 6). This result suggested that niche partitioning in the community occurred (ANOSIM, R = 0.68, p = 0.001).
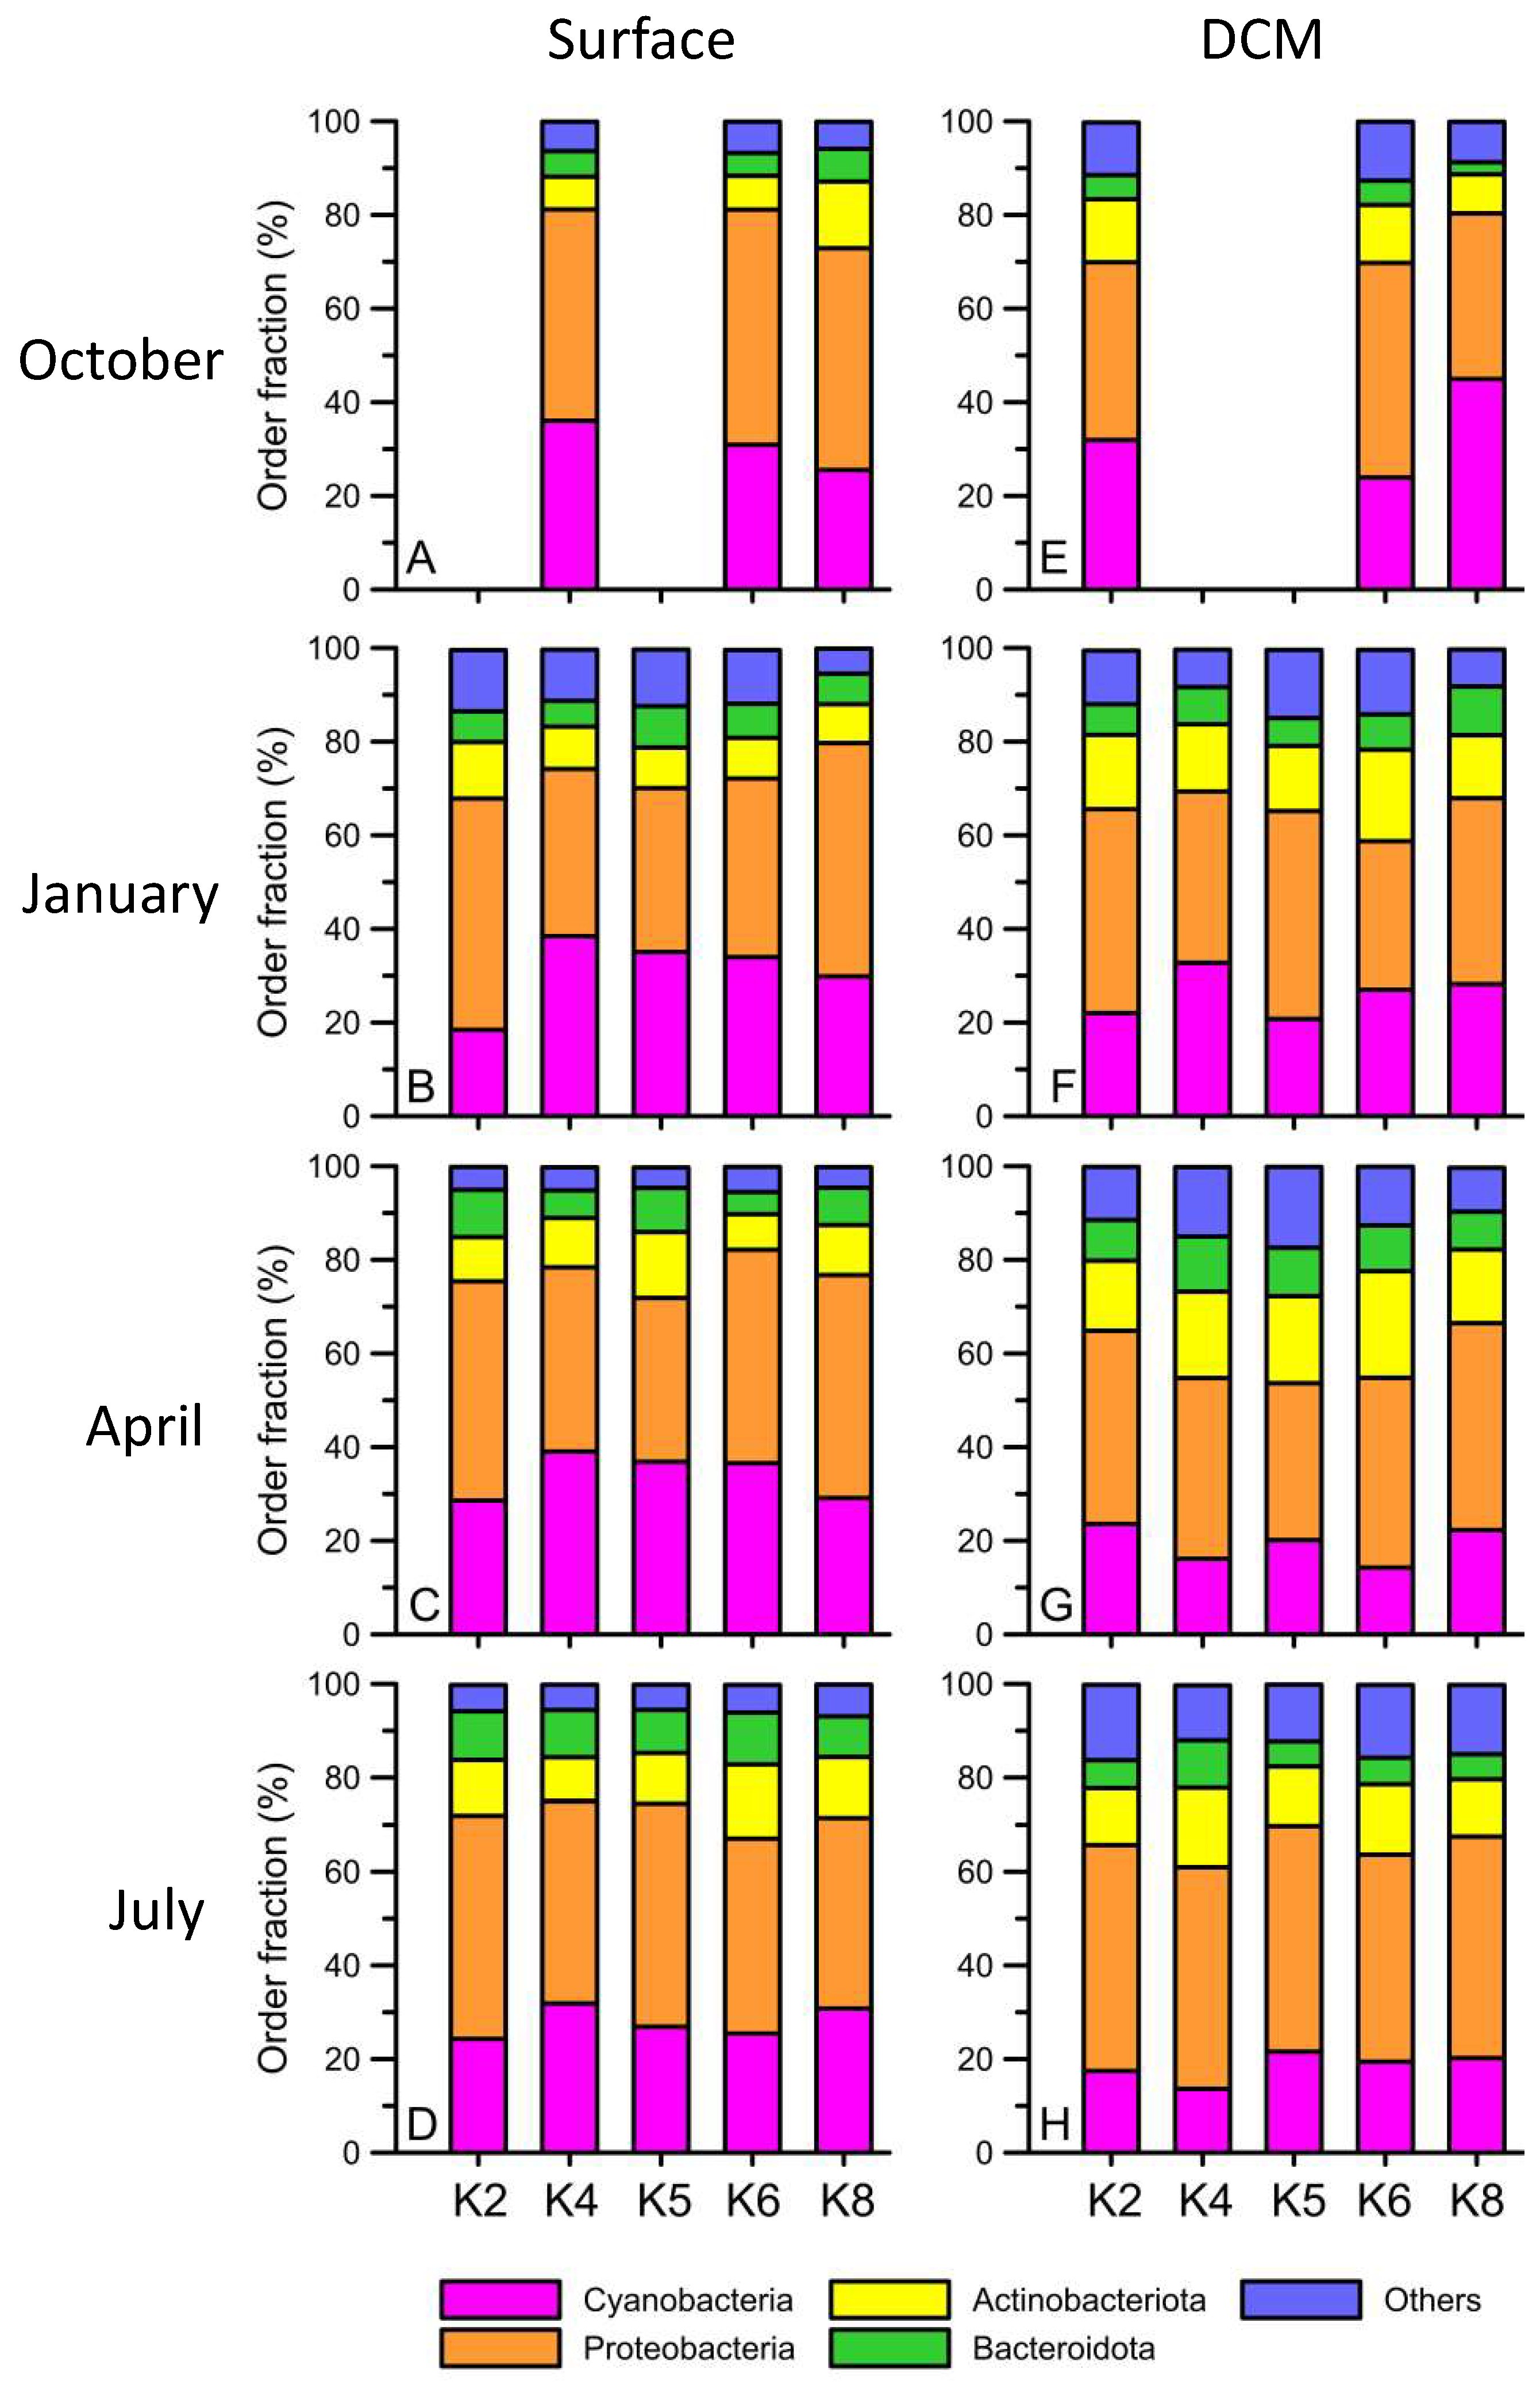
In terms of the community structure of picoplankton at the surface of the Kuroshio current, the ASVs were categorized into the phyla Cyanobacteria, Proteobacteria, Actinobacteria, and Bacteroidetes (Figure 7). Each taxon occupied a consistent ratio in total reads among all stations during the four seasons. In detail, the reads affiliated with Cyanobacteria occupied 20 to 40% of the total reads. The highest cyanobacteria percentage occurred at the K4 station in each season. The maximum percentage of cyanobacteria at the K4 station was in the winter (41.6%) (Figure 7). Proteobacteria consistently occupied approximately 40% to 50% of the total reads (Figure 7). The major four genera of Proteobacteria were Alphaproteobacteria, Deltaproteobacteria, Gammaproteobacteria, and Flavobacteria. The most dominant genus was Alphabacteria, which accounted for approximately 20% to 30.8% of the total picoplankton during the four seasons. Actinobacteria accounted for only 6.6 to 14.6% of the total picoplankton in the four seasons.
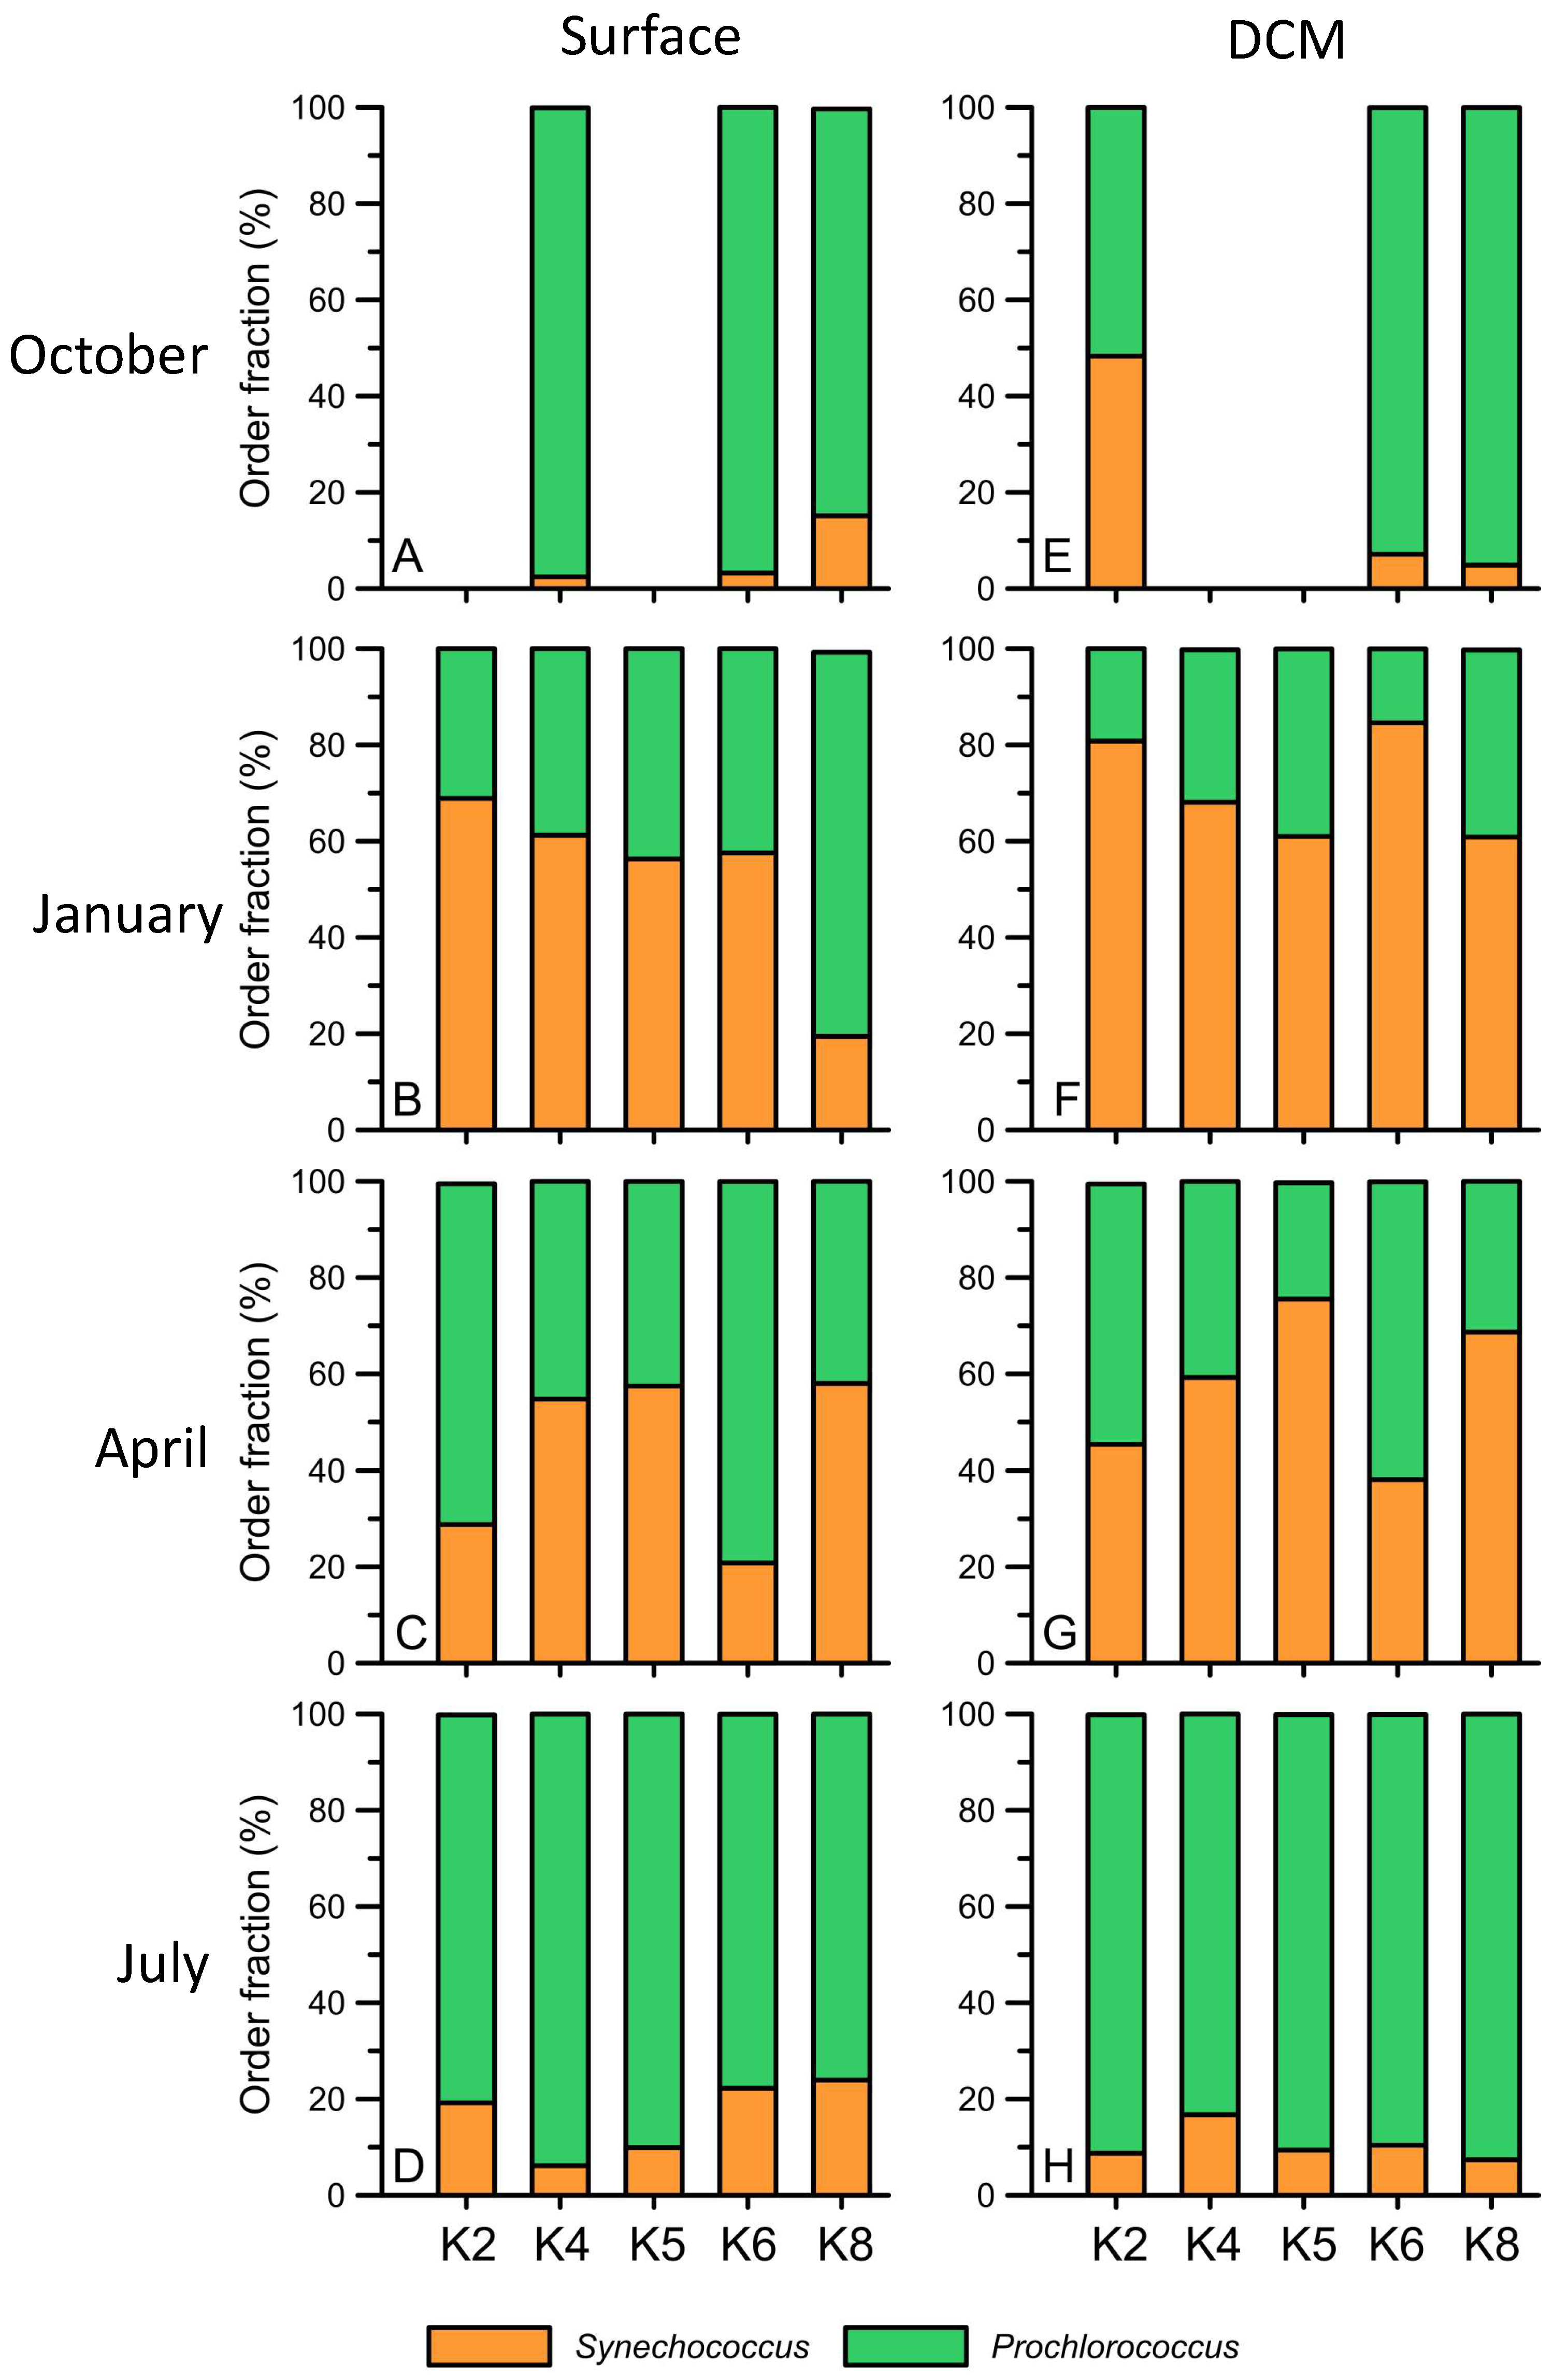
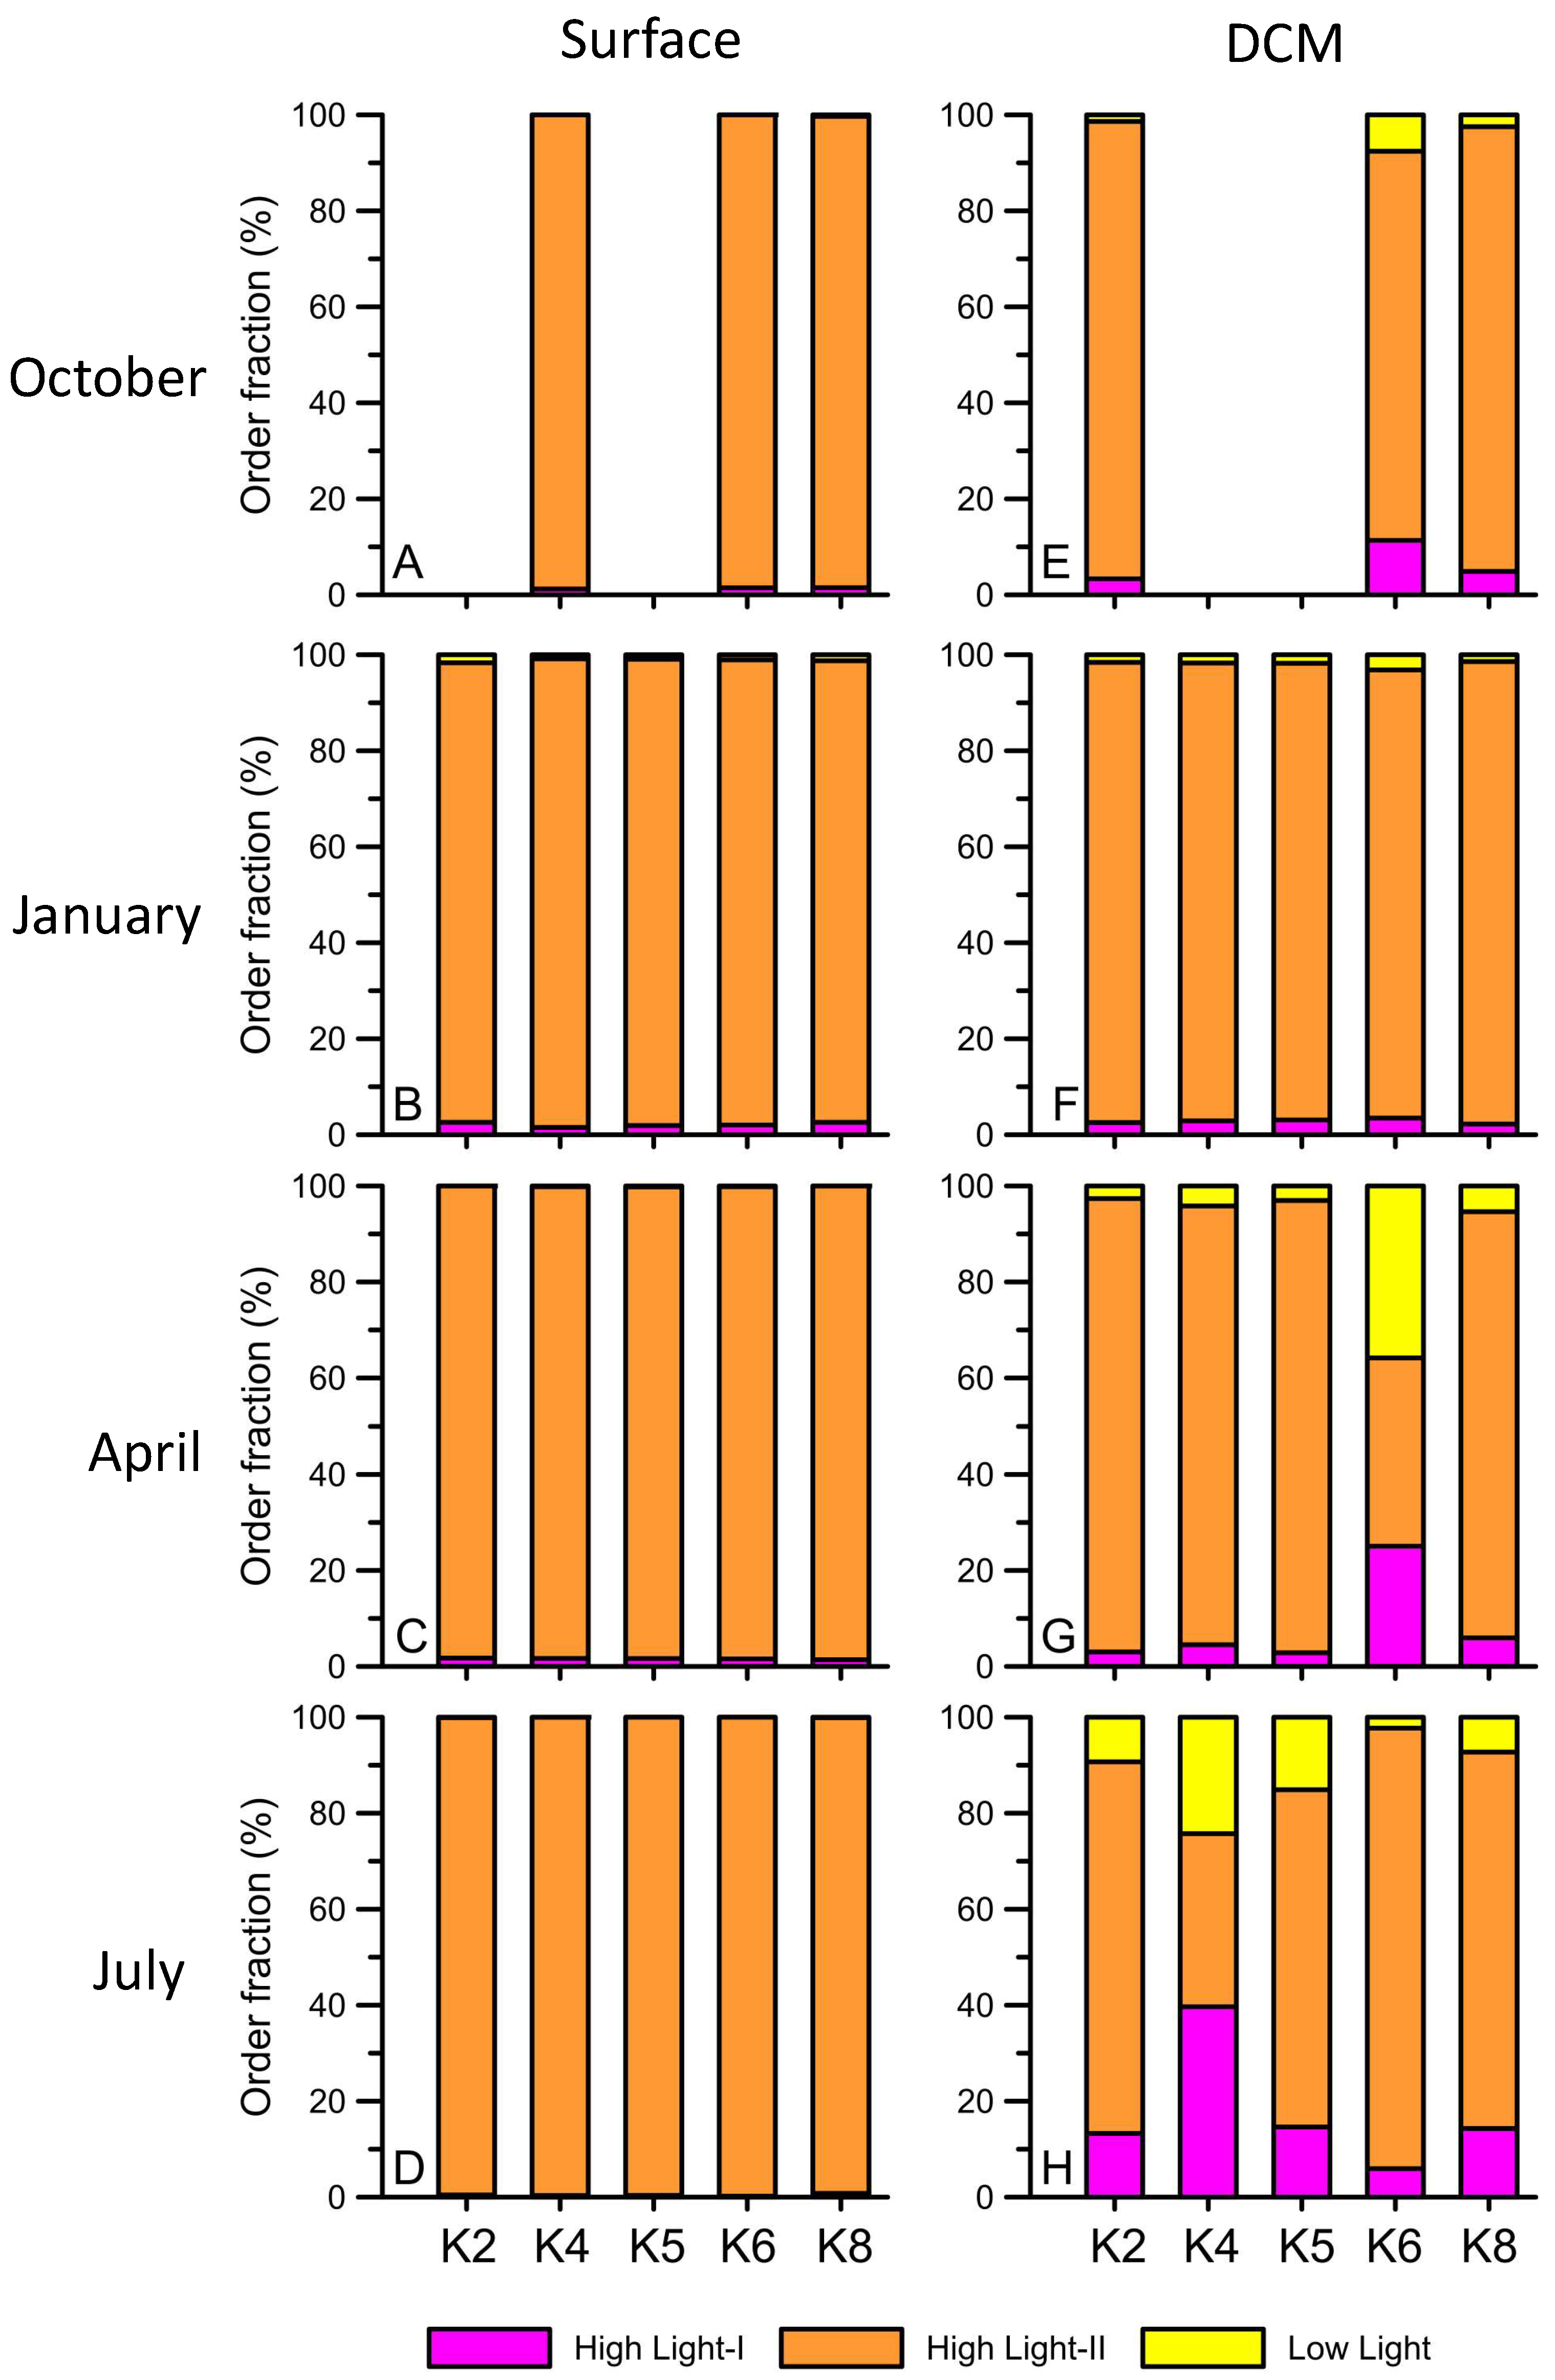
The ASV reads for Synechococcus and Prochlorococcus in the total cyanobacteria phylum showed different seasonal patterns in both the surface and DCM layers (Figure 8). In detail, Prochlorococcus accounted for 71.1% to 92.2% of the total cyanobacteria in summer (Figure 8D,H) and autumn (Figure 8A,E) in the surface and DCM layers. In winter, the relative abundance of Prochlorococcus significantly decreased (Figure 8B,F) in the two layers. In particular, Prochlorococcus in DCM accounted for only 20% to 40% of the total cyanobacteria when it accounted for 30% to 80% on the surface (Figure 8). Then, the relative abundance of Prochlorococcus increased again in spring (40% to 60% of total cyanobacteria) in the two layers. In contrast, Synechococcus had a high percentage in winter and spring, accounting for approximately 20% to 80% of the total cyanobacteria, while that in summer and autumn accounted for only 2.3% to 13.8% in the two layers (Figure 8). Within the Synechococcus group, clades I, II, III, and VII formed the major group in the main Kuroshio current (Figure 9). Synechococcus clade II had the highest relative abundance of Synechococcus (90%) in four seasons of the surface (Figure 9A–D). Synechococcus clade II was also dominant in January and April of DCM (Figure 9F,G). However, it decreased by approximately 50% in the DCM warm seasons when the relative abundance of clade VII increased (Figure 9H). Prochlorococcus was categorized into two groups, the high light group (HL) and the low light group (LL), by the differential Chl a intensity in flow cytometry. The HL-II groups existed in both the surface and DCM and were responsible for more than 90% of the total relative abundance of Prochlorococcus (Figure 10). The HL-I group was mainly observed in the DCM and had a high relative abundance in the summer (Figure 10E–H). Finally, the LL group only presented DCM (Figure 10E–H). Interestingly, the relative abundance of the LL group started to increase in spring and had a maximum relative abundance in the summer (approximately 20%) (Figure 10G,H).

4. Discussion

The Kuroshio current is an important western boundary current in the Northwest Pacific Ocean. More than half of Chl a in the Kuroshio current is contributed by picoplankton [29]. However, in comparison with other highly oligotrophic oceanic currents (i.e., the Gulf of Mexico), few studies have focused on prokaryotic picoplankton in the Kuroshio current [54,55,56]. Thus, in this study, we revealed the detailed community structure of picoplankton and their distribution in the Kuroshio current across four seasons. It would help to understand the correlation between the western boundary current hydrography and the picophytoplankton succession.
The Kuroshio current experiences sudden nutrient input events that boost Synechococcus abundance. In our in situ observation results, the highest abundance of Synechococcus primarily appeared at the K1 station in the summer (1.5 × 10⁵ cells mL−1) and the spring (9.9 × 10⁴ cells mL−1), where there was strong nutrient input from upwelling (coastal uplift). On the other hand, obvious stratification was found at other stations. Thus, the nutrients at the other stations were scarcer than those at the K1 station and could not support Synechococcus, which had a high abundance similar to that at the K1 station. Liu et al. (2021) indicated that the growth of Synechococcus in the Kuroshio current was enhanced following increasing temperature by dilution experiments [57]. In addition, under high temperature (surface water temperature + 4 °C), a higher growth rate of Synechococcus was observed in nutrient-replete conditions than in nutrient-limited water [57]. Hence, in the summer of the Kuroshio current, sudden nutrient input events could induce Synechococcus to thrive temporarily. It has also been demonstrated that the nutrients brought by dust storms, typhoons, and coastal uplift promote the growth of Synechococcus [23,24,29]. In addition, deeper nutrients uplifted by upwelling also stimulated Synechococcus to grow in the upwelling area [58,59].
Another finding was that the total cell number of Synechococcus in the upper water column (≤100 m) was higher in the winter than in the summer. From a previous study, the growth rates of Synechococcus increased with increasing water temperature. Although the average surface water temperature in summer was 28.7 °C, it remained at 26.1 °C in the winter season of the Kuroshio current. Following a previous study, the growth rate of Synechococcus at 26 °C remained comparable to that at 28 °C. Thus, we suspected that the growth rate of Synechococcus remained in these two seasons. Furthermore, because of monsoon-induced vertical mixing, the nutrients in the winter were transported more effectively to the surface layer in the winter. Additionally, there was strong upwelling invasion during cold seasons. The upwelling events were observed not only at coastal stations (K1 and K2) but also at open ocean stations (K8 and K9). From the above, these factors likely contributed to a more evenly distributed number of Synechococcus across each station in the winter. In fact, the highest number of Synechococcus in winter reached 9.3 × 10⁴ cells mL−1. Consequently, the total cell number of Synechococcus in the upper water column (≤100 m) was the highest during the winter season (9.3 × 10⁸ cells cm−2). This explains the negative correlation between water temperature and the abundance of Synechococcus in the RDA. Monsoon-induced vertical mixing, upwelling, and holding high water temperature in the Kuroshio current caused even distribution and high total Synechococcus abundance in the upper water column (≤100 m) in the winter.
Offshore of northeastern Taiwan, upwelling often occurs when the branch of the Kuroshio current intrudes into the East China Sea shelf at higher latitudes. Chung and Gong (2019) [58] discovered that the surface of upwelling sites exhibited a high abundance of Synechococcus (5.9 × 10⁴ cells mL−1), ranging from 1 to 2 × 10⁴ cells mL−1 in the surface waters of the sites influenced by the Kuroshio current. The relative abundance of Synechococcus, based on total 16S rRNA amplicon sequencing, was up to 96%. These Synechococcus populations contained highly phylogenetic divergence, including clade II, clade X, and clade XI [58], with clade II being the most dominant (96% of total Synechococcus). In this study, we focused on a more southern Kuroshio current, characterized by low available nutrients in situ. Therefore, the differences found in the abundance of Synechococcus compared with the findings of Chung and Gong (2019) [58] could be attributed to variations in the formation of upwelling caused by the main or branch currents of the Kuroshio current system [58]. Additionally, this study revealed the presence of Synechococcus in clade VII, clade III, and clade X. These variations in clade composition are likely influenced by different depths of upwelling, which might provide distinct nutrient concentrations for microorganisms in situ [60,61,62].
Picoeukaryotes may also be stimulated by nutrient input. During the winter, picoeukaryotes and Synechococcus and picoeukaryotes both exhibited high abundance, attributed to nutrient input from subsurface layers through mixing. In addition, picoeukaryotes were also particularly abundant on the surface of upwelling stations (K1) during the spring and summer. The RDA revealed a positive correlation between the abundance of picoeukaryotes and Synechococcus (Figure 5), supporting the notion that the two microorganisms are correlated. Chan et al. (2020) also demonstrated that the abundance of picoeukaryotes in the Kuroshio current was positively correlated with Synechococcus abundance (Pearson correlation, p < 0.01) [63].
Prochlorococcus is dominant in many oligotrophic environments, such as central oceanic gyres and the southern Gulf of Mexico [64,65,66]. It has also consistently been observed as the prevailing group upstream of the Kuroshio current [57,67]. According to our results, the total abundance of Prochlorococcus in the upper water column (≤100 m) showed a positive correlation with the nitracline depth (p = 0.031). This indicates that the total Prochlorococcus increased as the nitracline depth increased, which has a scarce nitrate concentration. This relationship was particularly evident during summer and autumn, characterized by a deeper nitracline compared to other seasons (summer: R2 = 0.80 and p < 0.05; autumn: R2 = 0.75 and p < 0.05). Notably, while Prochlorococcus exhibited a more widespread vertical distribution in other seasons, its distribution was concentrated at specific depths within the DCM during summer and autumn. Furthermore, the relative abundance of the LL and HL-I Prochlorococcus ecotypes, which thrive in low temperature and low light intensity, increased in DCM during summer and autumn (Figure 10H,E) [68]. In contrast, the LL and HL-I ecotypes displayed similar relative abundances in the winter season, possibly due to well mixing that brought them to the surface (Figure 10B,F). Recent studies have revealed that Prochlorococcus carries numerous nitrate assimilation genes and is abundant in or near nitracline in oligotrophic marine environments [55,69,70]. Therefore, this distinct difference in abundance is likely attributable to a clear stratification in the subsurface and deep nitracline during summer and autumn that allows the two Prochlorococcus ecotypes at deeper depths to rapidly utilize nutrient pulses [71].

5. Conclusions

The nutrient-scarce, warm, and high-salinity Kuroshio current has a profound impact on both the marine ecology of the northwestern Pacific Ocean and the global climate [72,73,74]. It is important to understand the characteristics of the fundamental microorganism community in different regions within the Kuroshio current. This study revealed that the composition of prokaryotic picoplankton was significantly different between the surface and DCM, except in January, which had a deep mixing zone. Synechococcus (dominated in Clade II) and Prochlorococcus (dominated in HL-II groups) were the major members of picocyanobacteria, which accounted for half of the Chl a in the Kuroshio current. The seasonal dynamics of Synechococcus were caused by water temperature, nutrient input, and euphotic zone, whereas Prochlorococcus had a positive correlation with nitracline depth. Thus, nutrients in situ rapidly and highly affected the seasonal dynamics of these fundamental microorganism groups. Under the scenario of global warming, the flow-speed of Western Boundary Currents would be decelerating [74]. It would affect the nutrient transport of Western Boundary Currents and in turn change the abundance and distribution of picoplankton in these regions. The long-term observation of the variations in picocyanobacterial assemblage and their relative biotic and abiotic factors can highlight their importance in the ocean, which is regulated by global warming [9].

Author Contributions

Conceptualization, C.-C.C.; Data curation, Y.-F.C. and C.-C.C.; Formal analysis, C.-C.C., I.-J.L., and C.-W.H.; Funding acquisition, Y.-F.C. and C.-C.C.; Methodology, C.-C.C., G.-C.G., I.-J.L., and C.-W.H.; Project administration, C.-C.C.; Supervision, C.-C.C.; Visualization, Y.-F.C. and C.-C.C.; Writing—original draft, Y.-F.C.; Writing—review & editing, Y.-F.C., C.-C.C., G.-C.G., I.-J.L., and C.-W.H. All authors have read and agreed to the published version of the manuscript.

Funding

This study was supported by the research grants MOST103-2611-M-019-011, MOST104-2611-M-019-011, MOST-111-2611-M-031-001, and NSTC-112-2611-M-031-001 from the Ministry of Science and Technology of Taiwan (now restructured as the National Science and Technology Council of Taiwan). This work was also financially supported by the Center of Excellence for the Oceans, National Taiwan Ocean University from The Featured Areas Research Center Program within the framework of the Higher Education Sprout Project by the Ministry of Education of Taiwan.

Institutional Review Board Statement

Not applicable.

Informed Consent Statement

Not applicable.

Data Availability Statement

The nucleotide sequences used in this study have been deposited in the Sequence Read Archive (SRA) database under BioProject accession number PRJNA904529.

Acknowledgments

We thank the captains and crew of the research vessels Ocean Researcher I and Ocean Researcher II for their assistance. We also thank the National Core Facility for Biopharmaceuticals and the National Center for High-performance Computing of National Applied Research Laboratories of Taiwan for providing computational resources and storage resources.

Conflicts of Interest

The authors declare no competing interests.

References

  1. Uitz, J.; Claustre, H.; Gentili, B.; Stramski, D. Phytoplankton class-specific primary production in the world’s oceans: Seasonal and interannual variability from satellite observations. Glob. Biogeochem. Cycles 2010, 24, GB3016. [Google Scholar] [CrossRef]
  2. Chavez, F.P.; Messié, M.; Pennington, J.T. Marine primary production in relation to climate variability and change. Annu. Rev. Mar. Sci. 2011, 3, 227–260. [Google Scholar] [CrossRef] [PubMed]
  3. Cai, L.; Li, H.; Deng, J.; Zhou, R.; Zeng, Q. Biological interactions with Prochlorococcus: Implications for the marine carbon cycle. Trends Microbiol. 2023, in press. [Google Scholar] [CrossRef] [PubMed]
  4. Richardson, T.L.; Jackson, G.A.; Ducklow, H.W.; Roman, M.R. Carbon fluxes through food webs of the eastern equatorial Pacific: An inverse approach. Deep Sea Res. Part I Oceanogr. Res. Pap. 2004, 51, 1245–1274. [Google Scholar] [CrossRef]
  5. Magazzu, G.; Decembrini, F. Primary production, biomass and abundance of phototrophic picoplankton in the Mediterranean Sea: A review. Aquat. Microb. Ecol. 1995, 9, 97–104. [Google Scholar] [CrossRef]
  6. Morán, X.A.G.; López-Urrutia, Á.; Calvo-Díaz, A.; Li, W.K. Increasing importance of small phytoplankton in a warmer ocean. Glob. Chang. Biol. 2010, 16, 1137–1144. [Google Scholar] [CrossRef]
  7. Cavicchioli, R.; Ripple, W.J.; Timmis, K.N.; Azam, F.; Bakken, L.R.; Baylis, M.; Behrenfeld, M.J.; Boetius, A.; Boyd, P.W.; Classen, A.T. Scientists’ warning to humanity: Microorganisms and climate change. Nat. Rev. Microbiol. 2019, 17, 569–586. [Google Scholar] [CrossRef]
  8. Flombaum, P.; Wang, W.-L.; Primeau, F.W.; Martiny, A.C. Global picophytoplankton niche partitioning predicts overall positive response to ocean warming. Nat. Geosci. 2020, 13, 116–120. [Google Scholar] [CrossRef]
  9. Zwirglmaier, K.; Jardillier, L.; Ostrowski, M.; Mazard, S.; Garczarek, L.; Vaulot, D.; Not, F.; Massana, R.; Ulloa, O.; Scanlan, D.J. Global phylogeography of marine Synechococcus and Prochlorococcus reveals a distinct partitioning of lineages among oceanic biomes. Environ. Microbiol. 2008, 10, 147–161. [Google Scholar] [CrossRef]
  10. Tai, V.; Palenik, B. Temporal variation of Synechococcus clades at a coastal Pacific Ocean monitoring site. ISME J. 2009, 3, 903–915. [Google Scholar] [CrossRef]
  11. Choi, D.H.; Noh, J.H.; Hahm, M.-S.; Lee, C.M. Picocyanobacterial abundances and diversity in surface water of the northwestern Pacific Ocean. Ocean Sci. J. 2011, 46, 265–271. [Google Scholar] [CrossRef]
  12. Post, A.F.; Penno, S.; Zandbank, K.; Paytan, A.; Huse, S.M.; Welch, D.M. Long term seasonal dynamics of Synechococcus population structure in the Gulf of Aqaba, Northern Red Sea. Front. Microbiol. 2011, 2, 131. [Google Scholar] [CrossRef] [PubMed]
  13. Zwirglmaier, K.; Heywood, J.L.; Chamberlain, K.; Woodward, E.M.S.; Zubkov, M.V.; Scanlan, D.J. Basin-scale distribution patterns of picocyanobacterial lineages in the Atlantic Ocean. Environ. Microbiol. 2007, 9, 1278–1290. [Google Scholar] [CrossRef] [PubMed]
  14. Kent, A.G.; Baer, S.E.; Mouginot, C.; Huang, J.S.; Larkin, A.A.; Lomas, M.W.; Martiny, A.C. Parallel phylogeography of Prochlorococcus and Synechococcus. ISME J. 2019, 13, 430–441. [Google Scholar] [CrossRef] [PubMed]
  15. Olson, R.J.; Chisholm, S.W.; Zettler, E.R.; Altabet, M.A.; Dusenberry, J.A. Spatial and temporal distributions of prochlorophyte picoplankton in the North Atlantic Ocean. Deep Sea Res. Part A Oceanogr. Res. Pap. 1990, 37, 1033–1051. [Google Scholar] [CrossRef]
  16. Johnson, Z.I.; Zinser, E.R.; Coe, A.; McNulty, N.P.; Woodward, E.M.S.; Chisholm, S.W. Niche partitioning among Prochlorococcus ecotypes along ocean-scale environmental gradients. Science 2006, 311, 1737–1740. [Google Scholar] [CrossRef]
  17. Zinser, E.R.; Coe, A.; Johnson, Z.I.; Martiny, A.C.; Fuller, N.J.; Scanlan, D.J.; Chisholm, S.W. Prochlorococcus ecotype abundances in the North Atlantic Ocean as revealed by an improved quantitative PCR method. Appl. Environ. Microb. 2006, 72, 723–732. [Google Scholar] [CrossRef]
  18. Zinser, E.R.; Johnson, Z.I.; Coe, A.; Karaca, E.; Veneziano, D.; Chisholm, S.W. Influence of light and temperature on Prochlorococcus ecotype distributions in the Atlantic Ocean. Limnol. Oceanogr. 2007, 52, 2205–2220. [Google Scholar] [CrossRef]
  19. Malmstrom, R.R.; Coe, A.; Kettler, G.C.; Martiny, A.C.; Frias-Lopez, J.; Zinser, E.R.; Chisholm, S.W. Temporal dynamics of Prochlorococcus ecotypes in the Atlantic and Pacific oceans. ISME J. 2010, 4, 1252–1264. [Google Scholar] [CrossRef]
  20. MacGregor-Chatwin, C.; Jackson, P.; Sener, M.; Chidgey, J.; Hitchcock, A.; Qian, P.; Mayneord, G.; Johnson, M.; Luthey-Schulten, Z.; Dickman, M. Membrane organization of photosystem I complexes in the most abundant phototroph on Earth. Nat. Plants 2019, 5, 879–889. [Google Scholar] [CrossRef]
  21. Penno, S.; Lindell, D.; Post, A.F. Diversity of Synechococcus and Prochlorococcus populations determined from DNA sequences of the N-regulatory gene ntcA. Environ. Microbiol. 2006, 8, 1200–1211. [Google Scholar] [CrossRef] [PubMed]
  22. Biller, S.J.; Berube, P.M.; Berta-Thompson, J.W.; Kelly, L.; Roggensack, S.E.; Awad, L.; Roache-Johnson, K.H.; Ding, H.; Giovannoni, S.J.; Rocap, G. Genomes of diverse isolates of the marine cyanobacterium Prochlorococcus. Sci. Data 2014, 1, 140034. [Google Scholar] [CrossRef] [PubMed]
  23. Chung, C.-C.; Chang, J.; Gong, G.-C.; Hsu, S.-C.; Chiang, K.-P.; Liao, C.-W. Effects of Asian dust storms on Synechococcus populations in the subtropical Kuroshio Current. Mar. Biotechnol. 2011, 13, 751–763. [Google Scholar] [CrossRef]
  24. Chung, C.-C.; Gong, G.-C.; Huang, C.-Y.; Lin, J.-Y.; Lin, Y.-C. Changes in the Synechococcus assemblage composition at the surface of the east China Sea due to flooding of the Changjiang river. Microb. Ecol. 2015, 70, 677–688. [Google Scholar] [CrossRef] [PubMed]
  25. Qiu, B.; Lukas, R. Seasonal and interannual variability of the North Equatorial Current, the Mindanao Current, and the Kuroshio along the Pacific western boundary. J. Geophys. Res. Ocean. 1996, 101, 12315–12330. [Google Scholar] [CrossRef]
  26. Qiu, B. Kuroshio and Oyashio currents. In Encyclopedia of Ocean Sciences; Elsevier: Amsterdam, The Netherlands, 2001; pp. 61–72. [Google Scholar]
  27. Rudnick, D.L.; Jan, S.; Centurioni, L.; Lee, C.M.; Lien, R.-C.; Wang, J.; Lee, D.-K.; Tseng, R.-S.; Kim, Y.Y.; Chern, C.-S. Seasonal and mesoscale variability of the Kuroshio near its origin. Oceanography 2011, 24, 52–63. [Google Scholar] [CrossRef]
  28. Guo, Y. The Kuroshio. Part II. Primary productivity and phytoplankton. Oceanogr. Mar. Biol. Annu. Rev. 1991, 29, 155–189. [Google Scholar]
  29. Chen, C.-C.; Meng, P.-J.; Hsieh, C.-H.; Jan, S. Plankton Community Respiration and Particulate Organic Carbon in the Kuroshio East of Taiwan. Plants 2022, 11, 2909. [Google Scholar] [CrossRef]
  30. Shen, M.-L.; Tseng, Y.-H.; Jan, S. The formation and dynamics of the cold-dome off northeastern Taiwan. J. Mar. Syst. 2011, 86, 10–27. [Google Scholar] [CrossRef]
  31. Chen, C.-C.; Hsu, S.-C.; Jan, S.; Gong, G.-C. Episodic events imposed on the seasonal nutrient dynamics of an upwelling system off northeastern Taiwan. J. Mar. Syst. 2015, 141, 128–135. [Google Scholar] [CrossRef]
  32. Wong, G.T.; Chao, S.-Y.; Li, Y.-H.; Shiah, F.-K. The Kuroshio edge exchange processes (KEEP) study—An introduction to hypotheses and highlights. Cont. Shelf Res. 2000, 20, 335–347. [Google Scholar] [CrossRef]
  33. Hung, C.-C.; Gong, G.-C. Biogeochemical responses in the southern East China Sea after typhoons. Oceanography 2011, 24, 42–51. [Google Scholar] [CrossRef]
  34. Gong, G.-C.; Shiah, F.-K.; Liu, K.-K.; Chuang, W.-S.; Chang, J. Effect of the Kuroshio intrusion on the chlorophyll distribution in the southern East China Sea during spring 1993. Cont. Shelf Res. 1997, 17, 79–94. [Google Scholar] [CrossRef]
  35. Gong, G.-C.; Chang, J.; Wen, Y.-H. Estimation of annual primary production in the Kuroshio waters northeast of Taiwan using a photosynthesis-irradiance model. Deep Sea Res. Part I Oceanogr. Res. Pap. 1999, 46, 93–108. [Google Scholar] [CrossRef]
  36. Lai, C.; Wu, C.; Chuang, C.; Tai, J.; Lee, K.; Kuo, H.; Shiah, F. Phytoplankton and Bacterial Responses to Monsoon-Driven Water Masses Mixing in the Kuroshio Off the East Coast of Taiwan. Front. Mar. Sci. 2021, 8, 707807. [Google Scholar] [CrossRef]
  37. Chen, C.-C.; Lu, C.-Y.; Jan, S.; Hsieh, C.-h.; Chung, C.-C. Effects of the coastal uplift on the Kuroshio ecosystem, Eastern Taiwan, the western boundary current of the North Pacific Ocean. Front. Mar. Sci. 2022, 9, 796187. [Google Scholar] [CrossRef]
  38. Chen, Y.-L.L. Comparisons of primary productivity and phytoplankton size structure in the marginal regions of southern East China Sea. Cont. Shelf Res. 2000, 20, 437–458. [Google Scholar] [CrossRef]
  39. Visintini, N.; Martiny, A.C.; Flombaum, P. Prochlorococcus, Synechococcus, and picoeukaryotic phytoplankton abundances in the global ocean. Limnol. Oceanogr. Lett. 2021, 6, 207–215. [Google Scholar] [CrossRef]
  40. Mioduchowska, M.; Pawłowska, J.; Mazanowski, K.; Weydmann-Zwolicka, A. Contrasting Marine Microbial Communities of the Fram Strait with the First Confirmed Record of Cyanobacteria Prochlorococcus marinus in the Arctic Region. Biology 2023, 12, 1246. [Google Scholar] [CrossRef]
  41. Fan, L.-F.; Chow, C.H.; Gong, G.-C.; Chou, W.-C. Surface Seawater p CO2 Variation after a Typhoon Passage in the Kuroshio off Eastern Taiwan. Water 2022, 14, 1326. [Google Scholar] [CrossRef]
  42. Chan, Y.F.; Chung, C.C.; Gong, G.C.; Hsu, C.W. Spatial variation of abundant picoeukaryotes in the subtropical Kuroshio Current in winter. Mar. Ecol. 2020, 41, e12579. [Google Scholar] [CrossRef]
  43. Morel, A.; Ahn, Y.-H.; Partensky, F.; Vaulot, D.; Claustre, H. Prochlorococcus and Synechococcus: A comparative study of their optical properties in relation to their size and pigmentation. J. Mar. Res. 1993, 51, 617–649. [Google Scholar] [CrossRef]
  44. Pai, S.-C.; Yang, C.-C.; Riley, J.P. Formation kinetics of the pink azo dye in the determination of nitrite in natural waters. Anal. Chim. Acta 1990, 232, 345–349. [Google Scholar] [CrossRef]
  45. Gong, G.-C.; Liu, K.-K.; Pai, S.-C. Prediction of nitrate concentration from two end member mixing in the southern East China Sea. Cont. Shelf Res. 1995, 15, 827–842. [Google Scholar] [CrossRef]
  46. Gong, G.-C.; Chen, Y.-L.L.; Liu, K.-K. Chemical hydrography and chlorophyll a distribution in the East China Sea in summer: Implications in nutrient dynamics. Cont. Shelf Res. 1996, 16, 1561–1590. [Google Scholar] [CrossRef]
  47. Marañón, E.; Van Wambeke, F.; Uitz, J.; Boss, E.S.; Dimier, C.; Dinasquet, J.; Engel, A.; Haëntjens, N.; Pérez-Lorenzo, M.; Taillandier, V. Deep maxima of phytoplankton biomass, primary production and bacterial production in the Mediterranean Sea. Biogeosciences 2021, 18, 1749–1767. [Google Scholar] [CrossRef]
  48. Crombet, Y.; Leblanc, K.; Queguiner, B.; Moutin, T.; Rimmelin, P.; Ras, J.; Claustre, H.; Leblond, N.; Oriol, L.; Pujo-Pay, M. Deep silicon maxima in the stratified oligotrophic Mediterranean Sea. Biogeosciences 2011, 8, 459–475. [Google Scholar] [CrossRef]
  49. Marañón, E.; Behrenfeld, M.J.; González, N.; Mouriño, B.; Zubkov, M.V. High variability of primary production in oligotrophic waters of the Atlantic Ocean: Uncoupling from phytoplankton biomass and size structure. Mar. Ecol. Prog. Ser. 2003, 257, 1–11. [Google Scholar] [CrossRef]
  50. Klindworth, A.; Pruesse, E.; Schweer, T.; Peplies, J.; Quast, C.; Horn, M.; Glöckner, F.O. Evaluation of general 16S ribosomal RNA gene PCR primers for classical and next-generation sequencing-based diversity studies. Nucleic Acids Res. 2013, 41, e1. [Google Scholar] [CrossRef]
  51. Martins, I.; Bettencourt, R.; Colaco, A.; Sarradin, P.M.; Santos, R.S.; Cosson, R. The influence of nutritional conditions on metal uptake by the mixotrophic dual symbiosis harboring vent mussel Bathymodiolus azoricus. Comp. Biochem. Phys. C 2011, 153, 40–52. [Google Scholar] [CrossRef]
  52. Callahan, B.J.; McMurdie, P.J.; Rosen, M.J.; Han, A.W.; Johnson, A.J.A.; Holmes, S.P. DADA2: High-resolution sample inference from Illumina amplicon data. Nat. Methods 2016, 13, 581–583. [Google Scholar] [CrossRef] [PubMed]
  53. Fuller, N.J.; Marie, D.; Partensky, F.; Vaulot, D.; Post, A.F.; Scanlan, D.J. Clade-specific 16S ribosomal DNA oligonucleotides reveal the predominance of a single marine Synechococcus clade throughout a stratified water column in the Red Sea. Appl. Environ. Microb. 2003, 69, 2430–2443. [Google Scholar] [CrossRef] [PubMed]
  54. Linacre, L.; Lara-Lara, R.; Camacho-Ibar, V.; Herguera, J.C.; Bazán-Guzmán, C.; Ferreira-Bartrina, V. Distribution pattern of picoplankton carbon biomass linked to mesoscale dynamics in the southern Gulf of Mexico during winter conditions. Deep Sea Res. Part I Oceanogr. Res. Pap. 2015, 106, 55–67. [Google Scholar] [CrossRef]
  55. Linacre, L.; Durazo, R.; Camacho-Ibar, V.; Selph, K.; Lara-Lara, J.; Mirabal-Gómez, U.; Bazán-Guzmán, C.; Lago-Lestón, A.; Fernández-Martín, E.; Sidón-Ceseña, K. Picoplankton carbon biomass assessments and distribution of Prochlorococcus ecotypes linked to Loop Current Eddies during summer in the southern Gulf of Mexico. J. Geophys. Res. Ocean. 2019, 124, 8342–8359. [Google Scholar] [CrossRef]
  56. Selph, K.E.; Swalethorp, R.; Stukel, M.R.; Kelly, T.B.; Knapp, A.N.; Fleming, K.; Hernandez, T.; Landry, M.R. Phytoplankton community composition and biomass in the oligotrophic Gulf of Mexico. J. Plankton Res. 2022, 44, 618–637. [Google Scholar] [CrossRef]
  57. Liu, K.; Suzuki, K.; Chen, B.; Liu, H. Are temperature sensitivities of Prochlorococcus and Synechococcus impacted by nutrient availability in the subtropical northwest Pacific? Limnol. Oceanogr. 2021, 66, 639–651. [Google Scholar] [CrossRef]
  58. Chung, C.-C.; Gong, G.-C. Attribution of the growth of a distinct population of Synechococcus to the coverage of lateral water on an upwelling. Terr. Atmos. Ocean. Sci. 2019, 30, 575–587. [Google Scholar] [CrossRef]
  59. Paerl, R.W.; Johnson, K.S.; Welsh, R.M.; Worden, A.Z.; Chavez, F.P.; Zehr, J.P. Differential distributions of Synechococcus subgroups across the California current system. Front. Microbiol. 2011, 2, 59. [Google Scholar] [CrossRef]
  60. Choi, D.H.; Noh, J.H.; Shim, J. Seasonal changes in picocyanobacterial diversity as revealed by pyrosequencing in temperate waters of the East China Sea and the East Sea. Aquat. Microb. Ecol. 2013, 71, 75–90. [Google Scholar] [CrossRef]
  61. Choi, D.H.; Selph, K.E.; Noh, J.H. Niche partitioning of picocyanobacterial lineages in the oligotrophic northwestern Pacific Ocean. Algae 2015, 30, 223–232. [Google Scholar] [CrossRef]
  62. Zhao, Y.; Yu, R.C.; Kong, F.Z.; Wei, C.J.; Liu, Z.; Geng, H.X.; Dai, L.; Zhou, Z.X.; Zhang, Q.C.; Zhou, M.J. Distribution patterns of picosized and nanosized phytoplankton assemblages in the East China Sea and the Yellow Sea: Implications on the impacts of Kuroshio intrusion. J. Geophys. Res. Ocean. 2019, 124, 1262–1276. [Google Scholar] [CrossRef]
  63. Chan, Y.-F.; Chiang, P.-W.; Tandon, K.; Rogozin, D.; Degermendzhi, A.; Zykov, V.; Tang, S.-L. Spatiotemporal Changes in the Bacterial Community of the Meromictic Lake Uchum, Siberia. Microb. Ecol. 2020, 81, 357–369. [Google Scholar] [CrossRef] [PubMed]
  64. Partensky, F.; Garczarek, L. Prochlorococcus: Advantages and limits of minimalism. Annu. Rev. Mar. Sci. 2010, 2, 305–331. [Google Scholar] [CrossRef] [PubMed]
  65. Li, W. Composition of ultraphytoplankton in the central North Atlantic. Mar. Ecol. Prog. Ser. 1995, 122, 1–8. [Google Scholar] [CrossRef]
  66. Landry, M.R.; Selph, K.E.; Stukel, M.R.; Swalethorp, R.; Kelly, T.B.; Beatty, J.L.; Quackenbush, C.R. Microbial food web dynamics in the oceanic Gulf of Mexico. J. Plankton Res. 2022, 44, 638–655. [Google Scholar] [CrossRef]
  67. Otero-Ferrer, J.L.; Cermeño, P.; Bode, A.; Fernández-Castro, B.; Gasol, J.M.; Morán, X.A.G.; Marañon, E.; Moreira-Coello, V.; Varela, M.M.; Villamaña, M. Factors controlling the community structure of picoplankton in contrasting marine environments. Biogeosciences 2018, 15, 6199–6220. [Google Scholar] [CrossRef]
  68. Larkin, A.A.; Blinebry, S.K.; Howes, C.; Lin, Y.; Loftus, S.E.; Schmaus, C.A.; Zinser, E.R.; Johnson, Z.I. Niche partitioning and biogeography of high light adapted Prochlorococcus across taxonomic ranks in the North Pacific. ISME J. 2016, 10, 1555–1567. [Google Scholar] [CrossRef]
  69. Berube, P.M.; Coe, A.; Roggensack, S.E.; Chisholm, S.W. Temporal dynamics of P rochlorococcus cells with the potential for nitrate assimilation in the subtropical A tlantic and P acific oceans. Limnol. Oceanogr. 2016, 61, 482–495. [Google Scholar] [CrossRef]
  70. Berube, P.M.; Rasmussen, A.; Braakman, R.; Stepanauskas, R.; Chisholm, S.W. Emergence of trait variability through the lens of nitrogen assimilation in Prochlorococcus. eLife 2019, 8, e41043. [Google Scholar] [CrossRef]
  71. Martiny, A.C.; Tai, A.P.; Veneziano, D.; Primeau, F.; Chisholm, S.W. Taxonomic resolution, ecotypes and the biogeography of Prochlorococcus. Environ. Microbiol. 2009, 11, 823–832. [Google Scholar] [CrossRef]
  72. Day, R.H. The quantitative distribution and characteristics of neuston plastic in the North Pacific Ocean, 1985–1988. In Proceedings of the Second International Conference on Marine Debris, Honolulu, HI, USA, 2–7 April 1989; pp. 247–266. [Google Scholar]
  73. Nagai, T.; Durán, G.S.; Otero, D.A.; Mori, Y.; Yoshie, N.; Ohgi, K.; Hasegawa, D.; Nishina, A.; Kobari, T. How the Kuroshio Current delivers nutrients to sunlit layers on the continental shelves with aid of near-inertial waves and turbulence. Geophys. Res. Lett. 2019, 46, 6726–6735. [Google Scholar] [CrossRef]
  74. Sen Gupta, A.; Stellema, A.; Pontes, G.M.; Taschetto, A.S.; Vergés, A.; Rossi, V. Future changes to the upper ocean Western Boundary Currents across two generations of climate models. Sci. Rep. 2021, 11, 9538. [Google Scholar] [CrossRef] [PubMed]
Figure 1. Sample collection sites (K1–K9) in eastern Taiwan. The words in red indicate the sampling stations with environmental DNA data.
Biology 12 01424 g001
Figure 2. Vertical profiles of water temperature (°C, AD), nitrate (μM, EH), phosphate (μM, IL), and Chl a concentration (mg m−3, MP) along Stations K1 to K9 during October 2012 and January, April, and July 2013. The black lines in (AD) are salinity. The nitrate clines (black line) are indicated in (FI).
Biology 12 01424 g002
Figure 3. Vertical profiles of the abundance of Synechococcus (Syn, AD), Prochlorococcus (Pro, EH), and picoeukaryotes (PE, IL) along Stations K1 to K9 during October 2012 and January, April, and July 2013.
Biology 12 01424 g003
Figure 4. Chl a content in the (A) Synechococcus, (B) Prochlorococcus, and (C) picocyanobacteria (Synechococcus and Prochlorococcus) of total Chl a (%) in the upper water column (≤100 m) from September 2009, October 2012, January, April, July 2013, and August 2015. Standard deviation is shown.
Biology 12 01424 g004
Figure 5. Redundancy analysis (RDA) of the relationship of environmental factors (black dashed line arrows) and total abundance of different picocyanobacteria groups (red line arrows) in the upper water column (≤100 m) of different stations during the four sampling months.
Biology 12 01424 g005
Figure 6. Dendrogram from hierarchical cluster analysis for all ASVs from surface (dots rectangle) and DCM (black rectangle) in each station of different months (words in color). The Bray–Curtis similarity index is used for clustering.
Biology 12 01424 g006
Figure 7. The hierarchical order fraction (%) of different bacterial communities (in order level) from the surface (AD) and DCM (EH) at Stations K2, K4, K5, K6, and K8 during October 2012 (A,E), January (B,F), April (C,G), and July 2013 (D,H).
Biology 12 01424 g007
Figure 8. The hierarchical order fraction (%) of Synechococcus and Prochlorococcus from the surface (AD) and DCM (EH) at Stations K2, K4, K5, K6, and K8 during October 2012 (A,E), January (B,F), April (C,G), and July 2013 (D,H).
Biology 12 01424 g008
Figure 9. The hierarchical order fraction (%) of Synechococcus from the surface (AD) and DCM (EH) at Stations K2, K4, K5, K6, and K8 during October 2012 (A,E), January (B,F), April (C,G), and July 2013 (D,H). Different colors indicate different clades (clade-I, clade-II, clade-III, clade-VII, and clade-X).
Biology 12 01424 g009
Figure 10. The hierarchical order fraction (%) of Prochlorococcus from the surface (AD) and DCM (EH) at Stations K2, K4, K5, K6, and K8 during October 2012 (A,E), January (B,F), April (C,G), and July 2013 (D,H). The three different colors indicate high light-I, high light-II, and low light groups.
Biology 12 01424 g010
Table 1. The results of 16S rRNA gene V3-V4 sequencing and the indices of species richness (ACE) and diversity (Shannon).
TimeStationReadsASVACEShannon
October 2021K4161,6629969974.74
K6199,278116211624.95
K8319,142155115525.11
January 2013K2427,192208220835.71
K4407,216180718085.01
K5976,914301230145.38
K6272,391159015905.22
K8367,891176417655.36
April 2013K2291,525133513355.07
K4206,446123312335.16
K5312,912140914094.73
K6294,990123512354.65
K8222,253120112014.88
July 2013K2251,552123512364.97
K4283,202113911394.75
K5289,476113411341.88
K6278,805116111624.85
K8626,538189818995.03
Disclaimer/Publisher’s Note: The statements, opinions and data contained in all publications are solely those of the individual author(s) and contributor(s) and not of MDPI and/or the editor(s). MDPI and/or the editor(s) disclaim responsibility for any injury to people or property resulting from any ideas, methods, instructions or products referred to in the content.