Article

Identification of CNGCs in Glycine max and Screening of Related Resistance Genes after Fusarium solani Infection

1
College of Plant Science and Technology, Beijing University of Agriculture/Beijing Key Laboratory of New Agricultural Technology in Agriculture Application/National Demonstration Center for Experimental Plant Production Education, Beijing 102206, China
2
Key Laboratory for Northern Urban Agriculture of Ministry of Agriculture and Rural Affairs, Beijing University of Agriculture, Beijing 102206, China
3
College of Grassland Science and Technology, China Agricultural University, Beijing 100193, China
*
Authors to whom correspondence should be addressed.
Biology 2023, 12(3), 439; https://doi.org/10.3390/biology12030439
Submission received: 3 February 2023 / Revised: 9 March 2023 / Accepted: 10 March 2023 / Published: 12 March 2023
(This article belongs to the Special Issue Recent Advances in Molecular Plant Pathology)

Abstract

:

Simple Summary

Glycine max diseases have always been an issue in China, with root rot caused by Fusarium solani being the most serious issue in this regard. Here, the mechanism of action of genes showing F. solani resistance was studied by analysing the differential expression of the transcriptome of this plant after pathogen infection to provide a theoretical reference for the breeding of disease-resistant soybeans. Thus, four genes that regulate the concentration of inorganic ions inside and outside the membrane via the transmembrane ion channel and participate in stress regulation via signal transduction were identified.

Abstract

Cyclic nucleotide-gated channels (CNGCs), non-selective cation channels localised on the plasmalemma, are involved in growth, development, and regulatory mechanisms in plants during adverse stress. To date, CNGC gene families in multiple crops have been identified and analysed. However, there have been no systematic studies on the evolution and development of CNGC gene families in legumes. Therefore, in the present study, via transcriptome analysis, we identified 143 CNGC genes in legumes, and thereafter, classified and named them according to the grouping method used for Arabidopsis thaliana. Functional verification for disease stress showed that four GmCNGCs were specifically expressed in the plasmalemma during the stress process. Further, functional enrichment analysis showed that their mode of participation and coordination included inorganic ion concentration regulation inside and outside the membrane via the transmembrane ion channel and participation in stress regulation via signal transduction. The CNGC family genes in G. max involved in disease stress were also identified and physiological stress response and omics analyses were also performed. Our preliminary results revealed the basic laws governing the involvement of CNGCs in disease resistance in G. max, providing important gene resources and a theoretical reference for the breeding of resistant soybean.

1. Introduction

Glycine max, an important grain, oil source, and feed crop worldwide, has always attracted considerable interest globally. Its market demand directly reflects the living standards of residents, and it plays an important role in meeting grain, oil, and protein needs [1,2]. However, during its growth and development, it faces various adverse stresses, which considerably affect its yield and quality. This situation can be primarily attributed to the fact that the growth and development stages of G. max in China are dominated by a mild and rainy climate, with frequent diseases, root rot being the most serious issue in this regard [3].
Ca2+ transduction through Ca2+ channels is an important regulatory pathway in plants during response to stress. To maintain physiological activity in the face of adversity, plant surface cells pump Ca2+ ions from locations with high concentrations to locations with low concentrations through Ca2+ channels. Thus, the Ca2+ ion concentration in the membrane increases instantaneously and coupled with the duration and amplitude of this process, calcium signals are generated. Subsequently, signal transmission and body regulation are realised via the conversion of these chemical and electrical signals. Alternatively, the Ca2+ ions can combine with calmodulin (CaM) to form the Ca2+-CaM complex, which directly acts on bodily regulatory systems.
Cyclic nucleotide-gated channels (CNGCs), which are nonselective cation channels located on the plasma membrane, are important pathways for conducting Ca2+ ions in signal transduction [4]. Plant CNGCs are composed of six transmembrane domains (S1–S6), a pore region between the fifth and sixth domains (P), and C-terminal CaMB and CNBD [5]. Specifically, CNBD, the most conserved region of CNGCs, consists of the spanning phosphate-binding cassette (PBC) and the “hinge” region (adjacent to the PBC). Notably, PBC binds to the sugar and phosphate groups of cyclic nucleotide ligands [6], and the “hinge” region contributes to ligand binding efficacy and selectivity [7]. Studies have also shown that the carboxyl tails of CNGCs in several plants bind CaM in a Ca2+ dependent manner [8,9,10,11]. Further, the CNGC gene family plays an irreplaceable role in plant growth and development, as well as in plant abiotic and biological stress response processes. For example, the CNGC gene family is involved in seed germination during plant growth and development. It is also essential for polarized tip growth of pollen [12], root hair tip growth [13], leaf senescence [14], and rhizobia and mycorrhizal symbiosis in leguminous roots [15]. Additionally, it plays an important role in plant response to salt stress [16], heat stress [17], drought stress [18], heavy metal ion stress [19], and coping with pathogen invasion [20,21].
Even though the CNGC gene family in many plants has been identified, its role in G. max has not yet been sufficiently studied. Therefore, in the present study, we identified the CNGC gene family of G. max, and investigated its evolution and development. We also identified the whole genome of the CNGC gene family of six other legumes (Medicago truncatula, Cicer arietinum, Cajanus cajan (pigeon pea), Lotus japonicus, Vigna angularis, and Phaseolus vulgaris) that have been sequenced. Subsequently, the G. max CNGC genes involved in two kinds of disease stress responses were screened via the assessment of G. max disease stress and gene expression status. We believe that the results of this study will serve as a foundation for further research and provide direction for the subsequent breeding of stress resistant G. max.

2. Materials and Methods

2.1. Identification and Phylogenetic Analysis

To investigate the evolutionary relationships among members of the CNGC gene family in G. max, we used seven leguminous species. The protein sequences of Arabidopsis thaliana, G. max, M. truncatula, P. vulgaris, and C. cajan (pigeon pea) were obtained from the Ensembl database (http://plants.ensembl.org/index. html accessed on 2 February 2023), while those of L. japonicus, V. angularis, C. arietinum were obtained from the GigaDB dataset (http://gigadb.org/dataset/100028 accessed on 2 February 2023). Further, the CNGC protein sequences of A. thaliana was used as the query object, and the potential candidate genes were obtained by performing a local BLASTP search, considering an E value of 1 × 10⁻¹⁰. The protein sequences were then uploaded to the Conserved Domain Database (CDD) (http://www.ncbi.nlm.nih.gov/Structure/cdd/wrpsb.cgi/ accessed on 1 March 2021), SMART database (http://smart.embl-heide lberg.de/ accessed on 3 March 2021), and PFAM database (http://pfam.xfam.org/ accessed on 4 March 2021). Finally, CNGC genes containing two basic domains and one CNGC-specific motif were identified in the genomes of the seven legumes [22,23,24,25,26].
To analyse the evolutionary relationships among the members of the CNGC gene family in G. max, we used the NJ method of MEGA-X, set the bootstrap value at 1000, and constructed a phylogenetic tree based on the full-length sequence of the CNGC protein in A. thaliana and the seven other legumes [22,23,24].

2.2. Location of CNGC Genes on Chromosomes and Conserved Motifs

The locations of each CNGC gene on 20 G. max chromosomes were determined using the Ensembl plant database, and the distribution information map of the genes on these chromosomes was established using MapChart. Further, the MEME online program (http://meme.nbcr.net/meme/intro.html accessed on 23 May 2021) for protein sequence analysis was used to identify the conserved motifs in the CNGC proteins in the leguminous plants [23,27].

2.3. Collinear Analysis of CNGC Genes

The non-synonymous substitution rate (Ka), synonymous substitution rate (Ks), and the Ka/Ks ratio were calculated using KaKs Calculator v2.0. Further, the NG method was used to study dispersion [28], and divergence time (T) was calculated using the formula: T = Ks/(2 × 6.1 × 10−9) × 10−6 million years ago (MYA) [29,30,31]. To further infer the phylogenetic mechanism of G. max and the other selected species and obtain a collinear relationship between homologous CNGC genes, MCScanX software was used to construct collinear analysis diagrams [32].

2.4. Analysis of Cis-Acting Element

To clarify the possible regulatory mechanism of CNGC genes in abiotic or biological stress responses, we used PlantCARE (https://bioinformatics.psb.ugent.be/webtools/plantcare/html/ accessed on 24 May 2021) to analyse the promoter sequences online and determined the cis-regulatory elements in the promoter region within 1500 bp upstream of the start codon of the coding region of CNGC genes [33].

2.5. Pathogen Isolation, Purification, and Morphological Identification

Seedlings with root rot were selected for pathogen isolation and culture. Specifically, diseased G. max root samples were isolated using the tissue isolation method. Thereafter, the root area around the boundary between the diseased and healthy area was cut using scissors and treated with 75% ethanol for 30 s followed by NaClO treatment for 3 min [34]. This was followed by rinsing thrice with sterilized water and drying on sterilised filter paper. Next, the samples were placed on a potato dextrose agar plate and cultured upside down in a constant temperature incubator at 28 °C after sealing [34,35]. After the colonies had grown, isolated pathogens were purified via single-spore isolation on the PDA plates [34]. Next, the morphological characteristics of the pathogens were observed regularly until the colonies grew to fully occupy the PDA plate. The morphological identification of the pathogens was conducted considering the morphology of the colonies and spores.

2.6. Pathogenicity Detection

The pathogenicity of the isolated fungi was determined according to Koch’s law. The cultivar tested in this regard was “Zhonghuang 13”. In brief, G. max seedlings of similar size and health status were selected and disinfected using 75% alcohol for subsequent use. Next, the fungus was inoculated with PDA culture medium, and after the fungal colonies grew to occupy 2/3 of the dish, they were crushed via a hole punch. Next, they were placed in a conical flask containing 100 mL of PDB medium and incubated at 25 °C for 5–7 days at a rotation speed of 180 rpm. Microscopic examination was then performed every other day to observe sporulation. At the end of this incubation period, a conidial suspension was prepared and centrifuged. The sediment thus obtained was then diluted with sterile water to a spore concentration of approximately 5 × 10⁵ CFU/mL. G. max seedlings were then immersed in spore suspension and observed daily. Conversely, the seedlings infused with the PDB medium were cultured in a constant temperature incubator at 28 °C. The disease condition of the root system was observed daily, and photos were taken for subsequent analysis. After disease onset, the diseased tissue was isolated and cultured again to determine whether the same pathogen was present [35].

2.7. Molecular Identification of Pathogenic Fungi

Pure cultured hyphal DNA obtained via isolation and purification was extracted using a fungal genomic DNA rapid extraction kit and used as a template for the PCR amplification of ITS gene fragments with primers, ITS1/ITS4. The reaction conditions were as follows: pre-denaturing at 95 °C for 4 min, denaturing at 95 °C for 30 s, annealing at 56 °C for 30 s, extending at 72 °C for 45 s, for 35 cycles, and finally, extending at 72 °C for 7 min [36,37,38]. The PCR amplification products were detected via 1% agarose gel electrophoresis and sequenced by Beijing Bomaide Gene Technology Co., Ltd. (Beijing, China). The taxonomic status of the pathogens was determined via BLAST analysis of the NCBI database (https://www.ncbi.nlm.nih.gov/ accessed on 5 August 2021), followed by the downloading of relevant crop sequences based on alignment, and finally, the construction of a phylogenetic tree using the adjacency method of MEGA-X (https://www.megasoftware.net/ accessed on 5 August 2021). Thus, the taxonomic status of the pathogens was determined.

2.8. Pathogen Inoculation and Sampling Time

The Zhonghuang 13 cultivar was selected as the test plant. Specifically, pathogens were inoculated via root irrigation after the trilfoil period of the plant. After inoculation for 1, 3, and 7 days, root samples were selected for transcriptome detection and analysis [39].

2.9. Screening of Differentially Expressed Genes (DEGs)

To study the changes in gene expression in the different samples or groups, DEGs owing to pathogen stress were identified. Further, the expression matrix of all the samples at the gene level was obtained based on the quantitative analysis of gene expression data. The DEGs were analysed using the edgeR package. The input data for differential gene expression analysis was the read count data obtained from gene expression level analysis. This data analysis process was divided into three main steps, namely, read count normalization, the calculation of hypothesis testing probability (p-value) according to the model, and multiple hypothesis testing based on the obtained p-value to obtain the q-value (multiple hypothesis testing value) [40].

2.10. Analysis of Enrichment

TopGO software was used to conduct GO enrichment analysis for the DEGs, count the number of genes associated with each GO term that showed significant enrichment, and conduct secondary classification statistics. The first 20 terms significantly enriched were selected and displayed using a bar graph [41]. Further, KOBAS (V3.0) software was used for KEGG enrichment analysis. Thus, the first 20 significantly enriched pathways (less than 20% of all the enriched pathway terms) were selected for statistical analysis [42].

2.11. Protein–protein Interaction (PPI) Prediction

To clarify whether the screened DEGs interacted with stress-related genes, PPI analysis was performed using the interaction relationships in the STRING protein interaction database (http://string-db.org/ accessed on 5 January 2022) [43].

3. Results

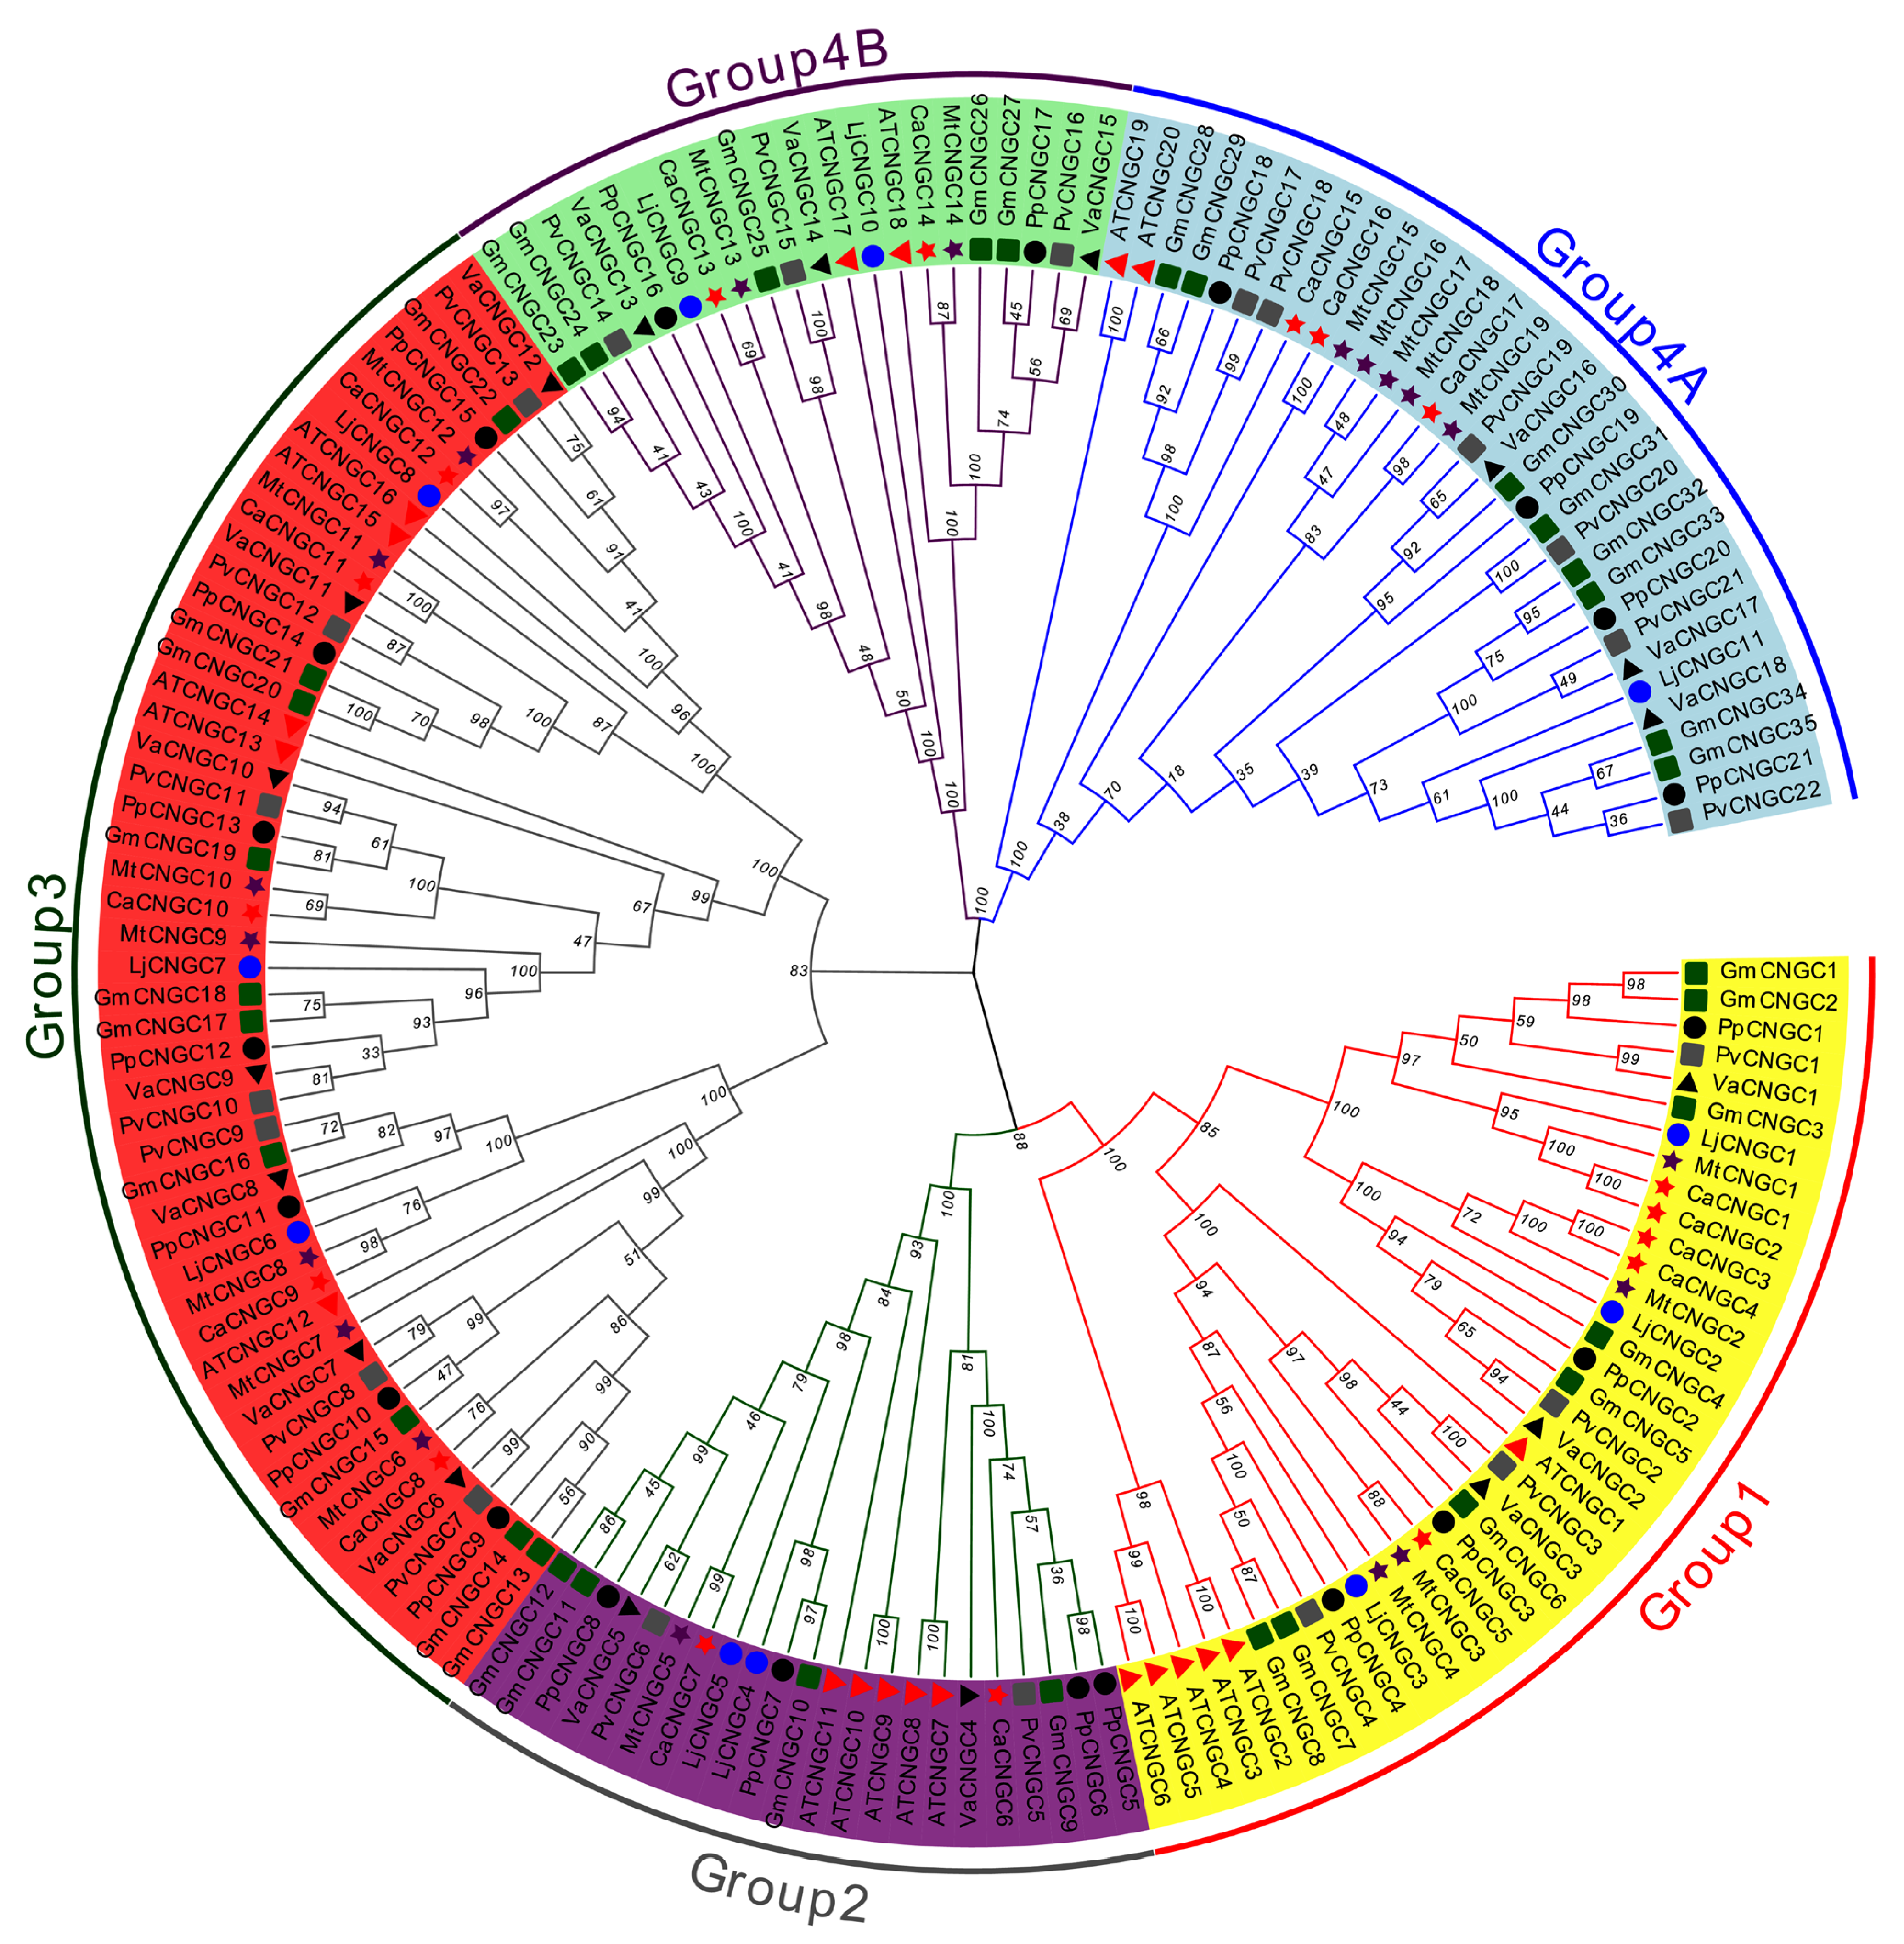
3.1. Identification and Phylogenetic Analysis of the CNGC Gene Family

Based on 20 A. thaliana CNGC protein sequences, we identified 143 CNGC genes containing two basic domains (PF00520/PF07885 and PF00027) and one CNGC-specific motif in legumes (Table 1). The 143 CNGC genes identified were distributed as follows: 35 from G. max, 17 from C. arietinum, 11 from L. japonicus, 19 from M. truncatula, 22 from P. vulgaris, 21 from pigeon pea, and 18 from V. angularis. The use of ExPASy (http://prosite.expasy.org/ accessed on 4 March 2021) showed that the 143 CNGC proteins had different physical and chemical properties (Table S1). Their amino acid-lengths varied from 418 (PpCNGC19) to 778 (MtCNGC18), their molecular weights varied from 5.6 kDa (PpCNGC5) to 91.1 kDa (GmTCP39), and their isoelectric points varied between 7.9 (CaCNGC4) and 10.37 (LjCNGC9, ATCNGC19).
To analyse the evolutionary relationships among the genes in the CNGC family of G. max, we constructed a phylogenetic tree based on the structure and classification system used for A. thaliana sequences (Figure 1). Thus, considering the seven legumes involved in this study, we observed that the genes predominantly belonged to Group III. Specifically, G. max, C. arietinum, L. japonicus, M. truncatula, P. vulgaris, pigeon pea, and V. angularis accounted for 28.57%, 29.41%, 27.27%, 36.84%, 31.82%, 33.33%, and 38.89% of the evolutionary relationships, respectively. Further, relative to the genes in the CNGC family for G. max and L. japonicus, those in the other five legumes were similar, but different from those two. In general, the CNGC protein family of P. vulgaris showed a close relation with that of V. angularis. Further, those of C. arietinum and G. max showed close relationships with those of M. truncatula and pigeon pea, respectively.

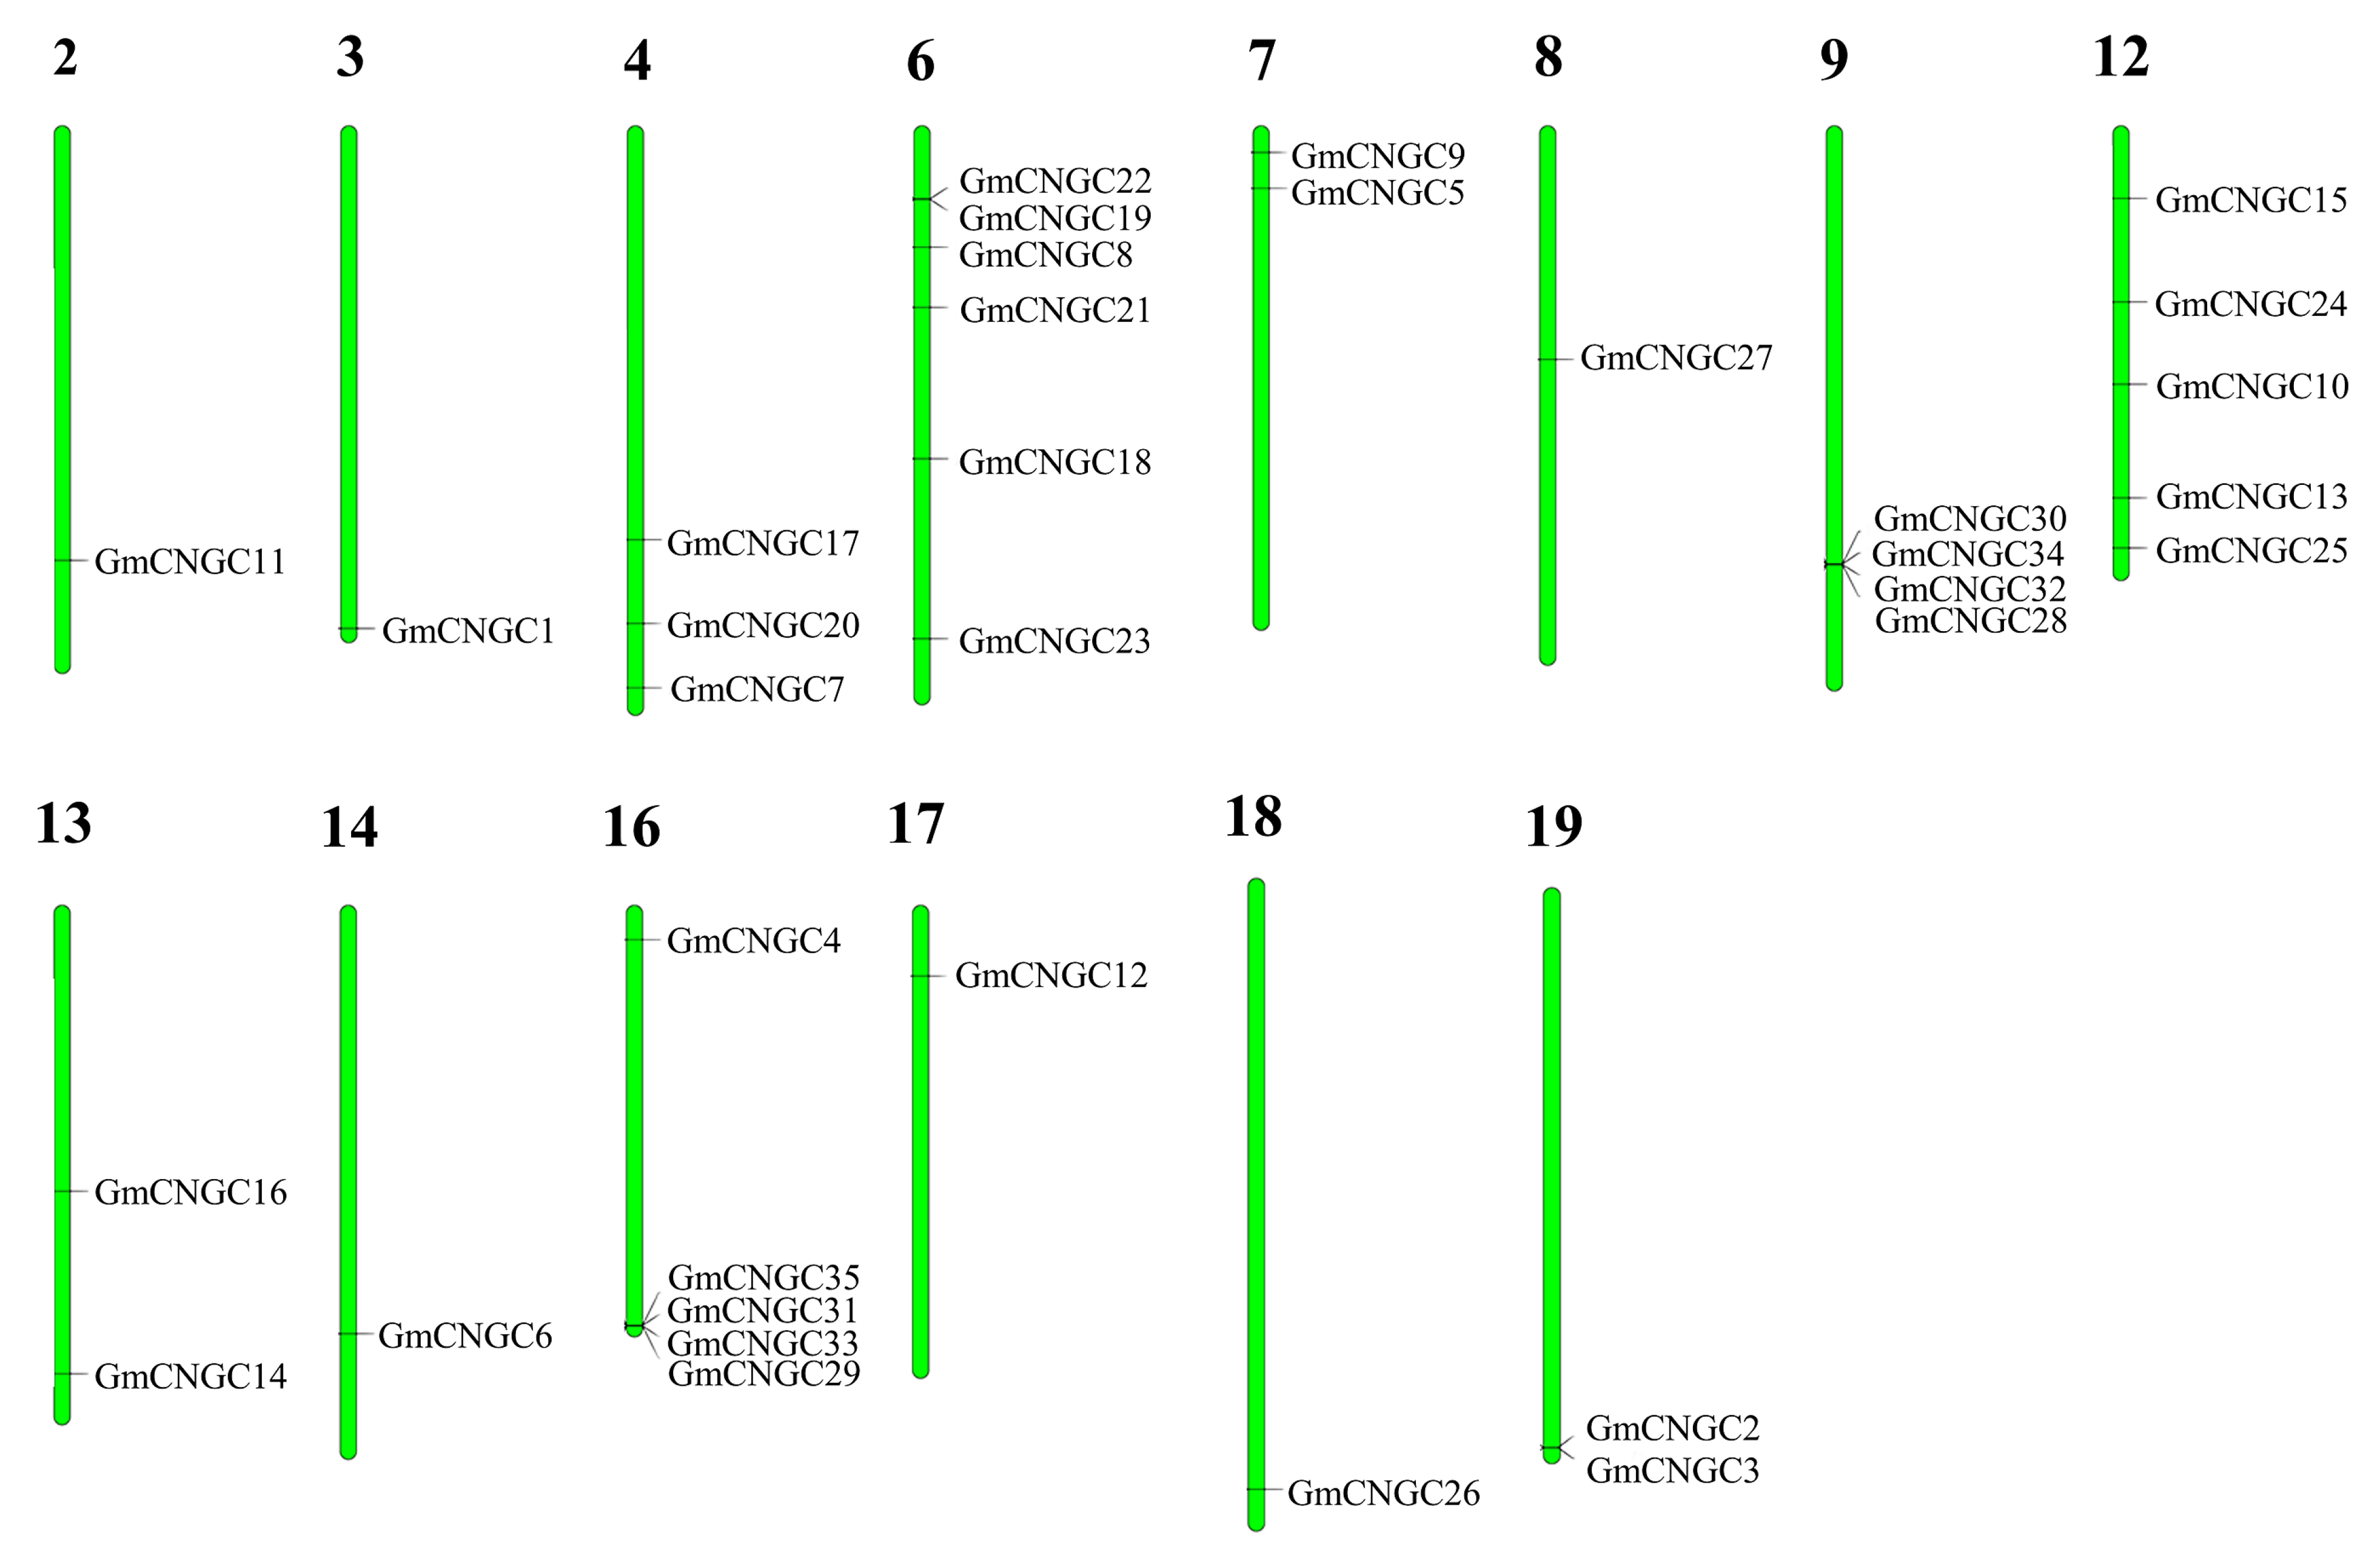
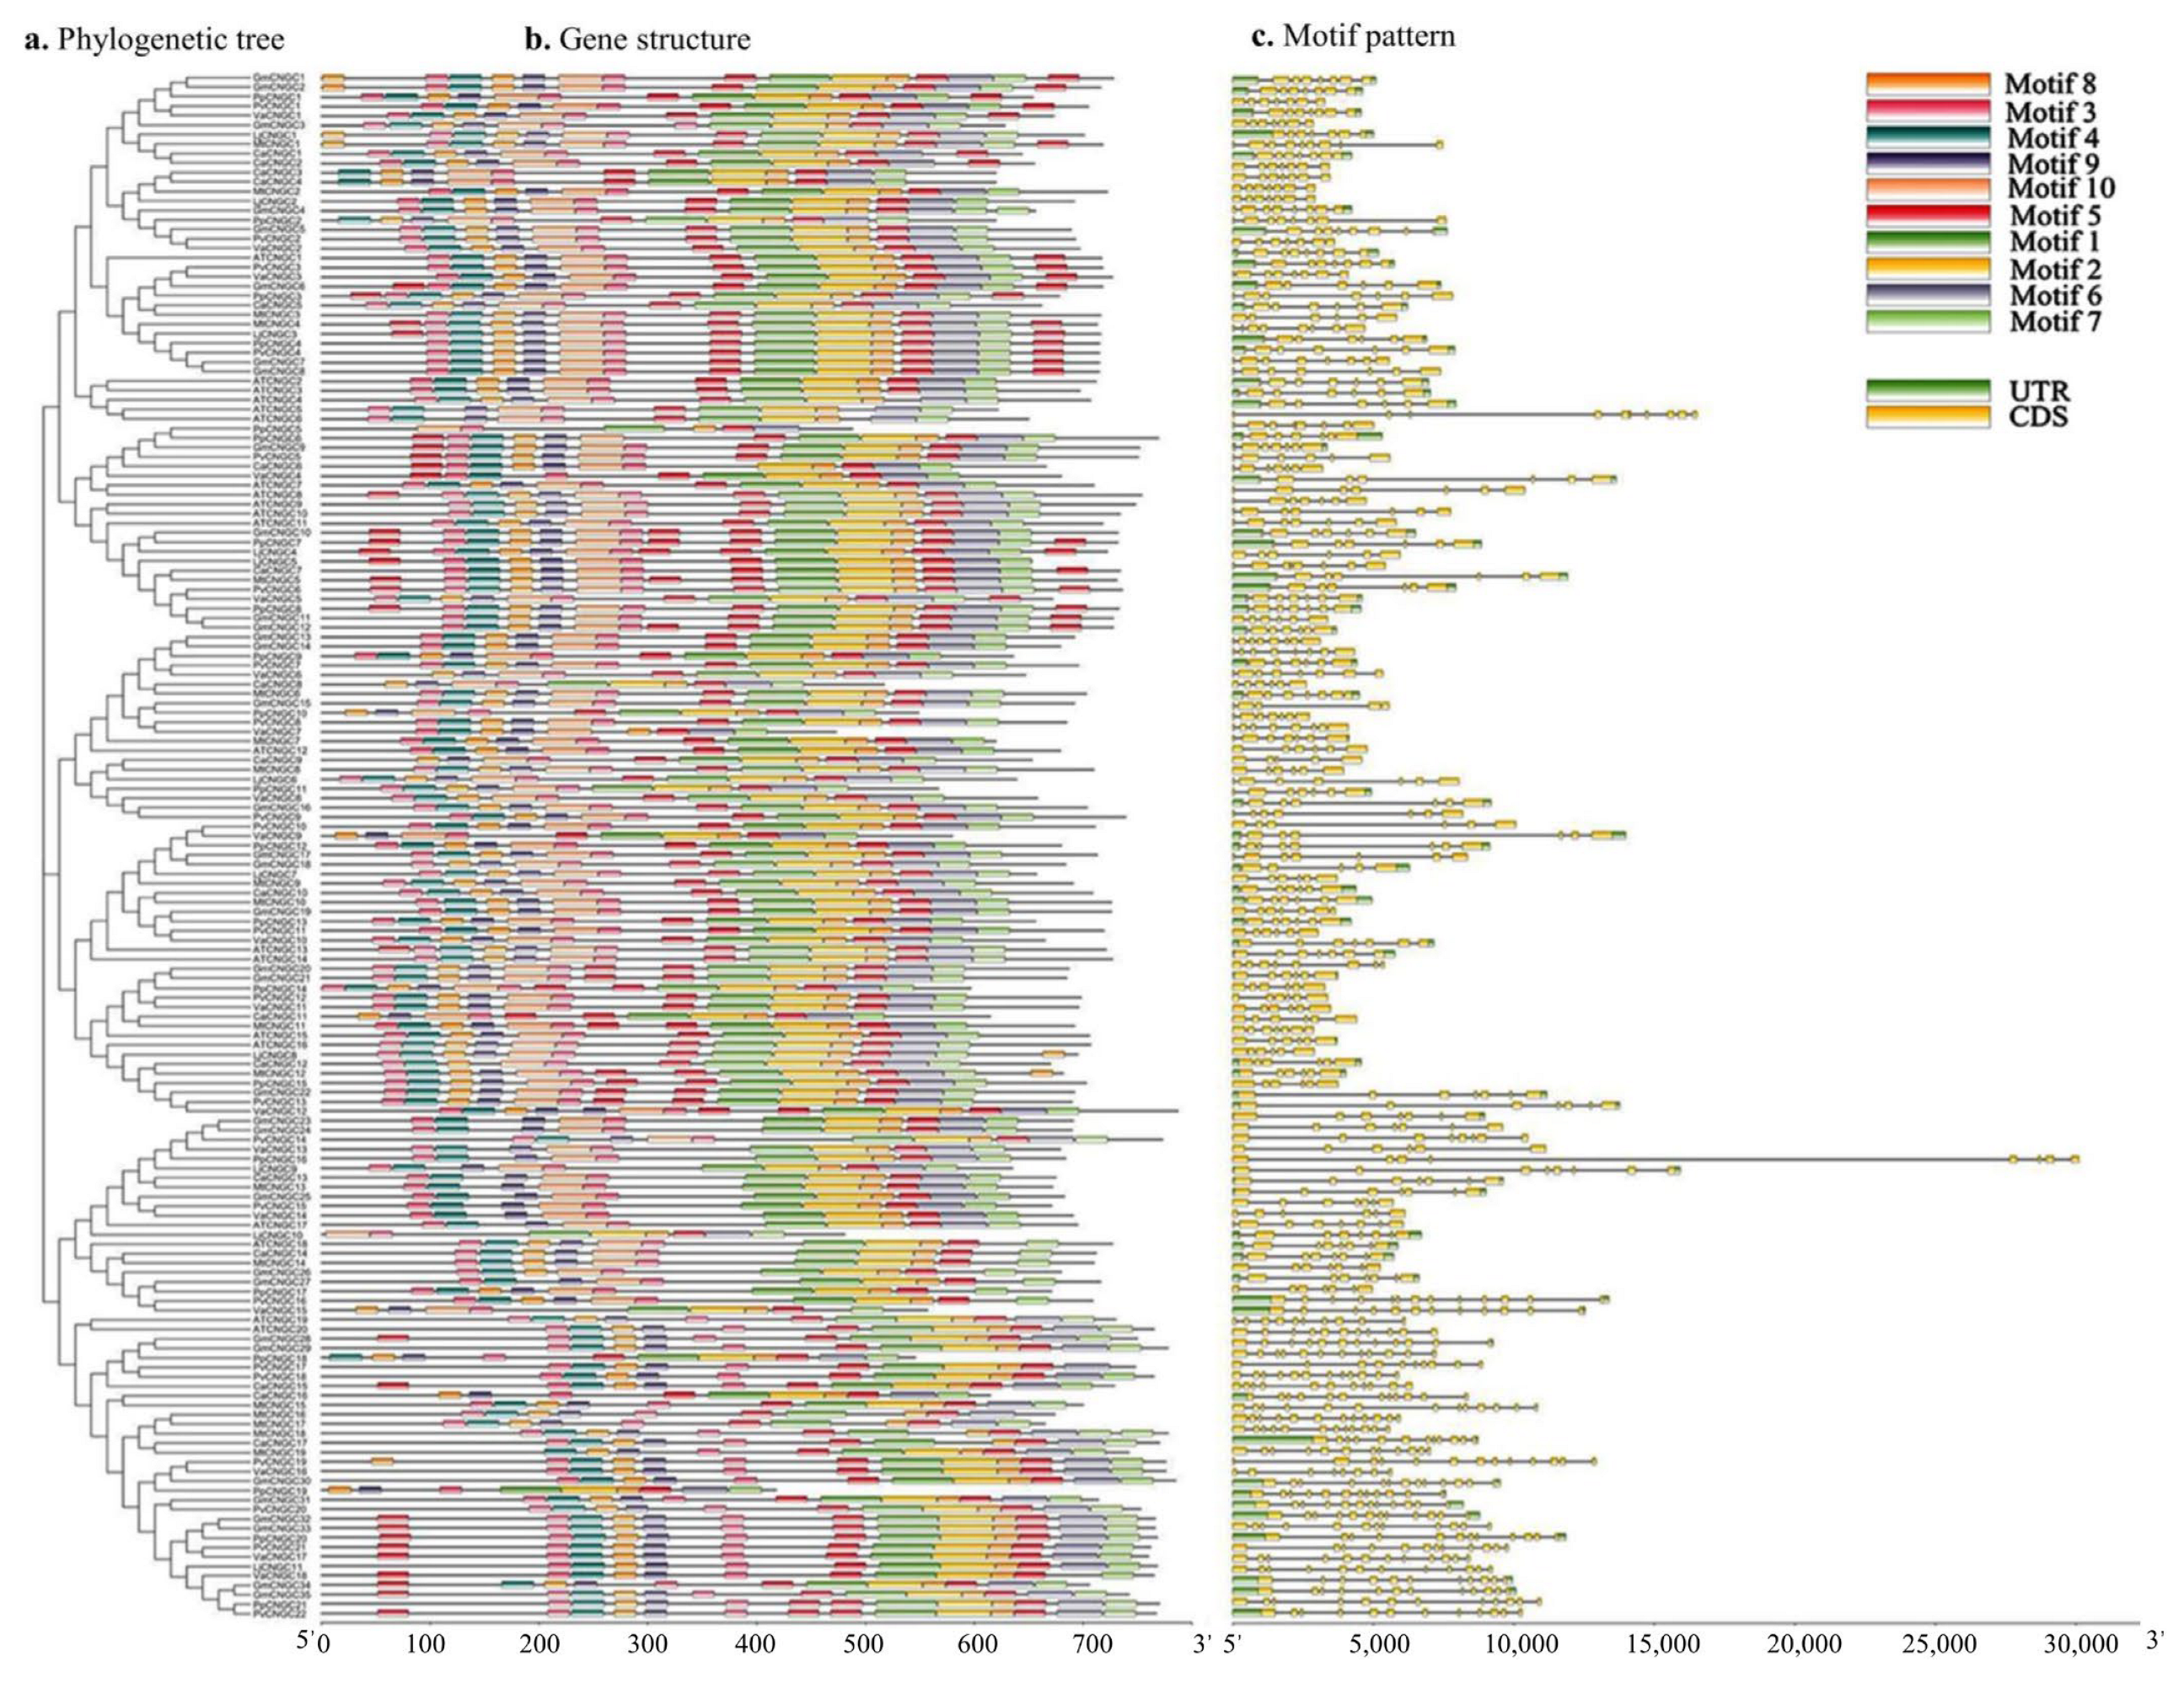
3.2. Distribution, Gene Structure, and Motif Analysis of GmCNGC Genes on Chromosomes

Chromosomal localisation analysis (Figure 2) showed that the CNGCs of G. max are located on 14 chromosomes (i.e., on chromosomes 2, 3, 4, 6, 7, 8, 9, 12, 13, 14, 16, 17, 18, and 19), and their distribution was uneven. Some chromosomes (12 and 16) carried five genes, while the others (2, 3, 7, 8, 13, 14, 17, 18, and 19) carried fewer genes. Further, chromosomes 1, 5, 10, 11, 15, and 20 did not harbour any GmCNGC genes. Our results also indicated that most of the GmCNGC genes were distributed at the end or proximal part of the chromosomes. However, we observed that GmCNGC18, GmCNGC27, GmCNGC10, and GmCNGC16 on chromosomes 6, 8, 9, and 13, respectively, are located in the middle of the chromosomes.
A phylogenetic tree was constructed with the conserved motifs using MEME (Figure 3). Comparative analysis of the phylogenetic tree and conserved motifs (Figure 3) showed that the conserved motifs of members of the same group were similar, and the conserved motifs of homologous genes were highly consistent. Additionally, the number of conserved motifs in each group was approximately the same (average of seven motifs). However, some of these were unique to Group IV-A, e.g., compounds 20, 4, and 2. Additionally, the number of introns varied in the range 5–12; however, the distribution of exons and introns in the clustered genes was very similar. We also observed that the intron regions corresponding to group Ⅳ-B were longer than those corresponding to the other groups were.

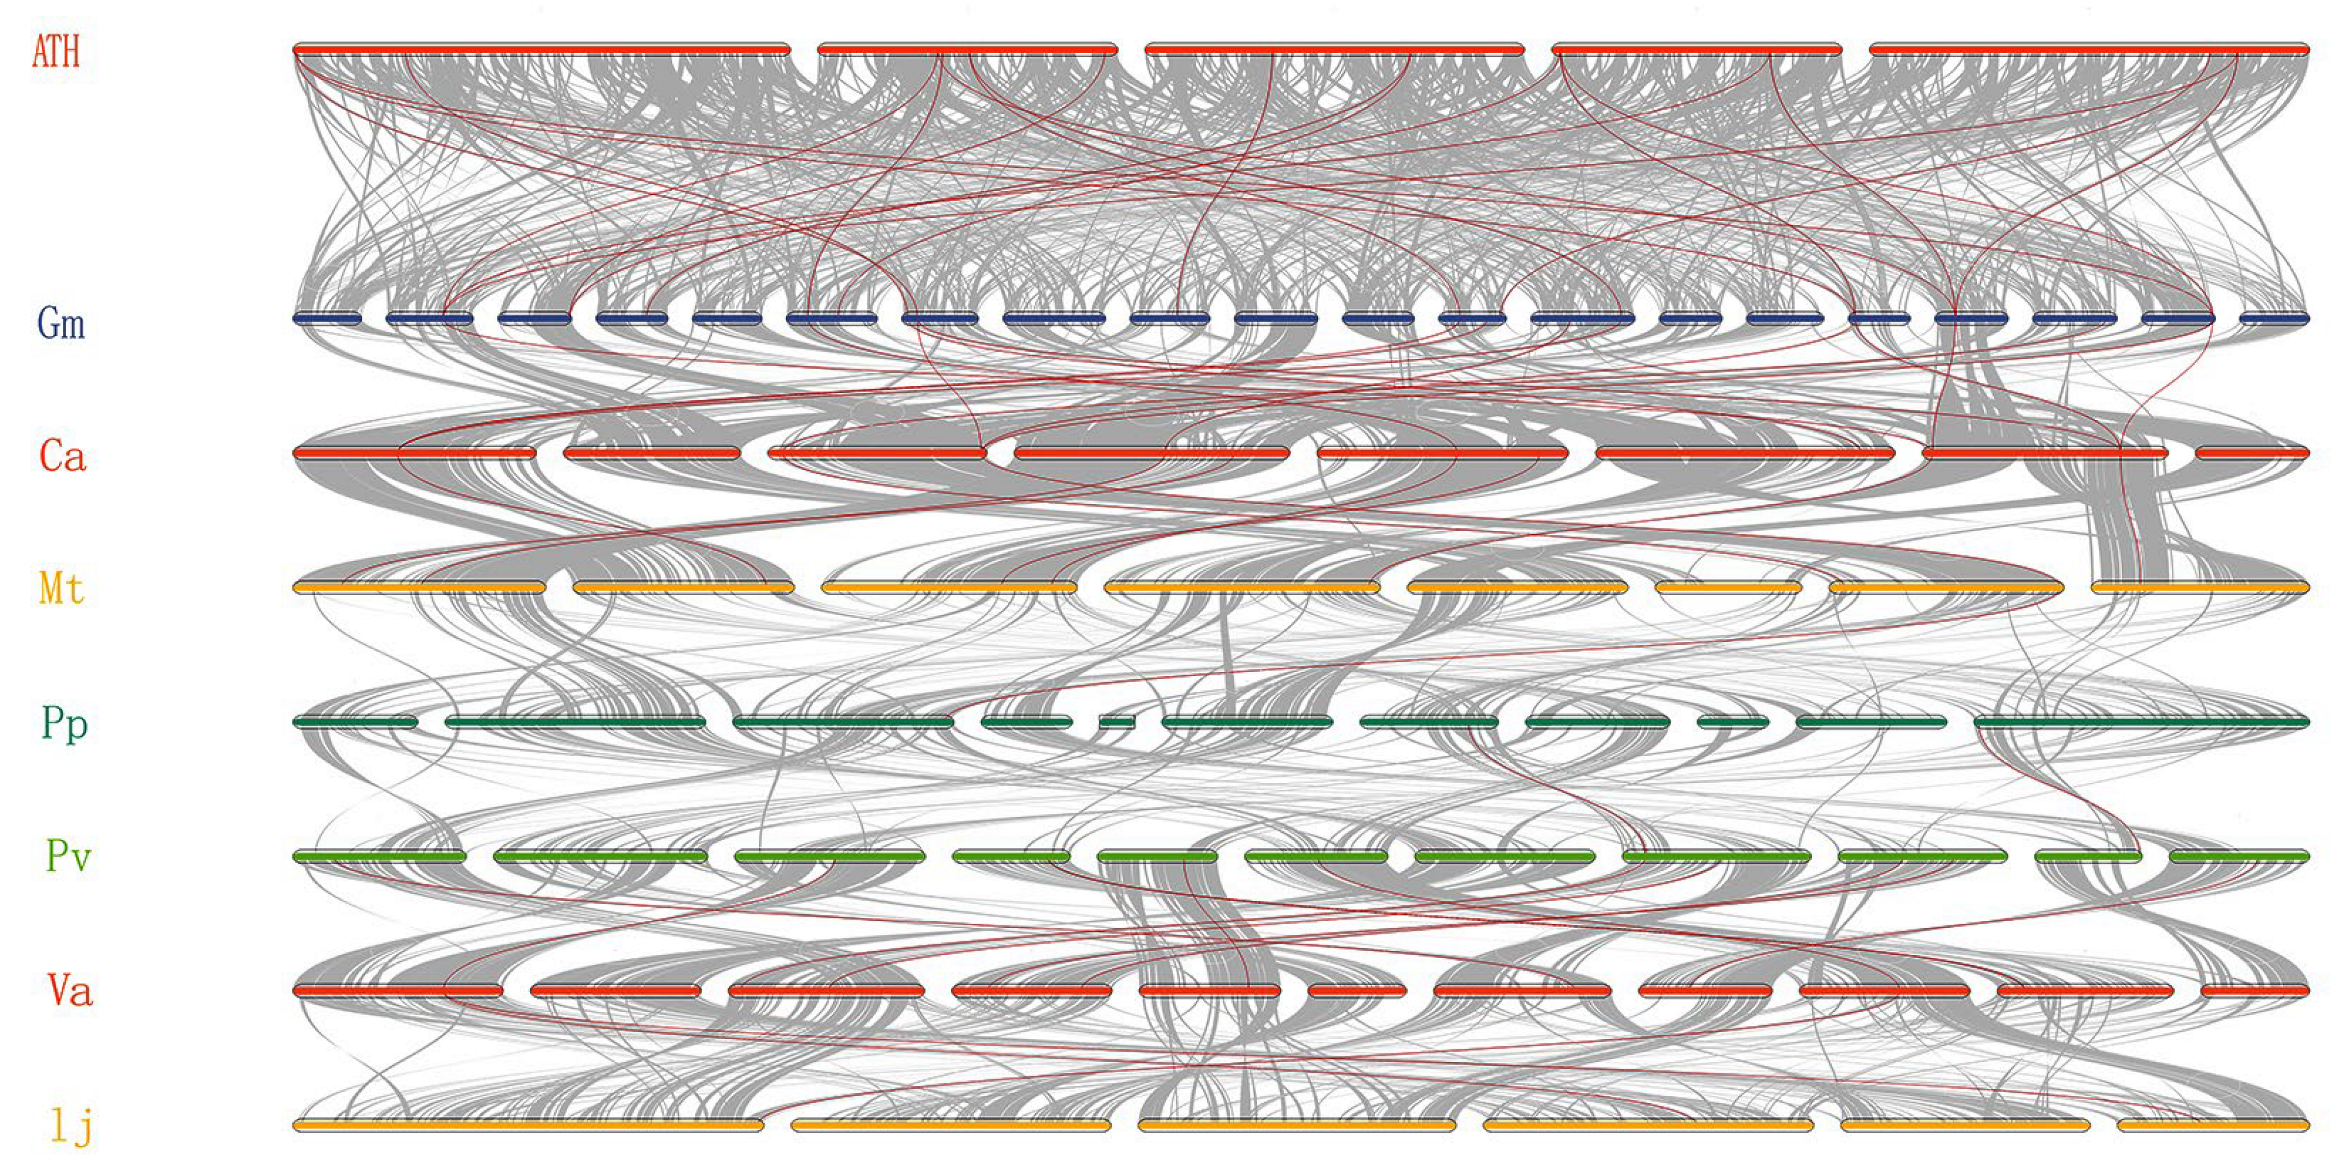
3.3. Collinearity and Evolutionary Analysis of CNGC Genes

The divergence times of the Gm-Lj, Gm-Mt, Gm-Pp, Gm-Pv, Gm-Va, and Gm-Ca homologous pairs were 29–88, 9–88, 12–81, 16–101, 18–97, and 26–85 MYA, respectively. The divergence times for the Lj-Mt, Lj-Pp, Lj-Pv, and Lj-Va homologous pairs were 34–93, 33–97, 30–97, and 32–88 MYA, respectively. Further, the Pp-Mt, Pp-Pv, and Pp-Va pairs were separated by 30–96, 21–96, and 20–78 MYA, respectively, and the divergence times of Pv-Mt, Pv-Va, and Va-Mt are 33–90, 6–91, and 36–94 MYA, respectively. Thus, the divergence times of the seven legumes were similar. Notably, the earliest and latest divergence times (16–101 and 20–78 MYA, respectively) corresponded to the Gm-Va and Pp-Va homologous pairs, respectively. Moreover, most of the Ka/KS values were below 0.4, indicating that all the legumes considered in this study show strong purifying selection (Table S2)
To further infer the phylogenetic mechanisms of G. max and the other selected species, and to obtain collinear relationships between homologous CNGC genes, collinear analysis diagrams were constructed (Figure 4). The results thus obtained showed the existence of a one-to-one correspondence among all the CNGC genes in the seven legumes. Further, among the 35 GmCNGC in G. max, the number of CNGC gene homologous pairs to M. truncatula, C. arietinum, pigeon pea, L. japonicus, V. angularis, and P. vulgaris were 9, 18, 15, 3, 15, and 22, respectively. This phenomenon indicated less G. max and V. angularis genomic rearrangements after the lineages diverged and more G. max and P. vulgaris genomic rearrangements before lineage divergence. Additionally, M. truncatula, P. vulgaris, and pigeon peas showed few genomic rearrangements after divergence.

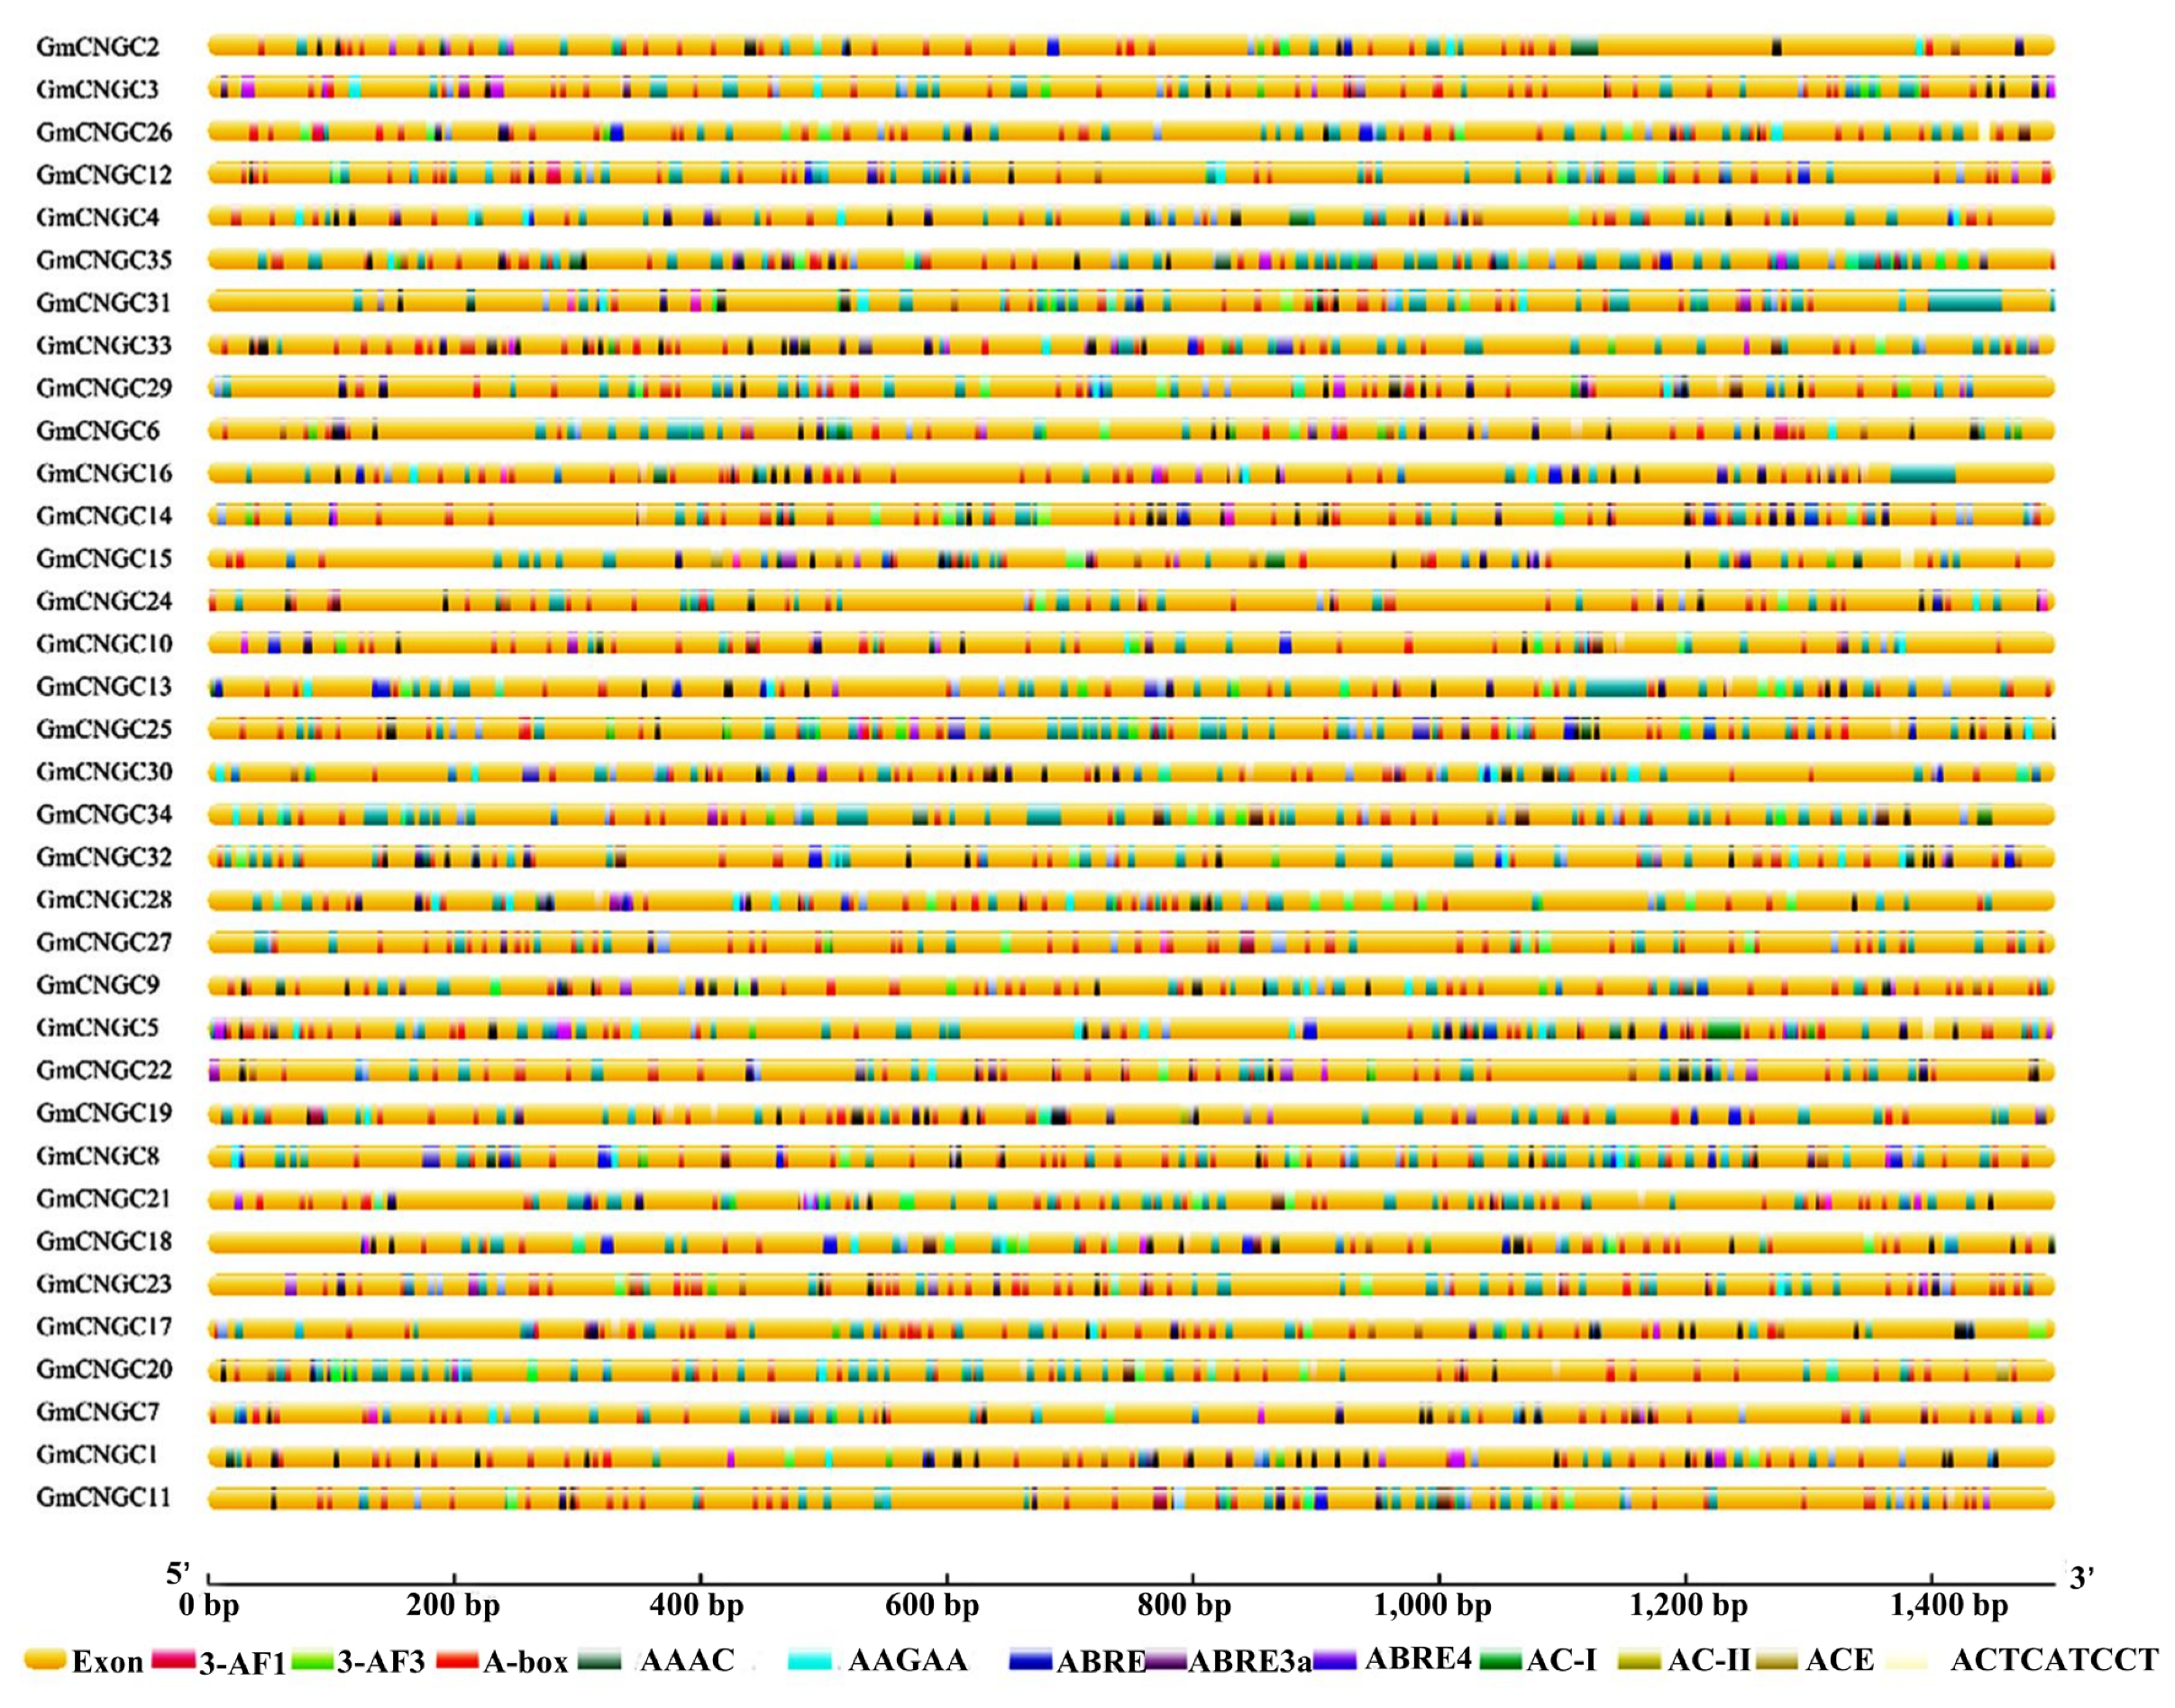
3.4. The Cis-Acting Element in the CNGC Gene Promoter Sequence

Our results showed that CNGC contained at least 30 cis-regulatory elements, including drought, high temperature, low temperature, osmotic stress, light, phytohormone (auxin, abscisic acid, gibberellin, MeJA, and ethylene), pathogen, and damage response elements. From Figure 5, which shows the main cis-regulatory elements in the G. max CNGC gene, it is evident that all the CNGC genes in G. max contained abscisic acid response-related elements, ABRE and ABRE4, light-response elements, ACE and AAAC-Motif, AAGAA-Motif related to methyl jasmonate response, AC-I and AC-II related to lignin biosynthesis, and ACTCATCCT related to stress response.

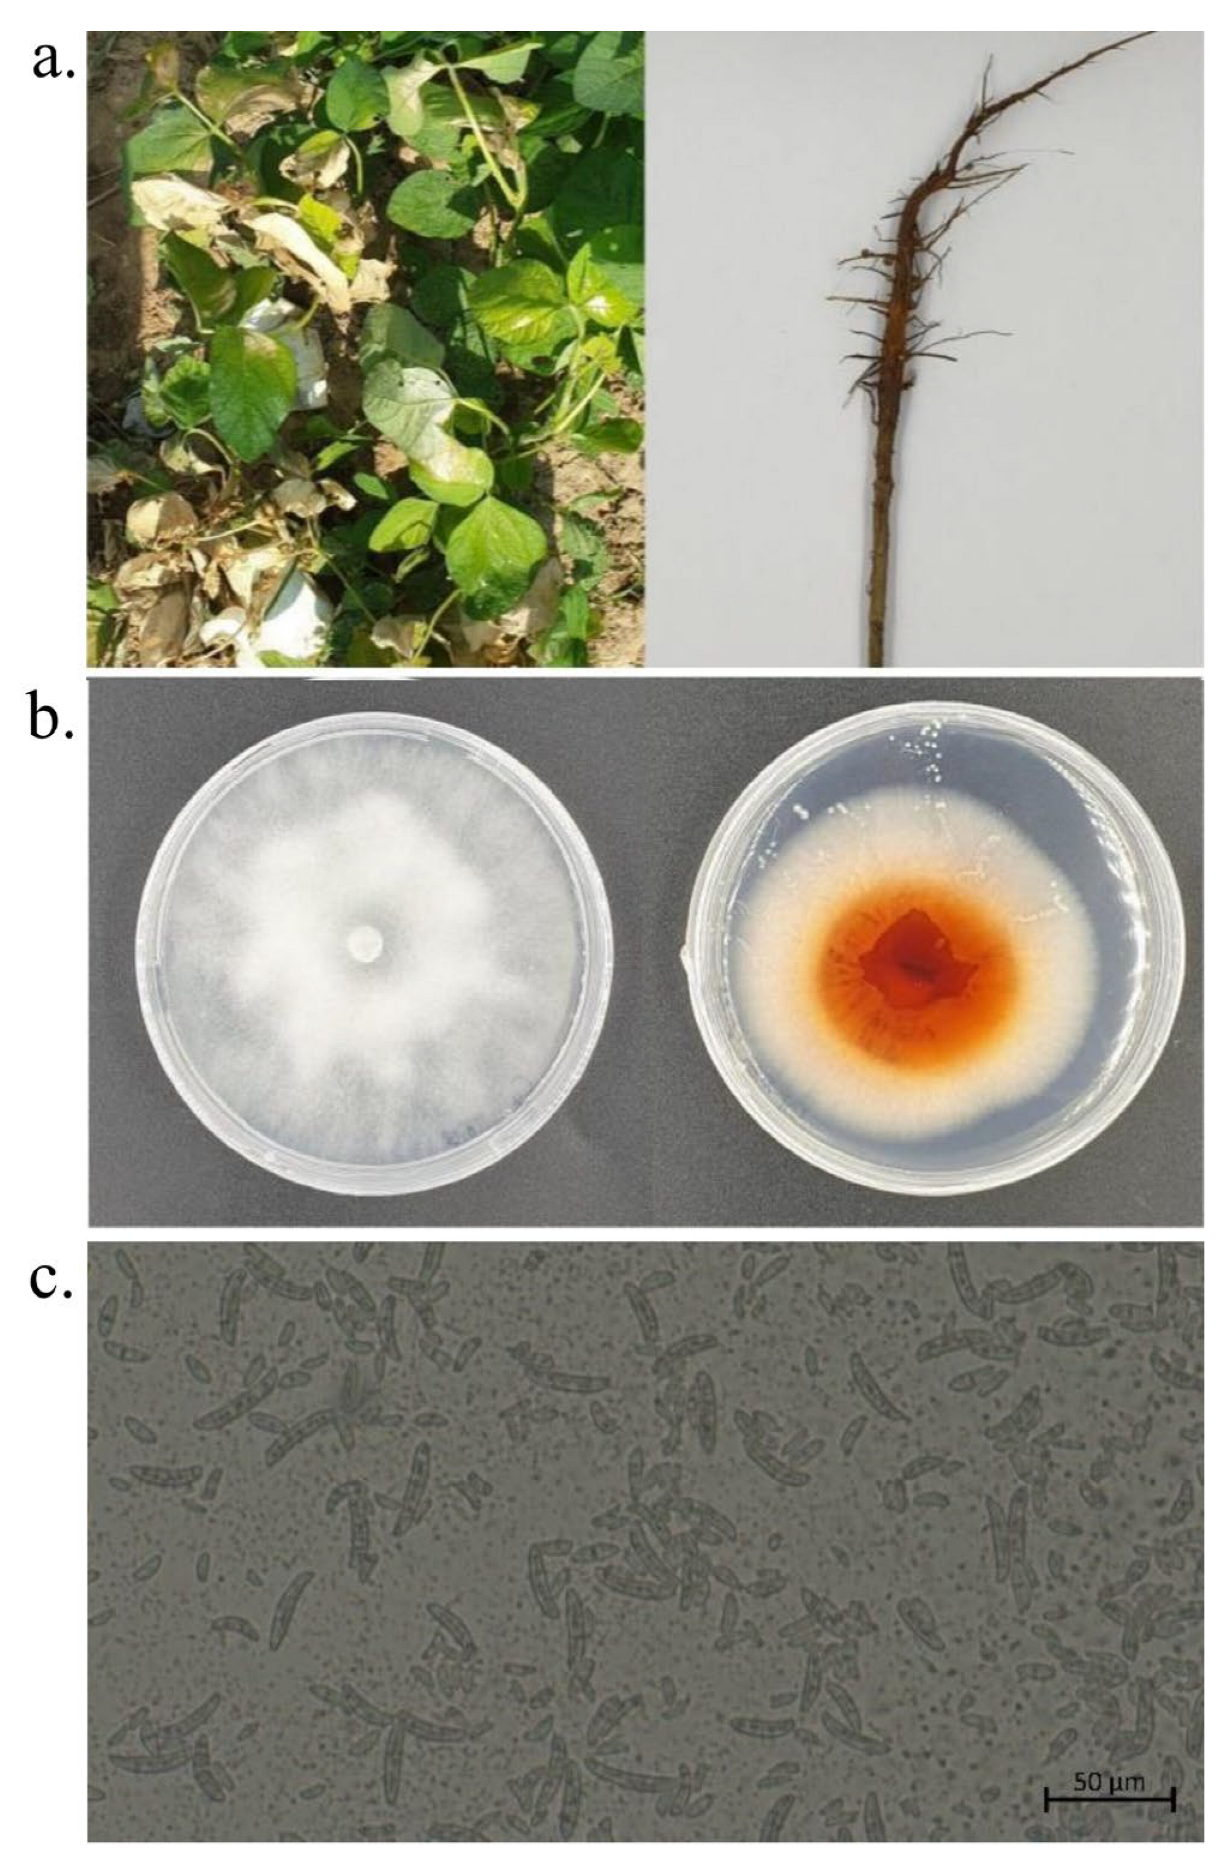
3.5. Symptoms of Field Diseases

Field observations revealed that root rot, which predominantly affected the root and stem bases of G. max, was most severe during the seedling stage of the plant. Further, the root rot primarily started from the fibrils or individual branches of G. max plants when the parts above the ground began to wilt. Later, owing to infection by pathogens, the fibrils gradually appeared dark brown and gradually fell off, as infection in the main root progressed. The leaves yellowed upward from the lower end of the morphology; however, the yellowed leaves did not fall off (Figure 6a. Left). In the severe infection cases, the main root completely turned black and showed an ulcerated shape. Further, almost all the fibrils fell off, a few short-branched roots were observed (Figure 6a. Right), and the whole plant appeared necrotic.

3.6. Pathogen Isolation, Purification, and Morphological Identification

When collected root tissue samples with similar symptoms were cultured at 28 °C in the PDA medium, the colonies grew faster and could cover the entire discs within approximately 5 days. The colonies appeared white at the early stage, and at the later stage, some produced pigments and appeared red (Figure 6b). Further, the colonies were round or nearly round, and their edges were radial. At the later growth stage, the accurate number of mycelia could be observed under a light microscope. Thus, we noted that the conidia were all standard sickle-shaped with a septum in the middle. Most of the conidia had three septa, while a few had 5 septa. The size of the conidia was approximately 15–40 μm × 4–6 μm (Figure 6c), and the pathogen could easily sporulate. The spore shape and colony morphology were consistent with the morphological characteristics of F. solani as described by Song [44]; therefore, the pathogen was preliminarily identified as F. solani.

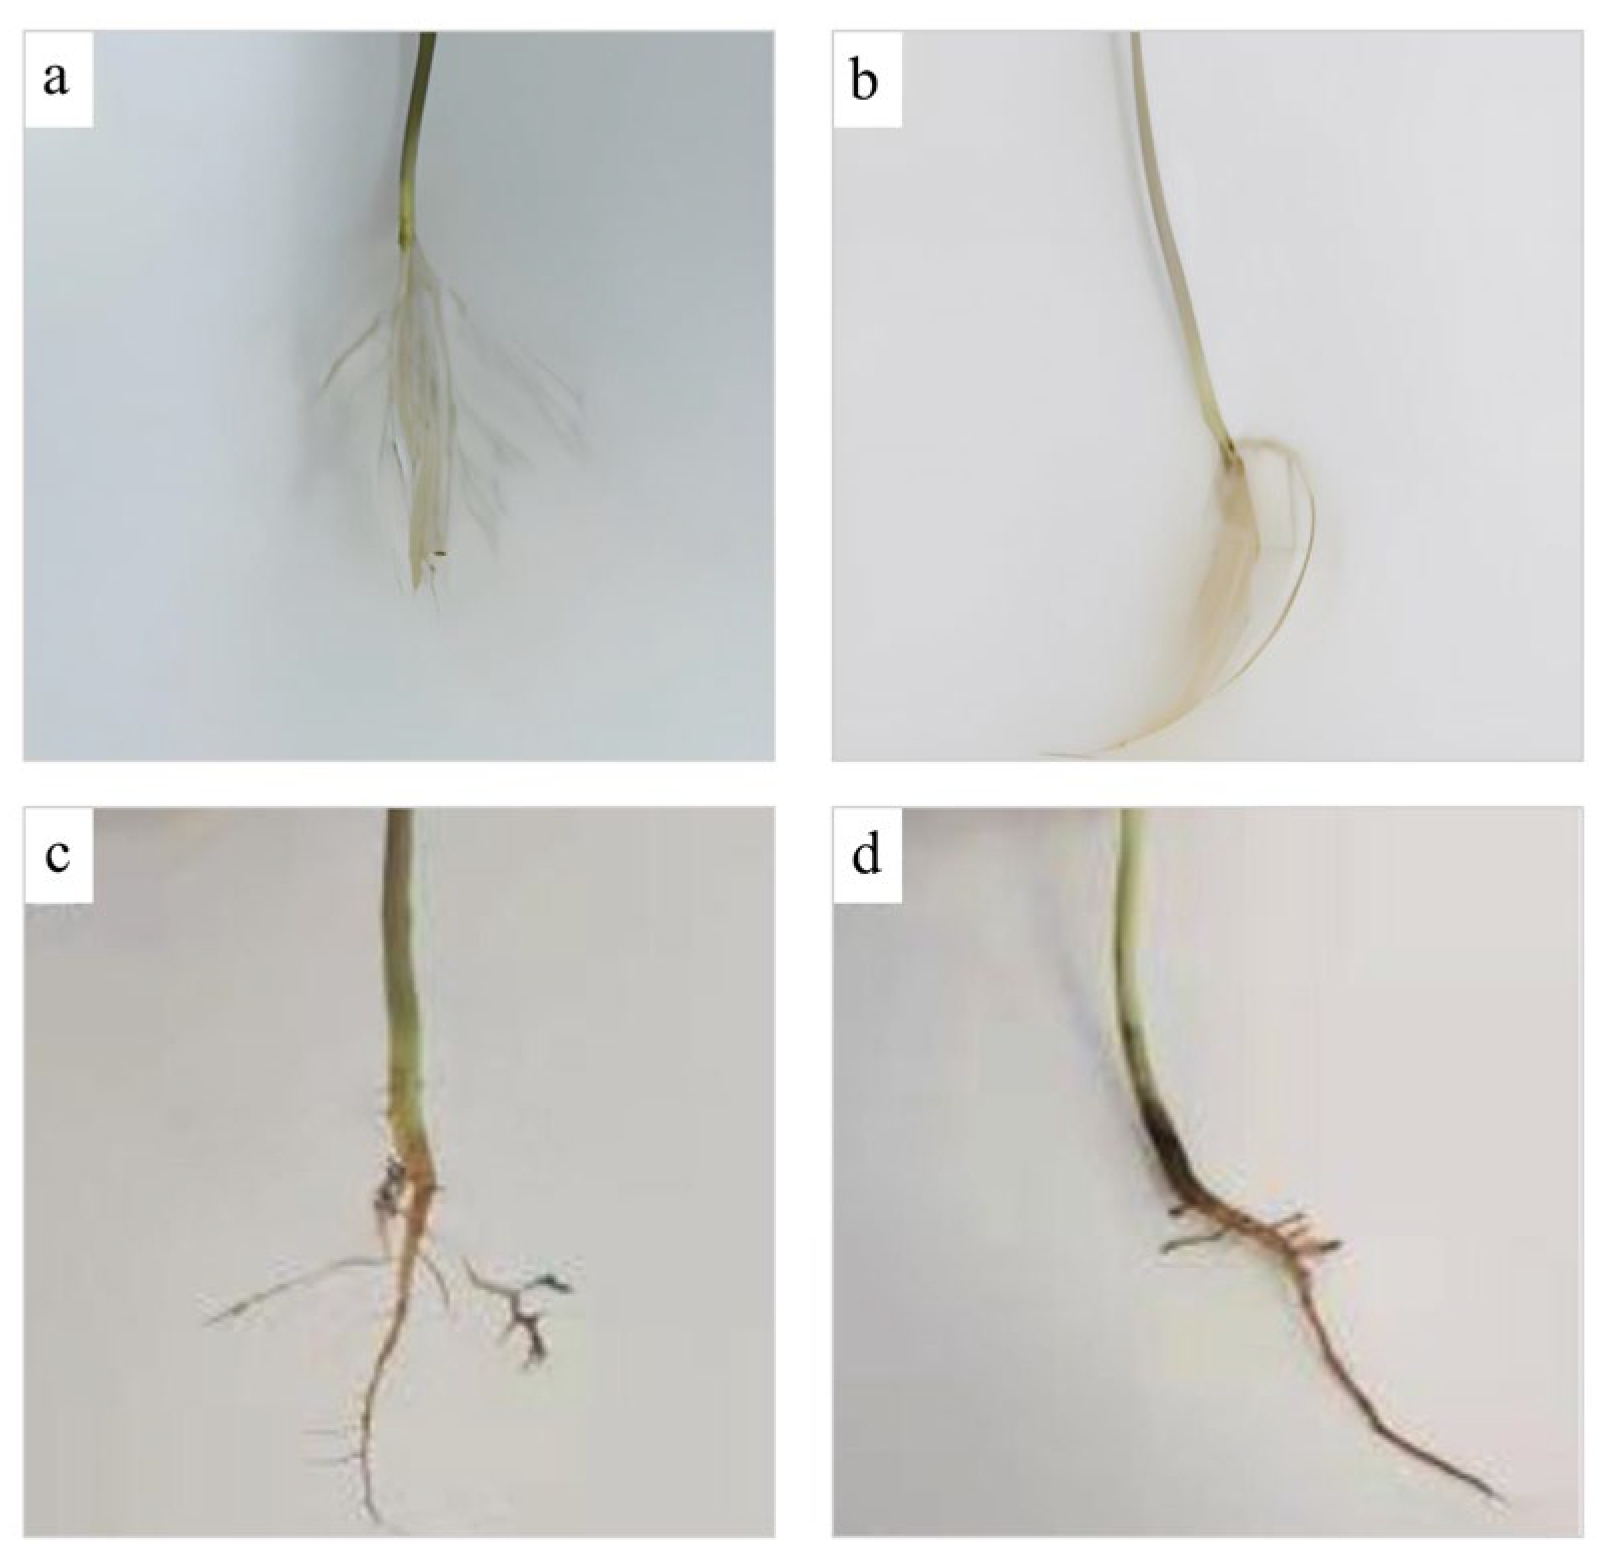
3.7. Pathogenicity Detection

Pathogenicity was detected indoors. Specifically, the isolated and purified pathogens were inoculated via root irrigation. Relative to the observations made at 0 h (Figure 7a), after 24 h, the G. max root system changed slightly (Figure 7b), and after 72 h, the number of lateral roots decreased significantly, and the main root and stem base became brown (Figure 7c). Further, after 7 days, the fibrous roots decayed and fell off, and the branched roots became increasingly shorter owing to decay. The entire main root and stem base appeared black, and the cortex showed ulceration. The symptoms of the disease were the same as those of root rot under natural conditions (Figure 7d), conforming Koch’s law and indicating that this bacterium is pathogenic to G. max. Simultaneously, based on statistical analysis, the incidence of pathogen re-infection was 100%, indicating that this fungus is highly pathogenic to G. max leaves.

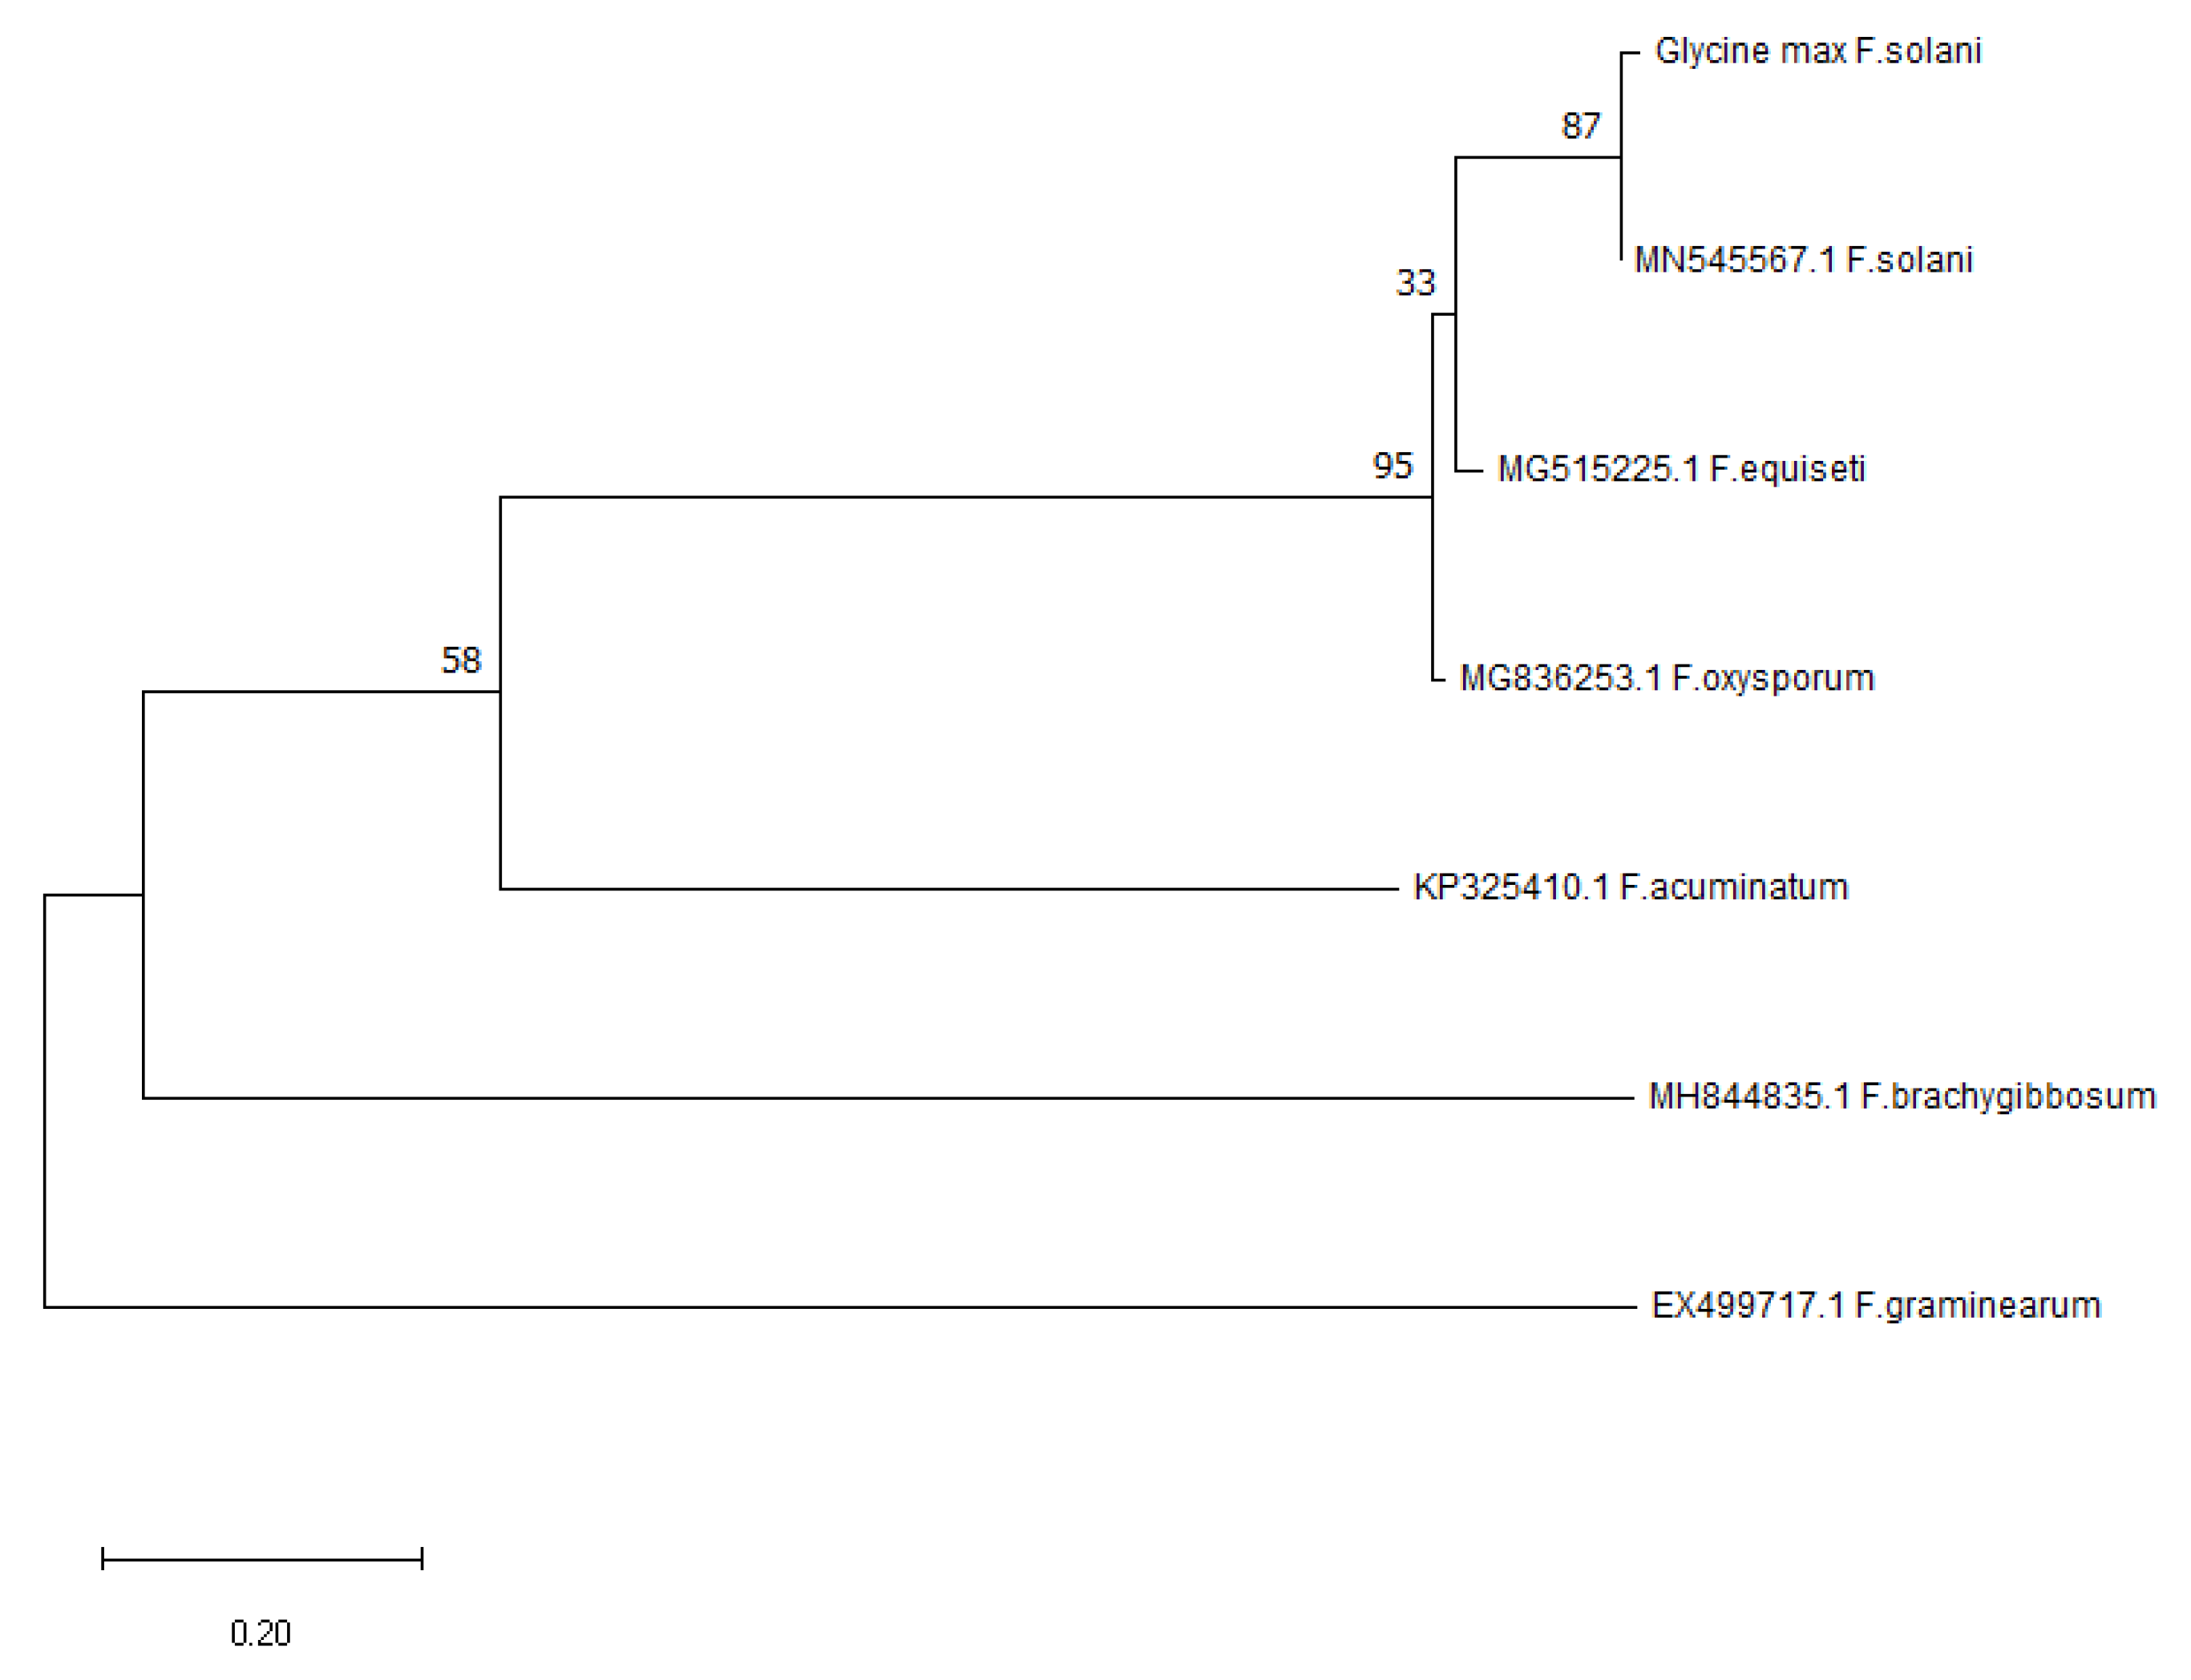
3.8. Molecular Identification and Analysis of Pathogen

The isolated pathogens were extracted and tested for DNA, and their sequences were compared using the NCBI database. The result (Figure 8) showed that we observed 99.81% consistency with the gene sequence of F. solani (Sequence ID: MN216225.1) based on comparison with the gene sequences of other Fusarium species. Thus, a phylogenetic tree was constructed. Combined with the results of morphological identification, we observed that the pathogenic fungus was closely related to F. solani, confirming it as the pathogen.

3.9. Screening of DEGs after Disease Stress

The results (Figure 9) showed that four of the 35 CNGC genes were abnormally expressed during stress treatment. The stress treatment group showed a downregulation in the transcriptional level of GmCNGC22 by day 3, while GmCNGC27 was significantly upregulated by day 7. To determine the responses of the CNGCs before and after infection, we analysed the transcriptome of GmCNGC5 at 1 d and 7 d after stress exposure and screened the DEGs. Thus, we observed a significant downregulation in the transcriptional level of GmCNGC5, while that of GmCNGC31 was upregulated.

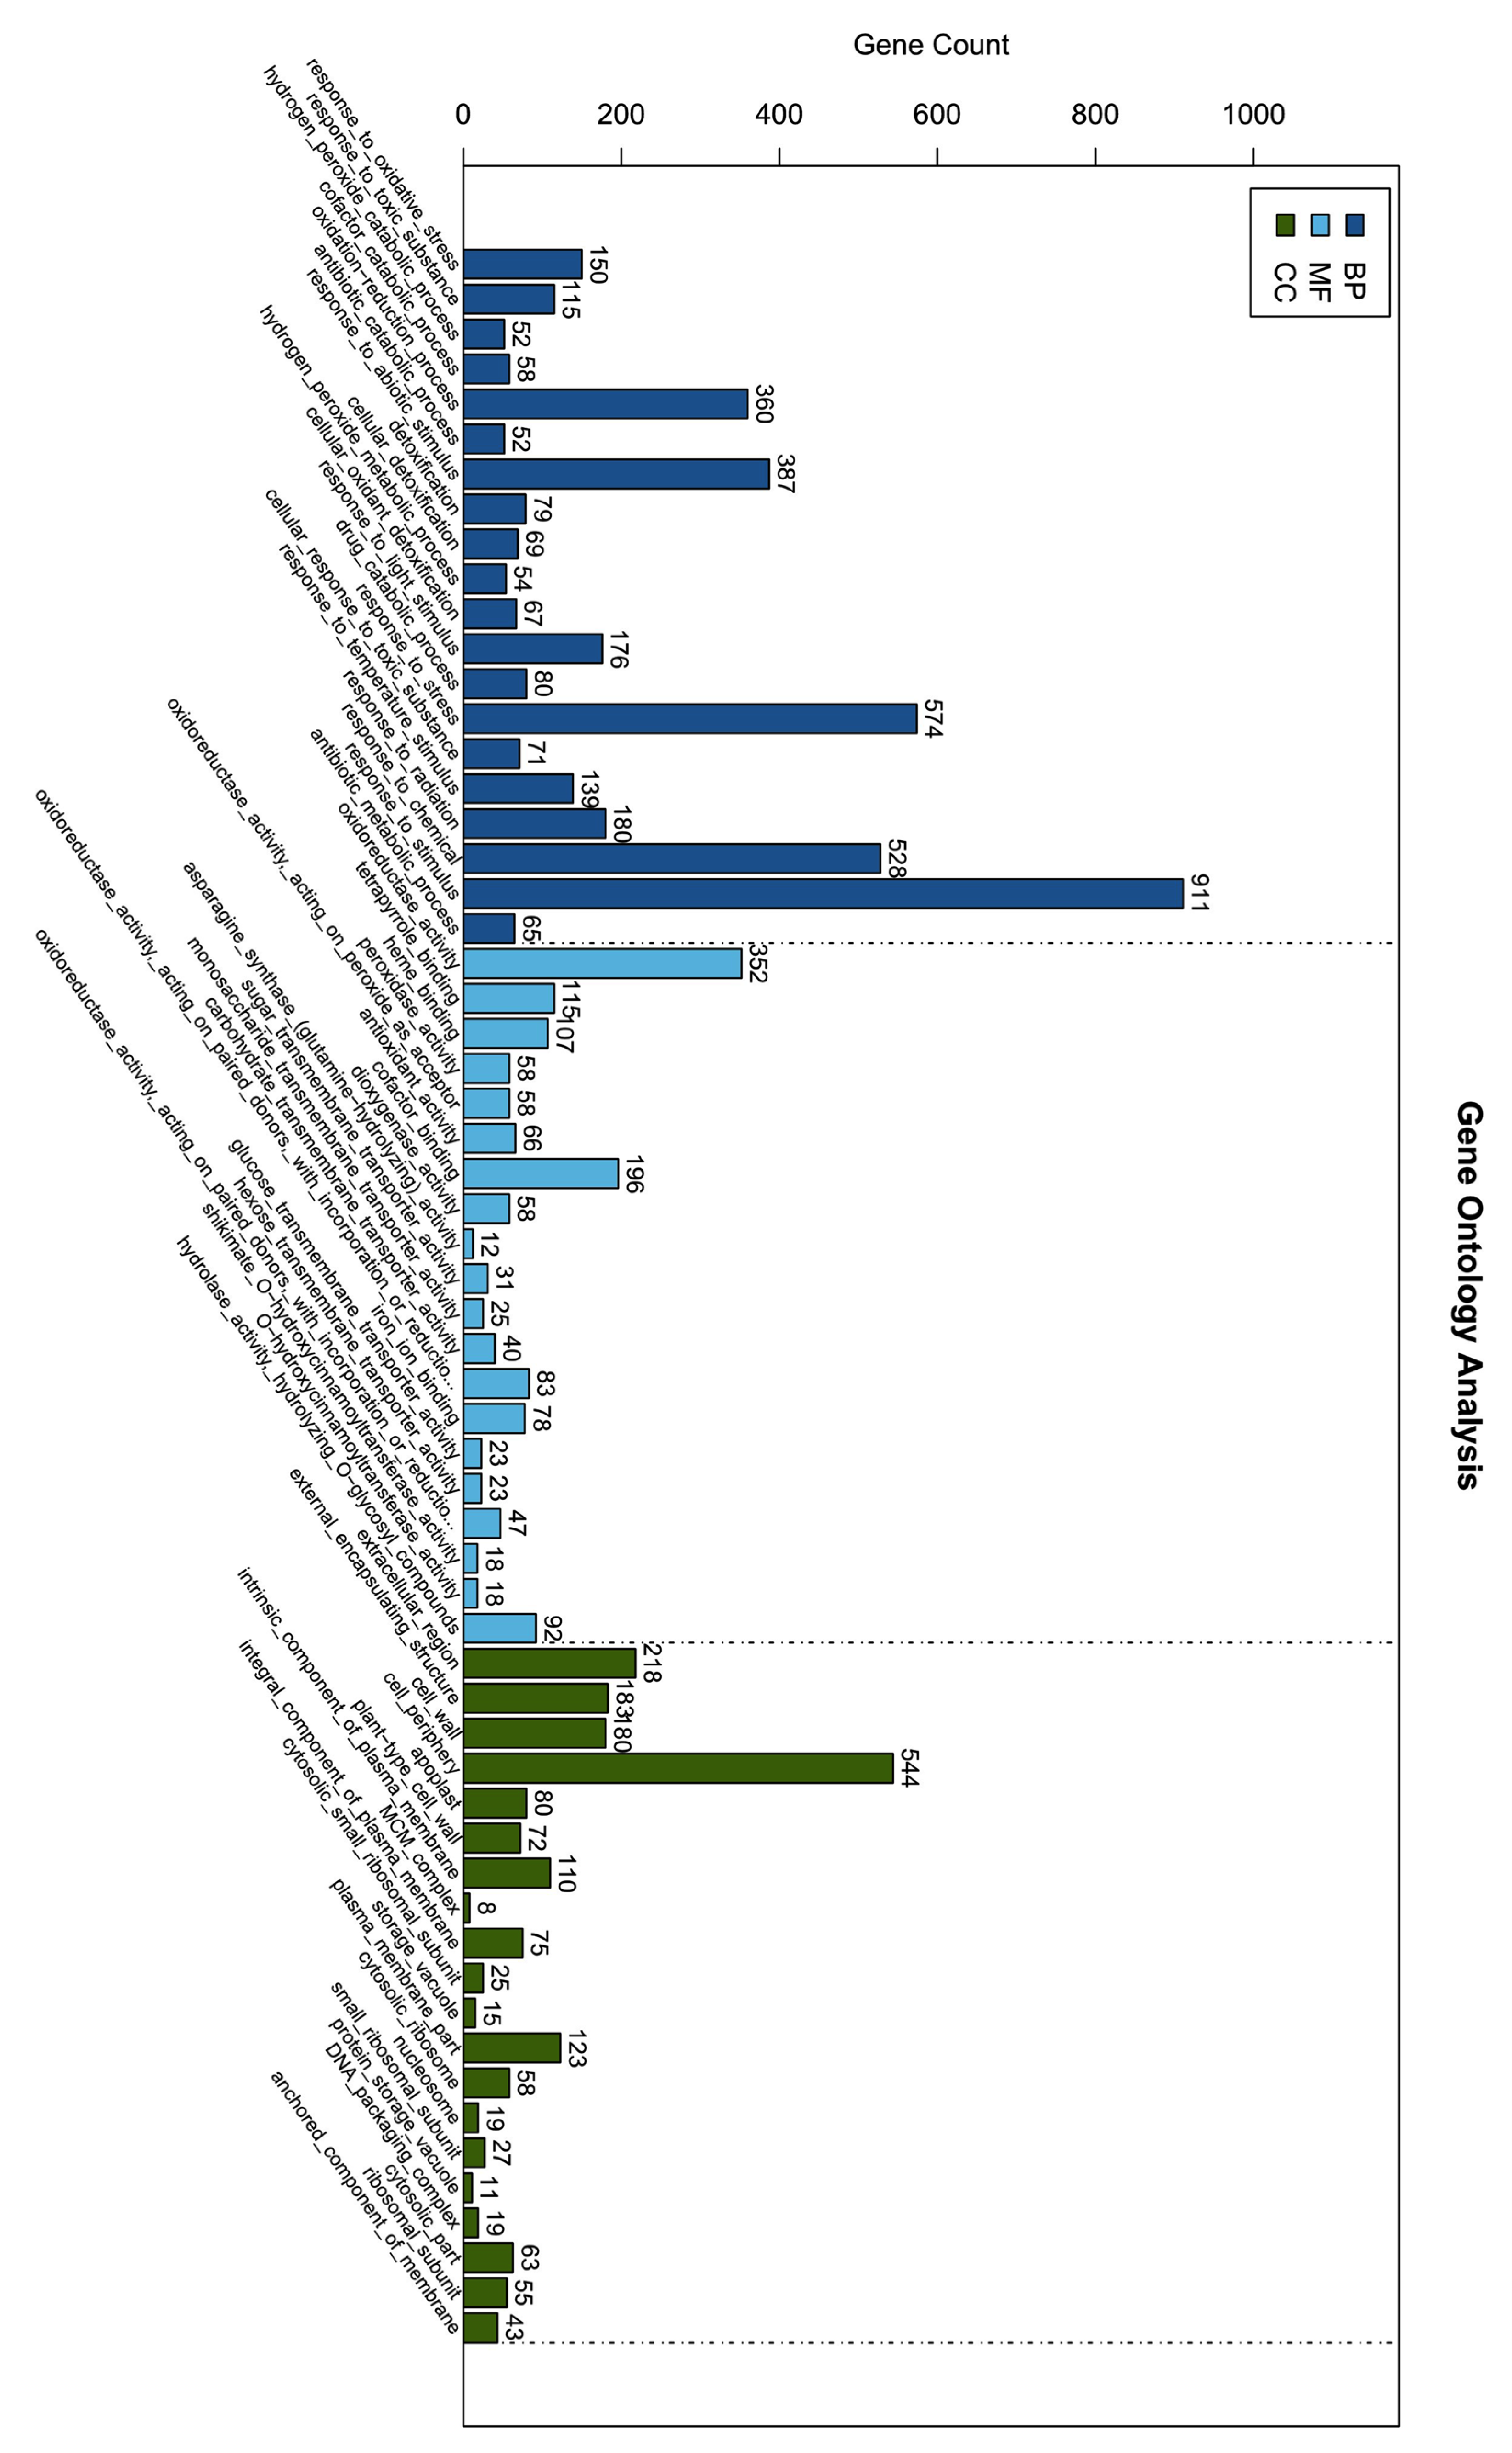
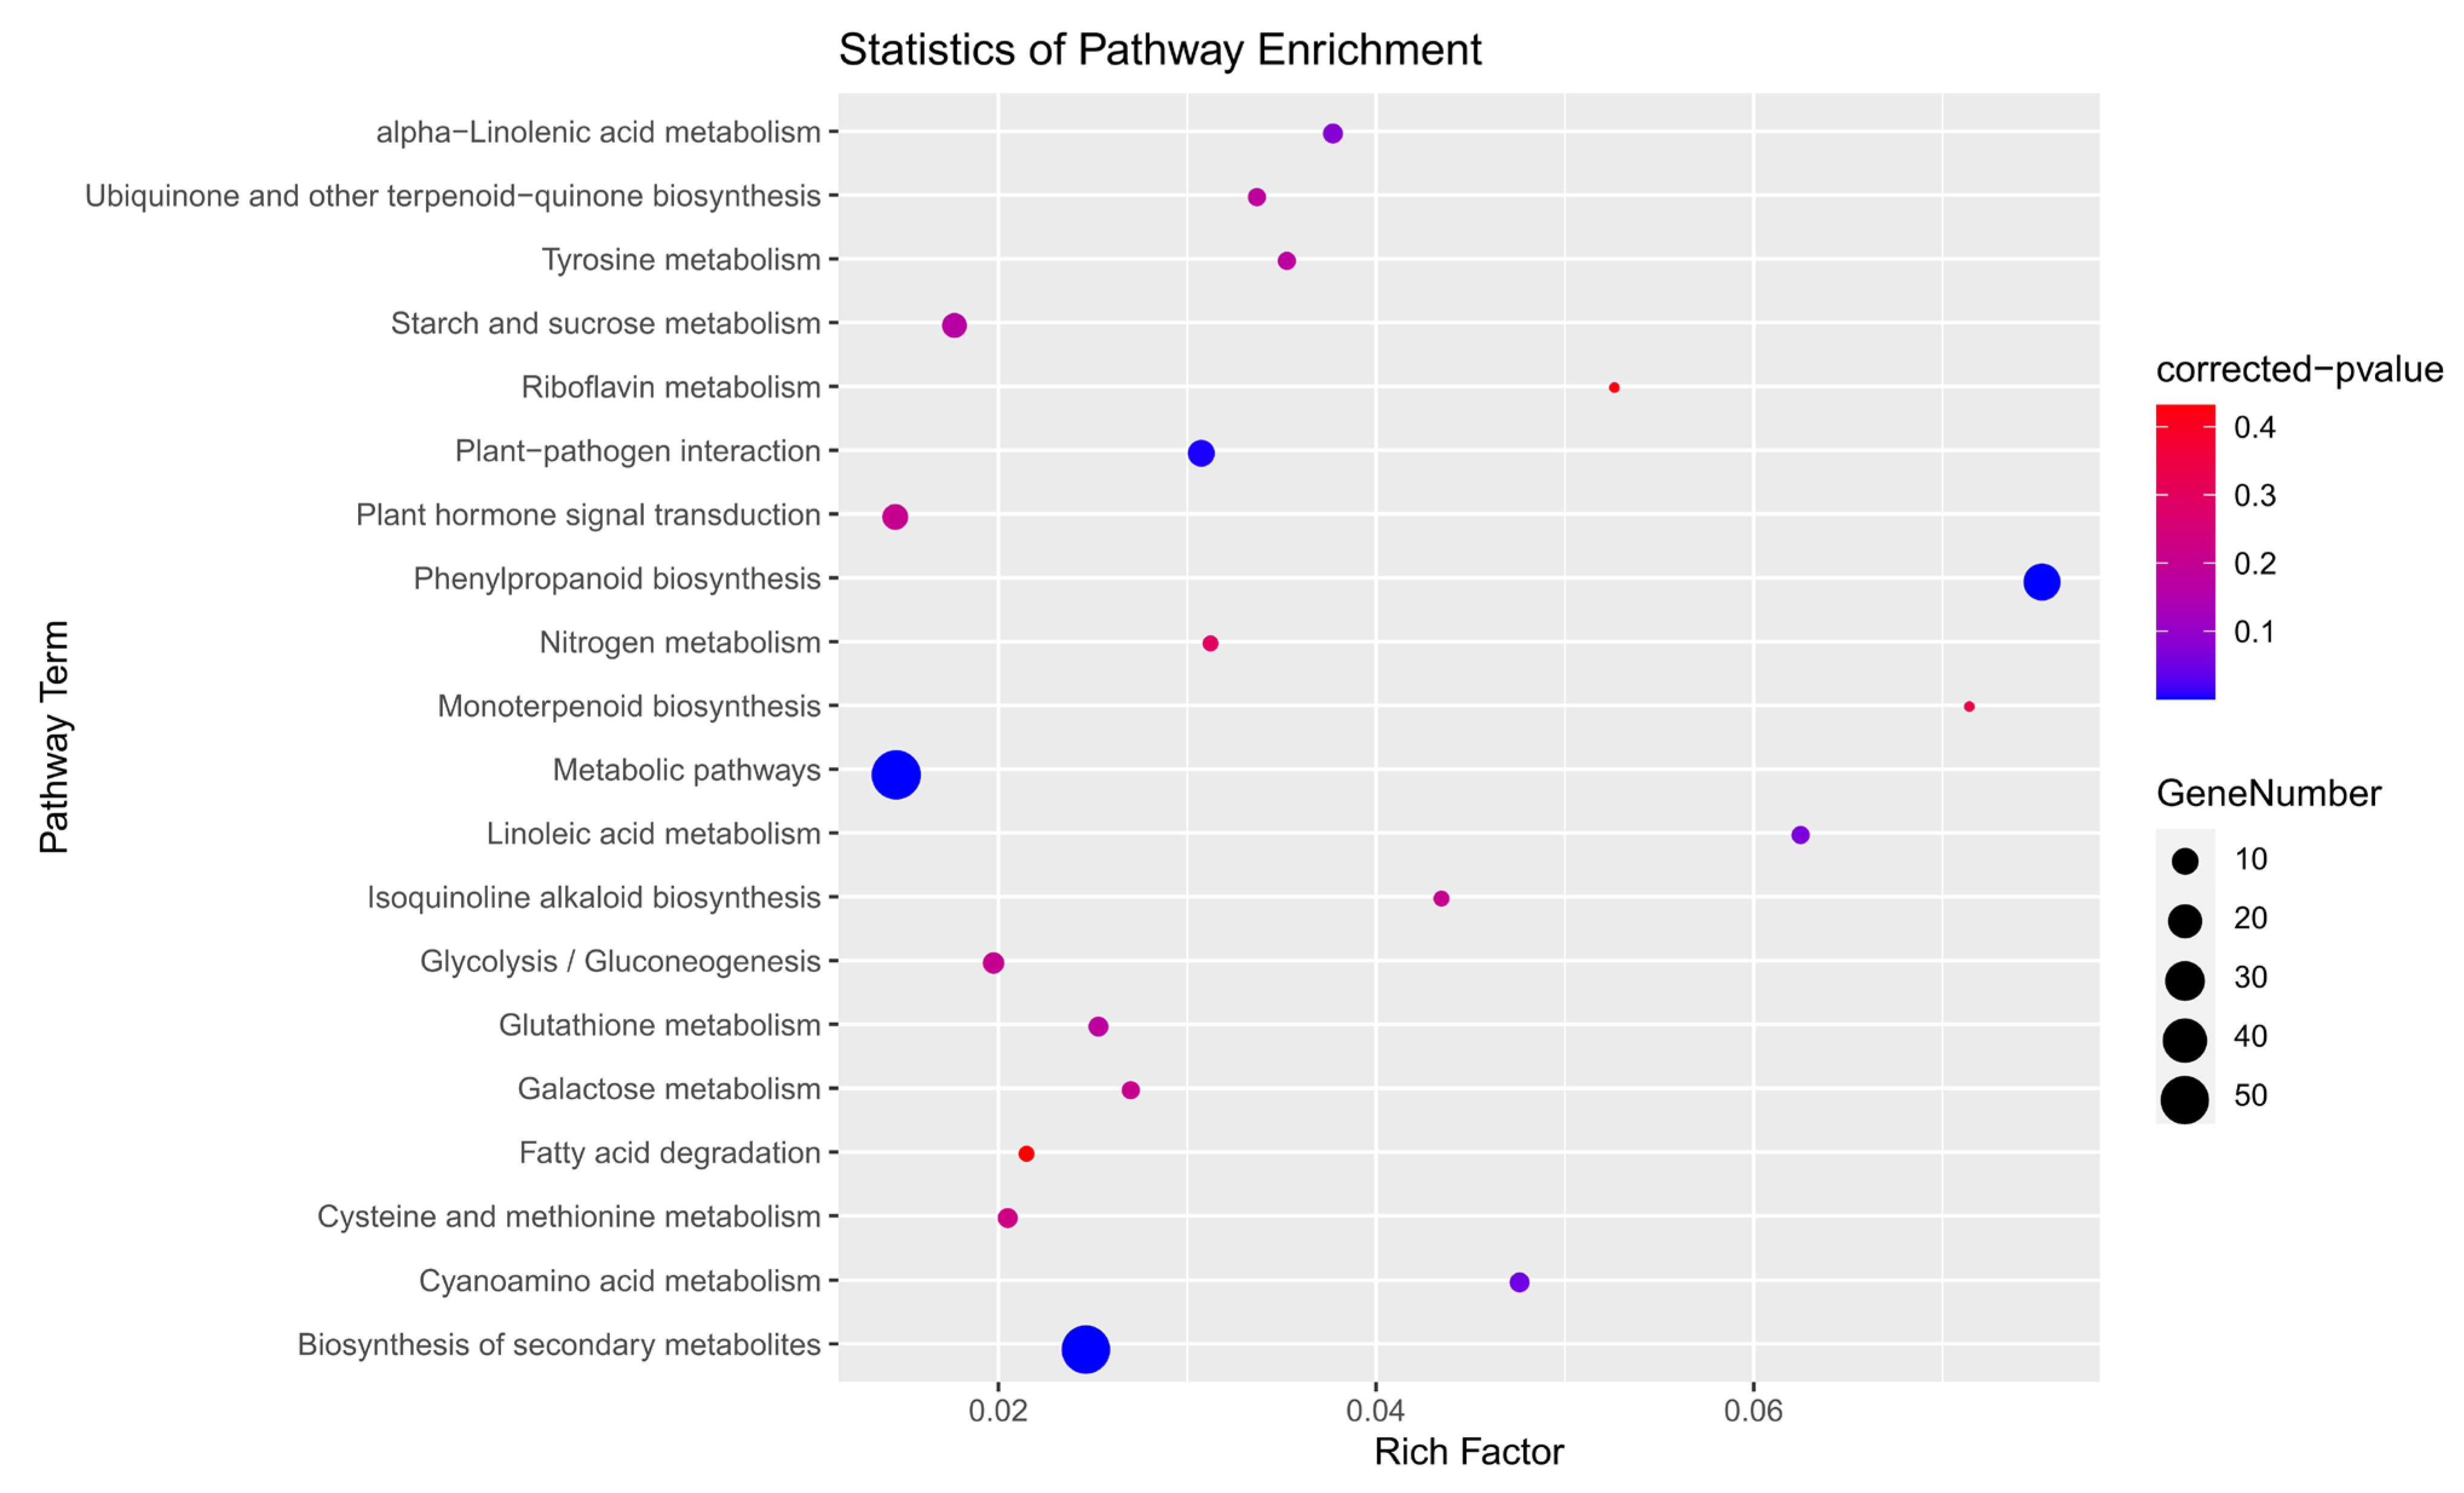
3.10. GO and KEGG Enrichment Analysis

GO enrichment analysis (Figure 10) showed 20 major biological processes (BP), among which there were more enriched differential genes in response to stimuli (GO:0010052), chemicals (GO:0008284), and stress (GO:0015985). Among the selected DEGs, GmCNGC5, GmCNGC22, GmCNGC27, and GmCNGC31 were mainly enriched in response to stress (GO:0015985). Further, regarding molecular function (MF) categories, several DEGs were enriched in oxidoreductase activity (GO:0016491) and cofactor binding (GO:0048037), whereas GmCNGC5, GmCNGC22, GmCNGC27, and GmCNGC31 were mainly enriched in transmembrane transporter activity. Regarding cellular components (CC), the DEGs were mainly concentrated in the cell periphery (GO:0071944). GmCNGC5, GmCNGC22, GmCNGC27, and GmCNGC31 were mainly enriched in the cell periphery (GO:0071944) and plasma membrane (GO:0044459) (Table S3).
KEGG analysis (Figure 11) showed that the signalling pathways associated with the relevant DEGs following disease stress mainly included protein processing in the endoplasmic reticulum, tyrosine metabolism, fatty acid degradation, alpha-linolenic acid metabolism, glycolysis/gluconeogenesis, spliceosome metabolism, plant–pathogen interaction, endocytosis, biosynthesis of secondary metabolites, and metabolic pathways. Further, under stress, the DEGs in the CNGC gene family showed enrichment in plant–pathogen interaction pathways.

3.11. Protein Interaction

To identify proteins interacting with the screened CNGC in G. max, we constructed a PPI network diagram as shown in Figure 12. This figure shows interaction between GmCNGC5 and JASMONATE ZIM (JAZ) domain-containing proteins. Studies have also shown that in plants, JAZ family proteins play a crucial role in response to environmental stress [45]. GmCNGC22 interacted with GF14C, a protein with important functions in defence and abiotic stress response [46]. Further, GmCNGC27 interacted with GMERA1A (protein farnesyltransferase) and GMERA1B, which reportedly, can respond to G. max stress by regulating ABA signalling in guard cells [47]. Further, GmCNGC31 interacted with Kup system potassium uptake proteins and protein detoxification 44.

4. Discussion

CNGC gene families have been reported in several plants, including A. thaliana [10], rice [48], tomato [49], pear [50], wheat [51], and Chinese cabbage [22]. However, most of these previous studies were based on the evolutionary analysis of the CNGC gene family of a single species. Further, studies on the analysis and comparison of CNGC gene families from species of the same family and genus as G. max are rare. Moreover, few studies have compared and screened G. max gene response levels under biological and abiotic stresses. In this study, to discuss the evolutionary relationship of the CNGC gene family in G. max, we identified and analysed the CNGC gene families of G. max, C arietinum, L. japonicus, M. truncatula, P. vulgaris, pigeon pea, and V. angularis, which contained 35, 17, 11, 19, 22, 21, and 18 CNGC genes, respectively, with two basic domains (PF00520/PF07885 and PF00027) and one CNGC-specific motif. Based on our analysis, it was obvious that the CNGC genes of the other six legumes, except G. max are very similar in number. This may be related to whole-genome replication, which is common in angiosperms [52]. Further, we divided all the CNGC gene families into four groups. Groups I–III were monogenic, while group IV could be further divided into two distinct branches (groups IV-A and IV-B). We also observed that for the seven legumes, Groups III and II contained the largest and smallest proportions of genes, respectively. Subsequently, the 35 CNGC genes in G. max were named GmCNGC1 to GmCNGC35 (Table S4) in sequence according to the grouping method used for A thaliana. The sequences of G. max CNGC proteins in the evolutionary tree and CNGC gene families of other legume crops were named in a similar manner. In general, the CNGC protein family of G max showed a close relationship with that of pigeon peas, and to measure the evolutionary pressure on the coding sequences, the Ka/Ks ratio was used. The Ka/Ks ratio obtained in the present study indicated that the CNGC genes in the seven legumes have strong selection constraints. Further, our analysis of gene structure showed that the conserved motifs of members of the same CNGC gene family were similar. The conserved motifs of the homologous genes were also highly consistent. This is in agreement with the results reported by Qingqing [22]. Furthermore, most of the conserved motifs, e.g., motifs 20, 4, and 2, were unique to Group IVA; therefore, some functions of the CNGCs genes in Group IV-A were not observed in the other groups. Conserved motifs 19, 7, 18, and 14 were common to almost all the CNGCs.
The isoelectric point (pI) and electric charge of a protein, which are important factors that affect its solubility, subcellular localisation, and interactions, depend on the insertion and deletion of homologous sites and the ecology of the organism. Reportedly, when cytoplasmic proteins have an acidic pI (pI < 7.4), their nuclear counterparts tend to have a more neutral pI (7.4 < pI < 8.1), while the pI of the membrane becomes more alkaline. Therefore, alkaline residues located on both sides of the membrane span influence the stability of the proteins in the membrane [53]. The net charge of proteins is a basic physical property, and its value directly affects their solubility, aggregation, and crystallisation. The CNGCs located on the membrane have physicochemical properties that are considerably different, and theoretically, they basically function as buffers. These differences reflect changes in protein composition, which affects the associations between receptor-charged ligands, folding and stability, dissolution and precipitation, and selective ion transport in protein channels. Interestingly, our prediction of AtCNGC19 and AtCNGC20 was based on the chloroplast membrane; however, previous studies have confirmed that AtCNGC19 and AtCNGC20 in Arabidopsis are not confined to the chloroplasts. In contrast, CNGC19 FL-GFP and CNGC20 FL-GFP were simultaneously expressed in protoplasts with vacuole membrane marker (α tip m Cherry and γ tip m Cherry) co-location. During the lengthy process of biological evolution, plants acquire complex gene regulation mechanisms to mitigate the effects of adverse environments. In our study, most CNGC showed association with stress-related regulatory elements, such as drought, high temperature, low temperature, pathogenic bacteria, injury, and other related elements. The discovery of these elements highlighted the possibility to conduct subsequent experiments and indicated that it is necessary to perform further experiments for the functional verification of CNGCs.
Morphological and molecular identification of root rot occurrence and severity in G. max growing areas in China indicated that the pathogen causing this disease is predominantly F. solani. It has also been demonstrated that F. solani hosts comprise most terrestrial plants of the orders Solanaceae [54,55], Rutaceae [56], Apiaceae [57], Cucurbitaceae [58], Araliaceae [59] and Araceae [60]; therefore, it has a wide range of hosts, and the main infestation site is the root system and stem base of the plants. It can also cause large-scale outbreaks of root rot under suitable conditions of temperature and humidity, and because of its wide host range and strong pathogenicity, it seriously restricts local agricultural production and development.
Recent studies have shown that CNGC genes can regulate intracellular Ca2+ concentration based on interactions between gene families and multiple transcription factors. These genes also play an important role in plant responses to various environmental stresses, such as saline-alkali, drought and flood, cold and heat, pathogen invasion, and heavy metals exposure [61,62,63,64,65,66]. In this study, we observed GmCNGC gene responses to disease stress. Specifically, under disease stress, GmCNGC27 and GmCNGC31 were significantly upregulated, whereas GmCNGC5 and GmCNGC22 were significantly downregulated. Further, via the functional enrichment analysis of the DEGs, we observed that CNGC gene family pathways are involved in stress regulation following plant pathogen interaction. These genes act on the plasma membrane, regulate the concentration of inorganic ions inside and outside the membrane via transmembrane ion channels, and intervene in body regulation under stress through signal transduction, consistent with the previously reported observation that CNGC functions as a ligand-gated channel [67].
Overall, these abovementioned findings indicated that the genes of the CNGC gene family might participate in both biological stress and abiotic stress. Therefore, to a certain extent, this study provides genetic resources and can serve as a theoretical reference for further studies on the breeding of stress resistant G. max.

5. Conclusions

In this study, we identified 35 GmCNGC genes in the G. max genome. Phylogenetic analysis revealed that all these GmCNGCs contain two basic domains and one CNGC-specific motif. Further, a close relationship was observed between the CNGC gene family of G. max and that of C. cajana. Disease stress tests showed that GmCNGC5, GmCNGC22, GmCNGC27, and GmCNGC31 could respond to disease stress by regulating the concentration of inorganic ions inside and outside the cell membrane via transmembrane ion channels to achieve signal transduction and participate in the stress regulation system.

Supplementary Materials

The following supporting information can be downloaded at: https://www.mdpi.com/article/10.3390/biology12030439/s1.

Author Contributions

Y.C. and J.W. contributed to the design and planning of this research. Y.C. performed the laboratory experiments and analysed the results. J.W. participated in Identification of gene family. Thus, Y.C. was the study’s first author, and J.W. contribution came second, who is the second first author. Q.S., J.R. and Y.B. performed the effective test guidance. Y.C. prepared the manuscript. Q.S., L.B., W.L. and J.R. revised the manuscript. All authors have read and agreed to the published version of the manuscript.

Funding

The work was partly supported by Degree and Graduate Education Reform and Development Project of Beijing Agricultural University [2022YJS016], and Beijing Innovation Team of the Modern Agro-industry Technology Research System for Crop (2022).

Institutional Review Board Statement

The study did not require ethical approval.

Informed Consent Statement

Not applicable.

Data Availability Statement

Transcriptome data have been submitted to SRA database with the following project number: PRJNA849746. Additionally, the accession number of the pathogen culture is OQ519857. Additionally, other data that support the findings of this study are available from the corresponding author upon reasonable request.

Acknowledgments

We would like to extend our gratitude to Yi Zheng of BUA Bioinformatics Center for his contribution to this article, and to Chuan-zhi Wang of Fuyang Academy of Agricultural Sciences/National Glycine max Improvement Center for his contribution to this article.

Conflicts of Interest

The authors declare no conflict of interest.

References

  1. Feng, Z.J.; Xu, S.C.; Liu, N.; Zhang, G.W.; Hu, Q.Z.; Gong, Y.M. Soybean TCP transcription factors: Evolution, classification, protein interaction and stress and hormone responsiveness. Plant Physiol. Biochem. 2018, 127, 129–142. [Google Scholar] [CrossRef] [PubMed]
  2. Dhaubhadel, S.; Marsolais, F. Transcriptomics of Legume Seed: Soybean a Model Grain Legume; Springer Science+Business Media: New York, NY, USA, 2012. [Google Scholar]
  3. Li, M.H. Investigation and Identification of Soybean Field Diseases in Northeast China; Shenyang Agricultural University: Shenyang, China, 2016. [Google Scholar]
  4. Talke, I.N.; Damien, B.; Maathuis, F.; Sanders, D. CNGCs: Prime targets of plant cyclic nucleotide signalling? Trends Plant Sci. 2003, 8, 286–293. [Google Scholar] [CrossRef] [PubMed]
  5. Zelman, A.K.; Dawe, A.; Gehring, C.; Berkowitz, G.A. Evolutionary and Structural Perspectives of Plant Cyclic Nucleotide-Gated Cation Channels. Front. Plant Sci. 2012, 3, 95. [Google Scholar] [CrossRef] [PubMed] [Green Version]
  6. Cukkemane, A.; Seifert, R.; Kaupp, U.B. Cooperative and uncooperative cyclic-nucleotide-gated ion channels. Trends Biochem. Sci. 2011, 36, 55–64. [Google Scholar] [CrossRef] [PubMed]
  7. Young, E.C.; Krougliak, N. Distinct Structural Determinants of Efficacy and Sensitivity in the Ligand-binding Domain of Cyclic Nucleotide-gated Channels. J. Biol. Chem. 2003, 279, 3553–3562. [Google Scholar] [CrossRef] [Green Version]
  8. Schuurink, R.C.; Shartzer, S.F.; Fath, A.; Jones, R.L. Characterization of a calmodulin-binding transporter from the plasma membrane of barley aleurone. Proc. Natl. Acad. Sci. USA 1998, 95, 1944–1949. [Google Scholar] [CrossRef] [Green Version]
  9. Arazi, T.; Kaplan, B.; Fromm, H. A high-affinity calmodulin-binding site in a tobacco plasma-membrane channel protein coincides with a characteristic element of cyclic nucleotide-binding domains. Plant Mol. Biol. 2000, 42, 591–601. [Google Scholar] [CrossRef]
  10. Köhler, C.; Neuhaus, G. Characterisation of calmodulin binding to cyclic nucleotide-gated ion channels from Arabidopsis thaliana. FEBS Lett. 2000, 471, 133–136. [Google Scholar] [CrossRef] [Green Version]
  11. Reddy, V.S.; Ali, G.S.; Reddy, A. Genes Encoding Calmodulin-binding Proteins in the Arabidopsis Genome. J. Biol. Chem. 2002, 277, 9840–9852. [Google Scholar] [CrossRef] [Green Version]
  12. Frietsch, S.; Wang, Y.F.; Sladek, C.; Poulsen, L.R.; Romanowsky, S.M.; Schroeder, J.L.; Harper, J.F. A cyclic nucleotide-gated channel is essential for polarized tip growth of pollen. Proc. Natl. Acad. Sci. USA 2007, 104, 14531–14536. [Google Scholar] [CrossRef] [Green Version]
  13. Zhang, S.; Pan, Y.; Tian, W.; Dong, M.; Zhu, H.; Luan, S.; Li, L. Arabidopsis CNGC14 Mediates Calcium Influx Required for Tip Growth in Root Hairs. Mol. Plant 2017, 10, 1004–1006. [Google Scholar] [CrossRef] [Green Version]
  14. Ma, W.; Smigel, A.; Walker, R.K.; Moeder, W.; Yoshioka, K.; Berkowitz, J.A. Leaf Senescence Signaling: The Ca2+-Conducting Arabidopsis Cyclic Nucleotide Gated Channel2 Acts through Nitric Oxide to Repress Senescence Programming. Plant Physiol. 2010, 154, 733–743. [Google Scholar] [CrossRef] [Green Version]
  15. Charpentier, M.; Sun, J.; Martins, T.V.; Radhakrishnan, G.V.; Findlay, K.; Soumpourou, E.; Thouin, J.; Véry, A.; Sanders, D.; Morris, R.J.; et al. Nuclear-localized cyclic nucleotide-gated channels mediate symbiotic calcium oscillations. Science 2016, 352, 1102–1105. [Google Scholar] [CrossRef]
  16. Jin, Y.; Jing, W.; Zhang, Q.; Zhang, W. Cyclic nucleotide gated channel 10 negatively regulates salt tolerance by mediating Na+ transport in Arabidopsis. J. Plant. Res. 2015, 128, 211–220. [Google Scholar] [CrossRef]
  17. Shao, H.B.; Chu, L.Y.; Shao, M.A.; Li, S.Q.; Yao, J.C. Bioengineering plant resistance to abiotic stresses by the global calcium signal system. Biotechnol. Adv. 2008, 26, 503–510. [Google Scholar]
  18. Tunc-Ozdemir, M.; Tang, C.; Ishka, M.R.; Brown, E.; Groves, N.R.; Myers, C.T.; Rato, C.; Poulsen, L.R.; McDowell, S.; Miller, G.; et al. A cyclic nucleotide-gated channel (CNGC16) in pollen is critical for stress tolerance in pollen reproductive development. Plant Physiol. 2013, 161, 1010–1020. [Google Scholar] [CrossRef] [Green Version]
  19. Nawaz, Z.; Kakar, K.U.; Ullah, R.; Yu, S.; Zhang, J.; Shu, Q.Y.; Ren, X.L. Genome-wide identification, evolution and expression analysis of cyclic nucleotide-gated channels in tobacco (Nicotiana tabacum L.). Genomics 2019, 111, 142–158. [Google Scholar] [CrossRef]
  20. Clough, S.J.; Fengler, K.A.; Yu, I.C.; Lippok, B.; Smith Jr, R.K.; Bent, A.F. The Arabidopsis dnd1 “defense, no death” gene encodes a mutated cyclic nucleotide-gated ion channel. Proc. Natl. Acad. Sci. USA 2000, 97, 9323–9328. [Google Scholar] [CrossRef] [Green Version]
  21. Ali, R.; Ma, W.; Lemtiri-Chlieh, F.; Tsaltas, D.; Leng, Q.; Bodman, S.; Berkowitz, G.A. Death don’t have no mercy and neither does calcium: Arabidopsis CYCLIC NUCLEOTIDE GATED CHANNEL2 and innate immunity. Plant Cell 2007, 19, 1081–1095. [Google Scholar] [CrossRef] [Green Version]
  22. Li, Q.Q.; Yang, S.Q.; Ren, J.; Ye, X.; Jiang, X.; Liu, Z. Genome-wide identification and functional analysis of the cyclic nucleotide-gated channel gene family in Chinese cabbage. Biotech 2019, 9, 114. [Google Scholar] [CrossRef]
  23. Tao, X.; Chengjie, C.; Chuhao, L.; Liu, J.; Liu, C.; He, Y. Genome-wide investigation of WRKY gene family in pineapple: Evolution and expression profiles during development and stress. BMC Genom. 2018, 19, 490. [Google Scholar]
  24. Kakar, K.U.; Zarqa, N.; Khadija, K.; Ali, E.; Almoneafy, A.A.; Ullah, R.; Ren, X.L.; Shu, Q.Y. Comprehensive genomic analysis of the CNGC gene family in Brassica oleracea: Novel insights into synteny, structures, and transcript profiles. BMC Genom. 2017, 18, 869. [Google Scholar] [CrossRef] [PubMed] [Green Version]
  25. Letunic, I.; Khedkar, S.; Bork, P. SMART: Recent updates, new developments and status in 2020. Nucleic Acids Res. 2021, 49, 458–460. [Google Scholar] [CrossRef]
  26. Marchler-Bauer, A.; Derbyshire, M.K.; Gonzales, N.R.; Lu, S.; Chitsaz, F.; Geer, L.Y.; Geer, R.C.; He, J.; Gwadz, M.; Hurwitz, D.I.; et al. CDD: NCBI’s conserved domain database. Nucleic Acids Res. 2015, 43, 222–226. [Google Scholar] [CrossRef] [PubMed] [Green Version]
  27. Bailey, T.L.; Boden, M.; Buske, F.A.; Frith, M.; Grant, C.E.; Clementi, L.; Ren, J.; Li, W.W.; Noble, W.S. MEME SUITE: Tools for motif discovery and searching. Nucleic Acids Res. 2009, 37, 202–208. [Google Scholar] [CrossRef] [PubMed]
  28. Nei, M.; Gojobori, T. Simple methods for estimating the numbers of synonymous and nonsynonymous nucleotide substitutions. Mol. Biol. Evol. 1986, 3, 418–426. [Google Scholar]
  29. Kim, M.Y.; Kang, Y.J.; Lee, T.; Lee, S.H. Divergence of Flowering-Related Genes in Three Legume Species. Plant Genome 2013, 6, 1–12. [Google Scholar] [CrossRef] [Green Version]
  30. Xu, L.; Qiao, X.; Zhang, M.; Zhang, S. Genome-Wide analysis of aluminum-activated malate transporter family genes in six rosaceae species, and expression analysis and functional characterization on malate accumulation in Chinese white pear. Plant Sci. 2018, 24, 431–442. [Google Scholar]
  31. Ling, L.; Zhang, W.; An, Y.; Du, B.; Wang, D.; Guo, C. Genome-wide analysis of the TCP transcription factor genes in five legume genomes and their response to salt and drought stresses. Funct. Integr. Genom. 2020, 20, 537–550. [Google Scholar] [CrossRef]
  32. Wang, Y.; Tang, H.; Debarry, J.D.; Tan, X.; Li, J.; Wang, X.; Lee, T.; Jin, H.; Marler, B.; Guo, H.; et al. MCScanX: A toolkit for detection and evolutionary analysis of gene synteny and collinearity. Nucleic Acids Res. 2012, 40, 49. [Google Scholar] [CrossRef] [Green Version]
  33. Lescot, M.; Déhais, P.; Thijs, G.; Marchal, K.; Moreau, Y.; Peer, Y.V.; Rouzé, P.; Rombauts, S. PlantCARE, a database of plant cis-acting regulatory elements and a portal to tools for in silico analysis of promoter sequences. Nucleic Acids Res. 2002, 30, 325–327. [Google Scholar] [CrossRef]
  34. Fang, Z.D. Research Methods of Plant Diseases; China Agriculture Press: Beijing, China, 1998. [Google Scholar]
  35. Sohrabi, M.; Samsampour, D.; Bagheri, A. Molecular Identification of Fungal Endophytes of Medicinal Plant Citrullus colocynthis (L.) Schrad as a Medicinal Plant: Role of Tissue Type and Sampling Location on the Diversity. Mol. Biotechnol. 2023, 1–8, published online ahead of print. [Google Scholar] [CrossRef]
  36. Cong, L.L.; Kang, J.M.; Zhang, T.J.; Long, R.; Yang, Q. Identification and pathogenicity test of pathogenic Fusarium of alfafa root rot. Acta Agrestia Sin. 2017, 25, 857–865. [Google Scholar]
  37. Liu, M.; Wang, L.J.; Cao, S.; Wu, X.; Huang, J. Study on Identification of Cabbage Seedborne Fusarium Species and Their Pathogenicity. Seed 2012, 31, 26–29. [Google Scholar]
  38. Wang, J.; Ren, J.D.; Li, W.Y.; Shang, Q.X. Pathogen identification of soybean black spot. J. Beijing Agric. Coll. 2021, 36, 92–96. [Google Scholar]
  39. Tiwari, P.; Srivastava, D.; Chauhan, A.S.; Indoliya, Y.; Singh, P.K.; Tiwari, S.; Fatima, T.; Mishra, S.K.; Dwivedi, S.; Agarwal, L.; et al. Root system architecture, physiological analysis and dynamic transcriptomics unravel the drought-responsive traits in rice genotypes. Ecotoxicol. Environ. Saf. 2021, 207, 111252. [Google Scholar] [CrossRef]
  40. Robinson, M.D.; McCarthy, D.J.; Smyth, G.K. edgeR: A Bioconductor package for differential expression analysis of digital gene expression data. Bioinformatics 2010, 26, 139–140. [Google Scholar] [CrossRef] [Green Version]
  41. Carbon, S.; Douglass, E.; Good, B.M.; Unni, D.R.; Harris, N.L.; Mungall, C.J.; Basu, S.; Chisholm, R.L.; Dodson, R.J.; Hartline, E.; et al. The Gene Ontology resource: Enriching a GOld mine. Nucleic Acids Res. 2021, 49, 325–334. [Google Scholar]
  42. Bu, D.; Luo, H.; Huo, P.; Wang, Z.; Zhang, S.; He, Z.; Wu, Y.; Zhao, L.; Liu, J.; Guo, J.; et al. KOBAS-i: Intelligent prioritization and exploratory visualization of biological functions for gene enrichment analysis. Nucleic Acids Res. 2021, 49, 317–325. [Google Scholar] [CrossRef]
  43. Wang, J.T.; Ramage, D.; Amin, N.; Baliga, N.S.; Wang, J.Y.; Ramage, D.; Amin, N.; Schwikowski, B.; Ideker, T. Cytoscape: A software environment for integrated models of biomolecular interaction networks. Genome Res. 2003, 13, 2498–2504. [Google Scholar]
  44. Song, W.; Song, S.; Lan, J.; Zheng, D.; Xu, X.; Huang, L.; Yan, C.; Liu, Y.; Tang, W. First Report of root rot Caused by Fusarium solani and F. breve on kiwifruit in China. Plant Dis. 2022. (published online ahead of print, 2022 Nov 10). [Google Scholar]
  45. Zhang, G.; Yan, X.; Zhang, S.; Zheng, D.; Xu, X.; Huang, L.; Yan, C.; Liu, Y.; Tang, W. The jasmonate-ZIM domain gene VqJAZ4 from the Chinese wild grape Vitis quinquangularis improves resistance to powdery mildew in Arabidopsis thaliana. Plant Physiol. Bioch. 2019, 143, 329–339. [Google Scholar] [CrossRef] [PubMed]
  46. Chen, F.; Li, Q.; Sun, L.X.; He, Z. The rice 14-3-3 gene family and its involvement in responses to biotic and abiotic stress. DNA Res. 2006, 13, 53–63. [Google Scholar] [CrossRef] [PubMed] [Green Version]
  47. Wang, Y.; Ying, J.; Kuzma, M.; Chalifoux, M.; Sample, A.; McArthur, C.; Uchacz, T.; Sarvas, C.; Wan, J.; Dennis, D.T.; et al. Molecular tailoring of farnesylation for plant drought tolerance and yield protection. Plant J. 2005, 43, 413–424. [Google Scholar] [CrossRef]
  48. Nawaz, Z.; Kakar, K.U.; Saand, M.A.; Shu, Q.Y. Cyclic nucleotide-gated ion channel gene family in rice, identification, characterization and experimental analysis of expression response to plant hormones, biotic and abiotic stresses. BMC Genomics 2014, 15, 853. [Google Scholar] [CrossRef] [Green Version]
  49. Saand, M.A.; Xu, Y.P.; Li, W.; Wang, J.P.; Cai, X.Z. Cyclic nucleotide gated channel gene family in tomato, genome-wide identification and functional analyses in disease resistance. Front. Plant Sci. 2015, 6, 303. [Google Scholar] [CrossRef] [Green Version]
  50. Chen, J.Q.; Hao, Y.; Gu, J.P.; Li, L.; Liu, Z.; Jiang, X.; Zou, H.; Wei, S.; Zhang, S.; Wu, J. Genomic characterization, phylogenetic comparison and differential expression of the cyclic nucleotide-gated channels gene family in pear (Pyrus bretchneideri Rehd). Genomics 2015, 105, 39–52. [Google Scholar] [CrossRef]
  51. Guo, J.; Islam, M.A.; Lin, H.; Ji, C.; Duan, Y.; Liu, P.; Zeng, Q.; Day, B.; Kang, Z.; Guo, J. Genome-Wide Identification of Cyclic Nucleotide-Gated Ion Channel Gene Family in Wheat and Functional Analyses of TaCNGC14 and TaCNGC16. Front. Plant Sci. 2018, 9, 18. [Google Scholar] [CrossRef] [Green Version]
  52. Cannon, S.B.; Mitra, A.; Baumgarten, A.; Young, N.D.; May, G. The roles of segmental and tandem gene duplication in the evolution of large gene families in Arabidopsis thaliana. BMC Plant Biol. 2004, 4, 10. [Google Scholar] [CrossRef] [Green Version]
  53. Khaldi, N.; Shields, D.C. Shift in the isoelectric-point of milk proteins as a consequence of adaptive divergence between the milks of mammalian species. Biol. Direct. 2011, 6, 40. [Google Scholar] [CrossRef] [Green Version]
  54. Wang, X.G.; Yang, B.; Guo, C.J.; Zhang, L.R.; Shen, Q. Identification and pathogenicity test of pathogens causing potato Fusarium root rot in Ningxia Hui Autonomous Region. Acta Phytophy Sin. 2020, 47, 609–619. [Google Scholar]
  55. Fang, X.C.; Qu, H.L.; Zhao, S.F.; Guo, K.; Ma, M. Pathogen identification of root rot of processed pepper in Xinjiang. Northern. Hort. 2016, 15, 108–112. [Google Scholar]
  56. Tian, F.M.; Chen, Q.; Wang, H.; Zhuo, P.; Sun, J. Isolation, Identification and Biological Characteristics of the Pathogen Bacte-ria of Zanthoxylum bungeanum Root Rot in Longnan. J. Northeast. Agric. Sci. 2022, 47, 95–107. [Google Scholar]
  57. Han, F.Y.; Wang, Y.; Yu, C.Z.; Gao, J.; Yang, S.; Jia, R.; Hu, S.; Zhu, C. Isolation and identification of carrot root rot caused by Fusarium solani. J. Northern Agric. 2020, 48, 70–75. [Google Scholar]
  58. Yan, L.Y.; Zhang, Y.Y.; Ma, K.H.; Song, H.; Wang, S. Multiple PCR Detection of Fusarium oxysporum and Fusarium solani in Cucurbitaceous Plants. Acta Agric. Boreali-Sin. 2014, 29, 44–47. [Google Scholar]
  59. Wang, J.; Liang, Z.S.; Kang, B.; Luo, M.J. Identification of Root Rot pathogen of Panax notoginseng from Wenshan. J. Northwest Univ. 2015, 30, 158–163. [Google Scholar]
  60. Shi, J.L.; Li, Y.Q.; Hu, K.M.; Ren, J.G.; Liu, H.M. Isolation and identification of pathogens from rotted root of Pinellia ternata in Guizhou province. Microbiol China. 2015, 42, 289–299. [Google Scholar]
  61. Moon, J.Y.; Belloeil, C.; Ianna, M.L.; Shin, R. Arabidopsis CNGC Family Members Contribute to Heavy Metal Ion Uptake in Plants. Int. J. Mol. Sci. 2019, 20, 413. [Google Scholar] [CrossRef] [Green Version]
  62. Wang, J.; Liu, X.; Zhang, A.; Ren, Y.; Wu, F.; Wng, G.; Xu, Y.; Lei, C.; Zhu, S.; Pan, T.; et al. A cyclic nucleotide-gated channel mediates cytoplasmic calcium elevation and disease resistance in rice. Cell Res. 2019, 29, 820–831. [Google Scholar] [CrossRef]
  63. Zhang, W.; Dong, C.; Zhang, Y.; Zhu, J.; Dai, H.; Bai, S. An apple cyclic nucleotide-gated ion channel gene highly responsive to Botryosphaeria dothidea infection enhances the susceptibility of Nicotiana benthamiana to bacterial and fungal pathogens. Plant Sci. 2018, 269, 94–105. [Google Scholar] [CrossRef]
  64. Zhang, X.R.; Xu, Y.P.; Cai, X.Z. SlCNGC1 and SlCNGC14 Suppress Xanthomonas oryzae pv. oryzicola-Induced Hypersensitive Response and Non-host Resistance in Tomato. Front. Plant Sci. 2018, 9, 285. [Google Scholar] [CrossRef] [PubMed] [Green Version]
  65. Ladwig, F.; Dahlke, R.I.; Stührwohldt, N.; Hartmann, J.; Harter, K.; Sauter, M. Phytosulfokine regulates growth in Arabidopsis through a response module at the plasma membrane that includes CYCLIC NUCLEOTIDE-GATED CHANNEL17, H+-ATPase, and BAK1. Plant Cell 2015, 27, 1718–1729. [Google Scholar] [CrossRef] [PubMed] [Green Version]
  66. Meena, M.K.; Prajapati, R.; Krishna, D.; Divakaran, K.; Pandey, Y.; Reichelt, M.; Mathew, M.K.; Boland, W.; Mithöfer, A.; Vadassery, J. The Ca2+ channel CNGC19 regulates Arabidopsis defense against spodoptera herbivory. Plant Cell 2019, 31, 1539–1562. [Google Scholar] [CrossRef] [PubMed]
  67. Qi, Z.; Verma, R.; Gehring, C.; Yamaguchi, Y.; Zhao, Y.; Ryan, C.A.; Berkowitz, G.A. Ca2+ signaling by plant Arabidopsis thaliana Pep peptides depends on AtPepR1, a receptor with guanylyl cyclase activity, and cGMP-activated Ca2+ channels. Proc. Natl. Acad. Sci. USA 2010, 107, s21193. [Google Scholar] [CrossRef] [Green Version]
Figure 1. Systematic evolutionary relationships within the CNGC gene family (AtCNGC, GmCNGC, MtCNGC, CaCNGC, PpCNGC, LjCNGC, VaCNGC, and PvCNGC refer to the gene families of A. thaliana, G. max, M. truncatula, C. arietinum, C. cajan (pigeon pea), L. japonicus, V. angularis, and P. vulgaris, respectively).
Biology 12 00439 g001
Figure 2. Locations of CNGC genes on G. max chromosomes.
Biology 12 00439 g002
Figure 3. Phylogenetic relationships, gene structure, and architecture of conserved protein motifs in CNGC genes from legumes.
Biology 12 00439 g003
Figure 4. Collinear analysis of CNGC genes in G. max, A. thaliana, and six other legumes (The grey lines in the background indicate collinear regions in the genomes of G. max and other plants, while the red lines highlight collinear CNGC gene pairs. The prefixes ATH, Gm, Mt, Ca, Pp, Lj, Va, and Pv refer to A. thaliana, G. max, M. truncatula, C. arietinum, pigeon pea, L. japonicus, V. angularis, and P. vulgaris, respectively).
Biology 12 00439 g004
Figure 5. Cis-acting elements of the promoter sequence of CNGC genes in G. max.
Biology 12 00439 g005
Figure 6. Symptoms of disease in the field and the morphological characteristics of the pathogens ((a) symptoms in the field; (b) colonies of the pathogen isolated from the PDA medium; (c) conidia shape under the microscope).
Biology 12 00439 g006
Figure 7. Root changes in G. max seedlings after inoculation with pathogenic fungi at (a) 0 h, (b) 24 h, (c) 3 d, and (d) 7 d.
Biology 12 00439 g007
Figure 8. Phylogenetic tree based on the ITS-rRNA of the pathogenic fungus and other phytophysical fungi. Note: The data comes from National Centre for Biotechnology Information Search database (NCBI).
Biology 12 00439 g008
Figure 9. Differences in the transcription levels of G. max genes under disease stress (Upregulated and downregulated genes are indicated in red and blue, respectively. Genes with abnormal transcription levels are marked in the figure. (a,b) represent differences of gene transcription levels between days 3, 7 and blank control, respectively, after disease stress, and (c) represent differences of gene transcription levels between days 7 and 1 after disease stress).
Biology 12 00439 g009aBiology 12 00439 g009b
Figure 10. GO enrichment.
Biology 12 00439 g010
Figure 11. KEGG enrichment.
Biology 12 00439 g011
Figure 12. Protein interaction network diagram ((ad) represent GmCNGC5, GmCNGC22 GmCNGC27 and GmCNGC31, respectively).
Biology 12 00439 g012
Table 1. Identification and classification of seven leguminous crops.
SpeciesNumber of CNGCGroup
IIIIIIIV-AIV-B
Glycine max35841085
Cicer arietinum1752532
Lotus japonicus1132312
Medicago truncatula1941752
Phaseolus vulgaris2242763
Cajanus cajan
(Pigeon Pea)
2144742
Vigna angularis1832733
Disclaimer/Publisher’s Note: The statements, opinions and data contained in all publications are solely those of the individual author(s) and contributor(s) and not of MDPI and/or the editor(s). MDPI and/or the editor(s) disclaim responsibility for any injury to people or property resulting from any ideas, methods, instructions or products referred to in the content.

