


Immediate Effects of Whole-Body versus Local Dynamic Electrostimulation of the Abdominal Muscles in Healthy People Assessed by Ultrasound: A Randomized Controlled Trial

 ,
,  ,
,  , , and
Abstract
:Simple Summary
Abstract
1. Introduction
2. Materials and Methods
2.1. Study Design
2.2. Participant Recruitment
2.3. Sample Size Calculation
2.4. Randomization and Blinding
2.5. Procedure
2.6. Interventions

| Session: 20’ | WB-EMS/EMS | Dynamic Exercise Protocol [41,43,45] |
|---|---|---|
| WARM UP 5’ | Bipolar rectangular current 20 Hz—350 µs No periods of stimulation/rest 2/3 RPE | Walking, running, and skipping |
| MAIN PART 12’ | Bipolar rectangular current 85 Hz—350 µs 4″ stimulation/4″ rest 4/5/6 RPE |
|
| COOL DOWN 3’ | Bipolar rectangular current 5 Hz—150 µs 1″ stimulation/1″ rest 2/1 RPE | Stretching |
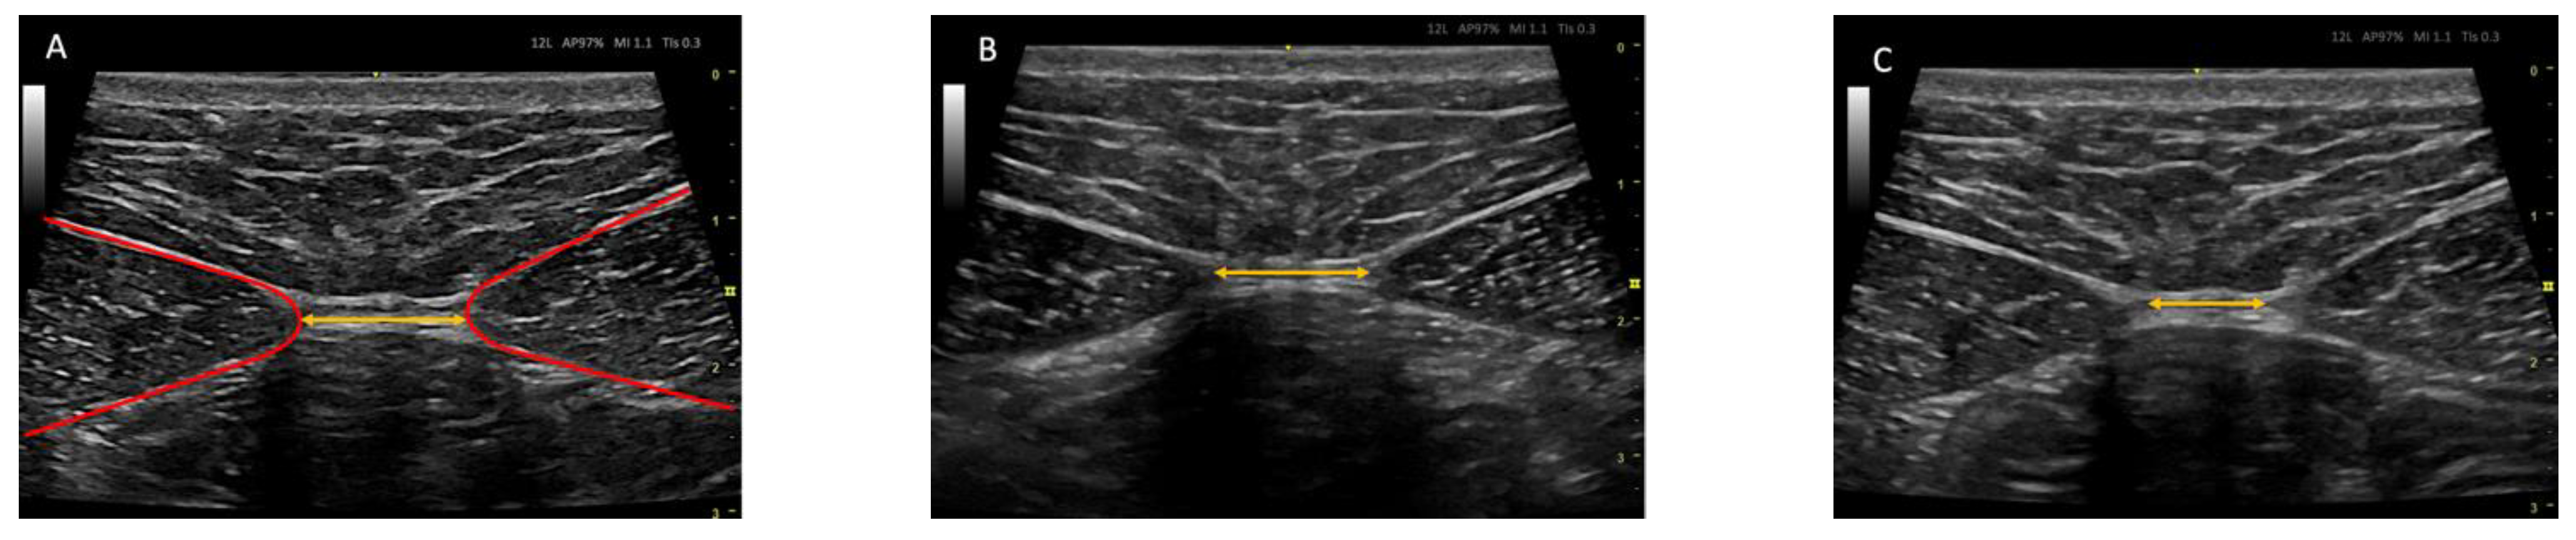
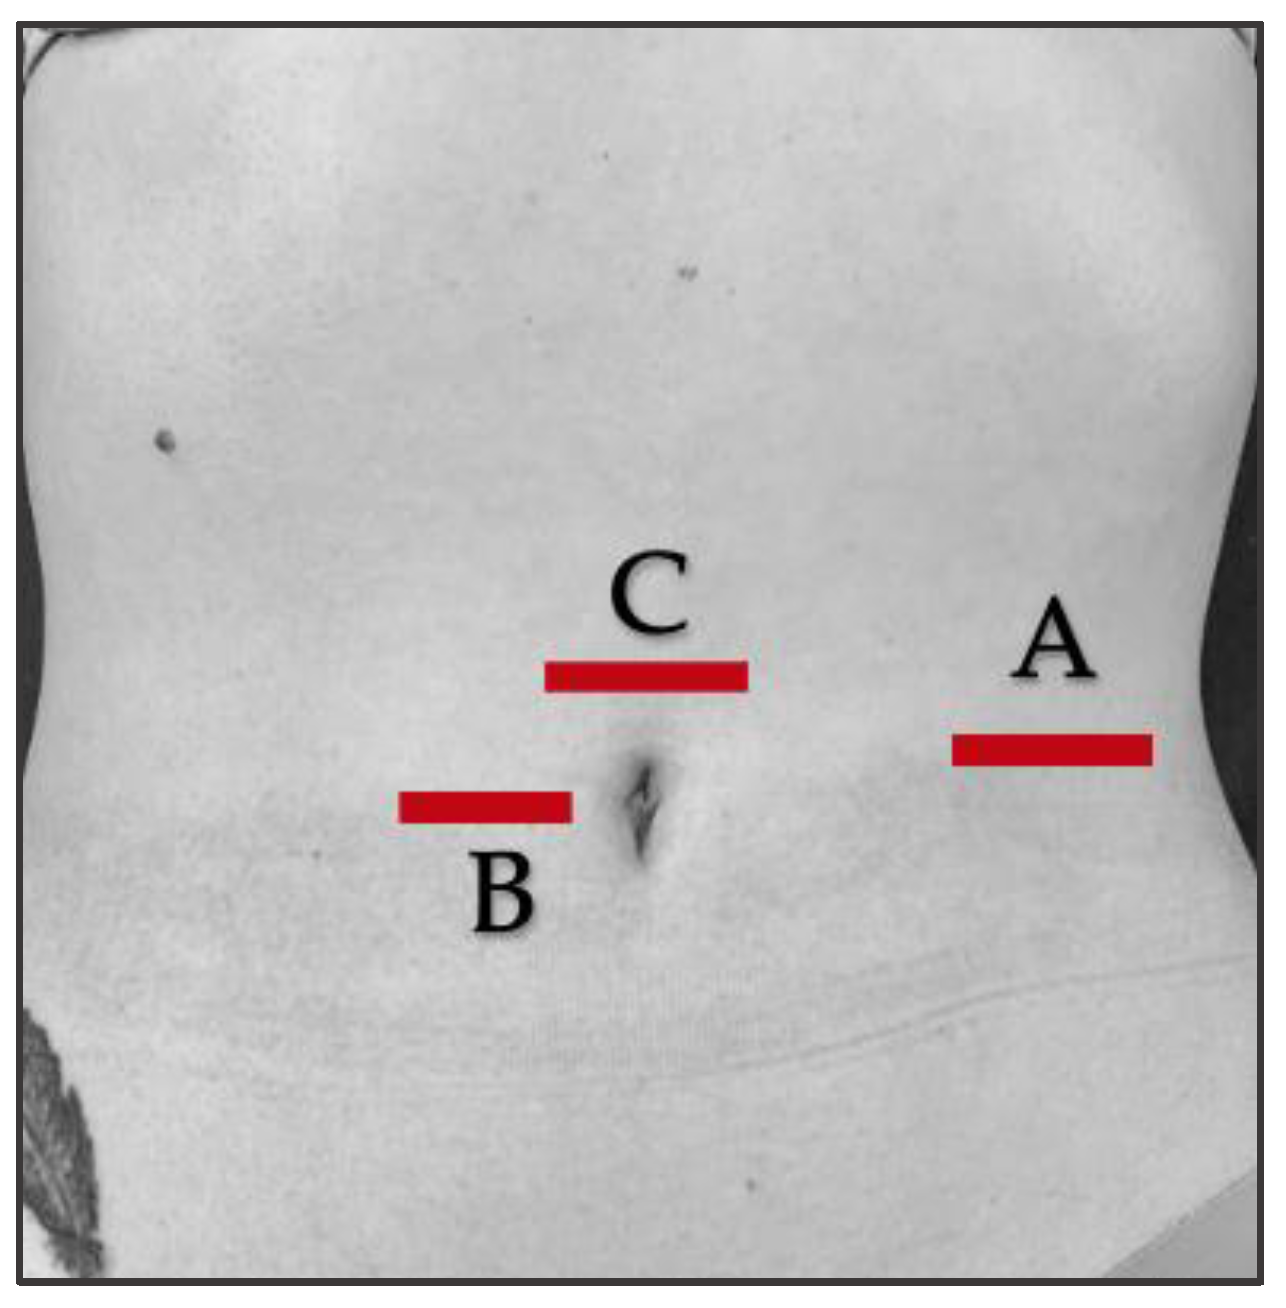
2.7. Ultrasound Protocol
2.8. Outcome Measurements/Descriptive Data
2.9. Statistical Analyses
3. Results
3.1. Flow Diagram
3.2. Baseline Measurements
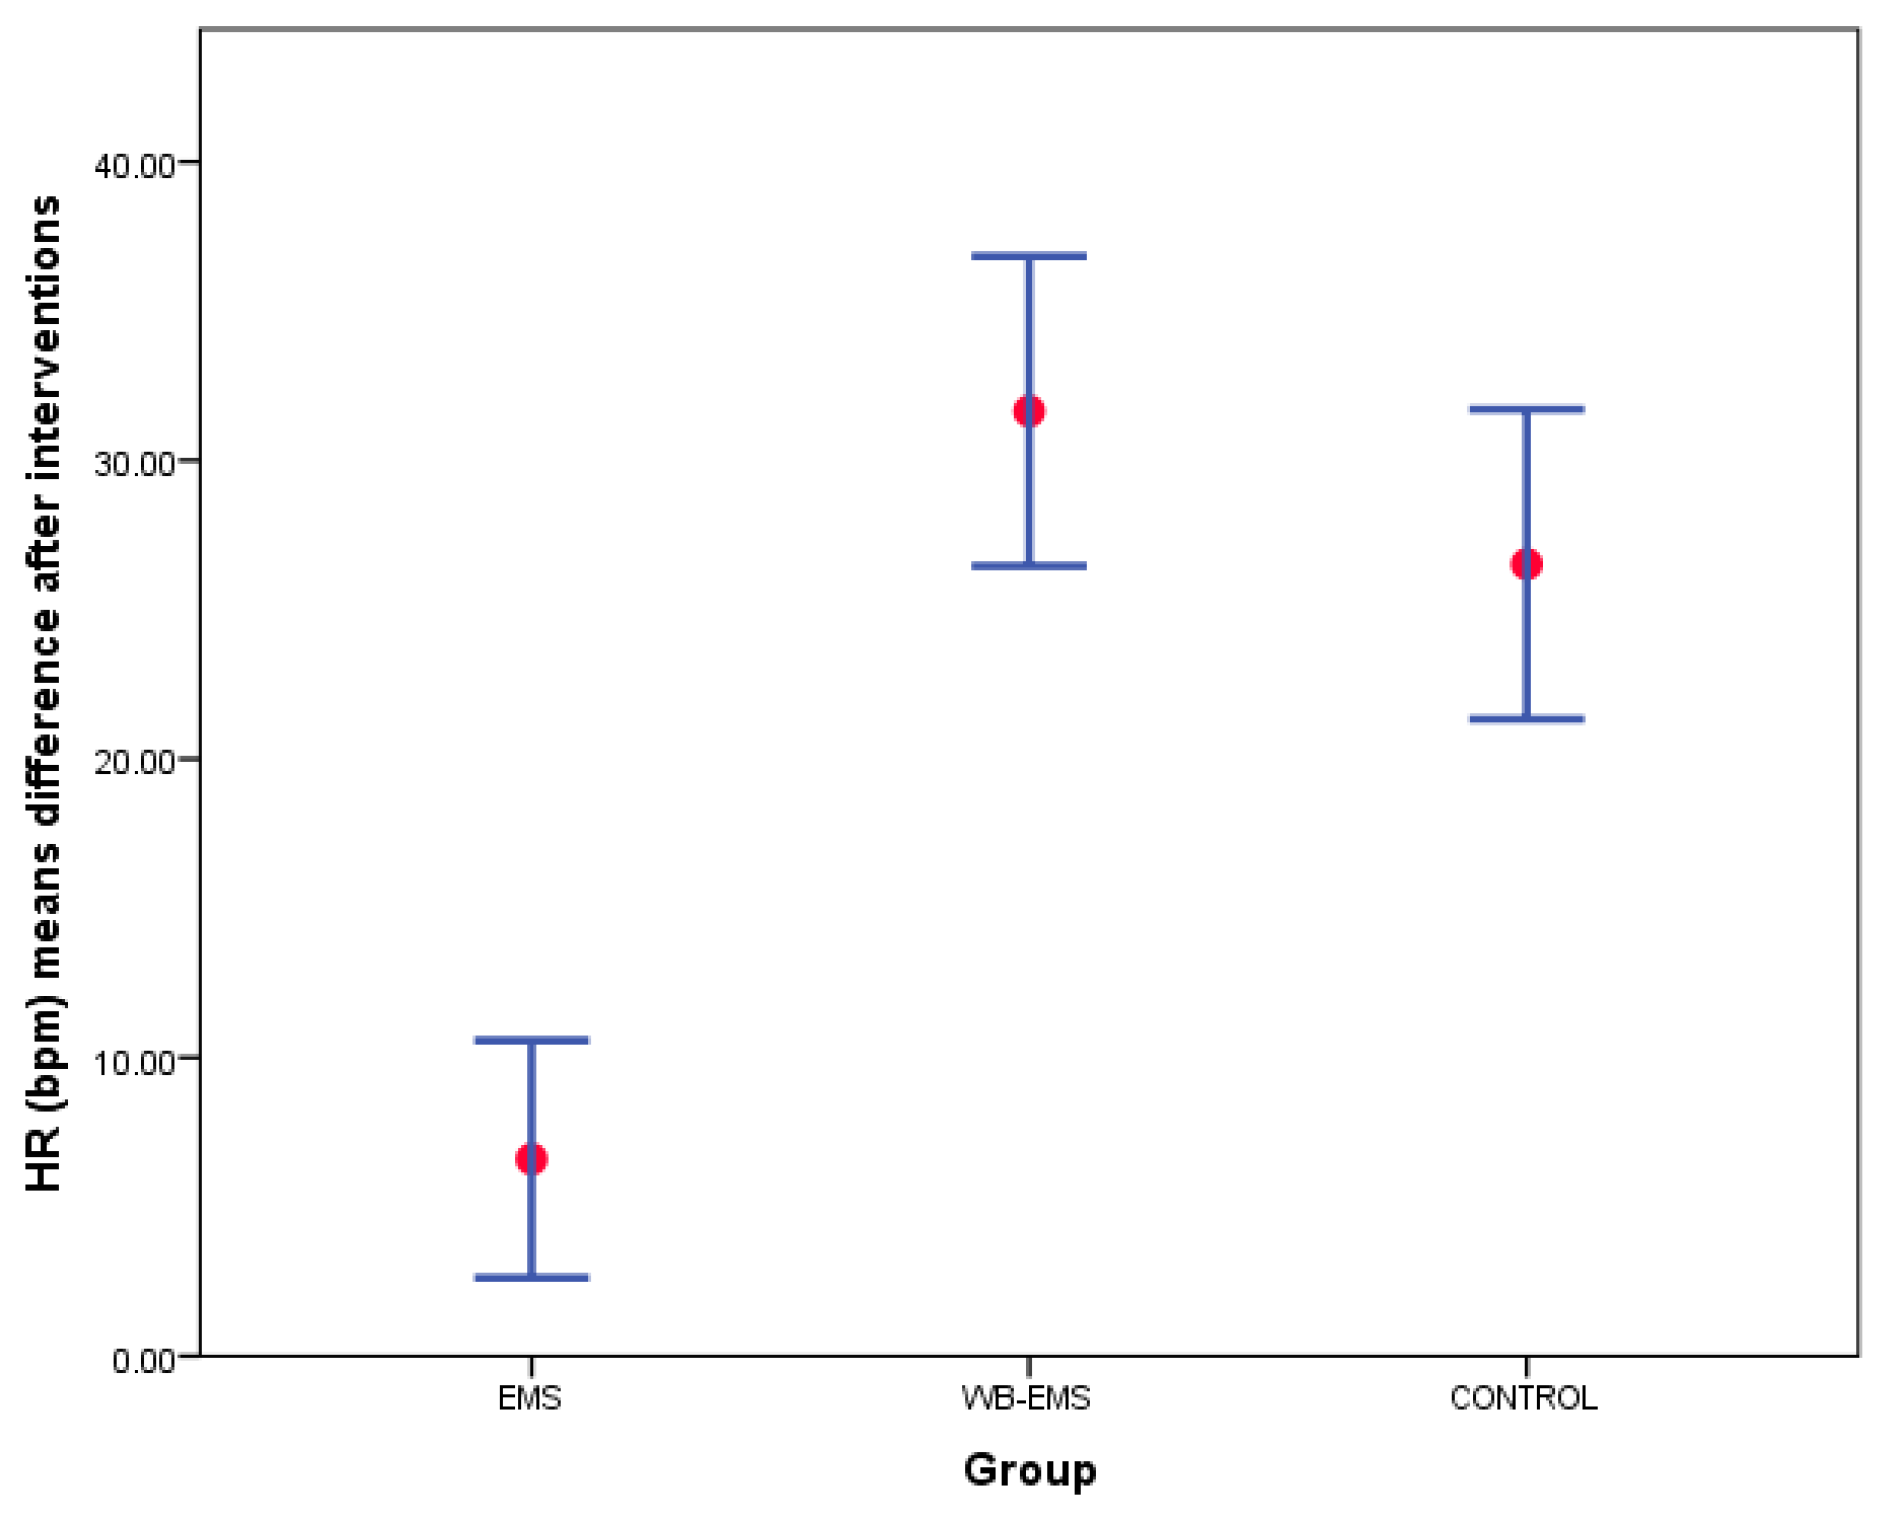
3.3. Outcome Measurements Differences after Interventions
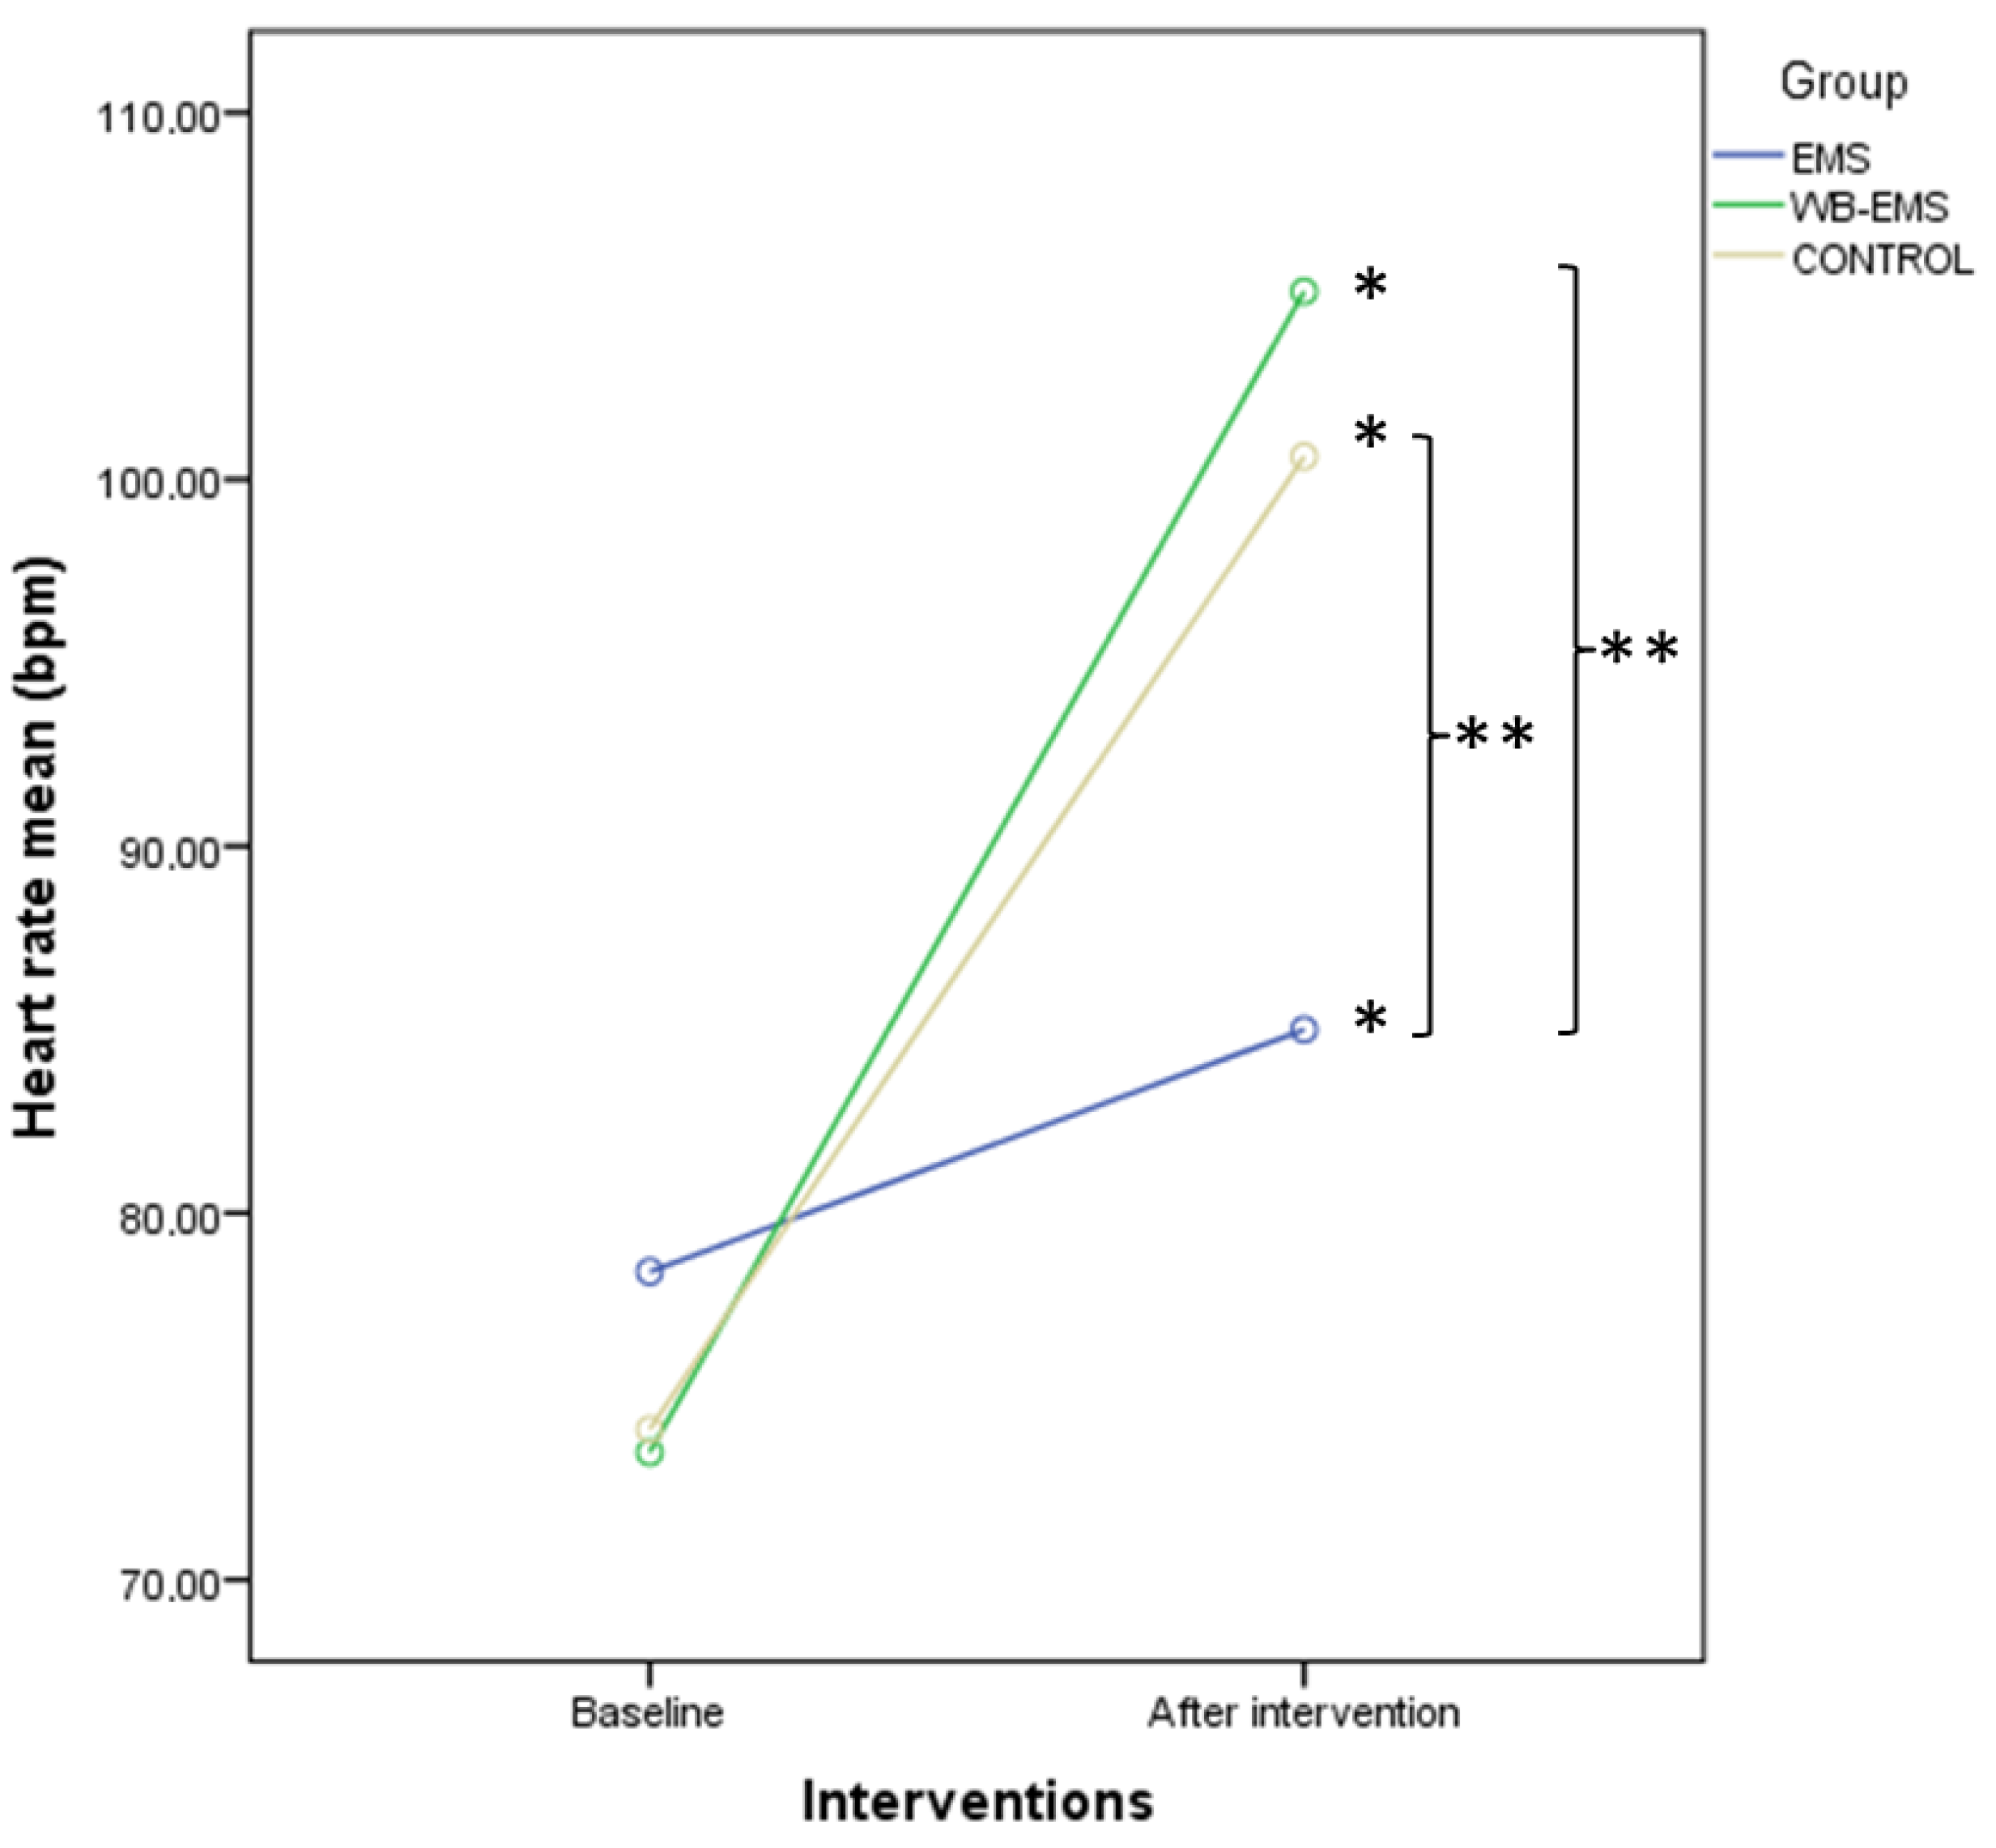
3.4. Two-Way ANOVA of Repeated Measurements for Intra- and Intergroup Comparisons
3.5. Multivariate Linear Regression Models
4. Discussion
5. Conclusions
Author Contributions
Funding
Institutional Review Board Statement
Informed Consent Statement
Data Availability Statement
Acknowledgments
Conflicts of Interest
References
- Paillard, T. Combined Application of Neuromuscular Electrical Stimulation and Voluntary Muscular Contractions. Sports Med. 2008, 38, 161–177. [Google Scholar] [CrossRef] [PubMed]
- Kemmler, W.; Weissenfels, A.; Willert, S.; Shojaa, M.; von Stengel, S.; Filipovic, A.; Kleinöder, H.; Berger, J.; Fröhlich, M. Efficacy and Safety of Low Frequency Whole-Body Electromyostimulation (WB-EMS) to Improve Health-Related Outcomes in Non-Athletic Adults. A Systematic Review. Front. Physiol. 2018, 9, 573. [Google Scholar] [CrossRef] [PubMed]
- Herrero, A.J.; Martín, J.; Benito, P.J.; Gonzalo-Martínez, I.; Chulvi-Medrano, I.; García-López, D. Posicionamiento de La National Strength and Conditioning Association-Spain. Entrenamiento Con Electroestimulación de Cuerpo Completo. Rev. Andal. Med. Deport. 2015, 8, 155–162. [Google Scholar] [CrossRef]
- Gobbo, M.; Maffiuletti, N.A.; Orizio, C.; Minetto, M.A. Muscle Motor Point Identification Is Essential for Optimizing Neuromuscular Electrical Stimulation Use. J. Neuroeng. Rehabil. 2014, 11, 17. [Google Scholar] [CrossRef] [PubMed] [Green Version]
- Kemmler, W.; von Stengel, S. Application of Electrical Modalities on Muscle Stimulation. In Non-Pharmacological Management of Osteoporosis; Springer International Publishing: Cham, Switzerland, 2017; pp. 145–166. [Google Scholar]
- Filipovic, A.; Kleinöder, H.; Dörmann, U.; Mester, J. Electromyostimulation—A Systematic Review of the Effects of Different Electromyostimulation Methods on Selected Strength Parameters in Trained and Elite Athletes. J. Strength. Cond. Res. 2012, 26, 2600–2614. [Google Scholar] [CrossRef] [Green Version]
- Kemmler, W.; Weissenfels, A.; Willert, S.; Fröhlich, M.; Ludwig, O.; Berger, J.; Zart, S.; Becker, S.; Backfisch, M.; Kleinöder, H.; et al. Recommended Contraindications for the Use of Non-Medical WB-Electromyostimulation. Dtsch. Z. Sportmed. 2019, 70, 278–282. [Google Scholar] [CrossRef]
- Stöllberger, C.; Finsterer, J. Side Effects of and Contraindications for Whole-Body Electro-Myo-Stimulation: A Viewpoint. BMJ Open. Sports Exerc. Med. 2019, 5, e000619. [Google Scholar] [CrossRef] [PubMed]
- Kemmler, W.; Froehlich, M.; von Stengel, S.; Kleinöder, H. Whole-Body Electromyostimulation–The Need for Common Sense! Rationale and Guideline for a Safe and Effective Training. Dtsch. Z. Sportmed. 2016, 67, 218–221. [Google Scholar] [CrossRef]
- Kemmler, W.; Kleinöder, H.; Fröhlich, M. Editorial: Whole-Body Electromyostimulation: A Training Technology to Improve Health and Performance in Humans? Front. Physiol. 2020, 11, 523. [Google Scholar] [CrossRef]
- Maffiuletti, N.A. Physiological and Methodological Considerations for the Use of Neuromuscular Electrical Stimulation. Eur. J. Appl. Physiol. 2010, 110, 223–234. [Google Scholar] [CrossRef]
- Sánchez, I.; Ferrero, A.; Aguilar, J.; Climent, J.; Conejero, J. Manual SERMEF de Rehabilitación y Medicina Física; Sociedad Española de Rehabilitación y Medicina; Editorial Médica Panamericana: Madrid, Spain, 2006. [Google Scholar]
- Urquhart, D.M.; Barker, P.J.; Hodges, P.W.; Story, I.H.; Briggs, C.A. Regional Morphology of the Transversus Abdominis and Obliquus Internus and Externus Abdominis Muscles. Clin. Biomech. 2005, 20, 233–241. [Google Scholar] [CrossRef] [PubMed]
- Springer, B.A.; Mielcarek, B.J.; Nesfield, T.K.; Teyhen, D.S. Relationships among Lateral Abdominal Muscles, Gender, Body Mass Index, and Hand Dominance. J. Orthop. Sports Phys. Ther. 2006, 36, 289–297. [Google Scholar] [CrossRef] [PubMed]
- Teyhen, D.S.; Gill, N.W.; Whittaker, J.L.; Henry, S.M.; Hides, J.A.; Hodges, P. Rehabilitative Ultrasound Imaging of the Abdominal Muscles. J. Orthop. Sports Phys. Ther. 2007, 37, 450–466. [Google Scholar] [CrossRef] [PubMed] [Green Version]
- Hebert, J.J.; Koppenhaver, S.L.; Parent, E.C.; Fritz, J.M. A Systematic Review of the Reliability of Rehabilitative Ultrasound Imaging for the Quantitative Assessment of the Abdominal and Lumbar Trunk Muscles. Spine 2009, 34, E848–E856. [Google Scholar] [CrossRef]
- Koppenhaver, S.L.; Hebert, J.J.; Fritz, J.M.; Parent, E.C.; Teyhen, D.S.; Magel, J.S. Reliability of Rehabilitative Ultrasound Imaging of the Transversus Abdominis and Lumbar Multifidus Muscles. Arch. Phys. Med. Rehabil. 2009, 90, 87–94. [Google Scholar] [CrossRef]
- Teyhen, D.S.; Williamson, J.N.; Carlson, N.H.; Suttles, S.T.; O’Laughlin, S.J.; Whittaker, J.L.; Goffar, S.L.; Childs, J.D. Ultrasound Characteristics of the Deep Abdominal Muscles during the Active Straight Leg Raise Test. Arch. Phys. Med. Rehabil. 2009, 90, 761–767. [Google Scholar] [CrossRef]
- Coghlan, S.; Crowe, L.; McCarthyPersson, U.; Minogue, C.; Caulfield, B. Electrical Muscle Stimulation for Deep Stabilizing Muscles in Abdominal Wall. In Proceedings of the 2008 30th Annual International Conference of the IEEE Engineering in Medicine and Biology Society, Vancouver, BC, Canada, 20–25 August 2008; pp. 2756–2759. [Google Scholar] [CrossRef]
- Coghlan, S.; Crowe, L.; McCarthyPersson, U.; Minogue, C.; Caulfield, B. Neuromuscular Electrical Stimulation Training Results in Enhanced Activation of Spinal Stabilizing Muscles during Spinal Loading and Improvements in Pain Ratings. In Proceedings of the 2011 Annual International Conference of the IEEE Engineering in Medicine and Biology Society, Boston, MA, USA, 30 August–3 September 2011; pp. 7622–7625. [Google Scholar] [CrossRef]
- Cho, H.K.; Jung, G.S.; Kim, E.H.; Cho, Y.W.; Kim, S.W.; Ahn, S.H. The Effects of Neuromuscular Electrical Stimulation at Different Frequencies on the Activations of Deep Abdominal Stabilizing Muscles. J. Back. Musculoskelet. Rehabil. 2016, 29, 183–189. [Google Scholar] [CrossRef]
- Ferreira, P.H.; Ferreira, M.L.; Hodges, P.W. Changes in Recruitment of the Abdominal Muscles in People with Low Back Pain. Spine J. 2004, 29, 2560–2566. [Google Scholar] [CrossRef]
- Paillard, T.; Noé, F.; Passelergue, P.; Dupui, P. Electrical Stimulation Superimposed onto Voluntary Muscular Contraction. Sports Med. 2005, 35, 951–966. [Google Scholar] [CrossRef]
- Amaro-Gahete, F.J.; De-la-O, A.; Jurado-Fasoli, L.; Dote-Montero, M.; Gutiérrez, Á.; Ruiz, J.R.; Castillo, M.J. Changes in Physical Fitness after 12 Weeks of Structured Concurrent Exercise Training, High Intensity Interval Training, or Whole-Body Electromyostimulation Training in Sedentary Middle-Aged Adults: A Randomized Controlled Trial. Front. Physiol. 2019, 10, 451. [Google Scholar] [CrossRef]
- Cassemiliano, G.; Ricci, P.A.; Jürgensen, S.P.; Domingos, B.C.; Borghi-Silva, A. Acute Whole-Body Electromyostimulation Associated with Dynamic Exercises Did Not Alter Cardiac Autonomic Modulation and Oxygen Uptake in Obese and Eutrophic Men. Mot. Rev. De Educ. Física 2022, 28, e1022008921. [Google Scholar] [CrossRef]
- Ricci, P.A.; di Thommazo-Luporini, L.; Jürgensen, S.P.; André, L.D.; Haddad, G.F.; Arena, R.; Borghi-Silva, A. Effects of Whole-Body Electromyostimulation Associated with Dynamic Exercise on Functional Capacity and Heart Rate Variability after Bariatric Surgery: A Randomized, Double-Blind, and Sham-Controlled Trial. Obes. Surg. 2020, 30, 3862–3871. [Google Scholar] [CrossRef] [PubMed]
- Hoshiai, M.; Ochiai, K.; Tamura, Y.; Tsurumi, T.; Terashima, M.; Tamiya, H.; Maeno, E.; Mizuguchi, S.; Tomoe, T.; Kawabe, A.; et al. Effects of Whole-Body Neuromuscular Electrical Stimulation Device on Hemodynamics, Arrhythmia, and Sublingual Microcirculation. Heart Vessel. 2021, 36, 844–852. [Google Scholar] [CrossRef] [PubMed]
- Wirtz, N.; Wahl, P.; Kleinöder, H.; Wechsler, K.; Achtzehn, S.; Mester, J. Acute Metabolic, Hormonal, and Psychological Responses to Strength Training with Superimposed EMS at the Beginning and the End of a 6 Week Training Period. J. Musculoskelet. Neuronal Interact. 2015, 15, 325–332. [Google Scholar] [PubMed]
- Wirtz, N.; Filipovic, A.; Gehlert, S.; de Marées, M.; Schiffer, T.; Bloch, W.; Donath, L. Seven Weeks of Jump Training with Superimposed Whole-Body Electromyostimulation Does Not Affect the Physiological and Cellular Parameters of Endurance Performance in Amateur Soccer Players. Int. J. Environ. Res. Public. Health 2020, 17, 1123. [Google Scholar] [CrossRef] [PubMed] [Green Version]
- Evangelista, A.L.; Teixeira, C.V.L.S.; Barros, B.M.; de Azevedo, J.B.; Paunksnis, M.R.R.; de Souza, C.R.; Wadhi, T.; Rica, R.L.; Braz, T.V.; Bocalini, D.S. Does Whole-Body Electrical Muscle Stimulation Combined with Strength Training Promote Morphofunctional Alterations? Clinics 2019, 74, e1334. [Google Scholar] [CrossRef] [Green Version]
- Kang, J.H.; Hyong, I.H. The Influence of Neuromuscular Electrical Stimulation on the Heart Rate Variability in Healthy Subjects. J. Phys. Ther. Sci. 2014, 26, 633–635. [Google Scholar] [CrossRef] [Green Version]
- Gondin, J.; Guette, M.; Ballay, Y.; Martin, A. Electromyostimulation Training Effects on Neural Drive and Muscle Architecture. Med. Sci. Sports Exerc. 2005, 37, 1291–1299. [Google Scholar] [CrossRef] [Green Version]
- Pano-Rodriguez, A.; Beltran-Garrido, J.V.; Hernández-González, V.; Reverter-Masia, J. Effects of Whole-Body Electromyostimulation on Health and Performance: A Systematic Review. BMC Complement. Altern. Med. 2019, 19, 87. [Google Scholar] [CrossRef]
- Schulz, K.F.; Altman, D.G.; Moher, D. CONSORT 2010 Statement: Updated Guidelines for Reporting Parallel Group Randomised Trials. Int. J. Surg. 2011, 9, 672–677. [Google Scholar] [CrossRef] [Green Version]
- Holt, G.R. Declaration of Helsinki—The World’s Document of Conscience and Responsibility. South. Med. J. 2014, 107, 407. [Google Scholar] [CrossRef] [PubMed]
- Martínez-Moragón, E.; Perpiñá, M.; Belloch, A.; de Diego, A. Prevalencia Del Síndrome de Hiperventilación En Pacientes Tratados Por Asma En Una Consulta de Neumología. Arch. Bronconeumol. 2005, 41, 267–271. [Google Scholar] [CrossRef] [PubMed]
- Schulz, K.F.; Grimes, D.A. Generation of Allocation Sequences in Randomised Trials: Chance, Not Choise. Lancet 2002, 359, 515–519. [Google Scholar] [CrossRef]
- Ruiz-Casado, A.; Alejo, L.; Santos-Lozano, A.; Soria, A.; Ortega, M.; Pagola, I.; Fiuza-Luces, C.; Palomo, I.; Garatachea, N.; Cebolla, H.; et al. Validity of the Physical Activity Questionnaires IPAQ-SF and GPAQ for Cancer Survivors: Insights from a Spanish Cohort. Int. J. Sports Med. 2016, 37, 979–985. [Google Scholar] [CrossRef] [PubMed] [Green Version]
- Borg, E.; Kaijser, L. A Comparison between Three Rating Scales for Perceived Exertion and Two Different Work Tests. Scand. J. Med. Sci. Sports 2006, 16, 57–69. [Google Scholar] [CrossRef]
- Ferreira, P.H.; Ferreira, M.L.; Nascimento, D.P.; Pinto, R.Z.; Franco, M.R.; Hodges, P.W. Discriminative and Reliability Analyses of Ultrasound Measurement of Abdominal Muscles Recruitment. Man. Ther. 2011, 16, 463–469. [Google Scholar] [CrossRef]
- Ludwig, O.; Berger, J.; Becker, S.; Kemmler, W.; Fröhlich, M. The Impact of Whole-Body Electromyostimulation on Body Posture and Trunk Muscle Strength in Untrained Persons. Front. Physiol. 2019, 10, 1020. [Google Scholar] [CrossRef] [Green Version]
- Teschler, M.; Wassermann, A.; Weissenfels, A.; Fröhlich, M.; Kohl, M.; Bebenek, M.; von Stengel, S.; Kemmler, W. Short Time Effect of a Single Session of Intense Whole-Body Electromyostimulation on Energy Expenditure. A Contribution to Fat Reduction? Appl. Physiol. Nutr. Metab. 2018, 43, 528–530. [Google Scholar] [CrossRef] [Green Version]
- Berger, J.; Ludwig, O.; Becker, S.; Backfisch, M.; Kemmler, W.; Fröhlich, M. Effects of an Impulse Frequency Dependent 10-Week Whole-Body Electromyostimulation Training Program on Specific Sport Performance Parameters. J. Sports Sci. Med. 2020, 19, 271–281. [Google Scholar]
- DʼOttavio, S.; Briotti, G.; Rosazza, C.; Partipilo, F.; Silvestri, A.; Calabrese, C.; Bernardini, A.; Gabrielli, P.R.; Ruscello, B. Effects of Two Modalities of Whole-Body Electrostimulation Programs and Resistance Circuit Training on Strength and Power. Int. J. Sports Med. 2019, 40, 831–841. [Google Scholar] [CrossRef]
- Jee, Y.-S. The Efficacy and Safety of Whole-Body Electromyostimulation in Applying to Human Body: Based from Graded Exercise Test. J. Exerc. Rehabil. 2018, 14, 49–57. [Google Scholar] [CrossRef] [PubMed]
- Berger, J.; Becker, S.; Backfisch, M.; Eifler, C.; Kemmler, W.; Fröhlich, M. Adjustment Effects of Maximum Intensity Tolerance during Whole-Body Electromyostimulation Training. Front. Physiol. 2019, 10, 920. [Google Scholar] [CrossRef] [Green Version]
- Whittaker, J.L.; Warner, M.B.; Stokes, M. Comparison of the Sonographic Features of the Abdominal Wall Muscles and Connective Tissues in Individuals with and without Lumbopelvic Pain. J. Orthop. Sports Phys. Ther. 2013, 43, 11–19. [Google Scholar] [CrossRef] [PubMed]
- Critchley, D.J.; Coutts, F.J. Abdominal Muscle Function in Chronic Low Back Pain Patients. Physiotherapy 2002, 88, 322–332. [Google Scholar] [CrossRef]
- Costa, L.O.P.; Maher, C.G.; Latimer, J.; Smeets, R.J.E.M. Reproducibility of Rehabilitative Ultrasound Imaging for the Measurement of Abdominal Muscle Activity: A Systematic Review. Phys. Ther. 2009, 89, 756–769. [Google Scholar] [CrossRef]
- Mota, P.; Pascoal, A.G.; Sancho, F.; Bø, K. Test-Retest and Intrarater Reliability of 2-Dimensional Ultrasound Measurements of Distance between Rectus Abdominis in Women. J. Orthop. Sports Phys. Ther. 2012, 42, 940–946. [Google Scholar] [CrossRef]
- Linek, P.; Saulicz, E.; Wolny, T.; Myśliwiec, A. Intra-Rater Reliability of B-Mode Ultrasound Imaging of the Abdominal Muscles in Healthy Adolescents during the Active Straight Leg Raise Test. PMR 2015, 7, 53–59. [Google Scholar] [CrossRef]
- Eknoyan, G. Adolphe Quetelet (1796 1874) the Average Man and Indices of Obesity. Nephrol. Dial. Transplant. 2007, 23, 47–51. [Google Scholar] [CrossRef] [Green Version]
- Cohen, J. Eta-Squared and Partial Eta-Squared in Fixed Factor Anova Designs. Educ. Psychol. Meas. 1973, 33, 107–112. [Google Scholar] [CrossRef]
- Levine, T.R.; Hullett, C.R. Eta Squared, Partial Eta Squared, and Misreporting of Effect Size in Communication Research. Hum. Commun. Res. 2002, 28, 612–625. [Google Scholar] [CrossRef]
- Mordkoff, J.T. A Simple Method for Removing Bias From a Popular Measure of Standardized Effect Size: Adjusted Partial Eta Squared. Adv. Methods Pract. Psychol. Sci. 2019, 2, 228–232. [Google Scholar] [CrossRef]
- Kelley, K.; Preacher, K.J. On Effect Size. Psychol. Methods 2012, 17, 137–152. [Google Scholar] [CrossRef] [PubMed] [Green Version]
- Blanca, M.J.; Alarcón, R.; Arnau, J.; Bono, R.; Bendayan, R. Non-Normal Data: Is ANOVA Still a Valid Option? Psicothema 2017, 29, 552–557. [Google Scholar] [CrossRef]
- Haverkamp, N.; Beauducel, A. Violation of the Sphericity Assumption and Its Effect on Type-I Error Rates in Repeated Measures ANOVA and Multi-Level Linear Models (MLM). Front. Psychol. 2017, 8, 1841. [Google Scholar] [CrossRef] [PubMed] [Green Version]
- Austin, P.C.; Steyerberg, E.W. The Number of Subjects per Variable Required in Linear Regression Analyses. J. Clin. Epidemiol. 2015, 68, 627–636. [Google Scholar] [CrossRef] [PubMed] [Green Version]
- Kemmler, W.; von Stengel, S.; Schwarz, J.; Mayhew, J.L. Effect of Whole-Body Electromyostimulation on Energy Expenditure During Exercise. J. Strength. Cond. Res. 2012, 26, 240–245. [Google Scholar] [CrossRef] [Green Version]
- Watanabe, K.; Yoshida, T.; Ishikawa, T.; Kawade, S.; Moritani, T. Effect of the Combination of Whole-Body Neuromuscular Electrical Stimulation and Voluntary Exercise on Metabolic Responses in Human. Front. Physiol. 2019, 10, 291. [Google Scholar] [CrossRef]
- Nosaka, K.; Newton, M.; Sacco, P. Responses of Human Elbow Flexor Muscles to Electrically Stimulated Forced Lengthening Exercise. Acta Physiol. Scand. 2002, 174, 137–145. [Google Scholar] [CrossRef]
- Smith, E.; Sepulveda, A.; Martinez, V.G.F.; Samaniego, A.; Marchetti, P.N.; Marchetti, P.H. Exercise Variability Did Not Affect Muscle Thickness and Peak Force for Elbow Flexors after a Resistance Training Session in Recreationally-Trained Subjects. Int. J. Exerc. Sci. 2021, 14, 1294–1304. [Google Scholar]
- Bartolomei, S.; Nigro, F.; Malagoli Lanzoni, I.; Mangia, A.L.; Cortesi, M.; Ciacci, S.; Fantozzi, S. Acute Effects of a High Volume vs. High Intensity Bench Press Protocol on Electromechanical Delay and Muscle Morphology in Recreationally Trained Women. Int. J. Environ. Res. Public. Health 2021, 18, 4874. [Google Scholar] [CrossRef]
- Willert, S.; Weissenfels, A.; Kohl, M.; von Stengel, S.; Fröhlich, M.; Kleinöder, H.; Schöne, D.; Teschler, M.; Kemmler, W. Effects of Whole-Body Electromyostimulation on the Energy-Restriction-Induced Reduction of Muscle Mass during Intended Weight Loss. Front. Physiol. 2019, 10, 1012. [Google Scholar] [CrossRef] [PubMed] [Green Version]
- Kamel, D.M.; Yousif, A.M. Neuromuscular Electrical Stimulation and Strength Recovery of Postnatal Diastasis Recti Abdominis Muscles. Ann. Rehabil. Med. 2017, 41, 465. [Google Scholar] [CrossRef] [PubMed]
- Filipovic, A.; Kleinöder, H.; Dorman, U.; Meste, J. Electromyostimulation-a Systematic Review of the Influence of Training Regimens and Stimulation Parameters on Effectiveness in Electromyostimulation Training of Selected Strength Parameters. J. Strength. Cond. Res. 2011, 25, 3218–3238. [Google Scholar] [CrossRef] [Green Version]
- Bickel, C.S.; Slade, J.M.; Haddad, F.; Adams, G.R.; Dudley, G.A. Acute Molecular Responses of Skeletal Muscle to Resistance Exercise in Able-Bodied and Spinal Cord-Injured Subjects. J. Appl. Physiol. 2003, 94, 2255–2262. [Google Scholar] [CrossRef] [Green Version]
- Hwang, U.-J.; Kwon, O.-Y.; Jung, S.-H.; Kim, H.-A.; Gwak, G.-T. Effect of Neuromuscular Electrical Stimulation Training for Abdominal Muscles on Change of Muscle Size, Strength, Endurance and Lumbopelvic Stability. J. Sports Med. Phys. Fit. 2020, 60, 206–213. [Google Scholar] [CrossRef] [PubMed]
- Stein, C.; Dal Lago, P.; Ferreira, J.B.; Casali, K.R.; Plentz, R.D.M. Transcutaneous Electrical Nerve Stimulation at Different Frequencies on Heart Rate Variability in Healthy Subjects. Auton. Neurosci. 2011, 165, 205–208. [Google Scholar] [CrossRef] [PubMed] [Green Version]
- De Macedo, A.C.; Schein, A.S.; Callegaro, C.C.; Alves, V.M.; Zambeli, P.M.; Sbruzzi, G.; Schaan, B.D. Hemodynamic Responses to Neuromuscular Electrical Stimulation and to Metaboreflex Activation. J. Sports Med. Phys. Fit. 2022, 62, 163–169. [Google Scholar] [CrossRef]
- Gobbo, M.; Gaffurini, P.; Bissolotti, L.; Esposito, F.; Orizio, C. Transcutaneous Neuromuscular Electrical Stimulation: Influence of Electrode Positioning and Stimulus Amplitude Settings on Muscle Response. Eur. J. Appl. Physiol. 2011, 111, 2451–2459. [Google Scholar] [CrossRef] [PubMed]
- Crisafulli, A.; Piras, F.; Filippi, M.; Piredda, C.; Chiappori, P.; Melis, F.; Milia, R.; Tocco, F.; Concu, A. Role of Heart Rate and Stroke Volume during Muscle Metaboreflex-Induced Cardiac Output Increase: Differences between Activation during and after Exercise. J. Physiol. Sci. 2011, 61, 385. [Google Scholar] [CrossRef]


| Baseline Data | EMS (n = 40) | WB-EMS (n = 40) | Control (n = 40) | p-Value |
|---|---|---|---|---|
| Age (years) | 21.00 ± 2.00 (18–30) | 21.00 ± 6.00 (18–35) | 20.00 ± 2.75 (17–28) | 0.033 † |
| IPAQ (METs/min/week) | 3022 ± 2064 (889–11,000) | 2679 ± 3101 (66–7944) | 1879 ± 4650 (33–14,493) | 0.253 † |
| Sitting time (minutes) | 480 ± 225 (180–720) | 300 ± 285 (0–600) | 360 ± 172 (0–720) | <0.001 † |
| Nijmegen (score) | 12.42 ± 6.08 (0–22) | 9.85 ± 5.59 (0–22) | 12.67 ± 5.23 (3–22) | 0.050 * |
| Weight (kg) | 69.96 ± 15.18 (45–106) | 66.36 ± 12.18 (39.90–97.50) | 64.30 ± 11.33 (44.40–108.60) | 0.148 * |
| Height (m) | 1.71 ± 0.17 (1.52–2.00) | 1.66 ± 0.12 (1.50–1.87) | 1.64 ± 0.11 (1.50–1.83) | 0.166 † |
| BMI (kg/m2) | 19.54 ± 5.23 (14.15–29.94) | 19.86 ± 4.71 (13.30–26.35) | 18.97 ± 2.74 (14.14–29.67) | 0.358 † |
| Abdominal fold (mm) | 15.00 ± 6.75 (4–30) | 12.00 ± 16.09 (0–35) | 10.17 ± 11.58 (0–41.67) | 0.017 † |
| Sex (male/female) | 20 (50%)/20 (50%) | 17 (42.55%)/23 (57.5%) | 13 (32.5%)/ 27 (67.5%) | 0.281 ‡ |
| Dominance (right/left) | 21 (52.5%)/19 (47.5%) | 37 (92.5%)/3 (7.5%) | 36 (90%)/4 (10%) | <0.001 ‡ |
| IPAQ level (Level I/II/III) | 0 (52.5%)/20 (47.5%)/ 20 (47.5%) | 6 (52.5%)/13 (47.5%)/ 21 (47.5%) | 4 (52.5%)/19 (47.5%)/ 17 (47.5%) | 0.103 ‡ |
| Baseline Outcome Measurements | EMS (n = 40) | WB-EMS (n = 40) | Control (n = 40) | p-Value |
|---|---|---|---|---|
| HR (bpm) | 76.00 ± 18.25 (51–118) | 71.00 ± 18.25 (51–100) | 79.00 ± 16.25 (54–116) | 0.249 † |
| SBP (mmHg) | 12.30 ± 1.60 (10.30–14.60) | 12.40 ± 1.88 (10.50–14.25) | 12.30 ± 1.75 (9.10–14.50) | 0.236 † |
| DBP (mmHg) | 7.15 ± 1.00 (5.20–8.60) | 7.35 ± 1.07 (6.00–9.90) | 7.10 ± 1.20 (6.00–9.40) | 0.351 † |
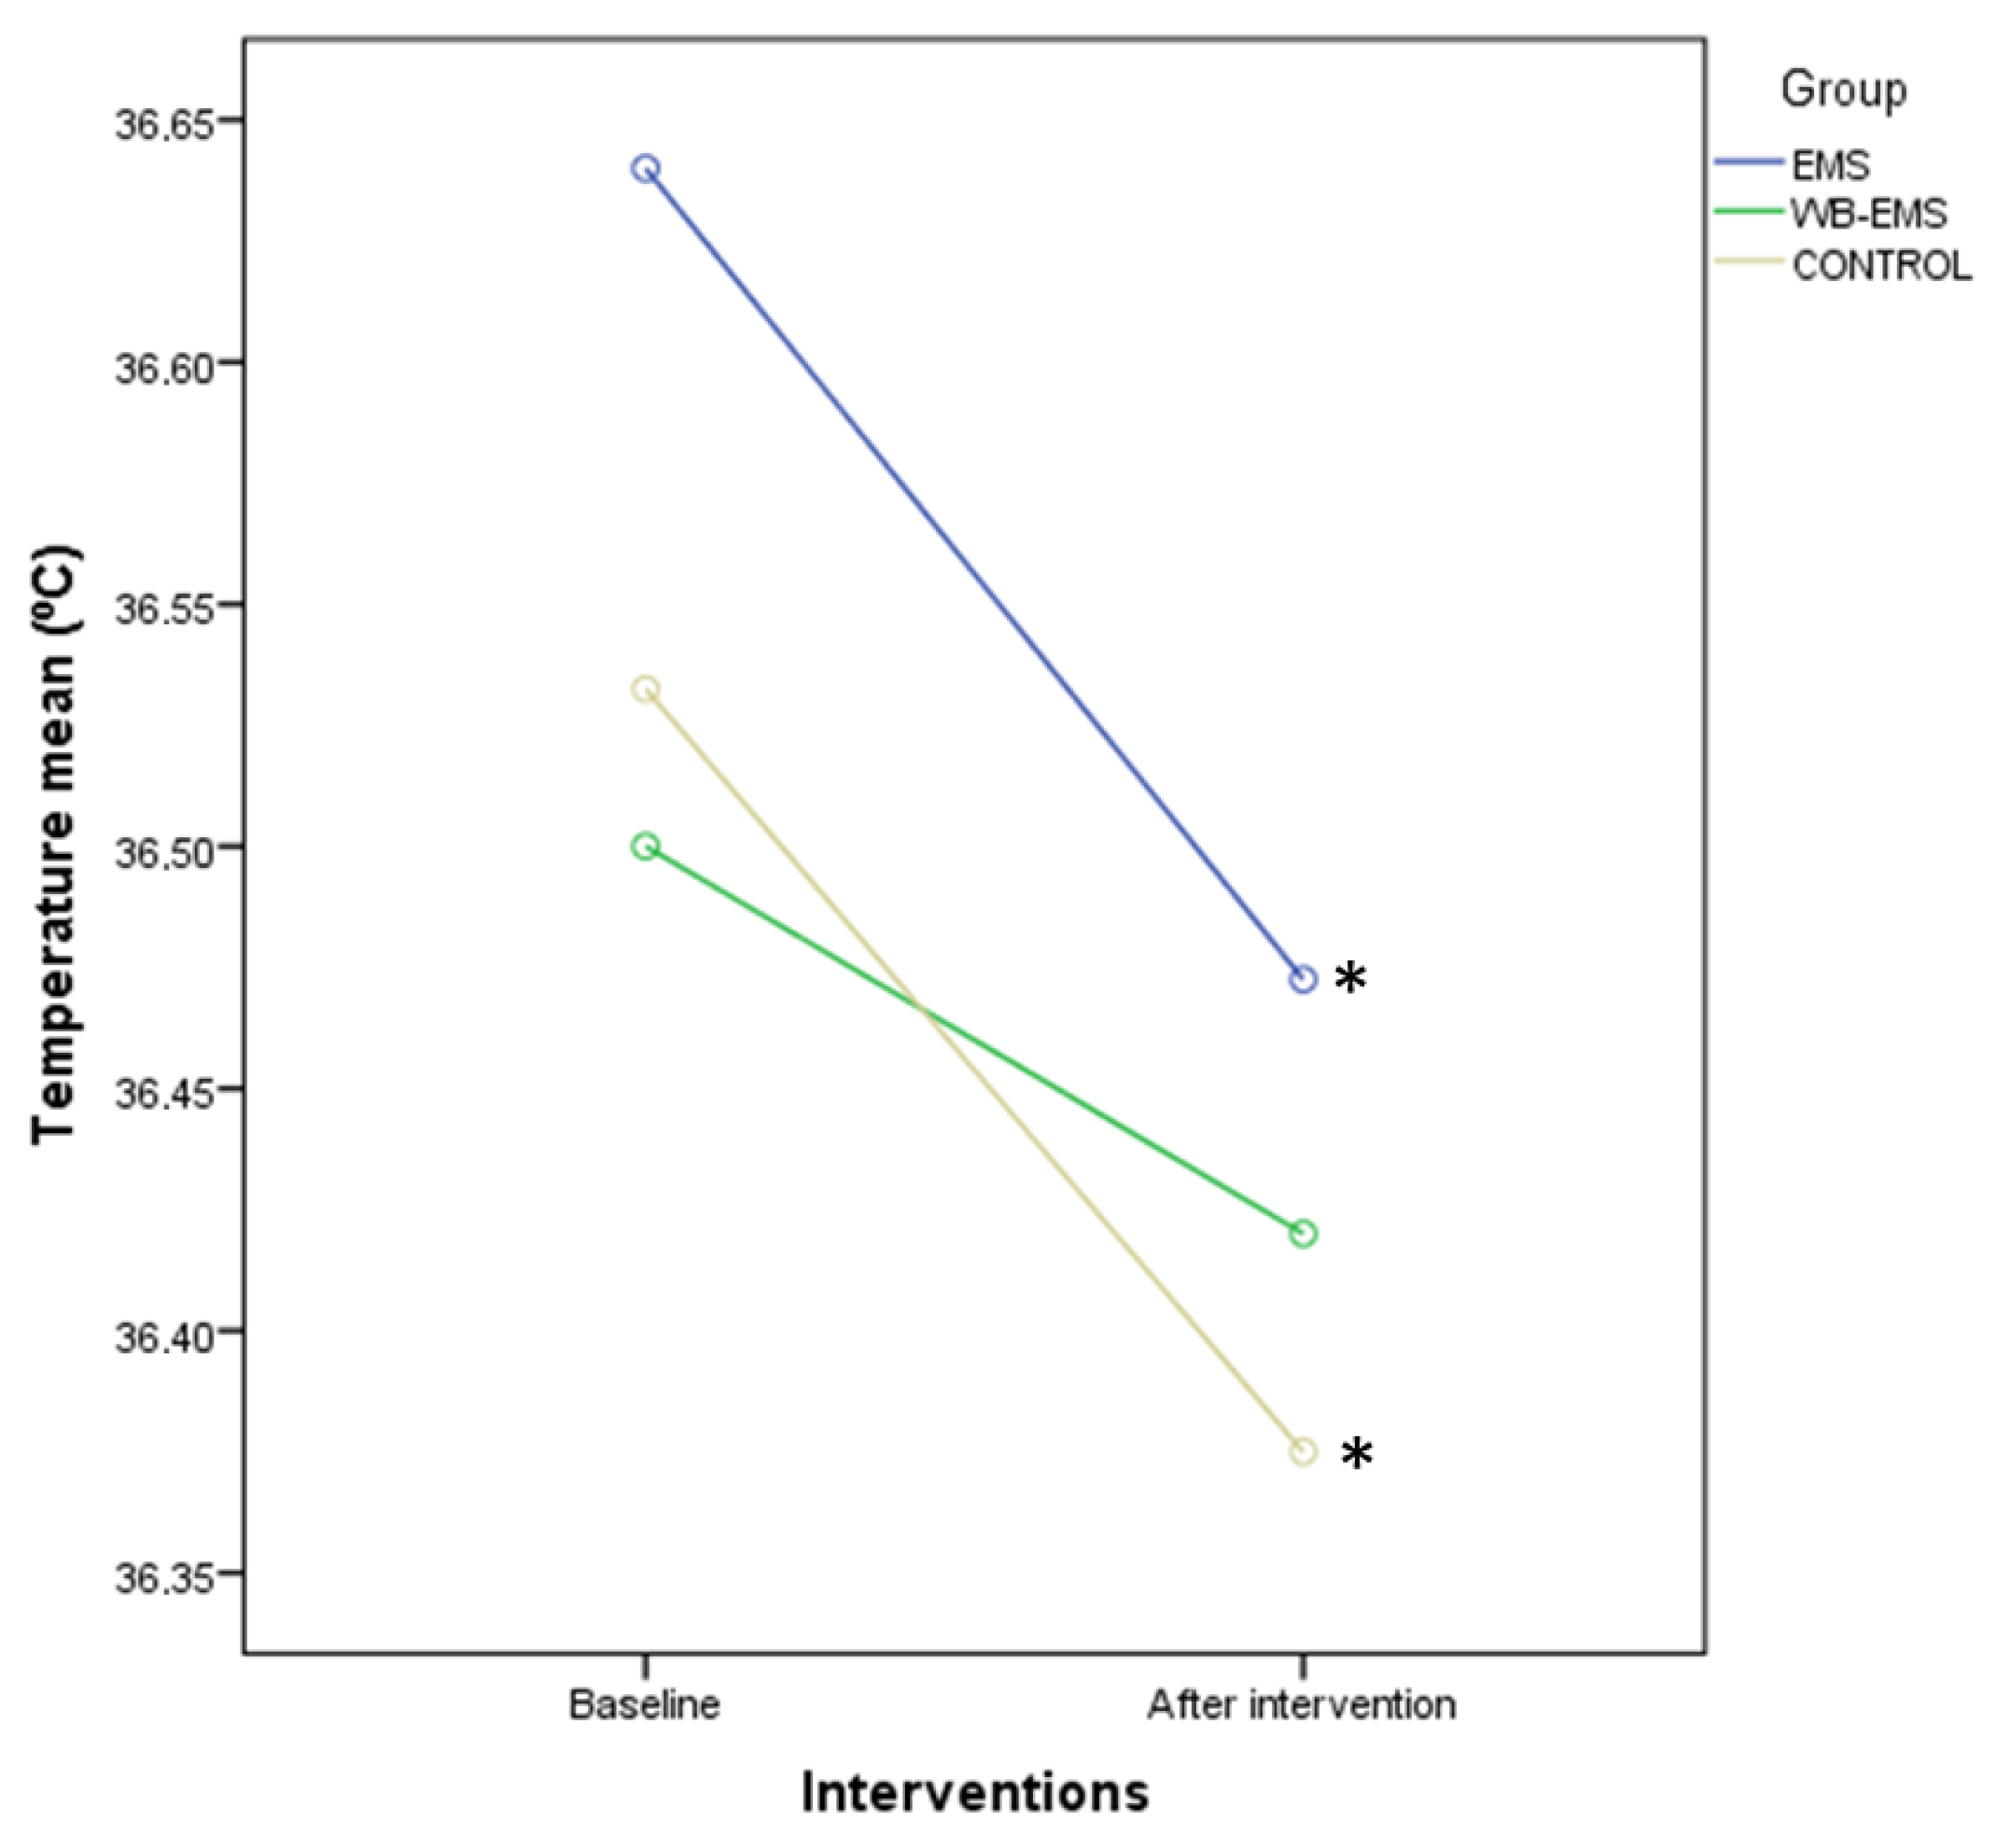
| Temperature (°C) | 36.65 ± 0.30 (36.40–36.90) | 36.60 ± 0.40 (35.70–36.90) | 36.60 ± 0.18 (34.60–36.80) | 0.050 † |
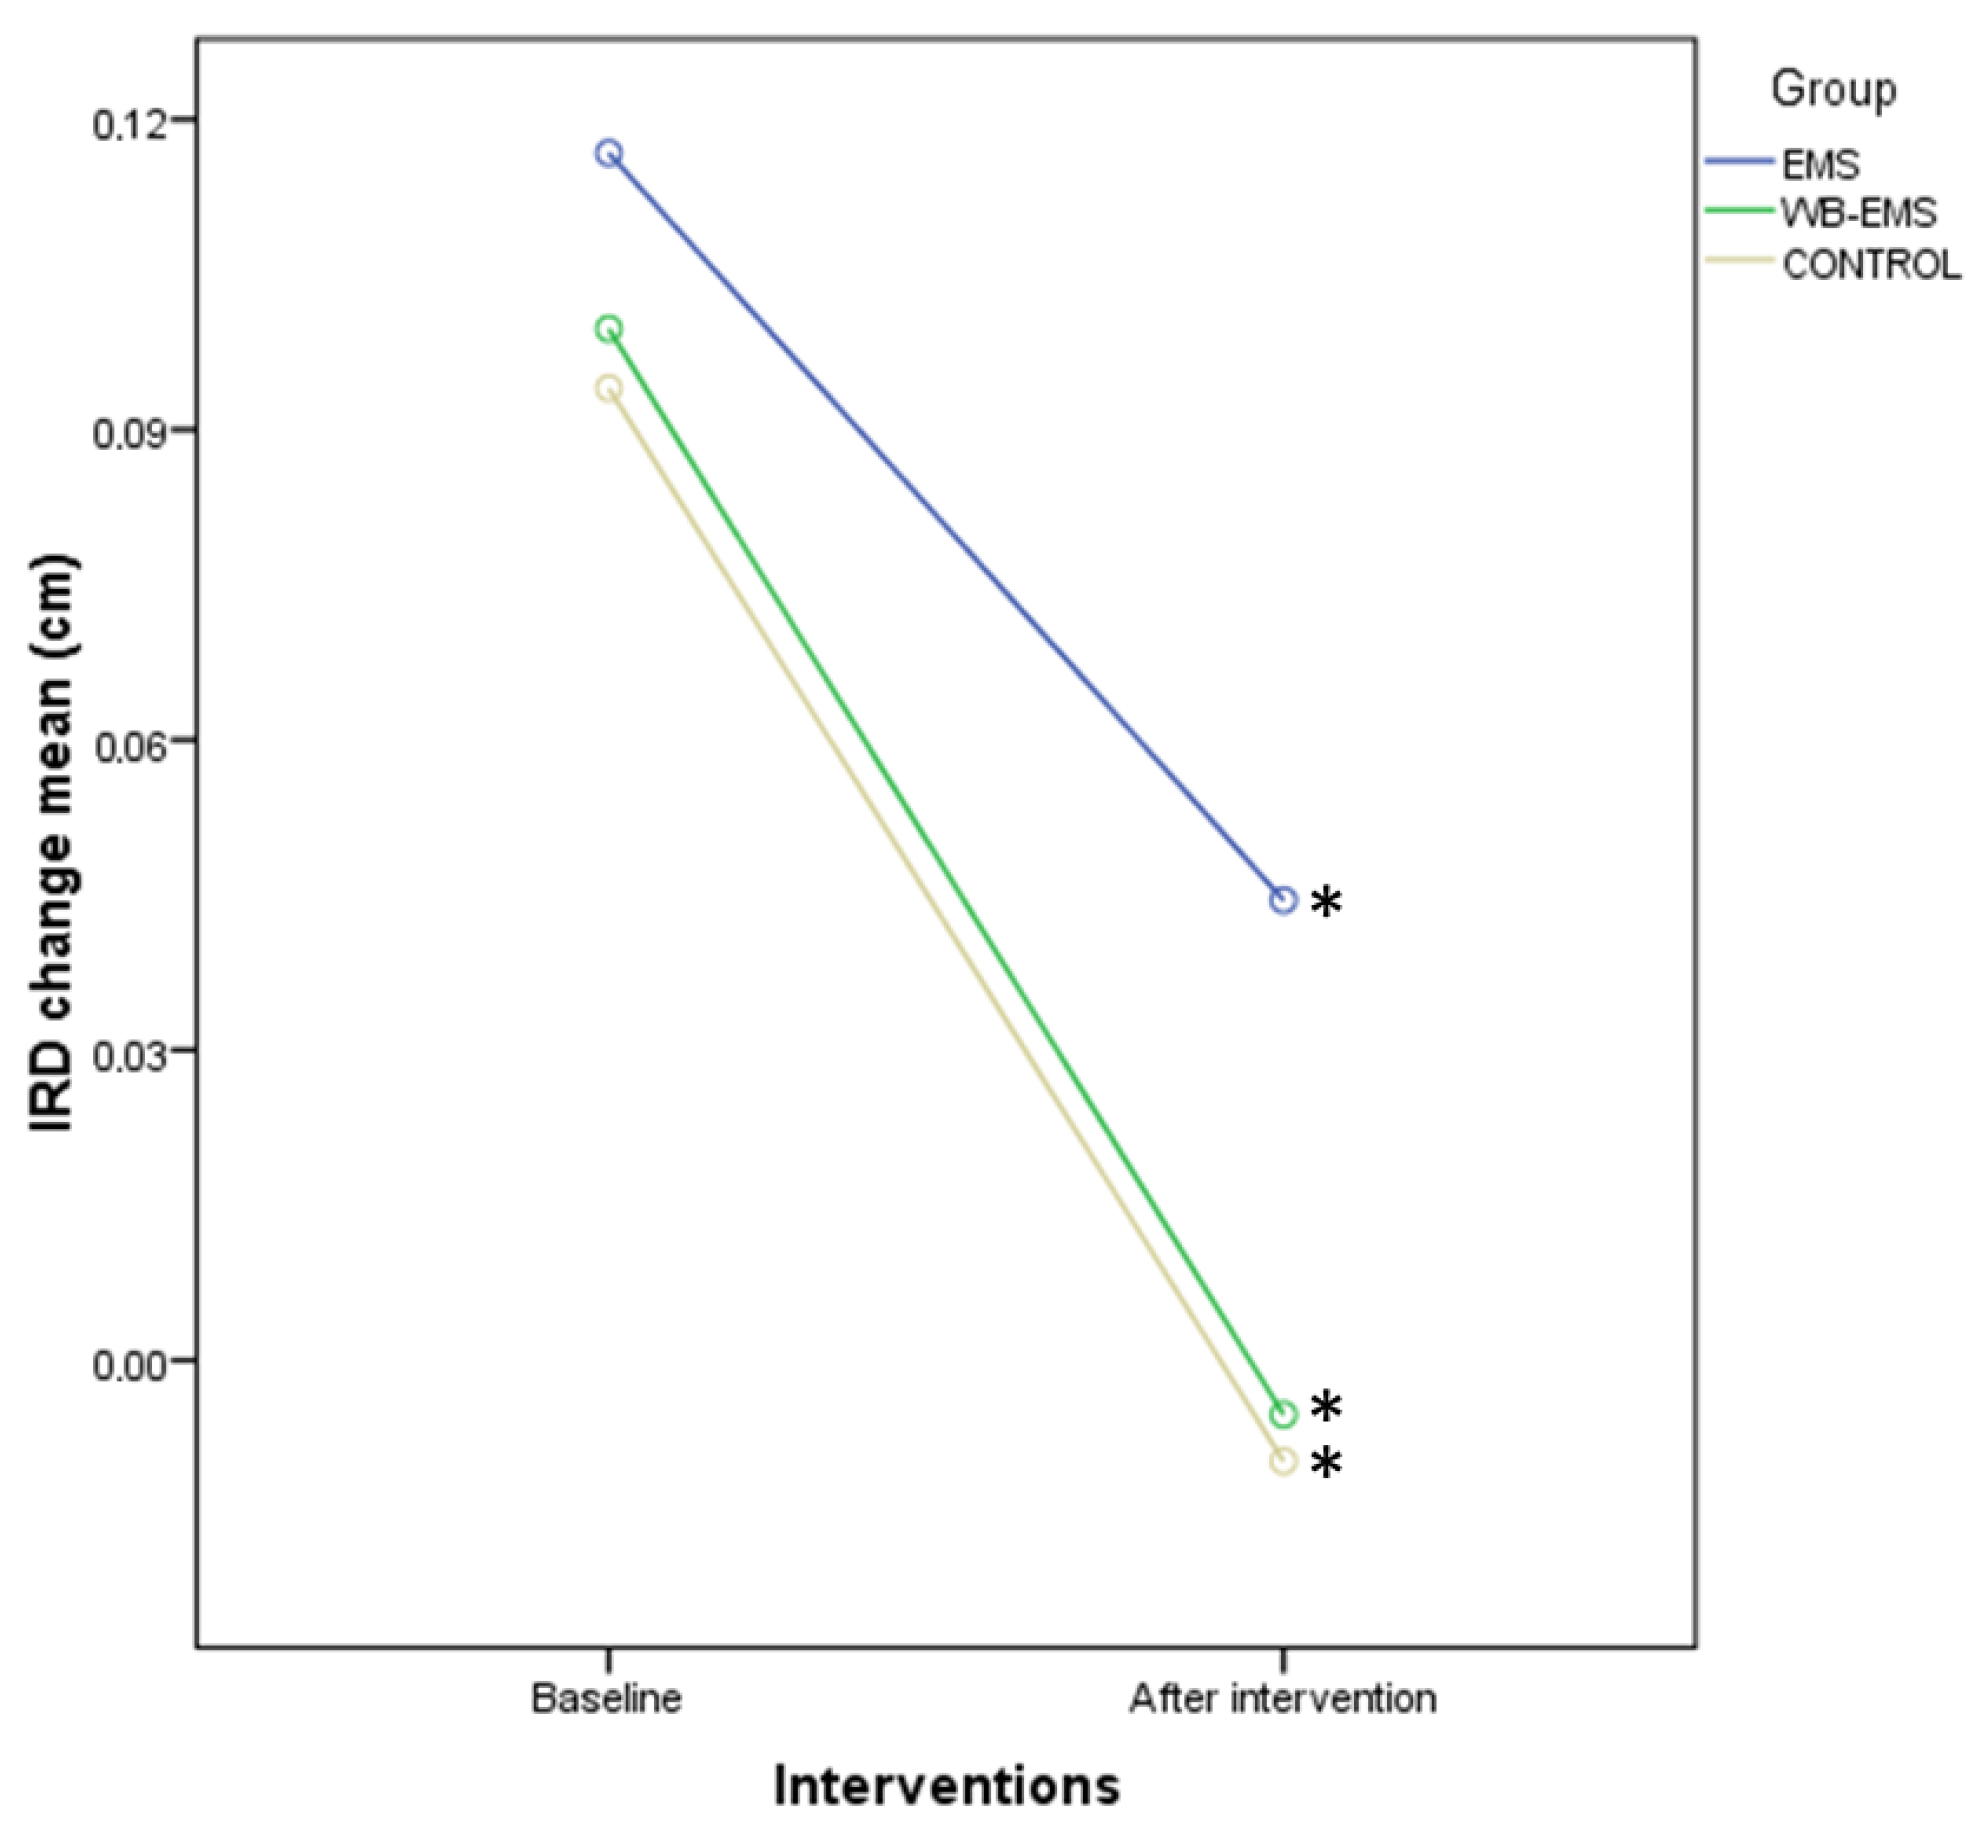
| IRD change (cm) | 0.09 ± 0.23 (−0.20–0.61) | 0.08 ± 0.11 (−0.19–1.03) | 0.09 ± 0.09 (−0.12–0.38) | 0.715 † |
| Right TrA thickness change (cm) | 0.05 ± 0.13 (−0.06–0.29) | 0.04 ± 0.04 (−0.07–0.17) | 0.02 ± 0.07 (−0.09–0.36) | 0.108 † |
| Left TrA thickness change (cm) | 0.04 ± 0.10 (−0.07–0.31) | 0.02 ± 0.09 (−0.09–0.23) | 0.04 ± 0.08 (−0.10–0.42) | 0.191 † |
| Right IO thickness change (cm) | 0.05 ± 0.16 (−0.14–0.37) | 0.06 ± 0.13 (−0.20–0.28) | 0.02 ± 0.09 (−0.14–0.37) | 0.270 † |
| Left IO thickness change (cm) | 0.03 ± 0.11 (−0.16–0.30) | 0.03 ± 0.10 (−0.17–0.27) | 0.04 ± 0.12 (−0.13–0.43) | 0.594 † |
| Right EO thickness change (cm) | −0.03 ± 0.10 (−0.25–0.08) | −0.03 ± 0.10 (−0.25–0.21) | −0.01 ± 0.09 (−0.22–0.14) | 0.294 † |
| Left EO thickness change (cm) | −0.03 ± 0.11 (−0.26–0.14) | −0.02 ± 0.09 (−0.19–0.13) | −0.01 ± 0.08 (−0.15–0.12) | 0.069 † |
| Right RA thickness change (cm) | 0.03 ± 0.10 (−0.10–0.25) | 0.03 ± 0.06 (−0.05–0.32) | 0.03 ± 0.06 (−0.09–0.20) | 0.977 † |
| Left RA thickness change (cm) | 0.03 ± 0.09 (−0.08–0.20) | 0.04 ± 0.07 (−0.06–0.30) | 0.05 ± 0.07 (−0.25–0.34) | 0.672 † |
| Outcome Measurements | EMS (n = 40) | WB−EMS (n = 40) | Control (n = 40) | p-Value | ||||||
|---|---|---|---|---|---|---|---|---|---|---|
| Pre | Post | Difference | Pre | Post | Difference | Pre | Post | Difference | ||
| HR (bpm) | 78.40 ± 15.49 (51–118) | 85.00 ± 22.28 (53–137) | 6.60 ± 12.42 (−22–31) | 73.47 ± 13.16 (51–100) | 105.12 ± 18.12 (59–137) | 31.65 ± 16.22 (1–71) | 74.10 ± 15.68 (54–116) | 100.62 ± 20.81 (59–137) | 26.52 ± 16.22 (−4–75) | <0.001 * |
| SBP (mmHg) | 12.30 ± 1.60 (10.30–14.60) | 11.95 ± 2.13 (9.90–14.90) | 0.00 ± 0.88 (−3.20–2.90) | 12.40 ± 1.88 (10.50–14.25) | 12.10 ± 1.30 (9.70–14.70) | −0.30 ± 1.67 (−3.70–2.00) | 12.30 ± 1.75 (9.10–14.50) | 11.70 ± 1.45 (9.70–14.10) | −0.20 ± 1.30 (−3.40–5.00) | 0.665 † |
| DBP (mmHg) | 7.27 ± 0.73 (5.20–8.60) | 7.12 ± 0.88 (5.40–9.50) | −0.15 ± 0.94 (−1.90–2.40) | 7.53 ± 7.85 (6.00–9.90) | 7.60 ± 0.90 (5.50–9.70) | 0.06 ± 0.84 (−1.50–2.00) | 8.66 ± 9.00 (6.00–9.40) | 8.52 ± 8.72 (5.10–9.20) | −0.13 ± 0.78 (−2.00–2.30) | 0.439 * |
| Temperature (°C) | 36.65 ± 0.30 (36.40–36.90) | 36.55 ± 0.30 (36.80–37.20) | −0.10 ± 0.40 (−1.60–0.70) | 36.60 ± 0.40 (35.70–36.90) | 36.50 ± 0.38 (35.00–37.90) | −0.10 ± 0.48 (−1.30–1.10) | 36.60 ± 0.18 (34.60–36.80) | 36.50 ± 0.48 (34.60–36.90) | −0.10 ± 0.50 (−2.00–2.00) | 0.755 † |
| IRD change (cm) | 0.09 ± 0.23 (−0.20–0.61) | 0.03 ± 0.23 (−0.35–0.45) | −0.07 ± 0.18 (−0.58–0.22) | 0.08 ± 0.11 (−0.19–1.03) | −0.01 ± 0.15 (−0.22–0.33) | −0.07 ± 0.18 (−1.09–0.18) | 0.09 ± 0.09 (−0.12–0.38) | 0.03 ± 0.08 (−0.09–0.15) | −0.09 ± 0.18 (−0.46–0.22) | 0.597 † |
| Right TrA thickness change (cm) | 0.05 ± 0.13 (−0.06–0.29) | 0.04 ± 0.11 (−0.06–0.28) | 0.00 ± 0.07 (−0.19–0.14) | 0.04 ± 0.04 (−0.07–0.17) | 0.03 ± 0.08 (−0.09–0.15) | 0.00 ± 0.08 (−0.14–0.15) | 0.02 ± 0.07 (−0.09–0.36) | 0.01 ± 0.07 (−0.05–0.27) | 0.00 ± 0.07 (−0.14–0.26) | 0.952 † |
| Left TrA thickness change (cm) | 0.04 ± 0.10 (−0.07–0.31) | 0.04 ± 0.08 (−0.03–0.19) | 0.00 ± 0.08 (−0.19–0.17) | 0.02 ± 0.09 (−0.09–0.23) | 0.02 ± 0.06 (−0.08–0.16) | 0.01 ± 0.08 (−0.15–0.21) | 0.04 ± 0.08 (−0.10–0.42) | 0.03 ± 0.08 (−0.09–0.49) | −0.01 ± 0.10 (−0.35–0.18) | 0.644 † |
| Right IO thickness change (cm) | 0.05 ± 0.16 (−0.14–0.37) | 0.05 ± 0.10 (−0.12–0.39) | 0.00 ± 0.11 (−0.37–0.29) | 0.06 ± 0.13 (−0.20–0.28) | 0.05 ± 0.13 (−0.04–0.41) | 0.01 ± 0.09 (−0.29–0.18) | 0.02 ± 0.09 (−0.14–0.37) | 0.04 ± 0.10 (−0.15–0.44) | 0.01 ± 0.13 (−0.26–0.26) | 0.819 † |
| Left IO thickness change (cm) | 0.03 ± 0.11 (−0.16–0.30) | 0.03 ± 0.12 (−0.13–0.20) | 0.01 ± 0.11 (−0.43–0.20) | 0.03 ± 0.10 (−0.17–0.27) | 0.03 ± 0.15 (−0.15–0.35) | 0.02 ± 0.13 (−0.27–0.23) | 0.04 ± 0.12 (−0.13–0.43) | 0.06 ± 0.08 (−0.10–0.34) | 0.02 ± 0.10 (−0.29–0.27) | 0.780 † |
| Right EO thickness change (cm) | −0.03 ± 0.10 (−0.25–0.08) | −0.01 ± 0.10 (−0.18–0.16) | 0.01 ± 0.10 (−0.12–0.26) | −0.03 ± 0.10 (−0.25–0.21) | −0.02 ± 0.11 (−0.21–0.10) | 0.00 ± 0.12 (−0.40–0.28) | −0.01 ± 0.09 (−0.22–0.14) | −0.01 ± 0.07 (−0.16–0.13) | 0.01 ± 0.08 (−0.14–0.21) | 0.816 † |
| Left EO thickness change (cm) | −0.04 ± 0.08 (−0.26–0.14) | −0.03 ± 0.07 (−0.20–0.12) | 0.01 ± 0.07 (−0.24–0.20) | −0.01 ± 0.07 (−0.19–0.13) | 0.00 ± 0.08 (−0.18–0.18) | 0.01 ± 0.09 (−0.20–0.24) | −0.01 ± 0.06 (−0.15–0.12) | −0.00 ± 0.07 (−0.16–0.20) | 0.01 ± 0.07 (−0.17–0.19) | 0.792 * |
| Right RA thickness change (cm) | 0.03 ± 0.10 (−0.10–0.25) | 0.02 ± 0.10 (−0.06–0.13) | −0.01 ± 0.08 (−0.17–0.12) | 0.03 ± 0.06 (−0.05–0.32) | 0.03 ± 0.07 (−0.08–0.21) | 0.00 ± 0.06 (−0.15–0.10) | 0.03 ± 0.06 (−0.09–0.20) | 0.05 ± 0.06 (−0.06–0.16) | 0.01 ± 0.05 (−0.08–0.23) | 0.264 † |
| Left RA thickness change (cm) | 0.03 ± 0.09 (−0.08–0.20) | 0.03 ± 0.10 (−0.12–0.12) | −0.01 ± 0.06 (−0.19–0.14) | 0.04 ± 0.07 (−0.06–0.30) | 0.04 ± 0.09 (−0.04–0.22) | 0.00 ± 0.07 (−0.15–0.15) | 0.05 ± 0.07 (−0.25–0.34) | 0.05 ± 0.06 (−0.07–0.13) | −0.01 ± 0.08 (−0.26–0.32) | 0.381 † |
Disclaimer/Publisher’s Note: The statements, opinions and data contained in all publications are solely those of the individual author(s) and contributor(s) and not of MDPI and/or the editor(s). MDPI and/or the editor(s) disclaim responsibility for any injury to people or property resulting from any ideas, methods, instructions or products referred to in the content. |
© 2023 by the authors. Licensee MDPI, Basel, Switzerland. This article is an open access article distributed under the terms and conditions of the Creative Commons Attribution (CC BY) license (https://creativecommons.org/licenses/by/4.0/).
Share and Cite
Álvarez-Barrio, L.; Rodríguez-Pérez, V.; Calvo-Lobo, C.; Leirós-Rodríguez, R.; Alba-Pérez, E.; López-Rodríguez, A.F. Immediate Effects of Whole-Body versus Local Dynamic Electrostimulation of the Abdominal Muscles in Healthy People Assessed by Ultrasound: A Randomized Controlled Trial. Biology 2023, 12, 454. https://doi.org/10.3390/biology12030454
Álvarez-Barrio L, Rodríguez-Pérez V, Calvo-Lobo C, Leirós-Rodríguez R, Alba-Pérez E, López-Rodríguez AF. Immediate Effects of Whole-Body versus Local Dynamic Electrostimulation of the Abdominal Muscles in Healthy People Assessed by Ultrasound: A Randomized Controlled Trial. Biology. 2023; 12(3):454. https://doi.org/10.3390/biology12030454
Chicago/Turabian StyleÁlvarez-Barrio, Lorena, Vicente Rodríguez-Pérez, César Calvo-Lobo, Raquel Leirós-Rodríguez, Eduardo Alba-Pérez, and Ana Felicitas López-Rodríguez. 2023. "Immediate Effects of Whole-Body versus Local Dynamic Electrostimulation of the Abdominal Muscles in Healthy People Assessed by Ultrasound: A Randomized Controlled Trial" Biology 12, no. 3: 454. https://doi.org/10.3390/biology12030454