Article

Utilization of Computer Classification Methods for Exposure Prediction and Gene Selection in Daphnia magna Toxicogenomics

1
The Life Science Center-Biology, School of Science and Technology, Örebro University, SE-701 82 Örebro, Sweden
2
Center for Applied Autonomous Sensor Systems, Örebro University, SE-701 82 Örebro, Sweden
*
Author to whom correspondence should be addressed.
Biology 2023, 12(5), 692; https://doi.org/10.3390/biology12050692
Submission received: 10 March 2023 / Revised: 2 May 2023 / Accepted: 6 May 2023 / Published: 9 May 2023
(This article belongs to the Special Issue Machine Learning Applications in Biology)

Abstract

:

Simple Summary

The toxicogenomic approach has gained increased attention for understanding key molecular events within organisms to deal with exposure conditions. However, finding relevant biomarkers to predict toxicity still remains a challenging task. In this study, we investigated machine learning applications as a tool to aid toxicity prediction and gene ranking method by training eight different standard supervised machine learning classifiers with qPCR gene expression data. We have shown that the toxicogenomic approach can benefit greatly from machine learning to identify unique expression profiles and predict toxicity, as well as visualization of genes by using Shapley values.

Abstract

Zinc (Zn) is an essential element that influences many cellular functions. Depending on bioavailability, Zn can cause both deficiency and toxicity. Zn bioavailability is influenced by water hardness. Therefore, water quality analysis for health-risk assessment should consider both Zn concentration and water hardness. However, exposure media selection for traditional toxicology tests are set to defined hardness levels and do not represent the diverse water chemistry compositions observed in nature. Moreover, these tests commonly use whole organism endpoints, such as survival and reproduction, which require high numbers of test animals and are labor intensive. Gene expression stands out as a promising alternative to provide insight into molecular events that can be used for risk assessment. In this work, we apply machine learning techniques to classify the Zn concentrations and water hardness from Daphnia magna gene expression by using quantitative PCR. A method for gene ranking was explored using techniques from game theory, namely, Shapley values. The results show that standard machine learning classifiers can classify both Zn concentration and water hardness simultaneously, and that Shapley values are a versatile and useful alternative for gene ranking that can provide insight about the importance of individual genes.

1. Introduction

The amount of zinc (Zn) intake for humans has an influence for many physiological functions that can cause both deficiency and toxicity symptoms. The recommended dietary allowance (RDA) for the essential trace metal Zn for adults over 19 years old is 11 mg/d for men and 8 mg/d for women [1]. A deficiency of Zn can cause symptoms of nausea, vomiting, epigastric pain, and fatigue, while an excess intake of Zn well above the RDA (100–300 mg/d) can cause Zn toxicity that manifests in induced copper deficiency with symptoms of anemia and neutropenia [2]. Zn is naturally found in food products, where certain foods have a higher level of Zn than others, and drinking water, where the water hardness has a crucial influence on Zn bioavailability. Therefore, estimating both the Zn concentration and the hardness of drinking water is of interest for human health risk assessment. To accurately assess the health risks associated with water quality, it is crucial to consider both the concentration of Zn and the hardness of the water. However, the selection of exposure media for traditional toxicology tests is often limited to predetermined hardness levels, which may not reflect the diverse range of water chemistry compositions observed in natural environments. Furthermore, many traditional toxicology tests rely on whole organism endpoints, such as survival and reproduction, which not only require a large number of test animals but can also be time-consuming and labor-intensive. For instance, OECD guidelines for Daphnia magna reproduction test lasts for 21 days [3]. Assessing differences in offspring production by identifying the key biomarker genes and monitoring their expression levels in earlier stages stands out as a promising alternative for risk assessment.
Organisms regulate their gene expression to cope with the changes in water chemistry to maintain homeostasis. Analysis of the key genes that respond to changing hardness and Zn levels can be used to generate representative expression profiles for unique combinations of the two variables. These profiles can be used to predict the exposure conditions of test subjects from different origins. There are various approaches for collecting gene response data for studying toxicological outcomes of organisms, such as quantitative PCR (qPCR), microarrays, and RNA-Seq. qPCR is commonly used to gain insights into emerging toxicity [4]. It is low-cost, simple, and the most accurate method for expression analysis, but it only allows for the testing of a limited number of genes and requires pre-selection of the genes. Microarrays can be used to analyze large numbers of genes with medium cost. However, microarrays have low sensitivity for very lowly or very highly expressed genes as well as high noise. RNA-Seq is a high-cost alternative that has high range and ability to identify novel transcripts. RNA-Seq requires high data processing and storage, and results usually need to be verified by qPCR. Therefore, identifying the key genes that contribute to unique gene expression profiles in different water hardness and Zn concentrations is of interest to aid pre-selection requirement of using qPCR.
Machine learning (ML) is a subfield of artificial intelligence (AI) that can construct hypotheses and find patterns to explain complex relationships in the data and is therefore suitable for molecular biology data. ML has previously been used for water quality assessment [5], microarray gene expression data [6,7,8,9,10], qPCR gene expression [11,12,13], and for many other applications in bioinformatics [14,15,16].
The advantage of using ML is that it can provide a fast, accurate, and un-biased classification of the Zn concentration and water hardness. Another advantage is that it can provide insights into the data and the importance of individual genes that is of use for biologists, who are trying to discover relationships between genes and diseases, but also the relationships among genes [8].
The aim of this study was to evaluate ML techniques to classify Zn concentrations and water hardness from gene expression with 22 genes from Daphnia magna collected using qPCR. Furthermore, an analysis of the selected 22 genes was performed using the feature selection method of χ2, and feature ranking using a trained Random Forest (RF) and Shapley values in order to rank the genes that are most optimal for the tasks of Zn level estimation and water hardness prediction.

2. Materials and Methods

2.1. Machine Learning for Gene Expression

The goal in many ML applications is to use a given dataset to train algorithms that learn to perform a specific task. In supervised learning, where the target outputs are known (input data is labeled), the task could be to classify the input data into discreet categories or predict it into a continuous real value. On the contrary, in unsupervised learning the targets are unknown, but the task can then instead be to find patterns or clusters in the unlabeled input data. Classification and prediction can also be used in an unsupervised (or semi-supervised) setting, but the key factor for achieving high performance is to use the correct ML model with a large, labeled training set in a supervised setting [17]. However, there are several examples in the literature of the use of unsupervised learning in gene expression data, such as hierarchical clustering, self-organizing maps, multidimensional scaling, and several clustering algorithms [18,19,20].
The measure of success for a trained ML model is tested by validating how well it can generalize on new unseen test data. A key factor is to avoid poor generalization and overfitting, where the model performs well on the training data but not on unseen test data. This is influenced by the choice of model and model settings (amount of regularization), pre-processing and normalization procedures, the number of samples, and the number and selection of attributes (genes). Another aspect to keep in mind is to avoid any difference in the distribution between the training data and test data; for example, if biological data are collected in different settings such as using different handlers, experimental parameters, organisms, genomic contexts, or growth conditions [21]. This is because ML models are poor at extrapolating to other factors other than those for which the training data were obtained. Other factors such as microarray platform, reference sample, manipulation of the samples, and intrinsic noise in the measurements have also been described as having an influence on the generalization [8].
In this work, the process of applying ML is to try out several choices for ML model selection, normalization method, feature (gene) selection and use it for training, and then determine which choices give the optimal performance during validation. For validation, a k-fold cross-validation [22] is used where the model is trained using 1/k of the whole dataset as test data and the rest for training data, and then repeat k times with non-repeating samples as the test data. The whole process can be seen in Figure 1.
The code used in this paper can be accessed at https://github.com/martinlangkvist/geneexpression (accessed on 1 May 2023). All models used standard values for hyperparameters from sci-kit learn 1.0.2 with the exceptions that K-nearest neighbor (KNN) used 5 nearest neighbors, Random Forest (RF) used 1000 estimators and max depth of 10, and Neural Network (NN) used ADAM optimizer, learning rate 0.1, 1 layer of 50 hidden units with ReLU activation function.
One key factor of success for any ML model is to have enough training data to capture the distribution of the complex relations between the input and the target output. The amount of data needed depends on the complexity of the data and is difficult to know beforehand, but a common rule of thumb is that the training data should have at least 10 times more samples than the number of input features [23]. For gene expression data, it is generally more costly to acquire more samples than more genes. Another key aspect in ML is feature selection that reduces the data dimensionality, avoids overfitting (to get good generalization), and speeds up the training and inference process. For gene expression data classification, it is, firstly, crucial that the correct genes that correlate to the biological process that is being studied are among the selected genes, and secondly, especially for microarray data, that the redundant genes are removed to avoid noisy input data that reduces the performance of the ML model. A simple unsupervised method for dimensionality reduction is to use the top k number of principal components in a principal component analysis (PCA). However, this method does not guarantee a reduction that optimizes the performance of the predictive model nor give an insight to the biologists about the importance of individual genes. The following section discusses more methods for feature selection for gene ranking.
Finally, one disadvantage of ML predictive models is that they are often black boxes in the sense that the model provides little insight into how it arrived at a certain decision. To achieve good performance on the task the model is trained for, interpretability might not always be necessary. However, if it is achieved, it will result in ML models being more reliable for applications in patient diagnosis, risk assessment, and decision-making. Furthermore, it would give insight into the input data and explain which features are important, which for biologists can provide new knowledge about the importance of certain genes. Some general models for ML interpretability are locally interpretable model-agnostic explanations (LIME) [24], layer-wise relevance propagation [25], and for deep learning model switch post-hoc analyses with feature attribution methods [26,27]. There is ongoing research into how to make ML models more interpretable, specific for gene expression data. The work by [28] utilized a rule-based evolutionary machine learning system for classification of microarray cancer datasets and biologically-constrained architecture [29,30]. The work by [31] used principled pathway attribution methods and game theory in an unsupervised setting to make the learned representations of a deep learning model more interpretable.

2.2. Gene Ranking

There are several methods for ranking candidate genes within statistics (hypothesis tests), machine learning techniques (feature selection, model interpretation), and game theory (Shapley values). One common statistical hypothesis test used for gene ranking is the χ2-test, which scores each gene by measuring the dependence between each gene and the class so that genes that are independent of class, and therefore irrelevant for classification, get a lower ranking. This has previously been used for gene selection [10].
Within ML there are standard feature selection methods, such as sequential forward selection which has been used for gene selection [32]. Some ML models also have a built-in ability to measure the importance of each feature (gene). For example, a trained Random Forest classifier can compute the feature importance, which takes the sum over the number of splits for each feature across all trees that includes that feature and use it for feature (gene) ranking.
The method for using ideas from game theory for gene expression analysis was proposed [33] where the Shapley value [34,35] was used as a measurement for how much each feature (gene) value contributed to the prediction compared to the average prediction. One advantage over other statistical feature ranking methods, is that the average marginal contribution is calculated over all the possible combinations of genes and for each training example. The calculated Shapley values for each gene can then be used to rank all the genes in terms of the model prediction outcome by (1) the overall classification performance for all classes, (2) the overall classification performance for a specific class, (3) the influence each gene had one a specific sample. Shapley values have previously been used with gene expression data for candidate gene ranking [36,37,38] and gene selection for classification [38]. Other feature selection methods for gene selection that have been used are discretization method [39], support vector machine recursive feature elimination (SVM-RFE) [40], correlation-based feature selection (CFS) [41], and principled attribution [31]. For a general review on feature selection approaches in bioinformatics, please see [42].

2.3. Data Collection

The study was conducted using Daphnia magna; a freshwater Cladocera commonly used in toxicity testing. The gene expression data used in this study was obtained from our previous study conducted by following OECD guidelines with media modifications to achieve desired Zn and hardness concentrations [43,44]. Exposure groups consisted of daphnids that were subjected to six varying concentrations of Zn (3.1, 5, 10, 25, 50, and 100 μg/L) across three different levels of water hardness: soft (50 mg CaCO3/L), medium (100 mg CaCO3/L), and hard (200 mg CaCO3/L). For details on experimental setup, RNA isolation, and gene expression analysis, see [44].
The data set contains 128 samples with 22 genes and was collected by a single handler. The 22 genes in the data set that is used in this work are: mta, mtb, mtc, vtg1, vtg2, ecra, ecrb, vmo1, hsp60, ftz1-f1, e74, e75nr, usp, vasa, hsp70, hsp90, cat, gst, dap1, jhe, cyp314, and hsp90b.

3. Results and Discussion

3.1. Classification and Prediction Results
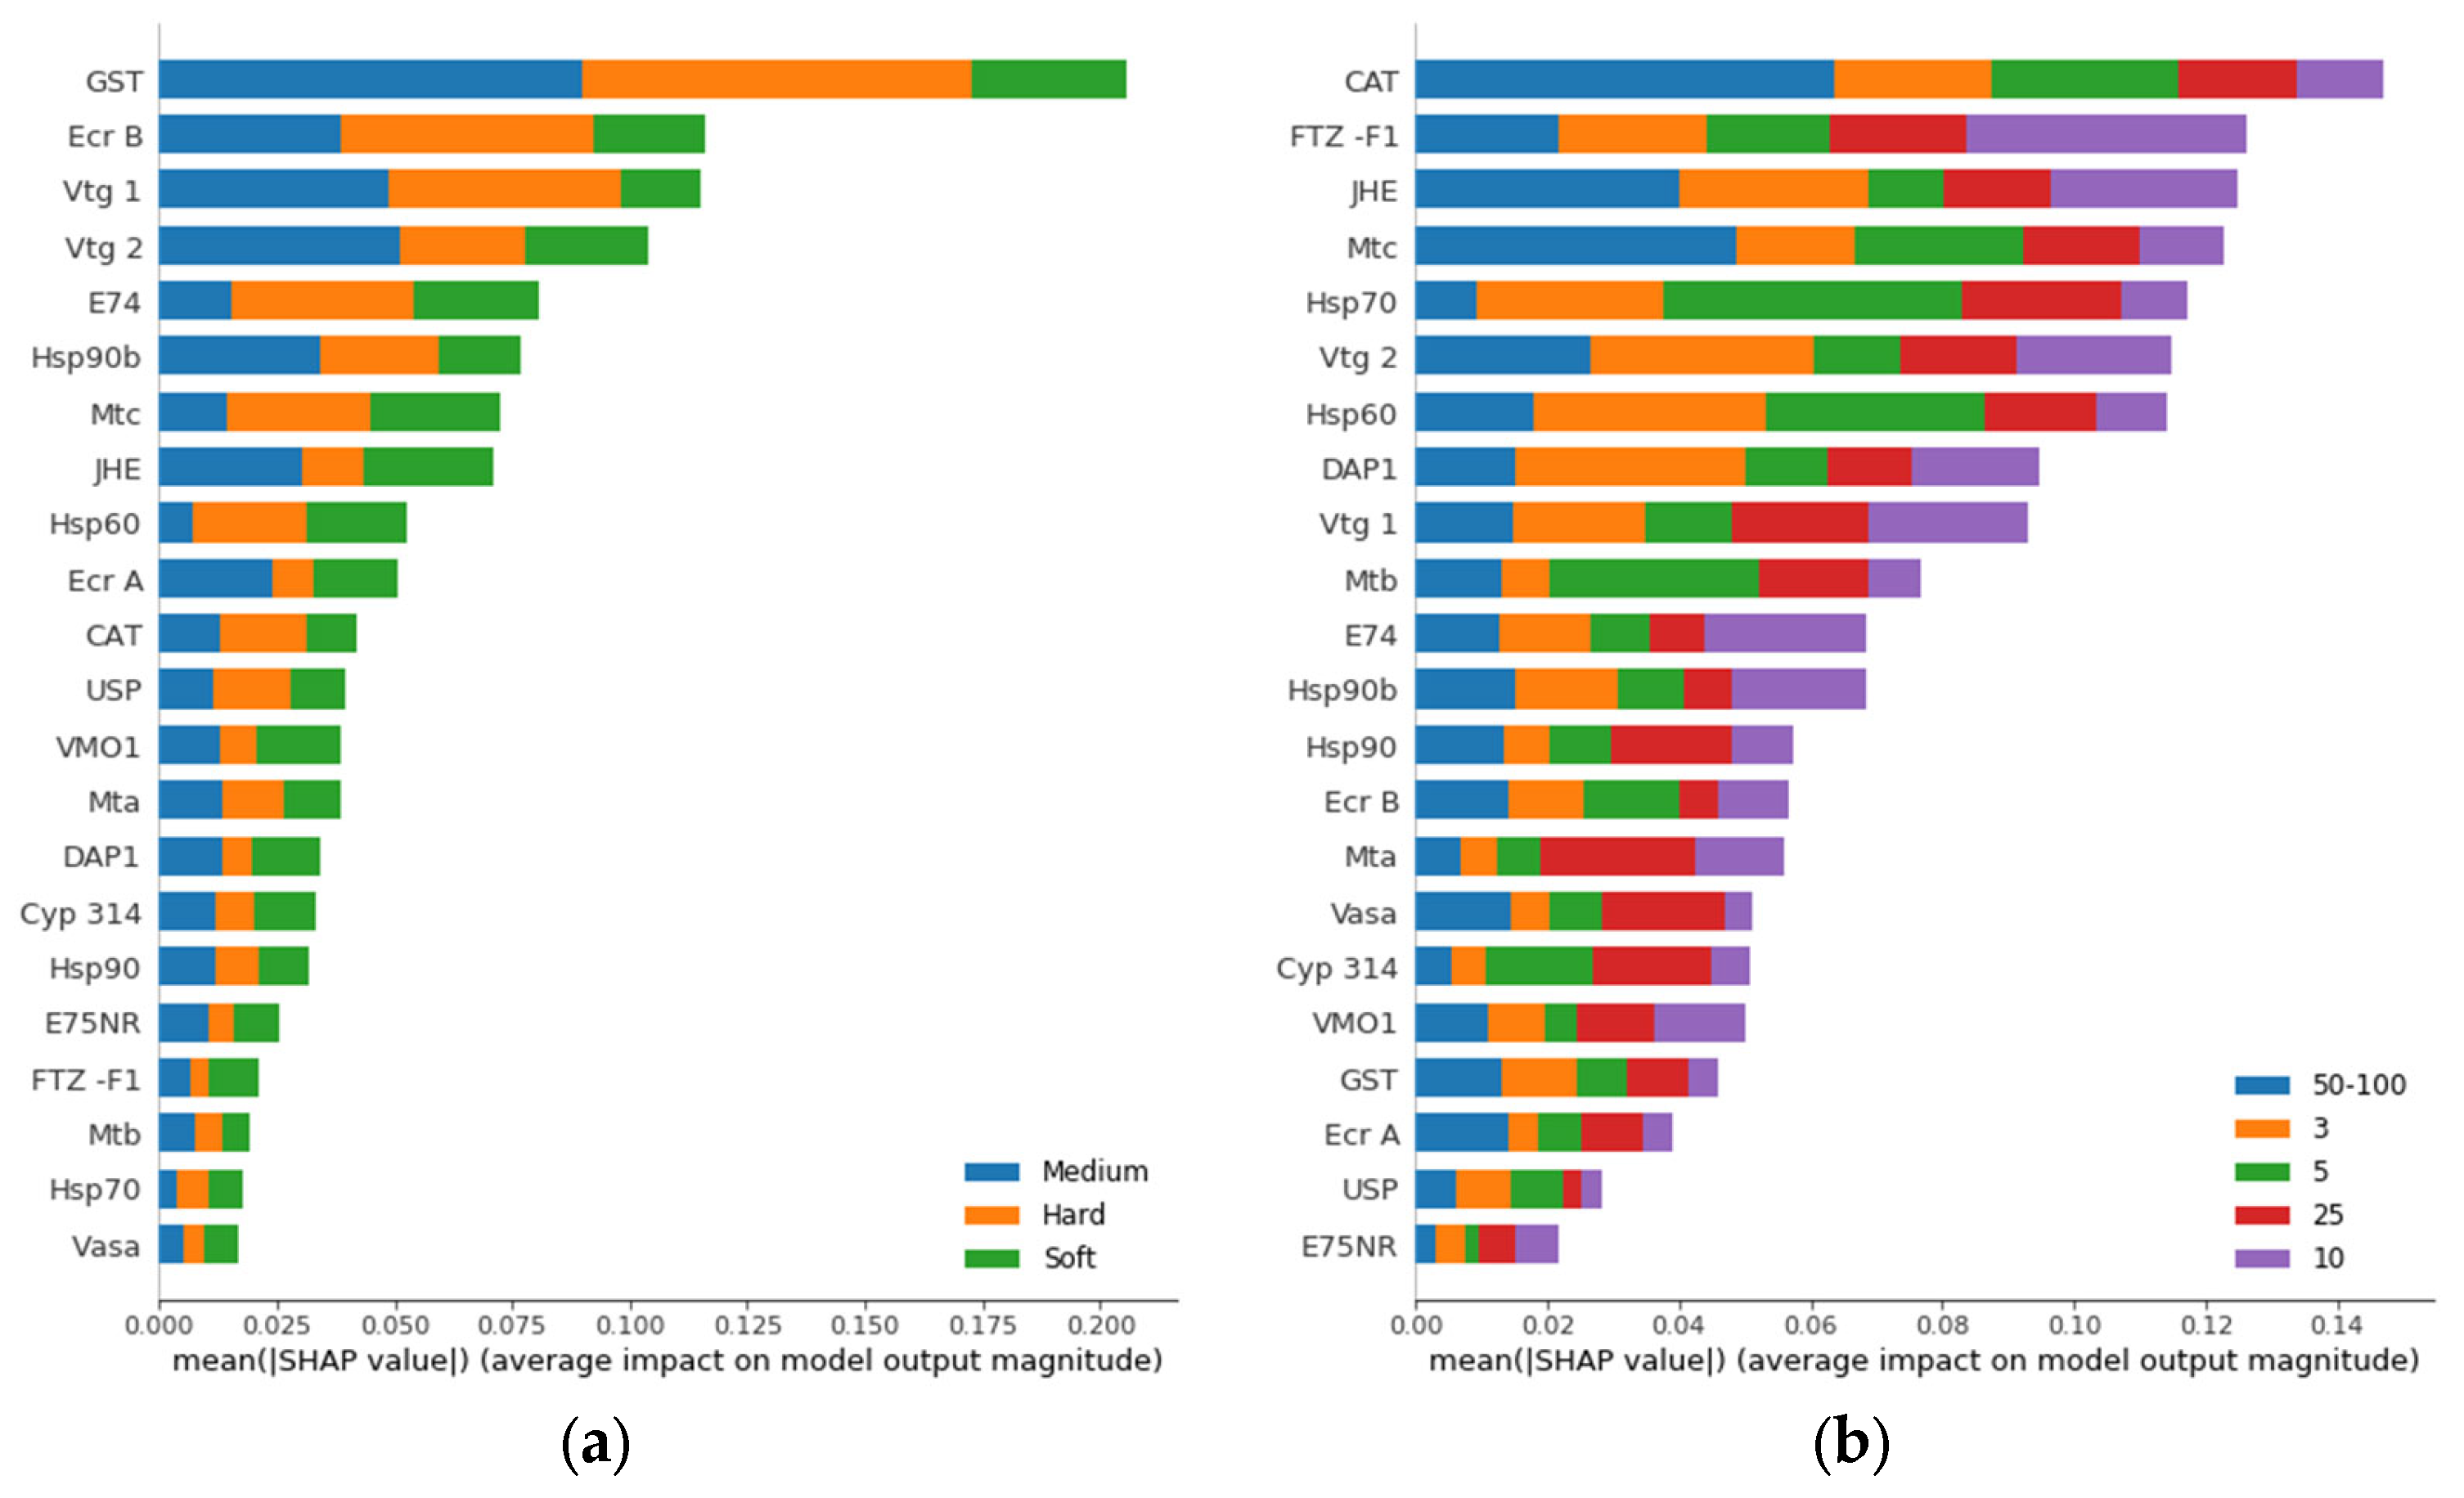
We first analyzed the dataset by classifying samples for their hardness level, Zn level, and the combination of both. The dataset contained fold change values for 128 samples with 22 genes obtained by using ∆∆Ct method [45]. These genes were selected based on their involvement in key biological pathways that respond to Zn and hardness exposure such as metal regulation, reproduction, and oxidative stress [44]. The data is normalized by removing the mean and scaling to unit variance. Due to the low number of samples, a 10-fold cross-validation was used. t-SNE plots were used to visualize clustering of samples for individual and combined classes (Figure 2). For the hardness class, medium water hardness with Zn levels above 3 μg/L was the most separable from the intertwined soft and hard water with the exception of soft water hardness with 25 μg/L Zn (Figure 2a). There was no clear separation for Zn concentration and combined class (Figure 2b,c). This could indicate that water hardness might be more effective at regulating the gene expression parameter compared to Zn concentrations. However, this could also be explained by changes in hardness levels that were more prominent as well as the number of classes for hardness level that were fewer compared to Zn concentrations.
To further analyze the importance of the classes on gene expression, we then tested eight different classifiers to compare their classification accuracy (Table 1). Classifiers were trained on a small proportion of the dataset and subsequently tested with unlabeled data for class prediction. The best accuracy for hardness classification was achieved by using Quadratic Discriminant Analysis (QDA) with 0.88 ± 0.10 followed by Random Forest (RF) with 0.86 ± 0.12 accuracy. However, QDA resulted in significantly lower accuracy for Zn and combination classification. Neural Network (NN) and RF were the best classifiers, resulting consistent and high accuracy for all classification tested.
To gain more insight into how each class affected the prediction results and where the confusion between classes occurred, we generated a confusion matrix for class predictions with the best classifiers. The confusion matrix for water hardness class is summarized in Table 2. Machine learning application was able to predict 24 out of 32 (75%) soft water samples correctly while classifying 5 of them as medium and 3 of them as hard water samples. The prediction accuracy was higher for medium water and hard water samples (88% and 90% respectively).
Similarly, Zn concentration classification prediction for all the tested concentrations ranged between 88% to 92% (Table 3). Interestingly, despite having more classes, the number of confusions for Zn classes were lower compared to hardness classes.
Finally, we constructed a confusion matrix combining Zn concentration and water hardness classes. The confusion matrix for the combination classifier calculated with Random Forest classifier can be seen in Table 4. Seven of the sixteen classifiers had 100% prediction accuracy. The lowest prediction results were obtained with the lowest Zn concentration in all three hardness groups. The largest confusion is observed for low concentration of Zn in soft and hard water.

3.2. Gene Ranking

After investigating the class prediction accuracy, we explored the contribution of each gene to prediction results. Gene analysis is an important step in understanding the biological mechanisms that regulate physiological and biochemical processes in living organisms. The genes were first analyzed by visualizing the error bar for each of the 22 genes in Figure 3. The error bar showed the mean value and standard deviation for the raw fold change values for each gene, and each gene was colored by class. The results showed that 20 out of the 22 tested genes had overlapping values for all three classes of water hardness. However, two genes, gst and vtg1, did not have overlapping values for medium and hard water hardness (Figure 3). This suggests that the expression levels of these genes could have been influenced by the medium and hard water hardness levels. Interestingly, both genes still overlapped in soft water hardness, indicating that the expression levels of these genes may have been similar under soft water conditions.
GST, or Glutathione S-transferase, are phase-II detoxification enzymes present in nearly all living organisms which play a crucial role in preserving cellular homeostasis [46]. A separate study revealed that the exposure of Pacu to hard water resulted in an increase in GST activity in both the kidney and gills, as compared to soft water [47]. Another study, using African catfish exposed to different concentrations of Zn, revealed that water hardness had a notable effect on GST levels [48]. Moreover, changes in gst expression were also observed in D. magna exposed to copper under varying water hardness levels [49]. On the other hand, vitellogenins (vtg) are major precursors of egg yolk proteins and serve as important biomarkers that reflect changes in reproductive output [50]. Based on our previous study, we observed a phenotypic correlation between the effect of water hardness on vtg1 levels and reproductive outcomes, whereby both offspring numbers and fecundity for each brood were altered [43]. The hardness effect on reproductive output is also evidenced by numerous studies for D. magna [51,52,53,54]. Based on these findings, it could be inferred that the expression levels of most of the analyzed genes were not significantly affected by different water hardness levels, except for gst and vtg1, which could potentially serve as candidate biomarkers for distinguishing medium and hard water exposures.
In order to test this claim further, we used methods of χ2-test, RF feature importance, and Shapley values to generate gene ranking based on their contribution for class prediction in a descending order (Table 5). The Shapley values were calculated using SHAP [27]. Consistent with the previous results obtained by comparing error bars, the gst gene has the highest ranking of all three methods, whereas vtg1 also ranked second for χ2-test and third for the other two methods. The results were also similar to previously published data, where effect of the exposure on oxidative stress and reproduction was shown on physiological endpoint levels [44].
The advantage of using Shapley values is that the gene importance can be divided per class and per sample. The gene ranking achieved by using overall Shapley values for two classifiers, hardness and Zn concentration, respectively, is shown in Figure 4. The gst gene is a strong relevant feature for hardness whereas it does not contribute as much to Zn concentration ranking. On the other hand, cat is the most relevant gene for Zn concentration class and has low impact on hardness class. Therefore, gene ranking using Shapley values can be used to identify candidate biomarker genes for each setup.
The individual gene impact on the model output for each hardness class was further analyzed (Figure 5). According to Figure 5b, when feature values for gst are low, the probability of the sample having medium water hardness increases, while high feature values decrease this probability. On the other hand, Figure 5c shows the opposite behavior for hard water hardness, which partly explains why gst is the top-ranked contributor for class separation. While gst has the overall largest impact for all three classes, other highly ranked genes, such as e74 and jhe, had a low impact on medium and hard classes, respectively. When selecting candidate genes as biomarkers, there is thus an option to select the genes that have an overall impact on all three classes or select genes for a specific class.
Shapley values also allow us to analyze each gene’s contribution to the model output for each class prediction. One example of each gene’s impact on the model output for the soft water class is shown in Figure 6. It was observed that most genes push the probability of the sample being classified as soft from the base value to 0.67 with e74 being the largest contributor for this sample (Figure 6a). As shown in Figure 6b,c, some genes increase the probability of correct classification, while other genes reduce the class probability from the base values to 0.54 and 0.53, respectively. Therefore, the model correctly predicted this sample as soft hardness since it resulted the highest probability of 0.67 for soft class.

4. Conclusions

In this work, eight different standard supervised machine learning classifiers have been trained on qPCR gene expression data for the task of classifying the Zn concentration (5 classes), water hardness (3 classes), and the combination of both (16 classes). The accuracy ranged between 86% and 91% for the first two tasks and reached 82% for the final task. The best model was between Random Forest and Neural Network depending on the task, which could merely be a consequence of non-exhaustive model parameter search. The added benefit of using Random Forest, besides achieving good classification performance, is that it naturally provides feature importance estimates and requires minimal hyperparameter tuning [55]. The main advantage of using Neural Network is that it can achieve higher performance at the cost of needing additional data and more exhaustive model parameter search for when highest possible classification performance is desired.
The use of Shapley values to visualize the impact of individual genes on overall classification performance, per-class classification performance, and per-sample gene impact has been explored in this paper. Machine learning applications in biological studies should aim to identify previously unknown genes for prediction and/or classification tasks. However, any approach may provide a matching result from a machine learning standpoint and needs to be validated with true results. Therefore, this study constitutes the first step of validation of tested applications on a smaller dataset, where the interpretation of biological significance is established. Our analysis has identified two crucial genes that play a role in oxidative stress and reproduction. The impact of the exposure on oxidative stress and reproduction was evident through phenotypical endpoints, and our gene ranking results were consistent with well-established stress biomarkers for Daphnia, as supported by previous studies. This approach of utilizing game theory techniques can enable biologists to manually examine the influence of each gene in different scenarios of interest, rather than relying on only the average gene performance as is typically done in other gene ranking methods.
This work shows that unbiased interpretation of gene expression data by machine learning is a useful tool for toxicogenomics and the work can be extended to other applications of gene expression analysis. Unique gene expression profiles obtained from different exposure conditions can be used to train machine learning, which in turn can be used to predict exposure conditions. The learning outcomes of this study can be further tested with larger data such as transcriptomics, which would potentially lead to the discovery of novel biomarkers.

Author Contributions

Conceptualization, J.J. and P.-E.O.; data curation, B.P.; formal analysis, B.P. and M.L.; funding acquisition, J.J. and P.-E.O.; investigation, B.P.; methodology, B.P. and M.L.; project administration, J.J. and P.-E.O.; resources, P.-E.O.; software, M.L.; supervision, J.J. and P.-E.O.; validation, B.P.; visualization, B.P.; writing—original draft, B.P.; writing—review and editing, B.P., M.L., J.J. and P.-E.O. All authors have read and agreed to the published version of the manuscript.

Funding

This work was funded by the Knowledge Foundation Sweden (Stiftelsen för Kunskaps- och Kompetensutveckling), grant 20180027 and Örebro University 1214-NT3060.

Institutional Review Board Statement

Not applicable.

Informed Consent Statement

Not applicable.

Data Availability Statement

All data supporting the results of this research are included within the article.

Conflicts of Interest

The authors declare no conflict of interest.

References

  1. EFSA Panel on Dietetic Products, Nutrition and Allergies (NDA). Scientific Opinion on Dietary Reference Values for Zinc. EFSA J. 2014, 12, 3844. [Google Scholar]
  2. Fosmire, G.J. Zinc toxicity. Am. J. Clin. Nutr. 1990, 51, 225–227. [Google Scholar] [CrossRef] [PubMed]
  3. OECD. Test No. 211: Daphnia Magna Reproduction Test; OECD: Paris, France, 2012. [Google Scholar]
  4. VanGuilder, H.D.; Vrana, K.E.; Freeman, W.M. Twenty-five years of quantitative PCR for gene expression analysis. Biotechniques 2008, 44, 619–626. [Google Scholar] [CrossRef] [PubMed]
  5. Huang, R.; Ma, C.; Ma, J.; Huangfu, X.; He, Q. Machine learning in natural and engineered water systems. Water Res. 2021, 205, 117666. [Google Scholar] [CrossRef] [PubMed]
  6. Pirooznia, M.; Yang, J.Y.; Yang, M.Q.; Deng, Y. A comparative study of different machine learning methods on microarray gene expression data. BMC Genom. 2008, 9, S13. [Google Scholar] [CrossRef]
  7. Molla, M.; Waddell, M.; Page, D.; Shavlik, J. Using Machine Learning to Design and Interpret Gene-Expression Microarrays. AI Mag. 2004, 25, 23. [Google Scholar]
  8. Kuo, W.P.; Kim, E.Y.; Trimarchi, J.; Jenssen, T.K.; Vinterbo, S.A.; Ohno-Machado, L. A primer on gene expression and microarrays for machine learning researchers. J. Biomed. Inform. 2004, 37, 293–303. [Google Scholar] [CrossRef] [PubMed]
  9. Tan, A.C.; Gilbert, D. Ensemble machine learning on gene expression data for cancer classification. Appl. Bioinform. 2003, 2 (Suppl. S3), S75–S83. [Google Scholar]
  10. Jin, X.; Xu, A.; Bie, R.; Guo, P. Machine Learning Techniques and Chi-Square Feature Selection for Cancer Classification Using SAGE Gene Expression Profiles. In Proceedings of the Data Mining for Biomedical Applications: PAKDD 2006 Workshop, BioDM 2006, Singapore, 9 April 2006. [Google Scholar]
  11. Spencer, W.C.; Zeller, G.; Watson, J.D.; Henz, S.R.; Watkins, K.L.; McWhirter, R.D.; Miller, D.M. A spatial and temporal map of C. elegans gene expression. Genome Res. 2011, 21, 325–341. [Google Scholar] [CrossRef]
  12. Gunay, M.; Goceri, E.; Balasubramaniyan, R. Machine learning for optimum CT-prediction for qPCR. In Proceedings of the 15th IEEE International Conference on Machine Learning and Applications, ICMLA 2016, Anaheim, CA, USA, 18–20 December 2016. [Google Scholar]
  13. Yuan, F.; Lu, L.; Zou, Q. Analysis of gene expression profiles of lung cancer subtypes with machine learning algorithms. Biochim. Biophys. Acta (BBA) Mol. Basis Dis. 2020, 1866, 165822. [Google Scholar] [CrossRef] [PubMed]
  14. Min, S.; Lee, B.; Yoon, S. Deep learning in bioinformatics. Brief. Bioinform. 2016, 18, 851–869. [Google Scholar] [CrossRef] [PubMed]
  15. Leung, M.K.K.; Delong, A.; Alipanahi, B.; Frey, B.J. Machine Learning in Genomic Medicine: A Review of Computational Problems and Data Sets. Proc. IEEE 2016, 104, 176–197. [Google Scholar] [CrossRef]
  16. Mamoshina, P.; Vieira, A.; Putin, E.; Zhavoronkov, A. Applications of Deep Learning in Biomedicine. Mol. Pharm. 2016, 13, 1445–1454. [Google Scholar] [CrossRef]
  17. Abraham, R.S.A. Comparison of Supervised and Unsupervised Learning Algorithms for Pattern Classification. Int. J. Adv. Res. Artif. Intell. 2013, 2, 34–38. [Google Scholar]
  18. Ramaswamy, S.; Tamayo, P.; Rifkin, R.; Mukherjee, S.; Yeang, C.-H.; Angelo, M.; Ladd, C.; Reich, M.; Latulippe, E.; Mesirov, J.P.; et al. Multiclass cancer diagnosis using tumor gene expression signatures. Proc. Natl. Acad. Sci. USA 2001, 98, 15149–15154. [Google Scholar] [CrossRef] [PubMed]
  19. Eisen, M.B.; Spellman, P.T.; Brown, P.O.; Botstein, D. Cluster analysis and display of genome-wide expression patterns. Proc. Natl. Acad. Sci. USA 1998, 95, 14863–14868. [Google Scholar] [CrossRef]
  20. Nikkilä, J.; Törönen, P.; Kaski, S.; Venna, J.; Castrén, E.; Wong, G. Analysis and visualization of gene expression data using Self-Organizing Maps. Neural Networks 2002, 15, 953–966. [Google Scholar] [CrossRef]
  21. De Jongh, R.P.; van Dijk, A.D.; Julsing, M.K.; Schaap, P.J.; de Ridder, D. Designing Eukaryotic Gene Expression Regulation Using Machine Learning. Trends Biotechnol. 2020, 38, 191–201. [Google Scholar] [CrossRef] [PubMed]
  22. Berrar, D. Cross-Validation; Tokyo Institute of Technology: Tokyo, Japan, 2019; pp. 542–545. [Google Scholar]
  23. Jain, A.K.; Duin, R.P.W.; Mao, J. Statistical pattern recognition: A review. IEEE Trans. Pattern Anal. Mach. Intell. 2000, 22, 4–37. [Google Scholar] [CrossRef]
  24. Ribeiro, M.T.; Singh, S.; Guestrin, C. “Why Should I Trust You?”: Explaining the Predictions of Any Classifier. In Proceedings of the 22nd ACM SIGKDD International Conference on Knowledge Discovery and Data Mining, San Francisco, CA, USA, 14–18 August 2016; Association for Computing Machinery: New York, NY, USA, 2016; pp. 1135–1144. [Google Scholar]
  25. Bach, S.; Binder, A.; Montavon, G.; Klauschen, F.; Müller, K.-R.; Samek, W. On Pixel-Wise Explanations for Non-Linear Classifier Decisions by Layer-Wise Relevance Propagation. PLoS ONE 2015, 10, e0130140. [Google Scholar] [CrossRef]
  26. Shrikumar, A.; Greenside, P.; Kundaje, A. Learning Important Features Through Propagating Activation Differences. In Proceedings of the 34th International Conference on Machine Learning, Sydney, Australia, 6–11 August 2017; PMLR: Proceedings of Machine Learning Research; Precup, D., Teh, Y.W., Eds.; JMLR: Cambridge, MA, USA, 2017; Volume 70, pp. 3145–3153. [Google Scholar]
  27. Lundberg, S.M.; Lee, S.I. A unified approach to interpreting model predictions. In Proceedings of the 31st International Conference on Neural Information Processing Systems, Long Beach, CA, USA, 4–9 December 2017; Curran Associates Inc.: Long Beach, CA, USA, 2017; pp. 4768–4777. [Google Scholar]
  28. Glaab, E.; Bacardit, J.; Garibaldi, J.M.; Krasnogor, N. Using Rule-Based Machine Learning for Candidate Disease Gene Prioritization and Sample Classification of Cancer Gene Expression Data. PLoS ONE 2012, 7, e39932. [Google Scholar] [CrossRef] [PubMed]
  29. Lotfollahi, M.; Rybakov, S.; Hrovatin, K.; Hediyeh-Zadeh, S.; Talavera-López, C.; Misharin, A.V.; Theis, F.J. Biologically informed deep learning to query gene programs in single-cell atlases. Nat. Cell Biol. 2023, 25, 337–350. [Google Scholar] [CrossRef]
  30. Seninge, L.; Anastopoulos, I.; Ding, H.; Stuart, J. VEGA is an interpretable generative model for inferring biological network activity in single-cell transcriptomics. Nat. Commun. 2021, 12, 5684. [Google Scholar] [CrossRef]
  31. Janizek, J.D.; Spiro, A.; Celik, S.; Blue, B.W.; Russell, J.C.; Lee, T.-I.; Kaeberlin, M.; Lee, S.-I. PAUSE: Principled feature attribution for unsupervised gene expression analysis. Genome Biol. 2022, 24, 81. [Google Scholar] [CrossRef]
  32. Weber, G.; Vinterbo, S.; Ohno-Machado, L. Multivariate selection of genetic markers in diagnostic classification. Artif. Intell. Med. 2004, 31, 155–167. [Google Scholar] [CrossRef]
  33. Moretti, S.; Patrone, F.; Bonassi, S. The class of microarray games and the relevance index for genes. TOP 2007, 15, 256–280. [Google Scholar] [CrossRef]
  34. Shapley, L.S. A Value for N-Person Games; RAND Corporation: Santa Monica, CA, USA, 1952. [Google Scholar]
  35. Lipovetsky, S.; Conklin, M. Analysis of regression in game theory approach. Appl. Stoch. Model. Bus. Ind. 2001, 17, 319–330. [Google Scholar] [CrossRef]
  36. Moretti, S.; Van Leeuwen, D.; Gmuender, H.; Bonassi, S.; Van Delft, J.; Kleinjans, J.; Patrone, F.; Merlo, D.F. Combining Shapley value and statistics to the analysis of gene expression data in children exposed to air pollution. BMC Bioinform. 2008, 9, 361. [Google Scholar] [CrossRef] [PubMed]
  37. Sun, M.W.; Moretti, S.; Paskov, K.M.; Stockham, N.T.; Varma, M.; Chrisman, B.S.; Washington, P.Y.; Jung, J.-Y.; Wall, D.P. Game theoretic centrality: A novel approach to prioritize disease candidate genes by combining biological networks with the Shapley value. BMC Bioinform. 2020, 21, 356. [Google Scholar] [CrossRef] [PubMed]
  38. Fragnelli, V.; Moretti, S. A game theoretical approach to the classification problem in gene expression data analysis. Comput. Math. Appl. 2008, 55, 950–959. [Google Scholar] [CrossRef]
  39. Fayyad, U.M.I.; Keki, B. Multi-Interval Discretization of Continuous-Valued Attributes for Classification Learning. In Proceedings of the 13th International Joint Conference on Artificial Intelligence, Chambéry, France, 28 August–3 September 1993; Morgan Kaufmann Publishers Inc.: San Francisco, CA, USA, 1993. [Google Scholar]
  40. Guyon, I.; Weston, J.; Barnhill, S.; Vapnik, V. Gene Selection for Cancer Classification using Support Vector Machines. Mach. Learn. 2002, 46, 389–422. [Google Scholar] [CrossRef]
  41. Lu, X.; Peng, X.; Deng, Y.; Feng, B.; Liu, P.; Liao, B. A Novel Feature Selection Method Based on Correlation-Based Feature Selection in Cancer Recognition. J. Comput. Theor. Nanosci. 2014, 11, 427–433. [Google Scholar] [CrossRef]
  42. Saeys, Y.; Inza, I.; Larrañaga, P. A review of feature selection techniques in bioinformatics. Bioinformatics 2007, 23, 2507–2517. [Google Scholar] [CrossRef]
  43. OECD. Test No. 202: Daphnia sp. Acute Immobilisation Test; OECD: Paris, France, 2004. [Google Scholar]
  44. Paylar, B.; Asnake, S.; Sjöberg, V.; Ragnvaldsson, D.; Jass, J.; Olsson, P. Influence of water hardness on zinc toxicity in Daphnia magna. J. Appl. Toxicol. 2022, 42, 1510–1523. [Google Scholar] [CrossRef]
  45. Livak, K.J.; Schmittgen, T.D. Analysis of relative gene expression data using real-time quantitative PCR and the 2(-Delta Delta C(T)). Method. Methods 2001, 25, 402–408. [Google Scholar] [CrossRef]
  46. Zhang, J.; Grek, C.; Ye, Z.-W.; Manevich, Y.; Tew, K.D.; Townsend, D.M. Pleiotropic Functions of Glutathione S-Transferase P. In Advances in Cancer Research; Academic Press: Cambridge, MA, USA, 2014; Volume 122, pp. 143–175. [Google Scholar] [CrossRef]
  47. Copatti, C.E.; Baldisserotto, B.; Souza, C.D.F.; Monserrat, J.M.; Garcia, L. Water pH and hardness alter ATPases and oxidative stress in the gills and kidney of pacu (Piaractus mesopotamicus). Neotropical Ichthyol. 2019, 17, e190032. [Google Scholar] [CrossRef]
  48. Saliu, J.K.; Bawa-Allah, K.A. Toxicological Effects of Lead and Zinc on the Antioxidant Enzyme Activities of Post Juvenile Clarias gariepinus. Resour. Environ. 2012, 2, 21–26. [Google Scholar] [CrossRef]
  49. Chupani, L.; Sjöberg, V.; Jass, J.; Olsson, P.-E. Water Hardness Alters the Gene Expression Response and Copper Toxicity in Daphnia magna. Fishes 2022, 7, 248. [Google Scholar] [CrossRef]
  50. Matozzo, V.; Gagné, F.; Marin, M.G.; Ricciardi, F.; Blaise, C. Vitellogenin as a biomarker of exposure to estrogenic compounds in aquatic invertebrates: A review. Environ. Int. 2008, 34, 531–545. [Google Scholar] [CrossRef] [PubMed]
  51. Lewis, M.A.; Maki, A.W. Effects of water hardness and diet on productivity of Daphnia magna Straus. in laboratory culture. Hydrobiologia 1981, 85, 175–179. [Google Scholar] [CrossRef]
  52. Paulauskis, J.D.; Winner, R.W. Effects of water hardness and humic acid on zinc toxicity to Daphnia magna Straus. Aquat. Toxicol. 1988, 12, 273–290. [Google Scholar] [CrossRef]
  53. Cowgill, U.M.; Milazzo, D.P. The sensitivity of two cladocerans to water quality variables: Alkalinity. Arch. Environ. Contam. Toxicol. 1991, 21, 224–232. [Google Scholar] [CrossRef]
  54. Cowgill, U.M.; Milazzo, D.P. Demographic effects of salinity, water hardness and carbonate alkalinity on Daphnia magna and Ceriodaphnia dubia. Arch. Für Hydrobiol. 1991, 122, 33–56. [Google Scholar] [CrossRef]
  55. Greener, J.G.; Kandathil, S.M.; Moffat, L.; Jones, D.T. A guide to machine learning for biologists. Nat. Rev. Mol. Cell Biol. 2022, 23, 40–55. [Google Scholar] [CrossRef] [PubMed]
Figure 1. A schematic chart that summarizes the process of training a machine learning model on gene expression data.
Biology 12 00692 g001
Figure 2. The t-SNE plots for the data set used in this study are colored by (a) three water hardness classes, (b) five Zn level classes, and (c) both water and Zn level.
Biology 12 00692 g002
Figure 3. Error bar (mean and standard deviation on normalized raw values) for all 22 genes colored by water hardness.
Biology 12 00692 g003
Figure 4. Gene ranking using Shapley values based on contribution to prediction of water hardness (a) and Zn concentration (b). The genes are ranked by the sum of the total impact for all classes from most total impactful gene (top) to least total impactful gene (bottom) for class prediction.
Biology 12 00692 g004
Figure 5. Gene impact on model output for class (a) soft, (b) medium, and (c) hard water hardness using SHAP value impact on model output. The genes are ranked for each class from most impactful gene (top) to least impactful gene (bottom) for class prediction.
Biology 12 00692 g005
Figure 6. Gene impact on model output for class soft (a), medium (b), and hard water (c) prediction for a soft water sample, respectively. Machine learning predicted the sample class correctly as soft class by assigning highest probability (0.67) to soft water.
Biology 12 00692 g006aBiology 12 00692 g006b
Table 1. Classification accuracy and standard deviation for classifying three classes for multiple classifiers with a five-fold cross-validation.
ClassifierWater Hardness Zn LevelCombined
Support Vector Machine (SVM)0.85 ± 0.120.82 ± 0.120.69 ± 0.06
K-nearest neighbor (KNN) 0.84 ± 0.080.78 ± 0.080.74 ± 0.08
Random Forest (RF)0.86 ± 0.120.87 ± 0.080.82 ± 0.04
Neural Network (NN) 0.85 ± 0.120.91 ± 0.090.81 ± 0.10
Gaussian Process (GP) 0.81 ± 0.130.25 ± 0.030.07 ± 0.03
AdaBoost 0.73 ± 0.120.37 ± 0.120.12 ± 0.00
Naive Bayes (NB) 0.79 ± 0.100.60 ± 0.100.74 ± 0.08
Quadratic Discriminant Analysis (QDA) 0.88 ± 0.100.25 ± 0.030.17 ± 0.07
Table 2. Confusion matrix for classifying three levels of water hardness for 128 samples using a five-fold cross-validation.
Predicted
SoftMediumHard
Soft2453
TrueMedium4422
Hard3243
Table 3. Classification accuracy and standard deviation for classifying water hardness and Zn concentration (16 classes) for multiple classifiers with a five-fold cross-validation.
Predicted
351025>50
3220101
5122010
True10012111
25200220
>50020129
Table 4. Classification accuracy and standard deviation for classifying water hardness and Zn concentration (16 classes) for multiple classifiers with a five-fold cross-validation.
SoftMediumHard
3510253510255010035102550100
Soft30000700000100000
50800000000000000
100080000000000000
250007000000100000
Medium34000400000000000
50000080000000000
100000007100000000
250000000800000000
500000000080000000
1000000000008000000
Hard33000200000300000
50000000000080000
100010000000006100
250000000000100700
500000000000010070
1000000000000000017
Table 5. Gene ranking (top has higher importance) using three different ranking methods.
χ2RF RankingShapley Values
gstgstgst
vtg1ecrbecrb
vtg2vtg1vtg1
hsp60vtg2vtg2
jhemtce74
hsp90be74hsp90b
cathsp90bmtc
e74jhejhe
hsp90cathsp60
vasamtaecra
mtchsp60cat
ecrbcyp314usp
e75nruspvmo1
mtaecramta
vmo1dap1dap1
dap1vmo1cyp314
cyp314hsp90hsp90
ecramtbe75nr
uspe75nrftz-f1
ftz-f1ftz-f1mtb
hsp70hsp70hsp70
mtbvasavasa
Disclaimer/Publisher’s Note: The statements, opinions and data contained in all publications are solely those of the individual author(s) and contributor(s) and not of MDPI and/or the editor(s). MDPI and/or the editor(s) disclaim responsibility for any injury to people or property resulting from any ideas, methods, instructions or products referred to in the content.

