Landscape Dynamics and Ecological Risk Assessment of Cold Temperate Forest Moose Habitat in the Great Khingan Mountains, China
Abstract
Simple Summary
Abstract
1. Introduction
2. Materials and Methods
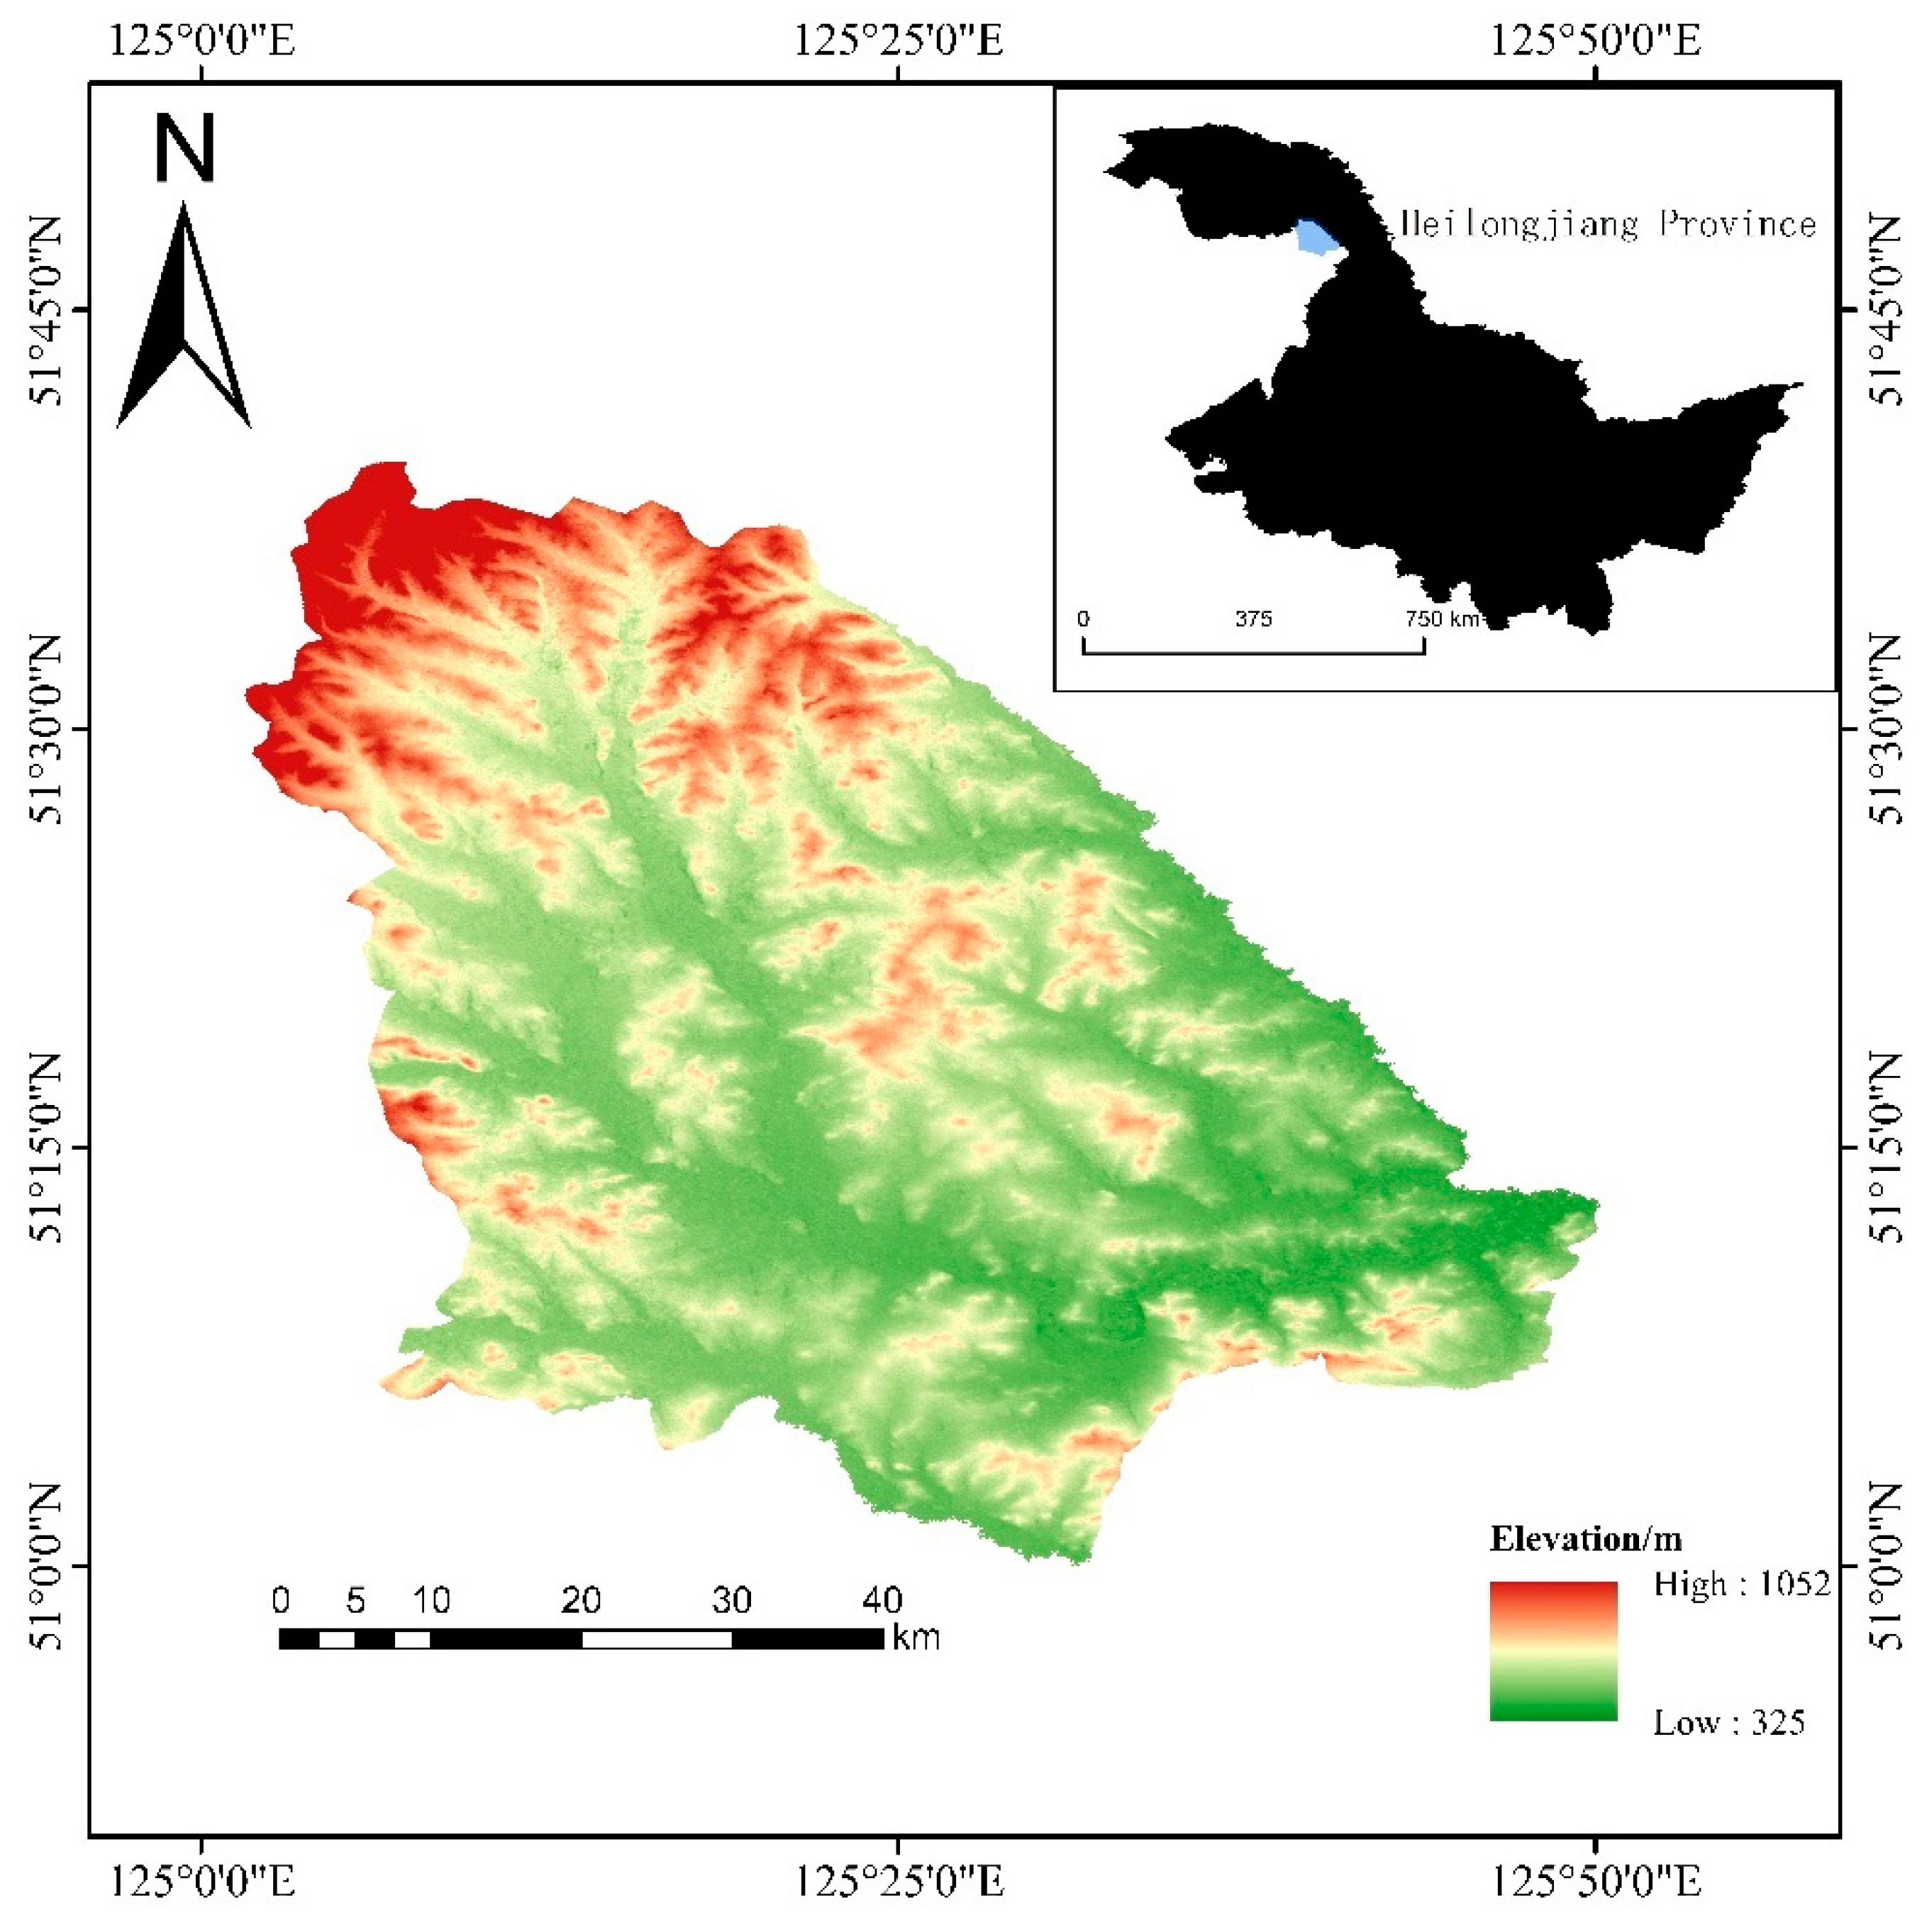
2.1. Study Area
2.2. Sample Line Data Acquisition
2.3. Infrared Camera Data Acquisition
2.4. Environmental Data Acquisition
2.5. Species Distribution Models Building
2.6. Analysis of Landscape Pattern of Habitat
2.7. Ecological Risk Assessment of Habitat Landscape
3. Results
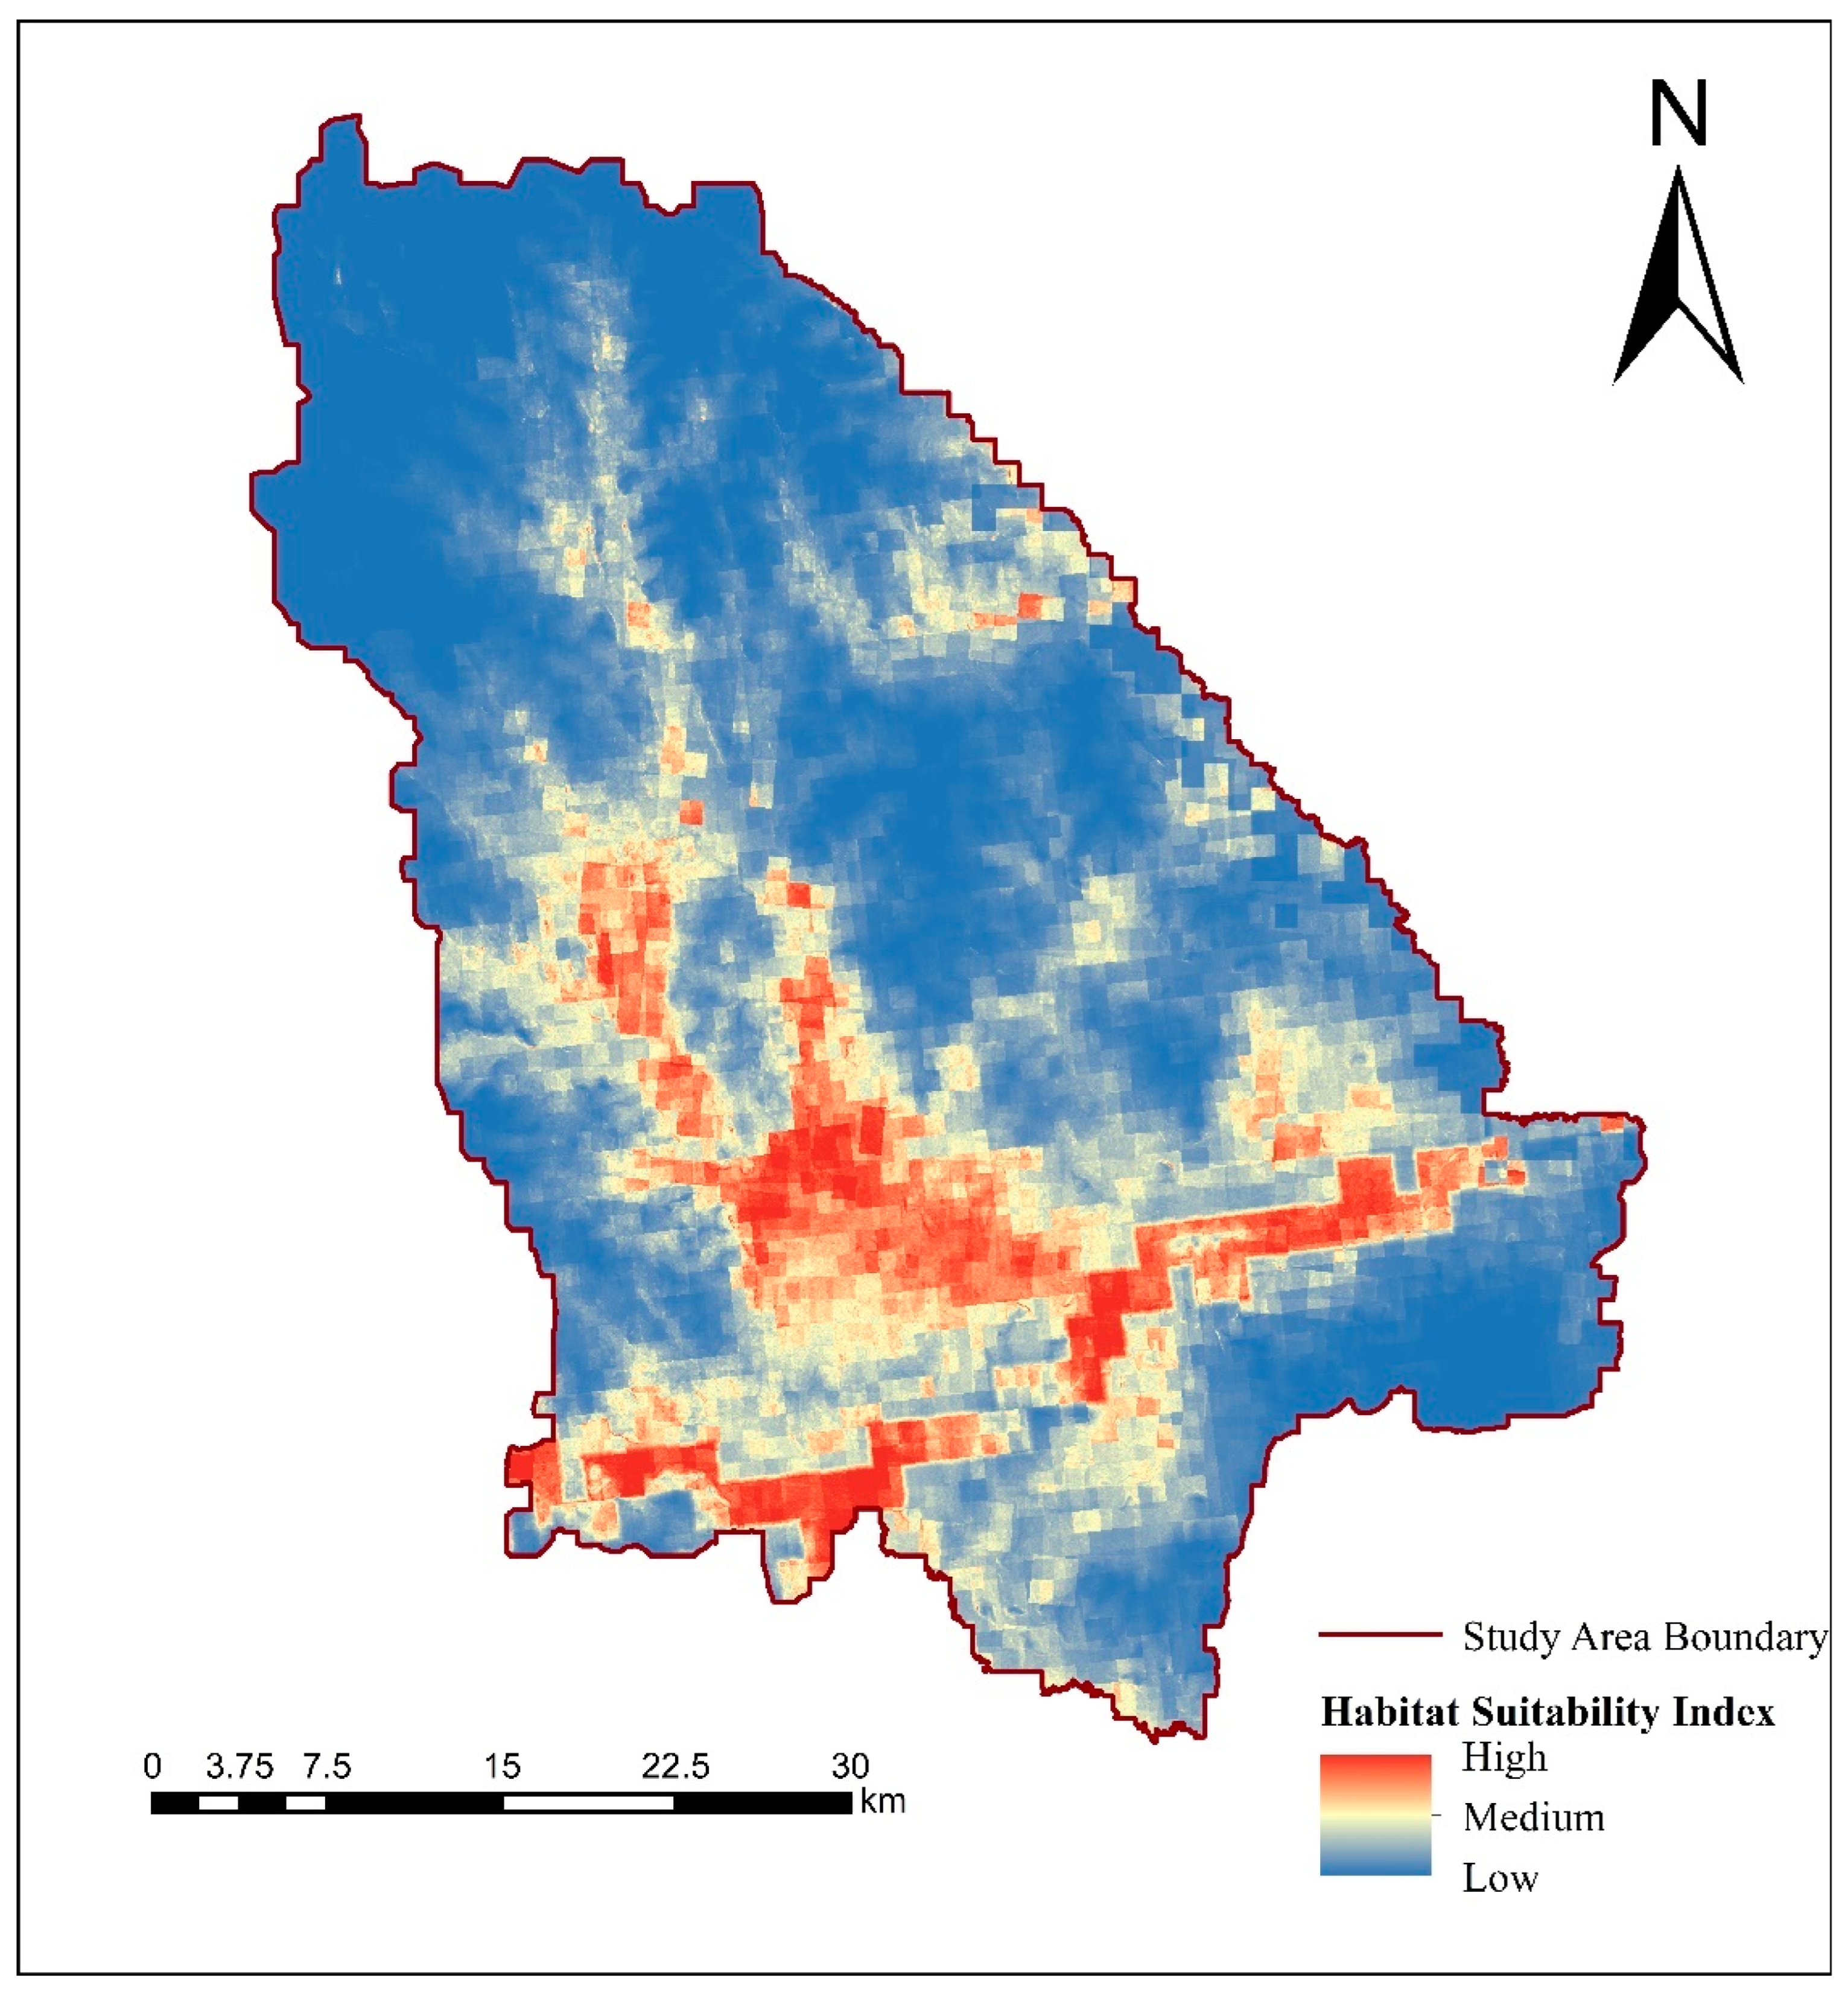
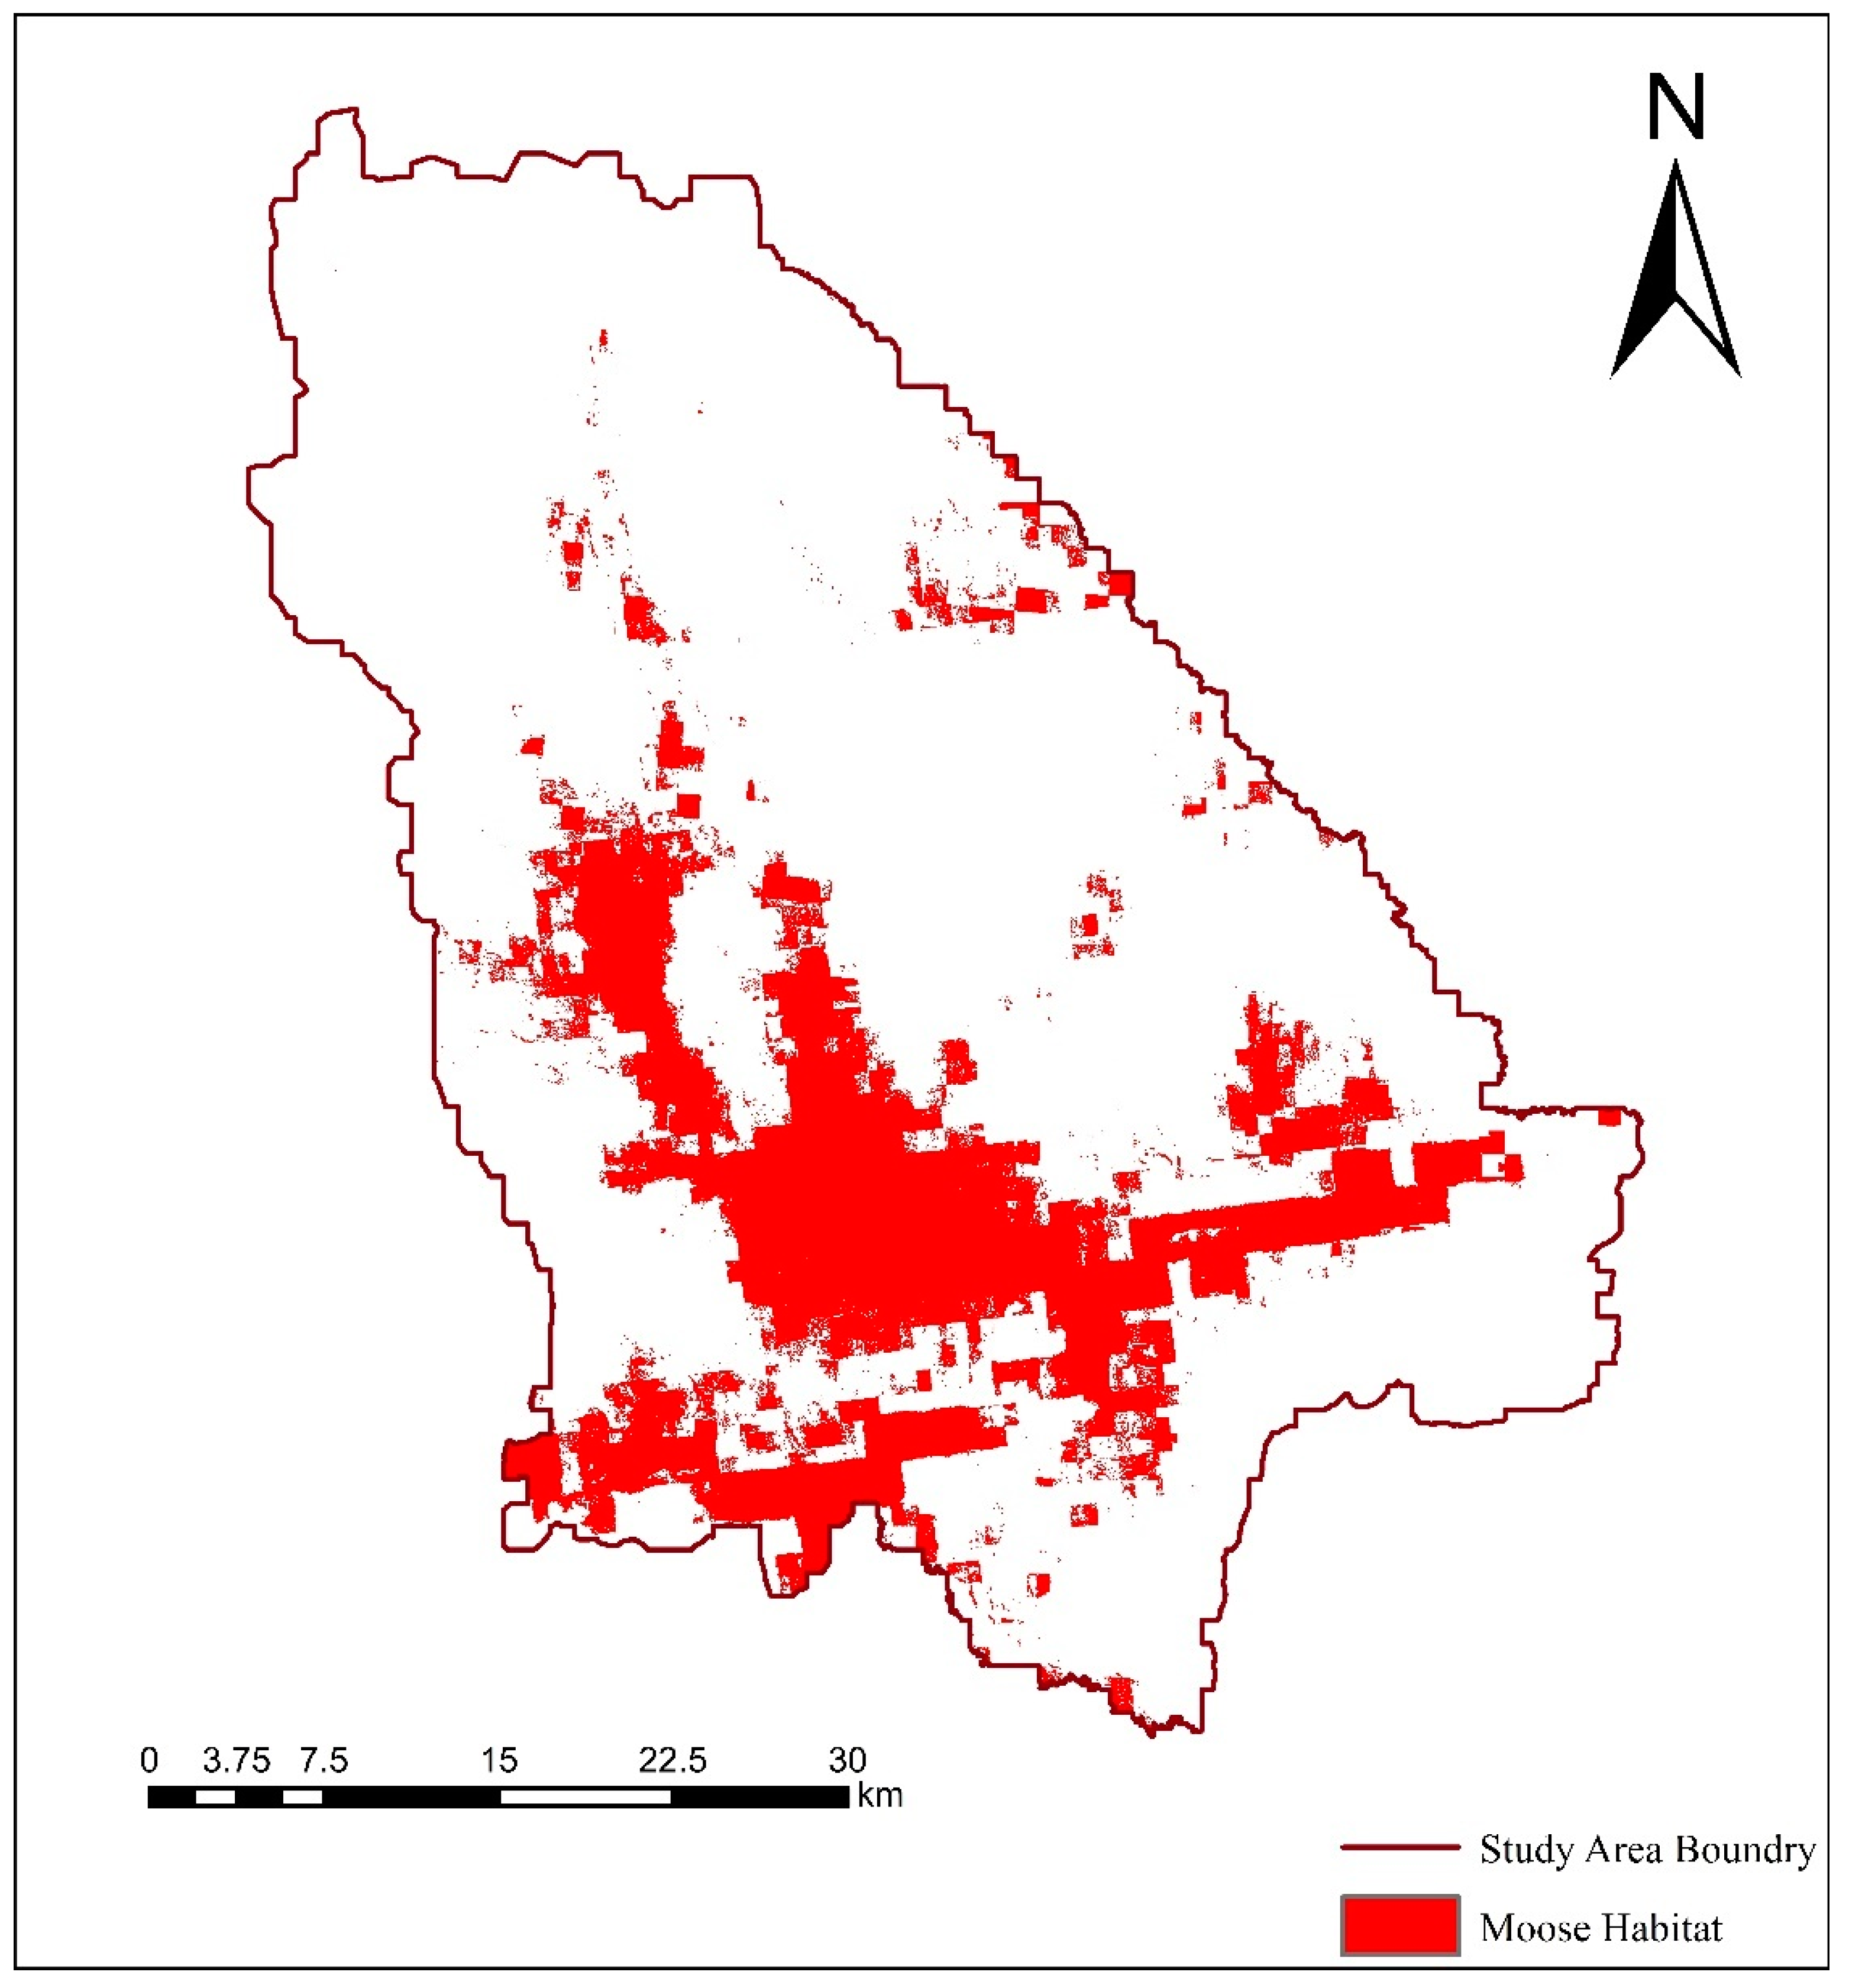
3.1. Habitat Suitability of Moose
3.2. Landscape Dynamics of Moose Habitat
3.2.1. Patch Scale Characteristics
3.2.2. Landscape Scale Characteristics
3.3. Ecological Risk of Habitat Landscape
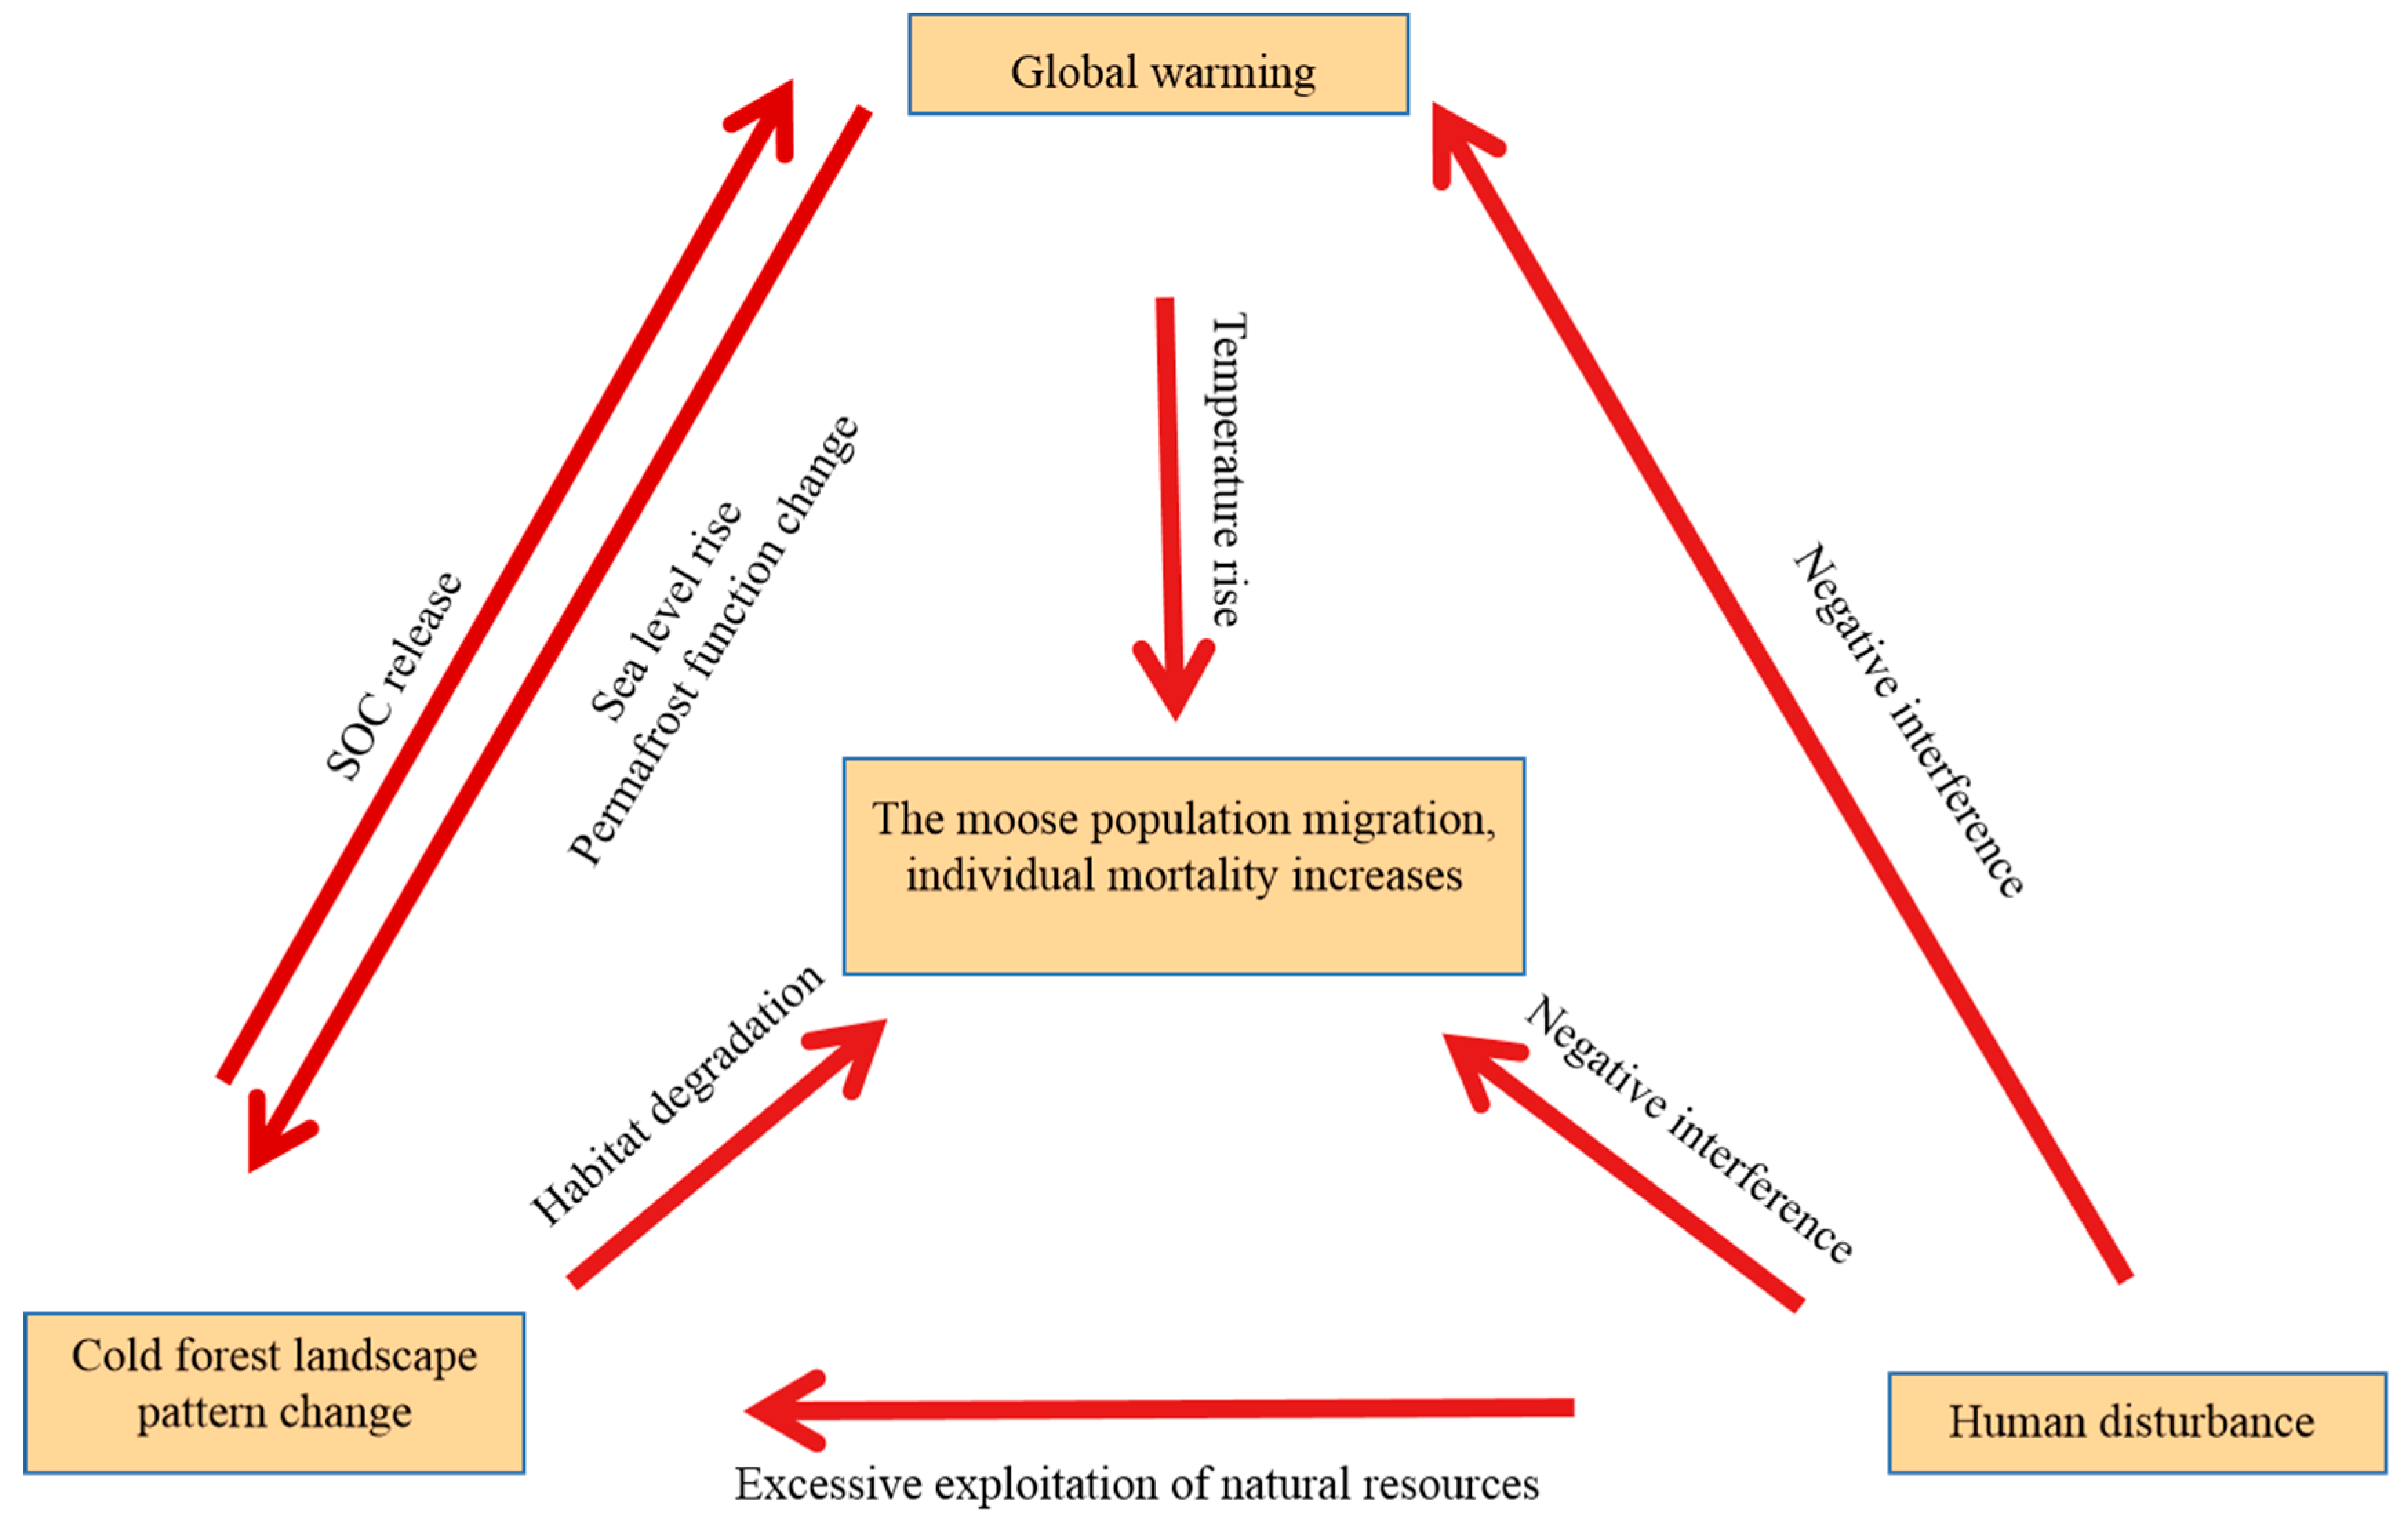
4. Discussion
5. Conclusions
Supplementary Materials
Author Contributions
Funding
Institutional Review Board Statement
Informed Consent Statement
Data Availability Statement
Acknowledgments
Conflicts of Interest
Appendix A. Initial Environmental Variables Used to Model the Range of Moose
| Variable | Description | Data Source |
| Bio3 | Isothermality/°C | WorldClim-Global Climate Data (https://chelsa-climate.org) (accessed on 30 October 2022) |
| Bio4 | Temperature seasonality/°C | WorldClim-Global Climate Data (https://chelsa-climate.org) (accessed on 30 October 2022) |
| Bio5 | Mean daily maximum air temperature of the warmest month/°C | WorldClim-Global Climate Data (https://chelsa-climate.org) (accessed on 30 October 2022) |
| Bio6 | Mean daily minimum air temperature of the coldest month/°C | WorldClim-Global Climate Data (https://chelsa-climate.org) (accessed on 30 October 2022) |
| Bio7 | Annual range of air temperature/°C | WorldClim-Global Climate Data (https://chelsa-climate.org) (accessed on 30 October 2022) |
| Bio8 | Mean daily mean air temperatures of the wettest quarter/°C | WorldClim-Global Climate Data (https://chelsa-climate.org) (accessed on 30 October 2022) |
| Bio9 | Mean daily mean air temperatures of the driest quarter/°C | WorldClim-Global Climate Data (https://chelsa-climate.org) (accessed on 30 October 2022) |
| Bio10 | Mean daily mean air temperatures of the warmest quarter | WorldClim-Global Climate Data (https://chelsa-climate.org) (accessed on 30 October 2022) |
| Bio11 | Mean daily mean air temperatures of the coldest quarter/°C | WorldClim-Global Climate Data (https://chelsa-climate.org) (accessed on 30 October 2022) |
| Bio12 | Annual precipitation amount/kg m−2 | WorldClim-Global Climate Data (https://chelsa-climate.org) (accessed on 30 October 2022) |
| Bio13 | Precipitation amount of the wettest month/kg m−2 | WorldClim-Global Climate Data (https://chelsa-climate.org) (accessed on 30 October 2022) |
| Bio14 | Precipitation amount of the driest month/kg m−2 | WorldClim-Global Climate Data (https://chelsa-climate.org) (accessed on 30 October 2022) |
| Bio15 | Precipitation seasonality/kg m−2 | WorldClim-Global Climate Data (https://chelsa-climate.org) (accessed on 30 October 2022) |
| Bio16 | Mean monthly precipitation amount of the wettest quarter/kg m−2 | WorldClim-Global Climate Data (https://chelsa-climate.org) (accessed on 30 October 2022) |
| Bio17 | Mean monthly precipitation amount of the driest quarter/kg m−2 | WorldClim-Global Climate Data (https://chelsa-climate.org) (accessed on 30 October 2022) |
| Bio18 | Mean monthly precipitation amount of the warmest quarter/kg m−2 | WorldClim-Global Climate Data (https://chelsa-climate.org) (accessed on 30 October 2022) |
| Bio19 | Mean monthly precipitation amount of the coldest quarter/kg m−2 | WorldClim-Global Climate Data (https://chelsa-climate.org) (accessed on 30 October 2022) |
| Dem | Elevation/m | https://www.gscloud.cn/ (accessed on 30 October 2022) |
| Sl | Slope/° | https://www.gscloud.cn/ (accessed on 30 October 2022) |
| Ndvi | Normalized difference vegetation index | https://www.gscloud.cn/ (accessed on 30 October 2022) |
| Highway | Distance to highway | https://www.webmap.cn/ (accessed on 30 October 2022) |
| Distw | Distance to water | https://www.webmap.cn/ (accessed on 30 October 2022) |
| LC | Land cover | https://www.resdc.cn/ (accessed on 30 October 2022) |
Appendix B. List of Landscape Indexes Used in This Study
| Indexes | Formula |
| Class area | represents the area of the patches of category landscape elements, and n is the number of patches. |
| Patch density | landscape. An is the total landscape area. |
| Landscape shape index | landscape. |
| Landscape shape index | landscape and represents the perimeter of the circle of the same area. |
| Mean fractal dimension | . |
| Patch cohesion index | . |
| Contagion index | of landscape type . |
| Split index | landscape. |
| Shannon’s diversity index | landscape to the total landscape area. |
| Shannon’s evenness index | |
| Aggregation index | refers to the number of adjacent patches in the adjacent landscape. |
References
- Malhi, Y.; Baldocchi, D.D.; Jarvis, P.G. The carbon balance of tropical, temperate and boreal forests. Plant Cell Environ. 1999, 22, 715–740. [Google Scholar] [CrossRef]
- Watson, R.T.; Noble, I.R.; Bolin, B.; Ravindranath, N.H.; Verardo, D.J.; Dokken, D.J. Land Use, Land-Use Change, and Forestry: A Special Report of the Intergovernmental Panel on Climate Change; Cambridge University Press: Cambridge, UK, 2000. [Google Scholar] [CrossRef]
- Zhang, M.H.; Ma, J.Z. A theoretical review of wildlife habitat fragmentation. Chin. J. Wlidlife 2014, 35, 6–14. (In Chinese) [Google Scholar]
- Wilson, M.C.; Chen, X.Y.; Corlett, R.T.; Didham, R.K.; Ding, P.; Holt, R.T.; Holyoak, M.; Hu, G.; Hughes, A.C.; Jiang, L.; et al. Habitat fragmentation and biodiversity conservation: Key findings and future challenges. Landsc. Ecol. 2016, 31, 219–227. [Google Scholar] [CrossRef]
- Xu, H.; Li, M.L.; Liang, H.B.; Li, Z.S.; Wu, X. Review of the evaluation index system for degraded forest ecosystems. Acta Ecol. Sin. 2018, 38, 9034–9042. (In Chinese) [Google Scholar]
- Dobson, A.P.; Bradshaw, A.D.; Baker, A.J.M. Hopes for the future: Restoration ecology and conservationi biology. Science 1997, 277, 515–522. [Google Scholar] [CrossRef]
- Fahrig, L.; Grez, A. Population spatial structure, human-caused landscape changes and species survial. Rev. Chil. De Hist. Nat. 1996, 69, 5–13. [Google Scholar]
- Barelli, C.; Albance, D.; Donati, C.; Pindo, M.; Dallago, C.; Rovero, F.; Cavalieri, D.; Tuohy, K.M.; Hauffe, H.C.; De Filippo, C. Habitat fragmentation is associated to gut microbiota diversity of an endangered primate: Implications for conservation. Sci. Rep. 2015, 5, 14862. [Google Scholar] [CrossRef]
- Chu, L.; Sun, T.C.; Wang, T.W.; Li, Z.; Cai, C. Evolution and prediction of landscape pattern and habitat quality based on CA-Markov and Invest model in Hubei section of Three Gorges Reservoir Area(TGRA). Sustainability 2018, 10, 3854. (In Chinese) [Google Scholar] [CrossRef]
- Steffens, T.S.; Lehman, S.M. Lemur species-specific metapopulation response to habitat loss and fragmentation. PLoS ONE 2018, 13, e0195791. [Google Scholar] [CrossRef]
- Chen, C.; Liu, Y.; Wang, T.; Shi, Y. Emerging issues and prospects for regional ecological risk assessment. Acta Ecol. Sin. 2010, 30, 808–816. (In Chinese) [Google Scholar]
- Xiao, R. Nitrogen Transformation and Transport Characteristics of Larix Gmelina Forest Ecosystem in Cold-Temperate Area of Daxingʹan Mountains; Northeast Forestry University: Harbin, China, 2022. (In Chinese) [Google Scholar]
- Schuur, E.; Abbott, B.; Koven, C.D.; Riley, W.J.; Subin, Z.M. High risk of permafrost thaw: Northern soils will release huge amounts of carbon in a warmer world. Nature 2011, 480, 32–33. [Google Scholar] [CrossRef] [PubMed]
- Wang, M.-Y.; Zhang, C.-J.; Mi, C.R.; Han, L.; Li, M.L.; Xu, W.X.; Yang, W.K. Potential impacts of climate change on suitable habitats. Chin. J. Appl. Ecol. 2021, 32, 3127–3135. (In Chinese) [Google Scholar]
- Zhi, X. The Population Status and Habitat Spatiotemporal Dynamics of Moose (Alces alces) in Northeast China; Northeast Forestry University: Harbin, China, 2023. (In Chinese) [Google Scholar]
- Meghan, A.; Mclellan, B.N.; Serrouya, R. Moose Response to High-Elevation Forestry: Implications for Apparent Competition with Endangered Caribou. Wildl. Manag. 2018, 82, 299–309. [Google Scholar] [CrossRef]
- Ao, X.; Zhou, L.; Wu, T.; Ren, M. Landscape dynamics and ecological risk of the expressway crossing section in the Hainan Rainforest National Park. Acta Ecol. Sin. 2022, 42, 6695–6703. (In Chinese) [Google Scholar]
- Janík, T.; Peters, W.; Šálek, M.; Romportl, D.; Jirků, M.; Engleder, T.; Ernst, M.; Neudert, J.; Heurich, M. The declining occurrence of moose (Alces alces) at the southernmost edge of its range raise conservation concerns. Ecol. Evol. 2021, 11, 5468–5483. [Google Scholar] [CrossRef]
- Zhou, S.; Zhang, M.; Sun, H.; Yin, y. Prey biomass of the Amur tiger (Panthera tigris altaica) in the eastern Wanda Mountains of Heilongjiang Province, China. Acta Ecol. Sin. 2011, 31, 145–153. (In Chinese) [Google Scholar]
- Xie, P.; Hu, J.; Li, T.; Guo, R.; Xu, L.; Song, X.; Li, J.; Xu, A. Distribution and activity patterns of wild boar (Sus scrofa) in the Qingliangfeng National Nature Reserve, Zhejiang Province. Acta Theriol. Sin. 2022, 42, 168–176. (In Chinese) [Google Scholar]
- Yu, Y.; Zhang, M.; Du, H.; Li, Q.; Zhang, L.; Mu, W. Optimized MAXENT Model in Simulating Distribution of Suitable Habitat of Moose. J. Northeast For. Univ. 2019, 47, 81–84+95. (In Chinese) [Google Scholar]
- Adriaensen, F.; Chardon, J.; De Blust, G.; Swinnen, E.; Villalba, S.; Gulinck, H.; Matthysen, E. The application of ‘least-cost’ modelling as a functional landscape model. Landsc. Urban Plan. 2003, 64, 233–247. [Google Scholar] [CrossRef]
- Guisan, A.; Tingley, R.; Baumgartner, J.B.; Naujokaitis-Lewis, I.; Sutcliffe, P.R.; Tulloch, A.I.; Regan, T.J.; Brotons, L.; McDonald-Madden, E.; Mantyka-Pringle, C.; et al. Predicting species distributions for conservation decisions. Ecol. Lett. 2013, 16, 1424–1435. [Google Scholar] [CrossRef]
- Teng, Y.; Zhang, Z.; Zhang, S.L.; Yang, Y.X.; He, W.; Wang, N.; Zhang, Z.; Bao, W. Habitat suitability analysis and ecological corridor designs for red deer (Cervus elaphus) in the southern Greater Khingan Mountains. Acta Ecol. Sin. 2022, 42, 5990–6000. (In Chinese) [Google Scholar]
- Lou, N.; Wang, Z.; He, S. Assessment on ecological risk of Aha Lake National Wetland Park based on landscape pattern. Res. Soil Water Conserv. 2020, 27, 233–239. (In Chinese) [Google Scholar]
- Tang, B.; Li, J.; Luo, J. Review on the Ecological Risk Assessment of Wetland. J. Anhui Agri. Sci 2009, 37, 6104–6107. (In Chinese) [Google Scholar]
- Yang, R.; Cao, Y.; Huo, S.; Peng, Q.Y.; Wang, X.S.; Wang, F.Y.; TzHsuan, T.; Yu, L.; Steve, C.; Lan, C.; et al. Cost-effective priorities for the expansion of global terrestrial protected areas: Setting post-2020 global and national targets. Sci. Adv. 2020, 6, eabc3436. [Google Scholar] [CrossRef] [PubMed]
- Malekmohammadi, B.; Rahimi, B.L. Ecological risk assessment of wetland ecosystems using multi criteria decision making and geographic information system. Ecol. Indic. 2014, 41, 133–144. [Google Scholar] [CrossRef]
- Gao, B.-P.; Li, C.; Wu, Y.M.; Zheng, K.J.; Wu, Y. Landscape ecological risk assessment and influencing factors in ecological conservation area in Sichuan-Yunnan provinces, China. Chin. J. Appl. Ecol. 2021, 32, 1603–1613. (In Chinese) [Google Scholar]
- Hasbrouck, T.R.; Brinkman, T.J.; Stout, G.; Trochim, E.; Kielland, K. Quantifying effects of environmental factors on moose harvest in Interior Alaska. Wildl. Biol. 2020, 2020, 1–8. [Google Scholar] [CrossRef]
- Lenarz, M.S.; Nelson, M.E.; Schrage, M.W.; Edwards, A.J. Temperature Mediated Moose Survival in Northeastern Minnesota. J. Wildl. Manag. 2009, 73, 503–510. [Google Scholar] [CrossRef]
- Wattles, D.W.; Zeller, K.A.; DeStefano, S. Range expansion in unfavorable environments through behavioral responses to microclimatic conditions: Moose (Alces americanus) as the model. Mamm. Biol. 2018, 93, 189–197. [Google Scholar] [CrossRef]
- Michaud, J.S.; Coops, N.C. Estimating moose (Alces alces) occurrence and abundance from remotely derived environmental indicators. Remote Sens. Environ. 2014, 152, 190–201. [Google Scholar] [CrossRef]
- Dussault, C.; Ouellet, J.P. Behavioral responses of moose to thermal conditions in the boreal forest. Ecoscience 2004, 11, 321–328. [Google Scholar] [CrossRef]
- Oehlers, S.A.; Bowyer, R.T. Sex and scale: Implications for habitat selection by Alaskan moose Alces alces gigas. Wildl. Biol. 2011, 17, 67–84. [Google Scholar] [CrossRef] [PubMed]
- Seaton, C.T.; Paragi, T.F. Browse biomass removal and nutritional condition of moose Alces Alces. Wildl. Biol. 2011, 17, 55–66. [Google Scholar] [CrossRef] [PubMed]
- Raisa, T.; Erling, J.S.; Tuire, N.; Jyrki, P. Spatio-temporal relationship between calf body mass and population productivity in Fennoscandian moose Alces alces. Wildl. Biol. 2012, 18, 304–317. [Google Scholar] [CrossRef]
- Fiona, S. Presence of moose (Alces alces) in Southeastern Germany. Eur. J. Wildl. Res. 2009, 55, 449–453. [Google Scholar] [CrossRef]
- Jyoti, S.; Hebblewhite, M.; Mahoney, P.; Gilbert, S.; Meddens, A.J.H.; Boelman, N.T.; Joly, K.; Jones, K.; Kellie, K.A.; Brainerd, S.; et al. Behavioral modifications by a large-northern herbivore to mitigate warming conditions. Mov. Ecol. 2020, 8, 39. [Google Scholar] [CrossRef]
- Root, T.L.; Price, J.T.; Hall, K.R.; Schneider, S.H.; Rosenzweig, C.; Pounds, J.A. Fingerprints of global warming on wild animals and plants. Nature 2003, 421, 57–60. [Google Scholar] [CrossRef]
- McCain, C.M.; King, S.R.B. Body size and activity times mediate mammalian responses to climate change. Glob. Chang. Biol. 2014, 20, 1760–1769. [Google Scholar] [CrossRef]
- Cai, Z.; Nie, H. Ecological Risk Management for Wetlands. Wetl. Sci. Manag. 2007, 3, 50–53. (In Chinese) [Google Scholar]
- Zhao, Z.N.; Zhang, T.Z. Integration of ecosystem services into ecological risk assessment for implementation in case study of the Yellow River, China. Hum. Ecol. Risk Assess. Int. J. 2013, 19, 80–97. (In Chinese) [Google Scholar] [CrossRef]
- Fan, J.H.; Wang, Y.; Zhou, Z.; You, N.S.; Meng, J. Dynamic ecological risk assessment and management of land use in the middle reaches of the Heihe River based on landscape patterns and spatial statistics. Sustainability 2016, 8, 536. (In Chinese) [Google Scholar] [CrossRef]
- Wan, H.; Wang, S.; Chen, B.; Xia, C.; Sui, R. Ecological risk assessment and spatial threshold analysis of wetlands in the Sanjiang Plain. Acta Ecol. Sin. 2022, 42, 6595–6606. (In Chinese) [Google Scholar]
- Chen, Z.; Jin, Y.; Sun, J.; Shao, X.Q.; Wang, Y.D.; Zhao, X.Q.; Wang, W.; Xie, H.; Zhang, Z.; Zhang, L.; et al. A Review on the Impact of Global Warming to Greenhouse Gas Flux in Frozen Ground Region. Acta Agrestia Sin. 2023, 31, 929–942. (In Chinese) [Google Scholar]
- Liu, X. The Research of Soil Respiration Rate and Its Impact Factors of Forestry and Swamp in Cool Temperate Zone Permafrost Regions; Northeast Forestry University: Harbin, China, 2015. (In Chinese) [Google Scholar]
- Wang, Z.M.; Song, K.S.; Ma, W.H.; Ren, C.Y.; Zhang, B.; Liu, D.W.; Chen, J.M.; Song, C. Loss and fragmentation of marshes in the Sanjiang Plain, northeast China, 1954–2005. Wetlands 2011, 31, 945–954. (In Chinese) [Google Scholar] [CrossRef]
- Yang, C.; Zheng, H.; Ouyang, Z. Changes, Effect and Driving Forces of Land Use in Sanjiang Plain. Environ. Prot. Sci. 2020, 46, 99–104. (In Chinese) [Google Scholar]


| Variable | Description | Data Source |
|---|---|---|
| Bio3 | Isothermality/°C | WorldClim-Global Climate Data (https://chelsa-climate.org) (accessed on 30 October 2022) |
| Bio9 | Mean daily mean air temperatures of the driest quarter/°C | WorldClim-Global Climate Data (https://chelsa-climate.org) (accessed on 30 October 2022) |
| Bio11 | Mean daily mean air temperatures of the coldest quarter/°C | WorldClim-Global Climate Data (https://chelsa-climate.org) (accessed on 30 October 2022) |
| Bio14 | Precipitation amount of the driest month/kg m−2 | WorldClim-Global Climate Data (https://chelsa-climate.org) (accessed on 30 October 2022) |
| Bio15 | Precipitation seasonality/kg m−2 | WorldClim-Global Climate Data (https://chelsa-climate.org) (accessed on 30 October 2022) |
| Bio17 | Mean monthly precipitation amount of the driest quarter/kg m−2 | WorldClim-Global Climate Data (https://chelsa-climate.org) (accessed on 30 October 2022) |
| Dem | Elevation/m | https://www.gscloud.cn/ (accessed on 30 October 2022) |
| Sl | Slope/° | https://www.gscloud.cn/ (accessed on 30 October 2022) |
| Ndvi | Normalized difference vegetation index | https://www.gscloud.cn/ (accessed on 30 October 2022) |
| Highway | Distance to highway | https://www.webmap.cn/ (accessed on 30 October 2022) |
| Distw | Distance to water | https://www.webmap.cn/ (accessed on 30 October 2022) |
| LC | Land cover | https://www.resdc.cn/ (accessed on 30 October 2022) |
| First Level of Land Use | Second Level of Land Use | Year | CA | PD | LPI | LSI | FRAC_MN | COHESION |
|---|---|---|---|---|---|---|---|---|
| Arable land | Dry land | 2015 | 5196.6 | 0.8394 | 1.1106 | 17.8295 | 1.0526 | 96.3978 |
| 2020 | 5759.19 | 0.8369 | 1.4646 | 18.9881 | 1.0516 | 97.1821 | ||
| Forest | Closed forest land (CF Land) | 2015 | 12,057.57 | 2.7739 | 3.1891 | 33.6194 | 1.0486 | 97.7904 |
| 2020 | 11,833.2 | 2.7595 | 2.743 | 34.4656 | 1.0505 | 97.4829 | ||
| Shrubs | 2015 | 327.78 | 0.0837 | 0.2219 | 5.2893 | 1.057 | 94.5468 | |
| 2020 | 618.66 | 0.0617 | 0.2218 | 4.8675 | 1.0389 | 95.9629 | ||
| Sparse woodland (SW Land) | 2015 | 7268.22 | 0.8372 | 7.7344 | 15.3779 | 1.0498 | 98.8462 | |
| 2020 | 8427.33 | 0.8215 | 8.0917 | 16.1256 | 1.0476 | 99.0149 | ||
| Grassland | High coverage grassland (HighCG Land) | 2015 | 20,134.89 | 2.7056 | 19.6771 | 30.7685 | 1.05 | 99.2258 |
| 2020 | 18,451.8 | 2.667 | 16.5345 | 28.7903 | 1.0514 | 99.0047 | ||
| Medium coverage grassland (MediumCG Land) | 2015 | 0.54 | 0.0022 | 0.0012 | 1.4 | 1.0831 | 59.2586 | |
| 2020 | 0 | 0 | 0 | 0 | 0 | |||
| Unused land | Swamp | 2015 | 402.03 | 0.1432 | 0.4073 | 10.8806 | 1.0523 | 96.4141 |
| 2020 | 316.17 | 0.0749 | 0.1304 | 8.7647 | 1.0836 | 93.6593 |
| Year | CONTAG | SPLIT | AI | SHDI | SHEI |
|---|---|---|---|---|---|
| 2015 | 63.1966 | 18.0312 | 93.0191 | 1.3318 | 0.6844 |
| 2020 | 58.6675 | 22.8945 | 93.0996 | 1.384 | 0.7724 |
| Year | Low ERI | Medium ERI | High ERI |
|---|---|---|---|
| 2015 | 40.86 | 46.85 | 12.29 |
| 2020 | 41.74 | 45.74 | 12.52 |
Disclaimer/Publisher’s Note: The statements, opinions and data contained in all publications are solely those of the individual author(s) and contributor(s) and not of MDPI and/or the editor(s). MDPI and/or the editor(s) disclaim responsibility for any injury to people or property resulting from any ideas, methods, instructions or products referred to in the content. |
© 2023 by the authors. Licensee MDPI, Basel, Switzerland. This article is an open access article distributed under the terms and conditions of the Creative Commons Attribution (CC BY) license (https://creativecommons.org/licenses/by/4.0/).
Share and Cite
Sun, S.; Hong, Y.; Guo, J.; Zhang, N.; Zhang, M. Landscape Dynamics and Ecological Risk Assessment of Cold Temperate Forest Moose Habitat in the Great Khingan Mountains, China. Biology 2023, 12, 1122. https://doi.org/10.3390/biology12081122
Sun S, Hong Y, Guo J, Zhang N, Zhang M. Landscape Dynamics and Ecological Risk Assessment of Cold Temperate Forest Moose Habitat in the Great Khingan Mountains, China. Biology. 2023; 12(8):1122. https://doi.org/10.3390/biology12081122
Chicago/Turabian StyleSun, Shiquan, Yang Hong, Jinhao Guo, Ning Zhang, and Minghai Zhang. 2023. "Landscape Dynamics and Ecological Risk Assessment of Cold Temperate Forest Moose Habitat in the Great Khingan Mountains, China" Biology 12, no. 8: 1122. https://doi.org/10.3390/biology12081122
APA StyleSun, S., Hong, Y., Guo, J., Zhang, N., & Zhang, M. (2023). Landscape Dynamics and Ecological Risk Assessment of Cold Temperate Forest Moose Habitat in the Great Khingan Mountains, China. Biology, 12(8), 1122. https://doi.org/10.3390/biology12081122


