Simple Summary
Climate change will cause a reduction in the provision of goods and services of Mediterranean forests, including those of stone pine (Pinus pinea), an economically important species. We used a dendrochronological approach to address climate impact on the growth of stone pine natural stands and plantations. Our results indicate that increasingly arid conditions will affect both natural stands and plantations in native and exotic countries. Adaptive management will be essential to ensure the maintenance of the stands and their multifunctionality.
Abstract
Pinus pinea is an important Mediterranean species due to its adaptability and tolerance to aridity and its high-quality pine nuts. Different forest types located in Mediterranean native and non-native environments provide the opportunity to perform comparative studies on the species’ response to climate change. The aims of this study were to elucidate growth patterns of the species growing in native and exotic habitats and to analyze its response to climatic fluctuations, particularly drought, in both geographical contexts. Understanding stone pine (Pinus pinea) growth responses to climate variability in native and exotic habitats by comparing natural stands and plantations may provide useful information to plan adequate management under climate change. By doing so, we enhance the understanding of P. pinea’s adaptability and provide practical approaches to its sustainable management. In this study, we reconstructed and compared the stem radial growth of seven stone pine stands, two in southern Spain and five in central–southern Chile, growing under different climatic conditions. We quantified the relationships between growth variability and climate variables (total rainfall, mean temperature, and SPEI drought index). Growth was positively correlated with autumn rainfall in plantations and with autumn–winter rainfall in natural stands. Growth was also enhanced by high autumn-to-spring rainfall in the driest Chilean plantation, whereas in the wettest and coolest plantation, such correlation was found in winter and summer. A negative impact of summer temperature was found only in one of the five Chilean plantations and in a Spanish site. The correlation between SPEI and tree-ring width indices showed different patterns between and within countries. Overall, exotic plantations showed lower sensitivity to climate variability than native stands. Therefore, stone pine plantations may be useful to assist in mitigating climate change.
1. Introduction
Forest plantations are crucial for maintaining the global terrestrial biomass, accounting for approximately half of it. These forests are subjected to climate change impacts, which are becoming increasingly complex and characterized by compound risks across regions [1,2]. Climatic stress negatively affects tree growth and survival [3,4,5] due to severe hydric deficits and increasing temperatures, as reported for economically important temperate conifers [6]. Unfortunately, forests in Mediterranean areas are particularly subjected to adverse weather events, including droughts [7]. That is the case of Pinus pinea L., commonly known as stone pine [8,9], an important Mediterranean species due to its adaptability and tolerance to aridity [10,11] and its high-quality pine nuts of commercial importance [12,13].
A better understanding of the impact of drought stress on P. pinea is necessary to inform adaptive forest management practices in a climate change scenario that will severely affect the provision of its goods and services [14]. The species has attracted substantial attention in dendrochronological studies in native countries [8,15], including Spain [16] where over 60% of the species’ forests are concentrated [17] and circa 500,000 hectares of plantations have been established [18]. However, despite the species’ increasing relevance in non-native countries, there is a notable disparity in research regarding its performance outside its native range. In particular, in central–southern Chile, the willingness for reforestation and the commercial potential of stone pine have led to the establishment of extensive plantations (5000 hectares since 2014); some of them are currently starting to produce cones. These plantations provide the opportunity to perform comparative studies on the dynamics of P. pinea growth and response to environmental conditions between Mediterranean native and non-native environments, characterized by unique ecological and climatic conditions, which directly influence the species’ growth dynamics [3,19].
In this study, a dendrochronology analysis was performed by comparing natural and planted forests in south Spain and planted forests in central–southern Chile. The aims of the study were to elucidate whether the growth patterns of the species differ between native and exotic habitats, discerning determinant environmental factors in both geographical contexts. By exploring these topics, we seek to not only enhance our understanding of P. pinea’s adaptability but also provide practical approaches to the sustainable management of stone pine. Thus, given the increasing global demand for pine nuts [20] and the urge for the ecological conservation of P. pinea stands, this study can be useful in informing forest management strategies, facilitating the optimization of plantation practices, and contributing to the broader discussion on sustainable forestry in areas with a Mediterranean climate. We hypothesize that growth patterns of P. pinea plantations in Chile differ significantly from those in Spain due to variations in environmental conditions and management practices, with Chilean plantations potentially exhibiting faster growth rates due to more favorable growing conditions.
2. Materials and Methods
2.1. Study Sites
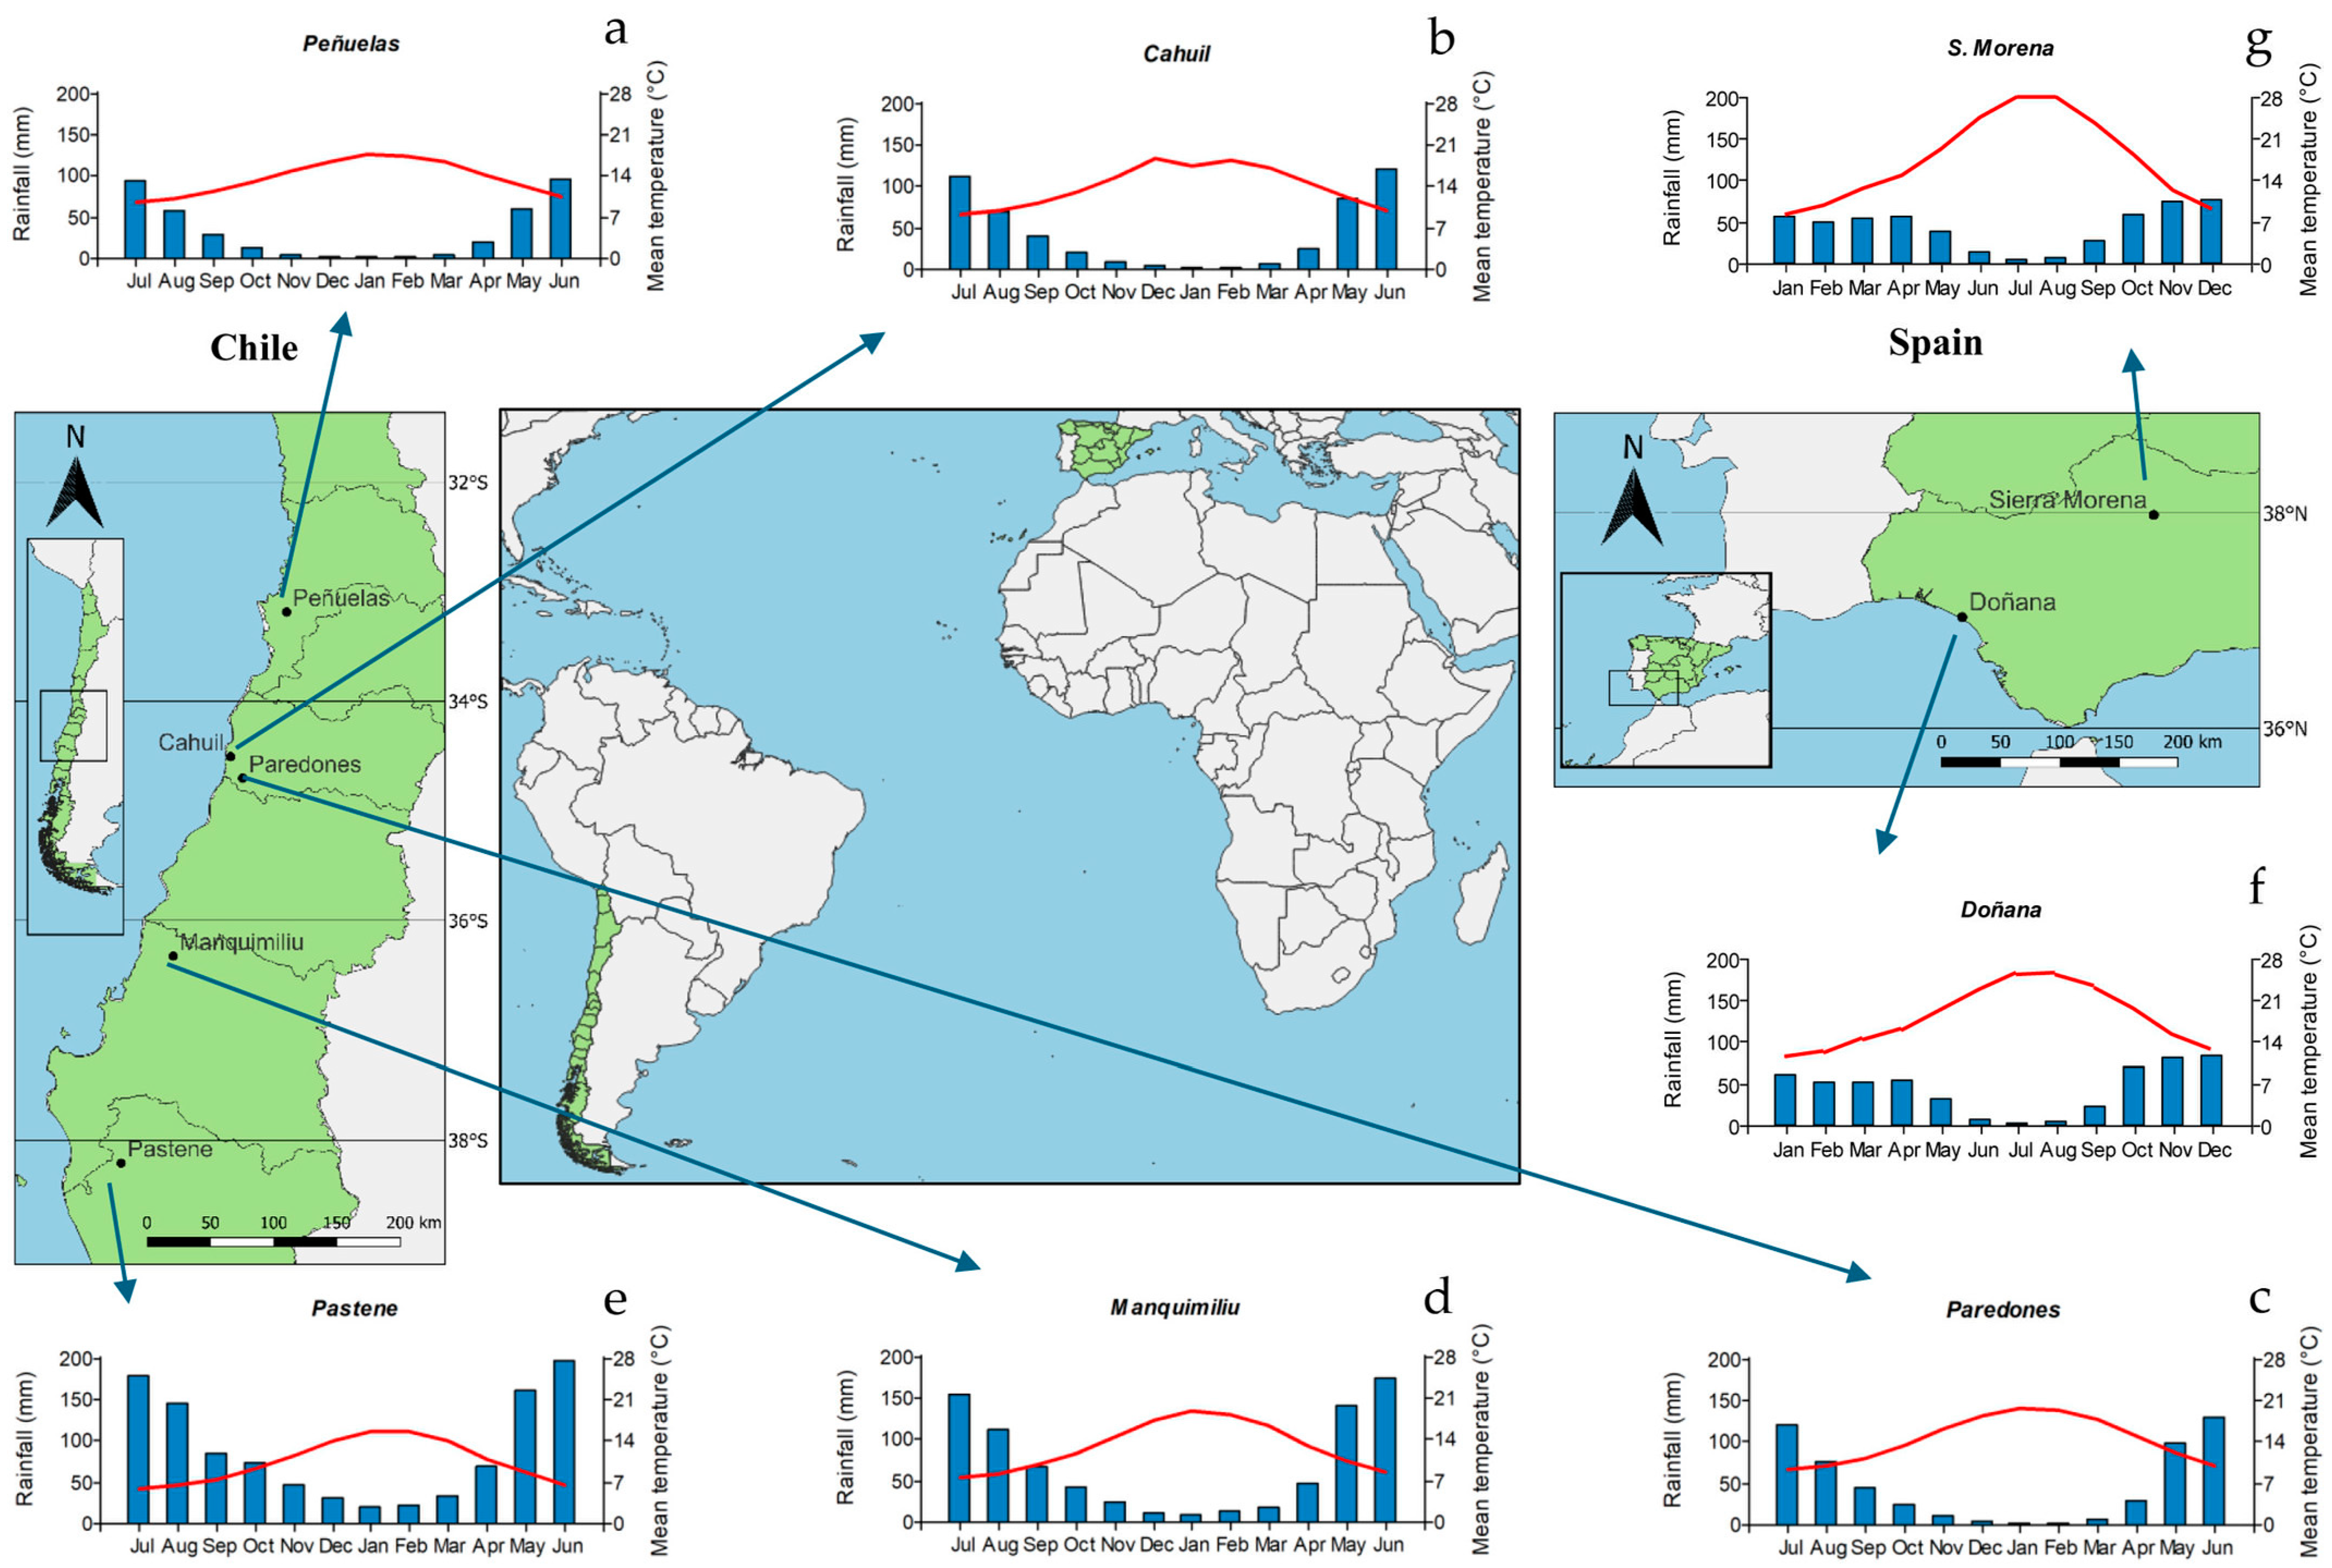
The study sites included in this research are located in south Spain and central–southern Chile. In Spain, one plantation (Parque Nacional de Doñana, SP1) and one natural stand (Sierra Morena, SP2) were selected. Stand spacing was 7 × 8 m (180 trees ha−1) and 6 × 6.5 m (280 trees ha−1), respectively. In Chile, five plantations (Peñuelas, CH1; Cahuil, CH2; Paredones CH3; Manquimiliu CH4; and Pastene, CH5) located from the Valparaíso to Araucania regions were selected; plantation spacing ranged from 3.5 × 3.5 m (833 trees ha−1) to 5 × 5 m (400 trees ha−1). Detailed information about stands, soil, and climate are presented in Table 1. The location of the plantations/stands and 10-year average climatic variables are presented in Figure 1. Climatic data were obtained from the Climate Research Unit dataset (CRU TS 4.03 [21]) and downloaded from the Climate Explorer webpage (http://climexp.knmi.nl/, accessed on 10 November 2024).

Table 1.
Site characteristics of the Pinus pinea stands sampled in Chile and Spain. Abbreviations: forest type: N, natural; P, planted.

Figure 1.
Site distribution showing the location of Pinus pinea stands and climate diagrams showing mean monthly temperature (red lines) and total monthly rainfall (blue bars) in Spain and Chile (both countries are shown in green). Abbreviations of sites (plantations): (a) CH1, Peñuelas (Chile); (b) CH2, Cahuil (Chile); (c) CH3, Paredones (Chile); (d) CH4, Manquimiliu (Chile); (e) CH5, Pastene (Chile); (f) SP1, Doñana (Spain); (g) SP2, Sierra Morena (Spain).
2.2. Dendrochronological Study
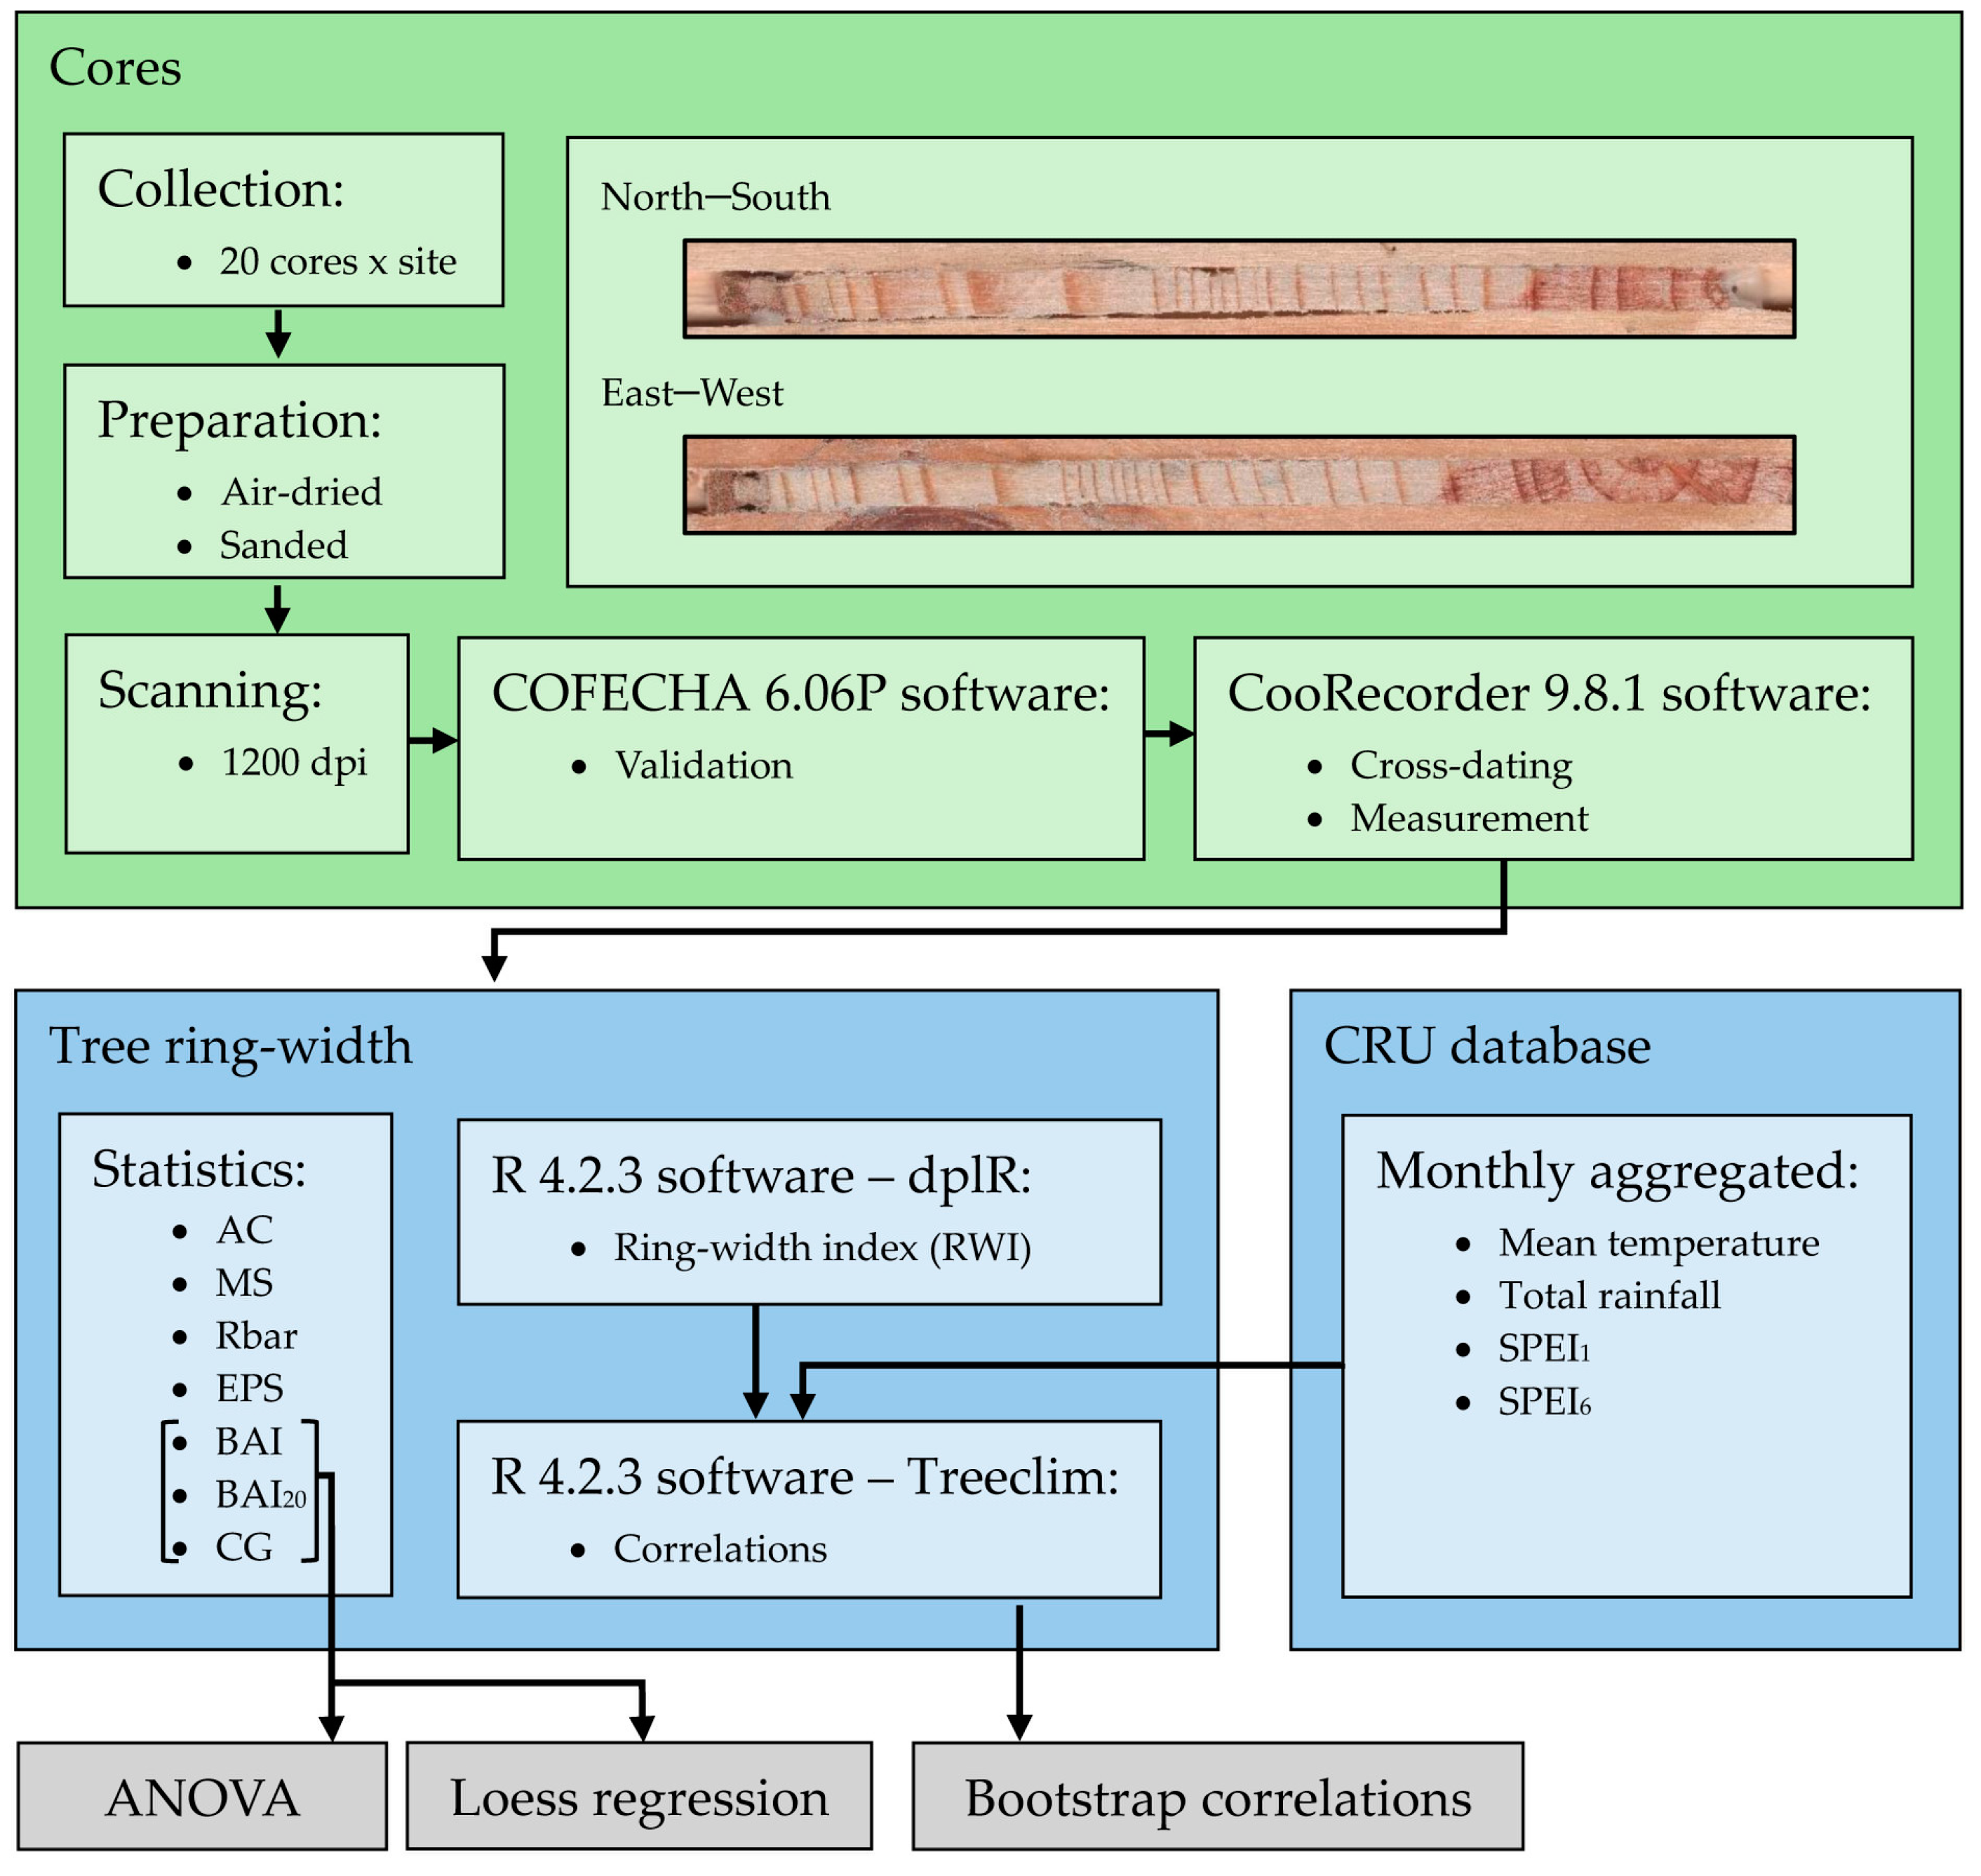
Two cores were collected at 1.3 m from 20 individuals in each site using Pressler increment borers. Cores were air-dried and sanded with sandpaper of increasing grain until ring boundaries were conspicuous. Then, they were visually cross-dated under the binocular scope and scanned at 1200 dpi (Epson Expression 10000XL). Tree-ring widths were measured with a 0.001 mm resolution along two radii per sample using the CooRecorder software version 9.8.1 [22]. Visual cross-dating was checked using the COFECHA software version 6.06P, which calculates moving correlations between individual tree-ring width series and the mean series of each site [23]. For Chilean plots, calendar dates were assigned to rings, following the Southern Hemisphere convention that assigns an annual ring to the calendar year in which the ring formation starts [24].
To calculate the individual tree diameter growth curves, the annual ring widths measured on two cores were averaged and summed for every tree from pith to bark. Then, a mean diameter curve was calculated for the seven sites and a sigmoidal function was fitted to characterize the relationship between tree age and DBH [25,26] as follows:
where a, b, and c are constants, and age is the tree’s age at 1.3 m estimated by counting the number of rings from bark to pith.
Hereafter, tree-ring width data were transformed into basal area increment (BAI) which is biologically more meaningful to quantify growth variations between years and treatments, using the following formula:
where R corresponds to the tree radii and t is the year of tree-ring formation.
BAI = π (R2 t − R2 t − 1)
To analyze the BAI performance between forest types and countries, we used the Loess Regression, a non-parametric method commonly used to smoothen time series; in the graphical result, the shaded areas represent the higher and lower limits for the mean value of each forest type corresponding to each country [27]. Residual chronologies of the tree-ring width and tree-ring width index (RWI), were additionally computed (once the influence of long-term biological trends on radial growth was discarded due to increasing tree size and age by applying a detrending of the tree-ring series by fitting spline curves to each series, aided by the dplR [28] package in R software version 4.2.3 [29]). The resulting residual or pre-whitened individual series were averaged using a bi-weight robust mean to obtain the mean residual series of RWI for each site [30].
Several statistics were calculated for the best-replicated 1997–2022 period. This period was defined based on Expressed Population Signal (EPS) values and considering the period with EPS ≥ 0.85 as well replicated [5,31]. We calculated mean and standard tree-ring width values; the mean first-order autocorrelation of tree-ring widths (AC), which accounts for year-to-year persistence in growth; mean sensitivity (MS), which measures relative changes in growth indices between consecutive years; and mean correlation between series (Rbar), which is a measure of the coherence of the site chronology [32]. We also calculated mean basal area increment (BAI), mean basal area increment in the last 20 years (BAI20), and cumulative radial growth (CG). Lastly, an analysis of variance (ANOVA) was used to compare log (x + 1)- transformed data of BAI, BAI20, and CG. Three factors were considered in these comparisons: country, forest type (natural vs. planted stand), and site.
2.3. Climate Data and Drought Indices
We used monthly 0.5°-gridded data from the Climate Research Unit dataset (CRU TS 4.03 [21]), which were collected from the Climate Research Unit Time-Series version 4.07 (CRU TS) climate dataset (https://crudata.uea.ac.uk/cru/data/hrg/cru_ts_4.07/cruts.2304141047.v4.07/, accessed on 10 November 2023). The monthly CRU climate data (mean temperature and total rainfall) were complemented and compared with rainfall data from the “Climate Hazards Group Infrared Precipitation with Stations” dataset [33]. We acknowledge that using local climate series may render more specific results regarding climate–growth relationships; however, the available local series were not comparable given their different lengths and data gaps. We used the 0.5°-gridded Standardized Precipitation Evapotranspiration Index (SPEI) downloaded from https://monitordesequia.csic.es/, (accessed on 10 November 2023) at scales of 1 (SPEI1) and 6 (SPEI6) months to characterize drought severity [34]. The SPEI is computed as a cumulative climatic water balance calculated at several temporal scales. Mean RWI series or chronologies were related to monthly climate data (mean temperature and total rainfall) and drought indices (SPEI1 and SPEI6) using the Treeclim R package [35] and reported as bootstrap correlation coefficients [36]. A summary of the methodological workflow is presented in Figure 2.
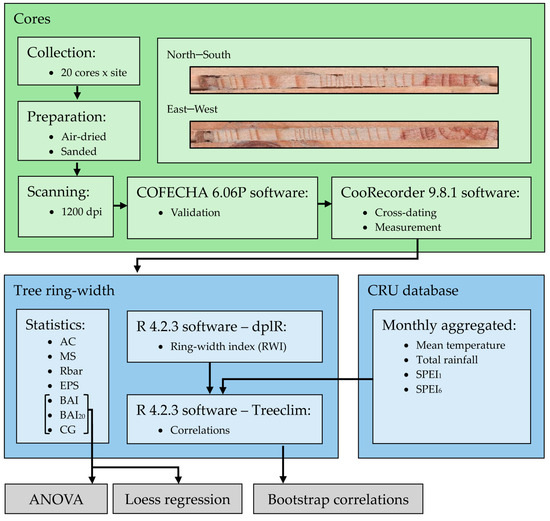
Figure 2.
Methodological workflow representation.
3. Results
3.1. Dendrochronological Statistics and Growth
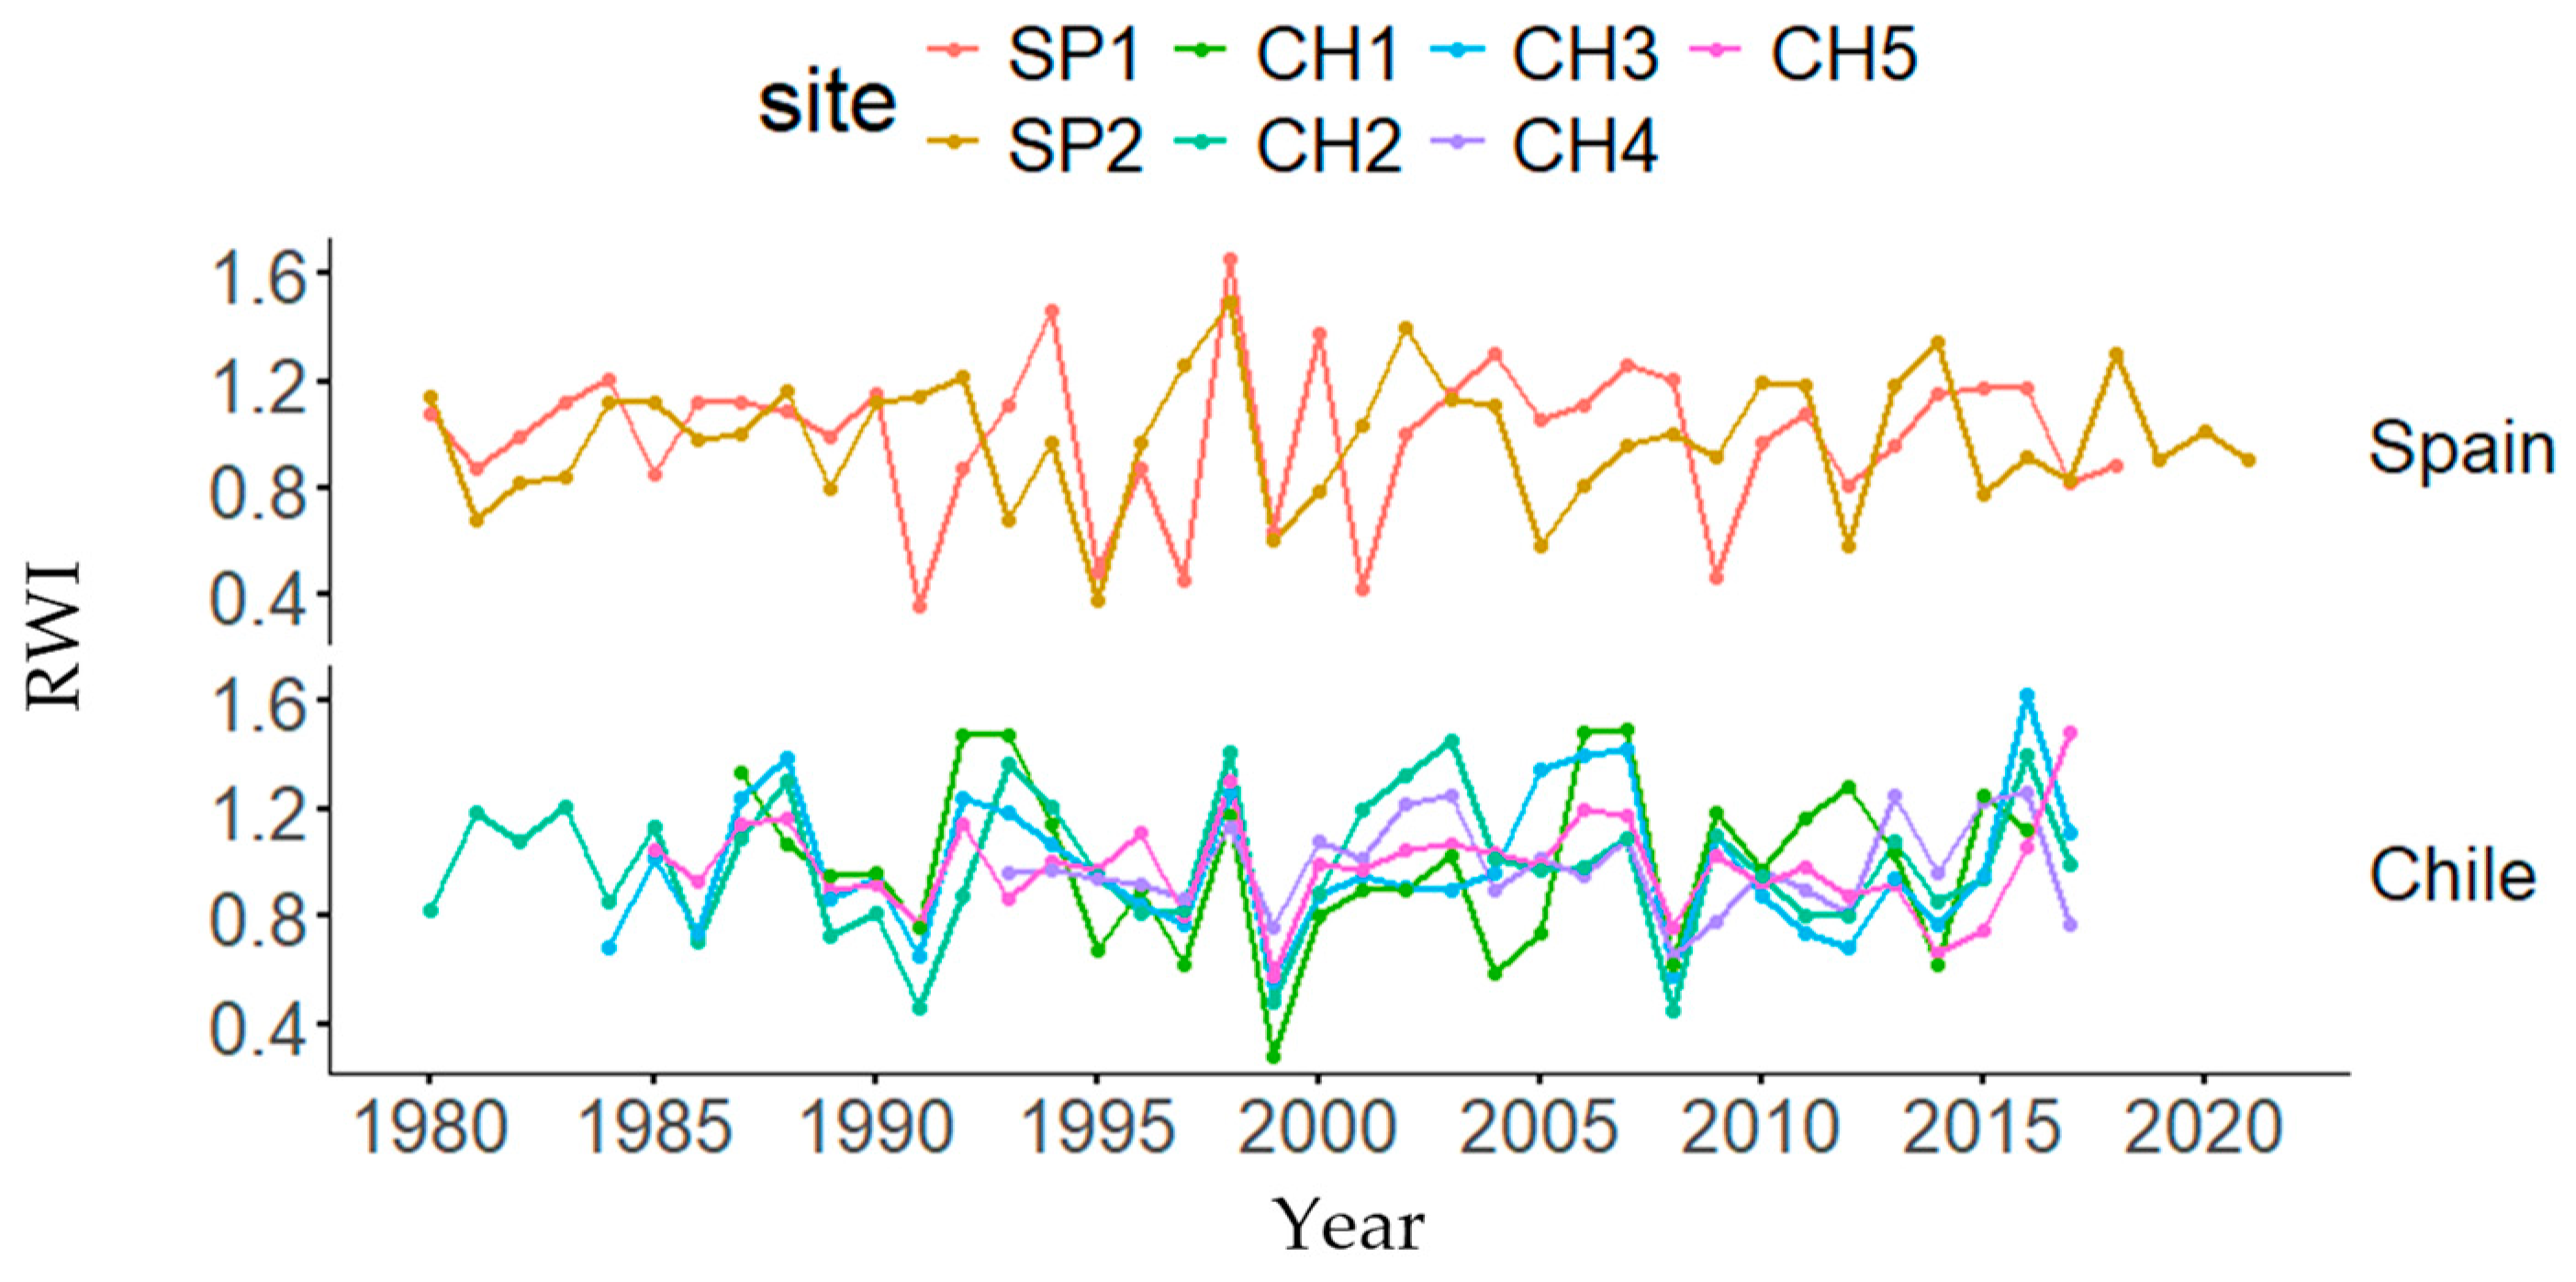
Graphical representations of each tree-ring width index and DBH decreases or gains in both natural and planted stands are presented in Figure 3 and Figure S1, respectively. Dendrochronological statistics are presented in Table 2. The highest and lowest mean BAI and BAI20 values were found in the SP1 and CH1 (Chile) plantations, respectively. The highest AC was found in CH2, the highest MS was found in SP1, and the highest EPS was found in CH5. In the ANOVAs, country and forest type were statistically significant for BAI, whereas site was also significant for BAI20 and only country was significant for CG (Table S1).
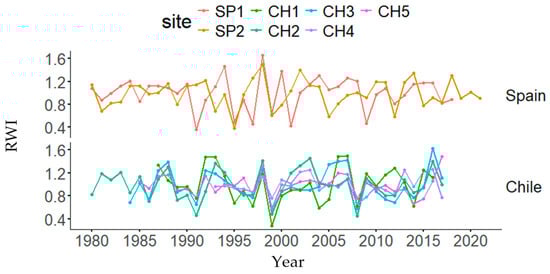
Figure 3.
Tree-ring width index (RWI) changes by country (Spain and Chile) and site (Doñana, SP1; Sierra Morena, SP2; Peñuelas, CH1; Cahuil, CH2; Paredones, CH3; Manquimiliu, CH4; Pastene, CH5).
Table 2.
Dendrochronological statistics of the Pinus pinea stands sampled in Chile and Spain. Abbreviations: BAI, mean basal area increment for the whole period; BAI20, mean basal area increment in the last 20 years; CG, cumulative radial growth; AC, first-order autocorrelation coefficient; MS, mean sensitivity; Rbar, mean correlation between trees; EPS, Expressed Population Signal. Mean ± SD; tree number corresponds to the number of sampled trees, and core number is presented in parentheses.
3.2. Growth Responses to Climate
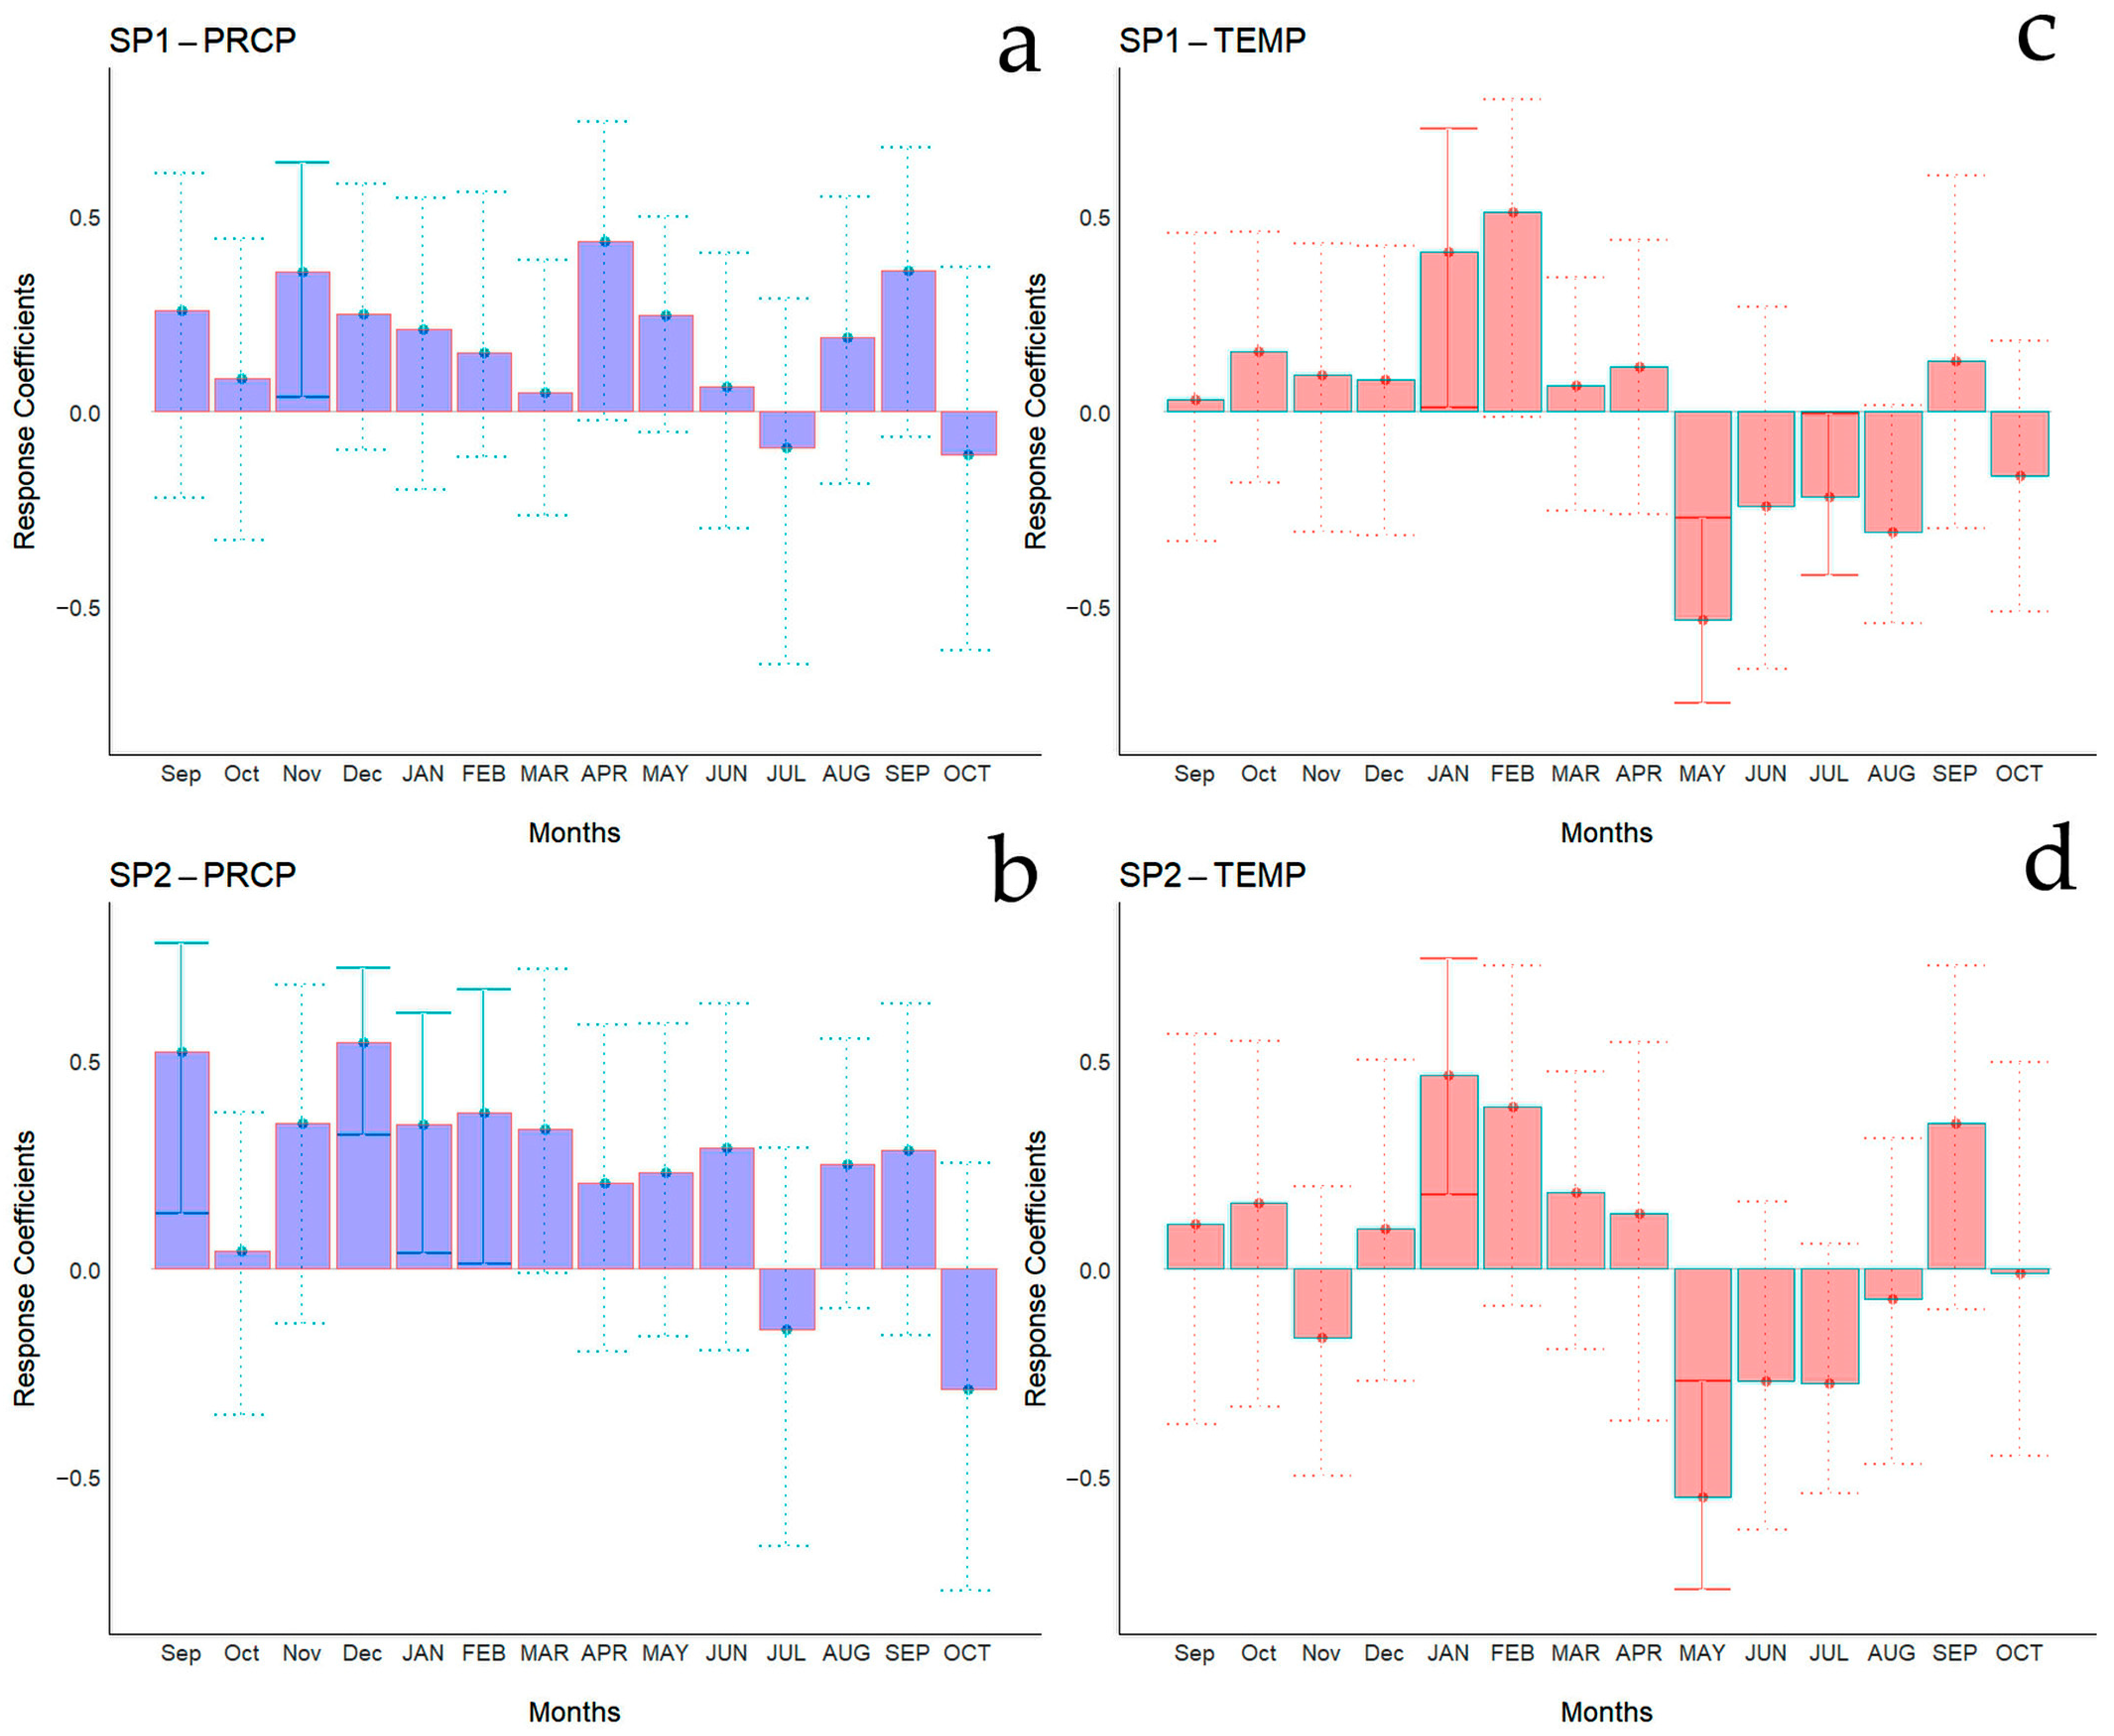
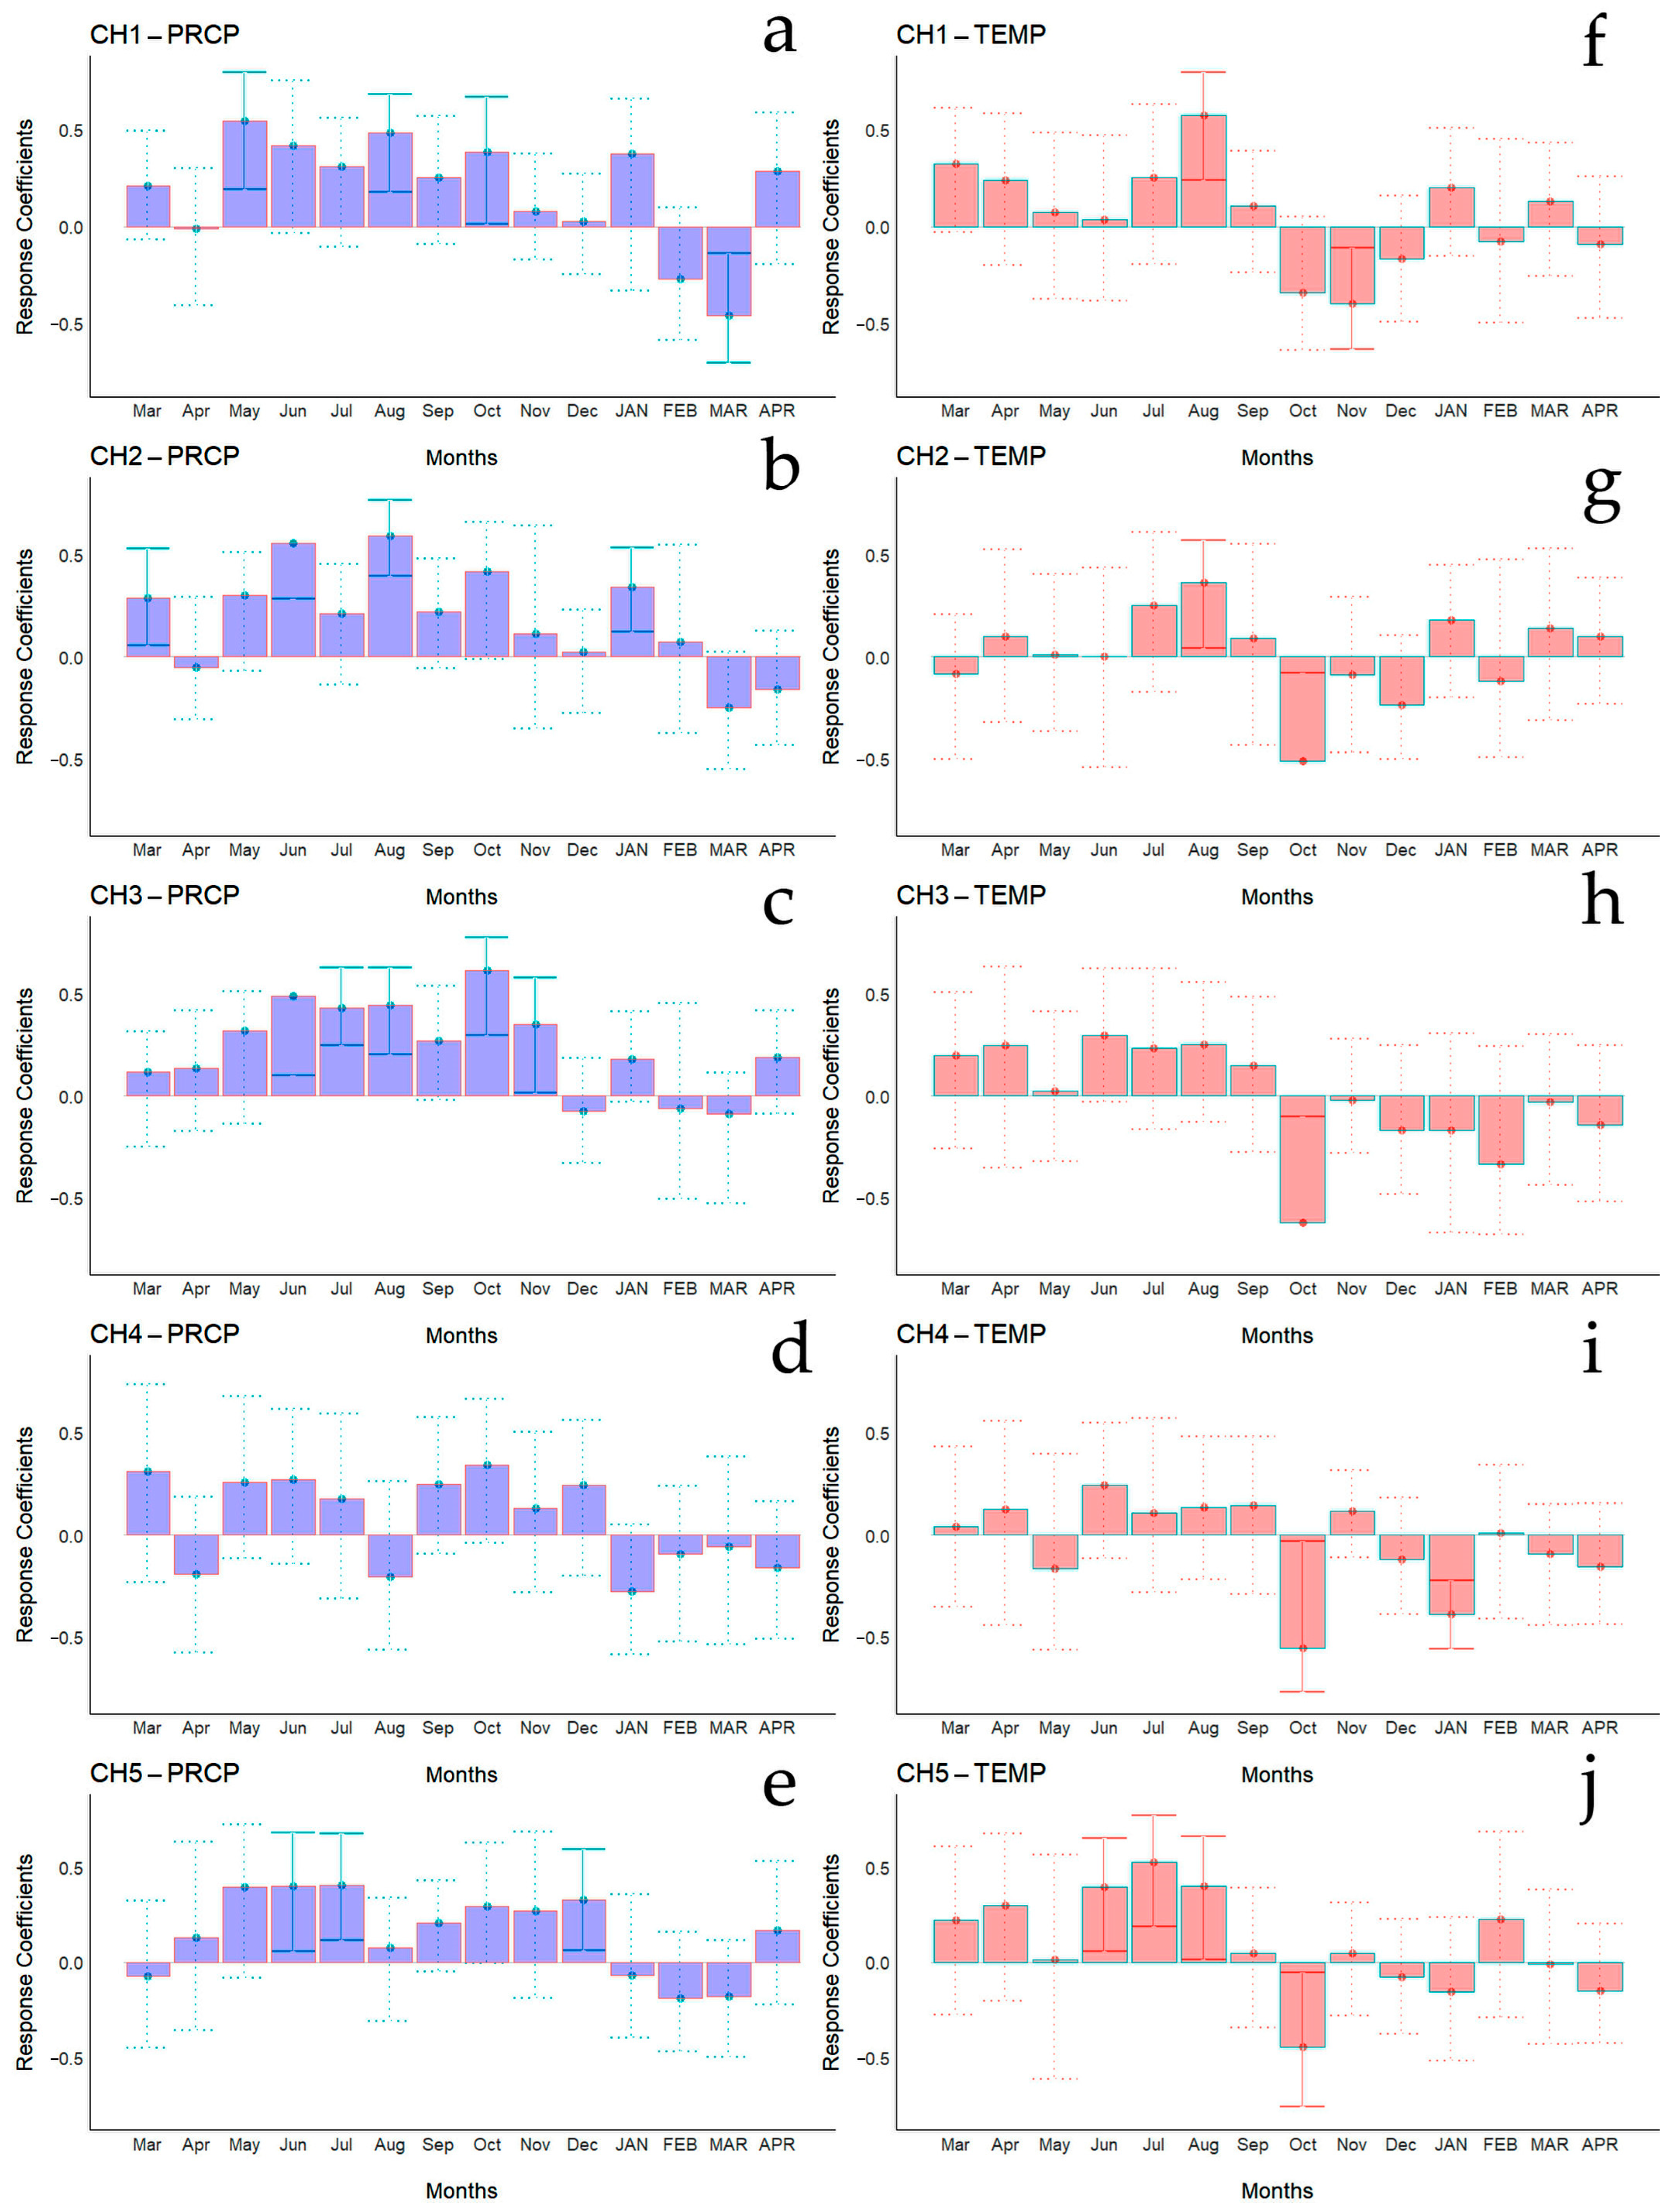
Bootstrapped correlations relating tree-ring width indices to monthly climate variables for the Spanish and Chilean plantations are represented in Figure 4 and Figure 5, respectively, showing differences among populations and countries. For clarity, a summary of significant correlations between RWI and monthly climatic variables by sites is presented in Figure 6. For the Spanish plantation, a significant positive correlation was observed between RWI and November of the previous year’s rainfall (Figure 6e), whereas RWI was positively correlated with January and negatively with May and July’s mean temperature of the current year (Figure 6f). For Chilean plantations, rainfall exhibited positive correlations with RWI in 14 out of 50 months of the previous year, and in 1 out of 20 months of the current year (Figure 6a). Mean temperature was positively correlated in CH1, CH2, and CH5 in 5 out of 30 months of the previous year and none in the current year. By contrast, a significant negative correlation was found in all sites, in 5 months of 50 of the previous year and in 1 month of 12 of the current year (Figure 6b).
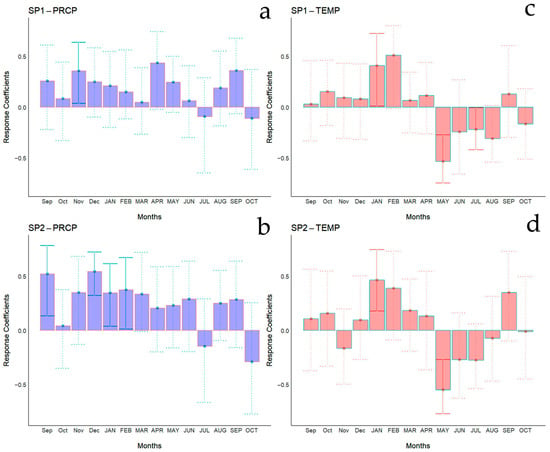
Figure 4.
Bootstrapped correlations relating tree-ring width indices to monthly climate variables (PRCP, total rainfall—(a,b); Temp, mean temperature—(c,d)). Correlations were calculated from the previous September to the current October, and significant (p < 0.05) values are shown with continuous error lines. Spanish stands: SP1 (Doñana) and SP2 (Sierra Morena). Monthly climatic variables from the previous and current years are abbreviated with lowercase and uppercase letters, respectively.
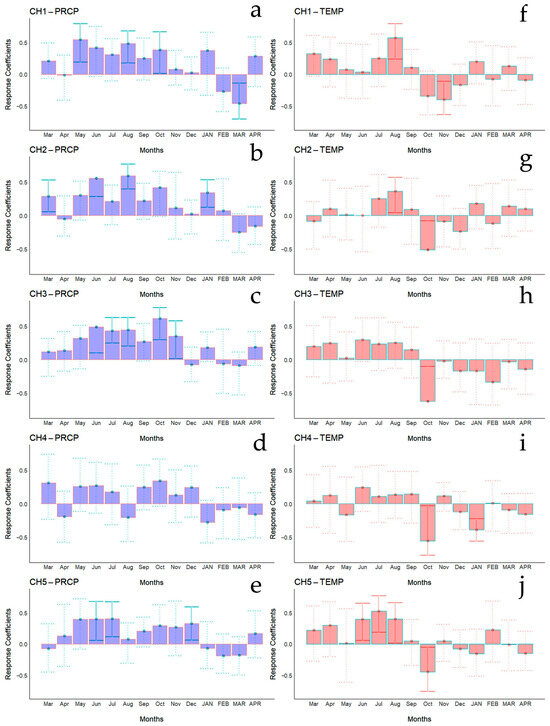
Figure 5.
Bootstrapped correlations relating tree-ring width indices to monthly climate variables (PRCP, total rainfall—(a–e); Temp, mean temperature—(f–j)). Correlations were calculated from the previous March to the current April, and significant (p < 0.05) values are shown with continuous error lines. Chilean plantations: CH1 (Peñuelas), CH2 (Cahuil), CH3 (Paredones), CH4 (Manquimiliu), and CH5 (Pastene). Monthly climatic variables from the previous and current years are abbreviated with lowercase and uppercase letters, respectively.

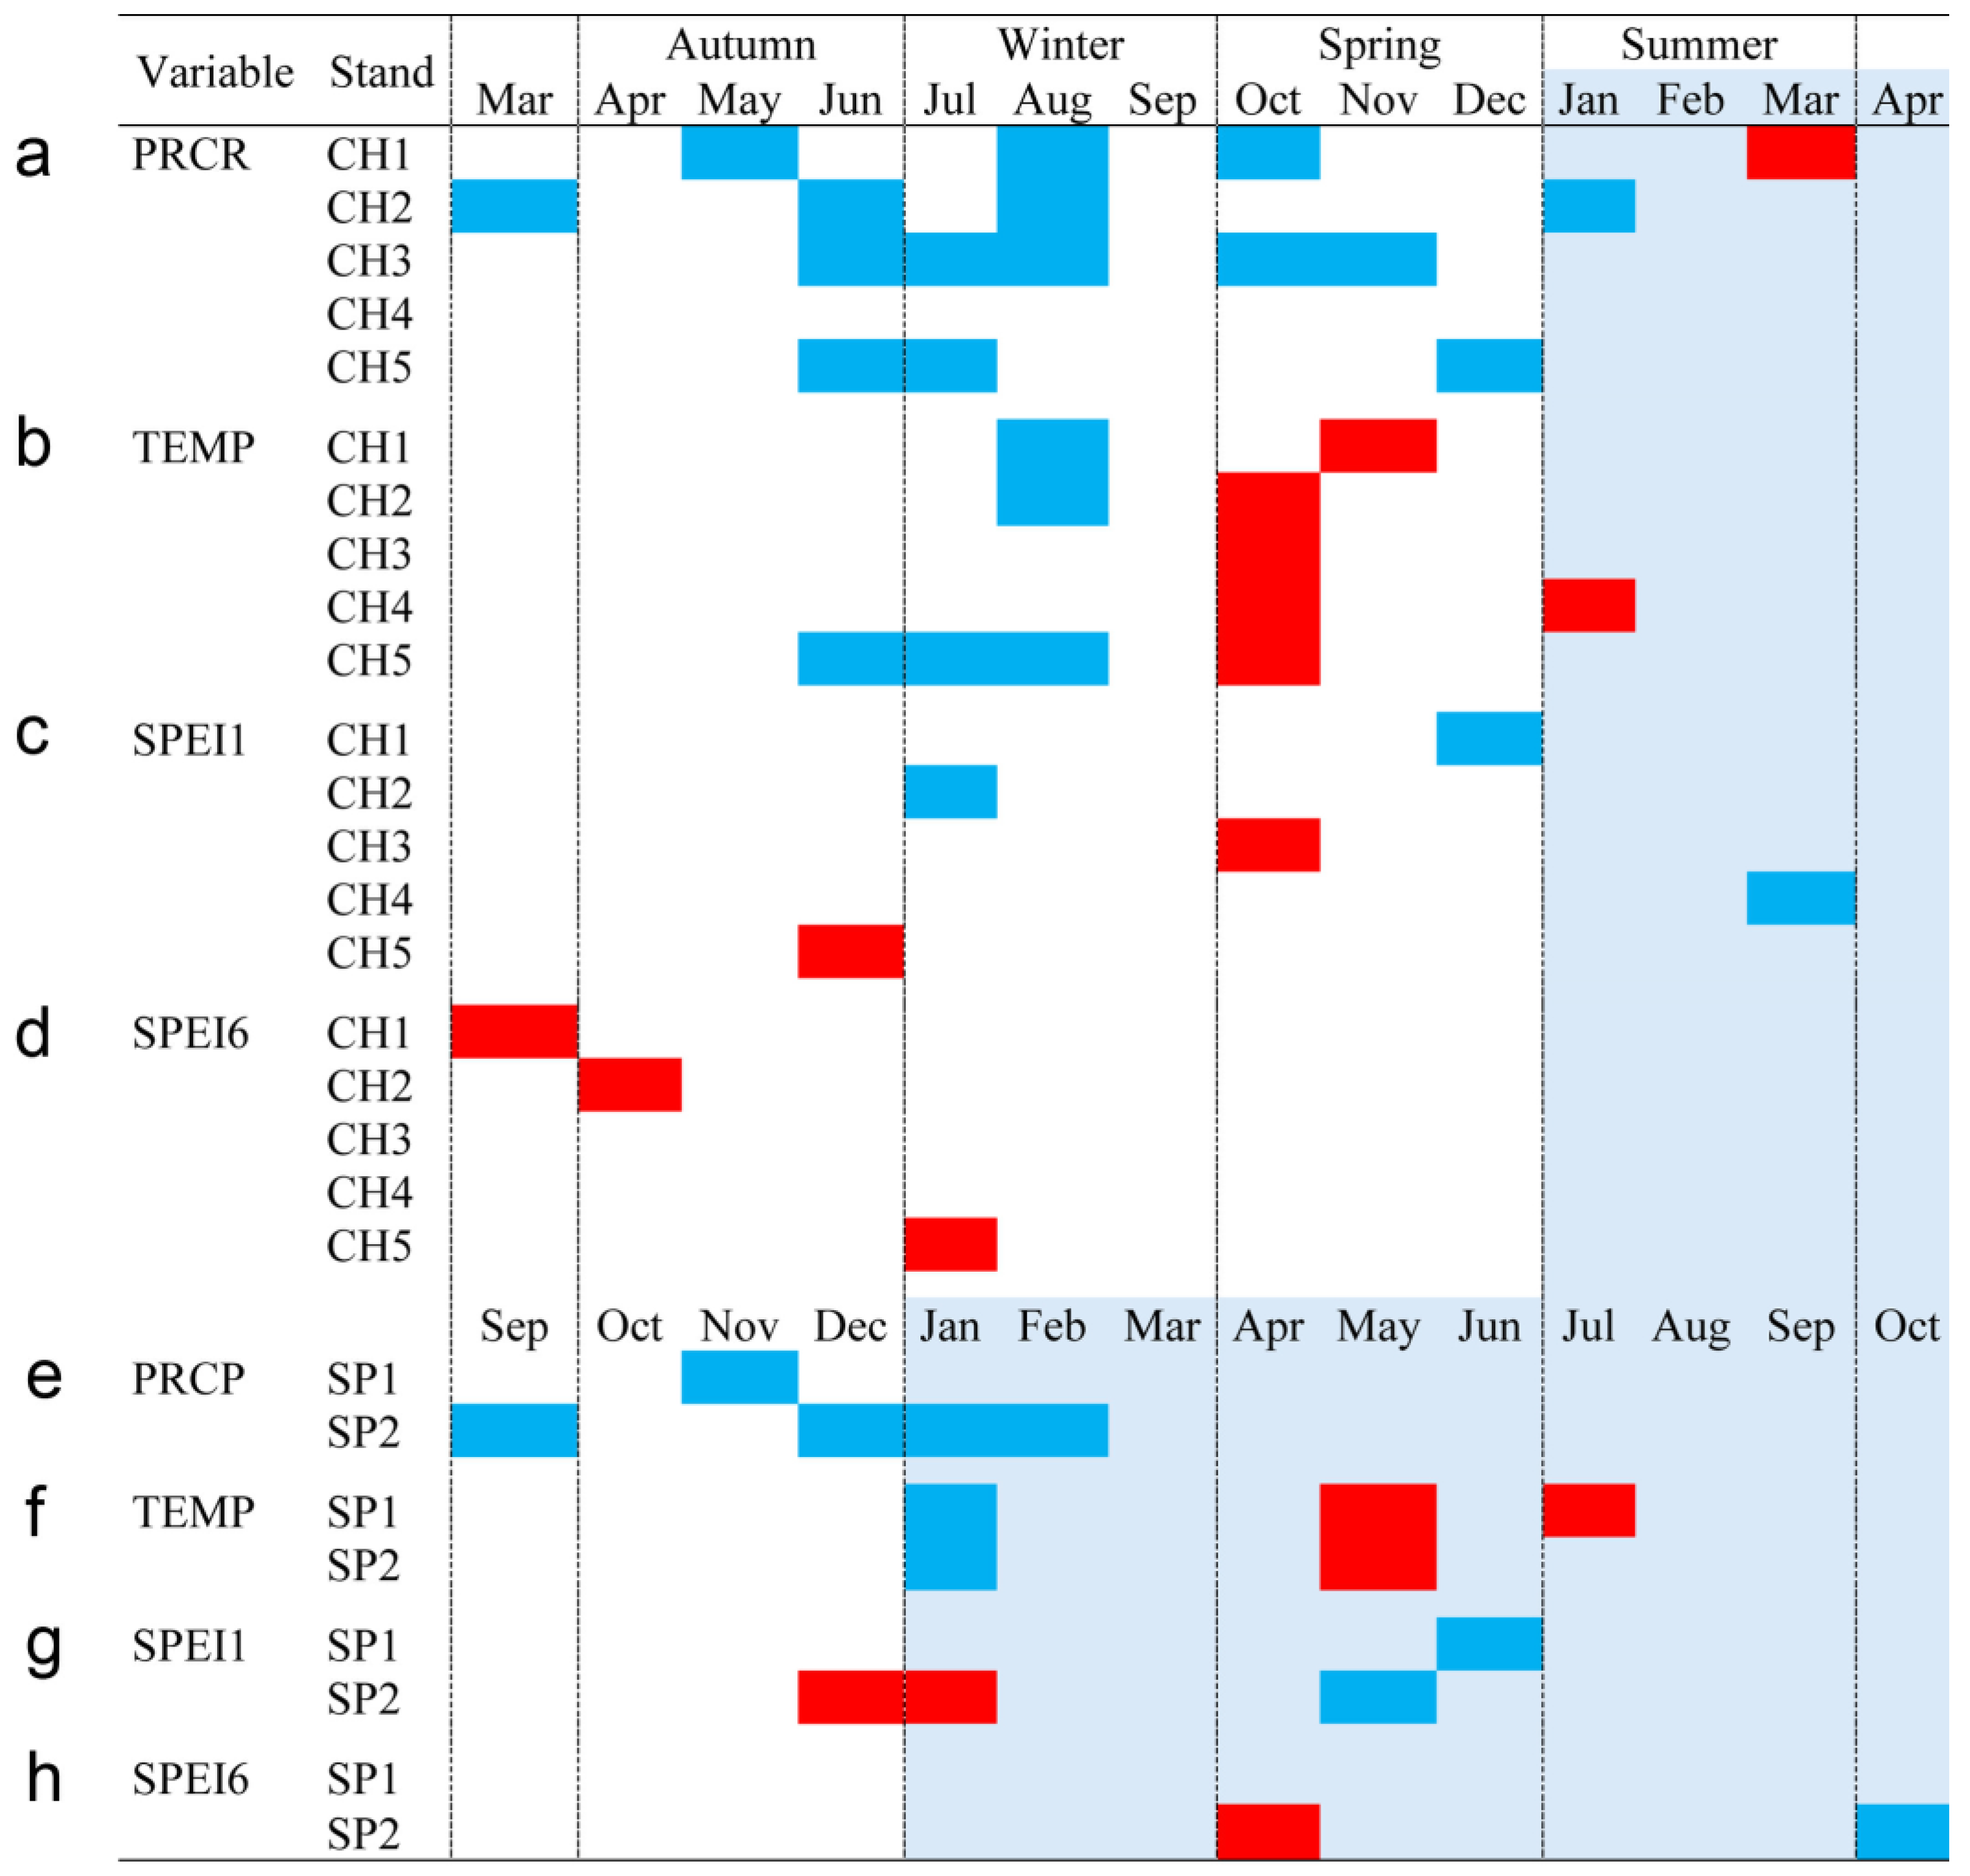
Figure 6.
Monthly climatic variables and drought index significative correlation occurrence (p < 0.05) by site, month, and season. Red: significant negative correlation; Blue: significant positive correlation; light blue (current year); white (previous year). Spanish stands: SP1 (Doñana) and SP2 (Sierra Morena). Chilean plantations: CH1 (Peñuelas), CH2 (Cahuil), CH3 (Paredones), CH4 (Manquimiliu), and CH5 (Pastene). Climatic variables: total rainfall (PRCP), mean temperature (TEMP), one-month drought index (SPEI1), and six-month drought index (SPEI6) for Chile (a–d), and Spain (e–h).
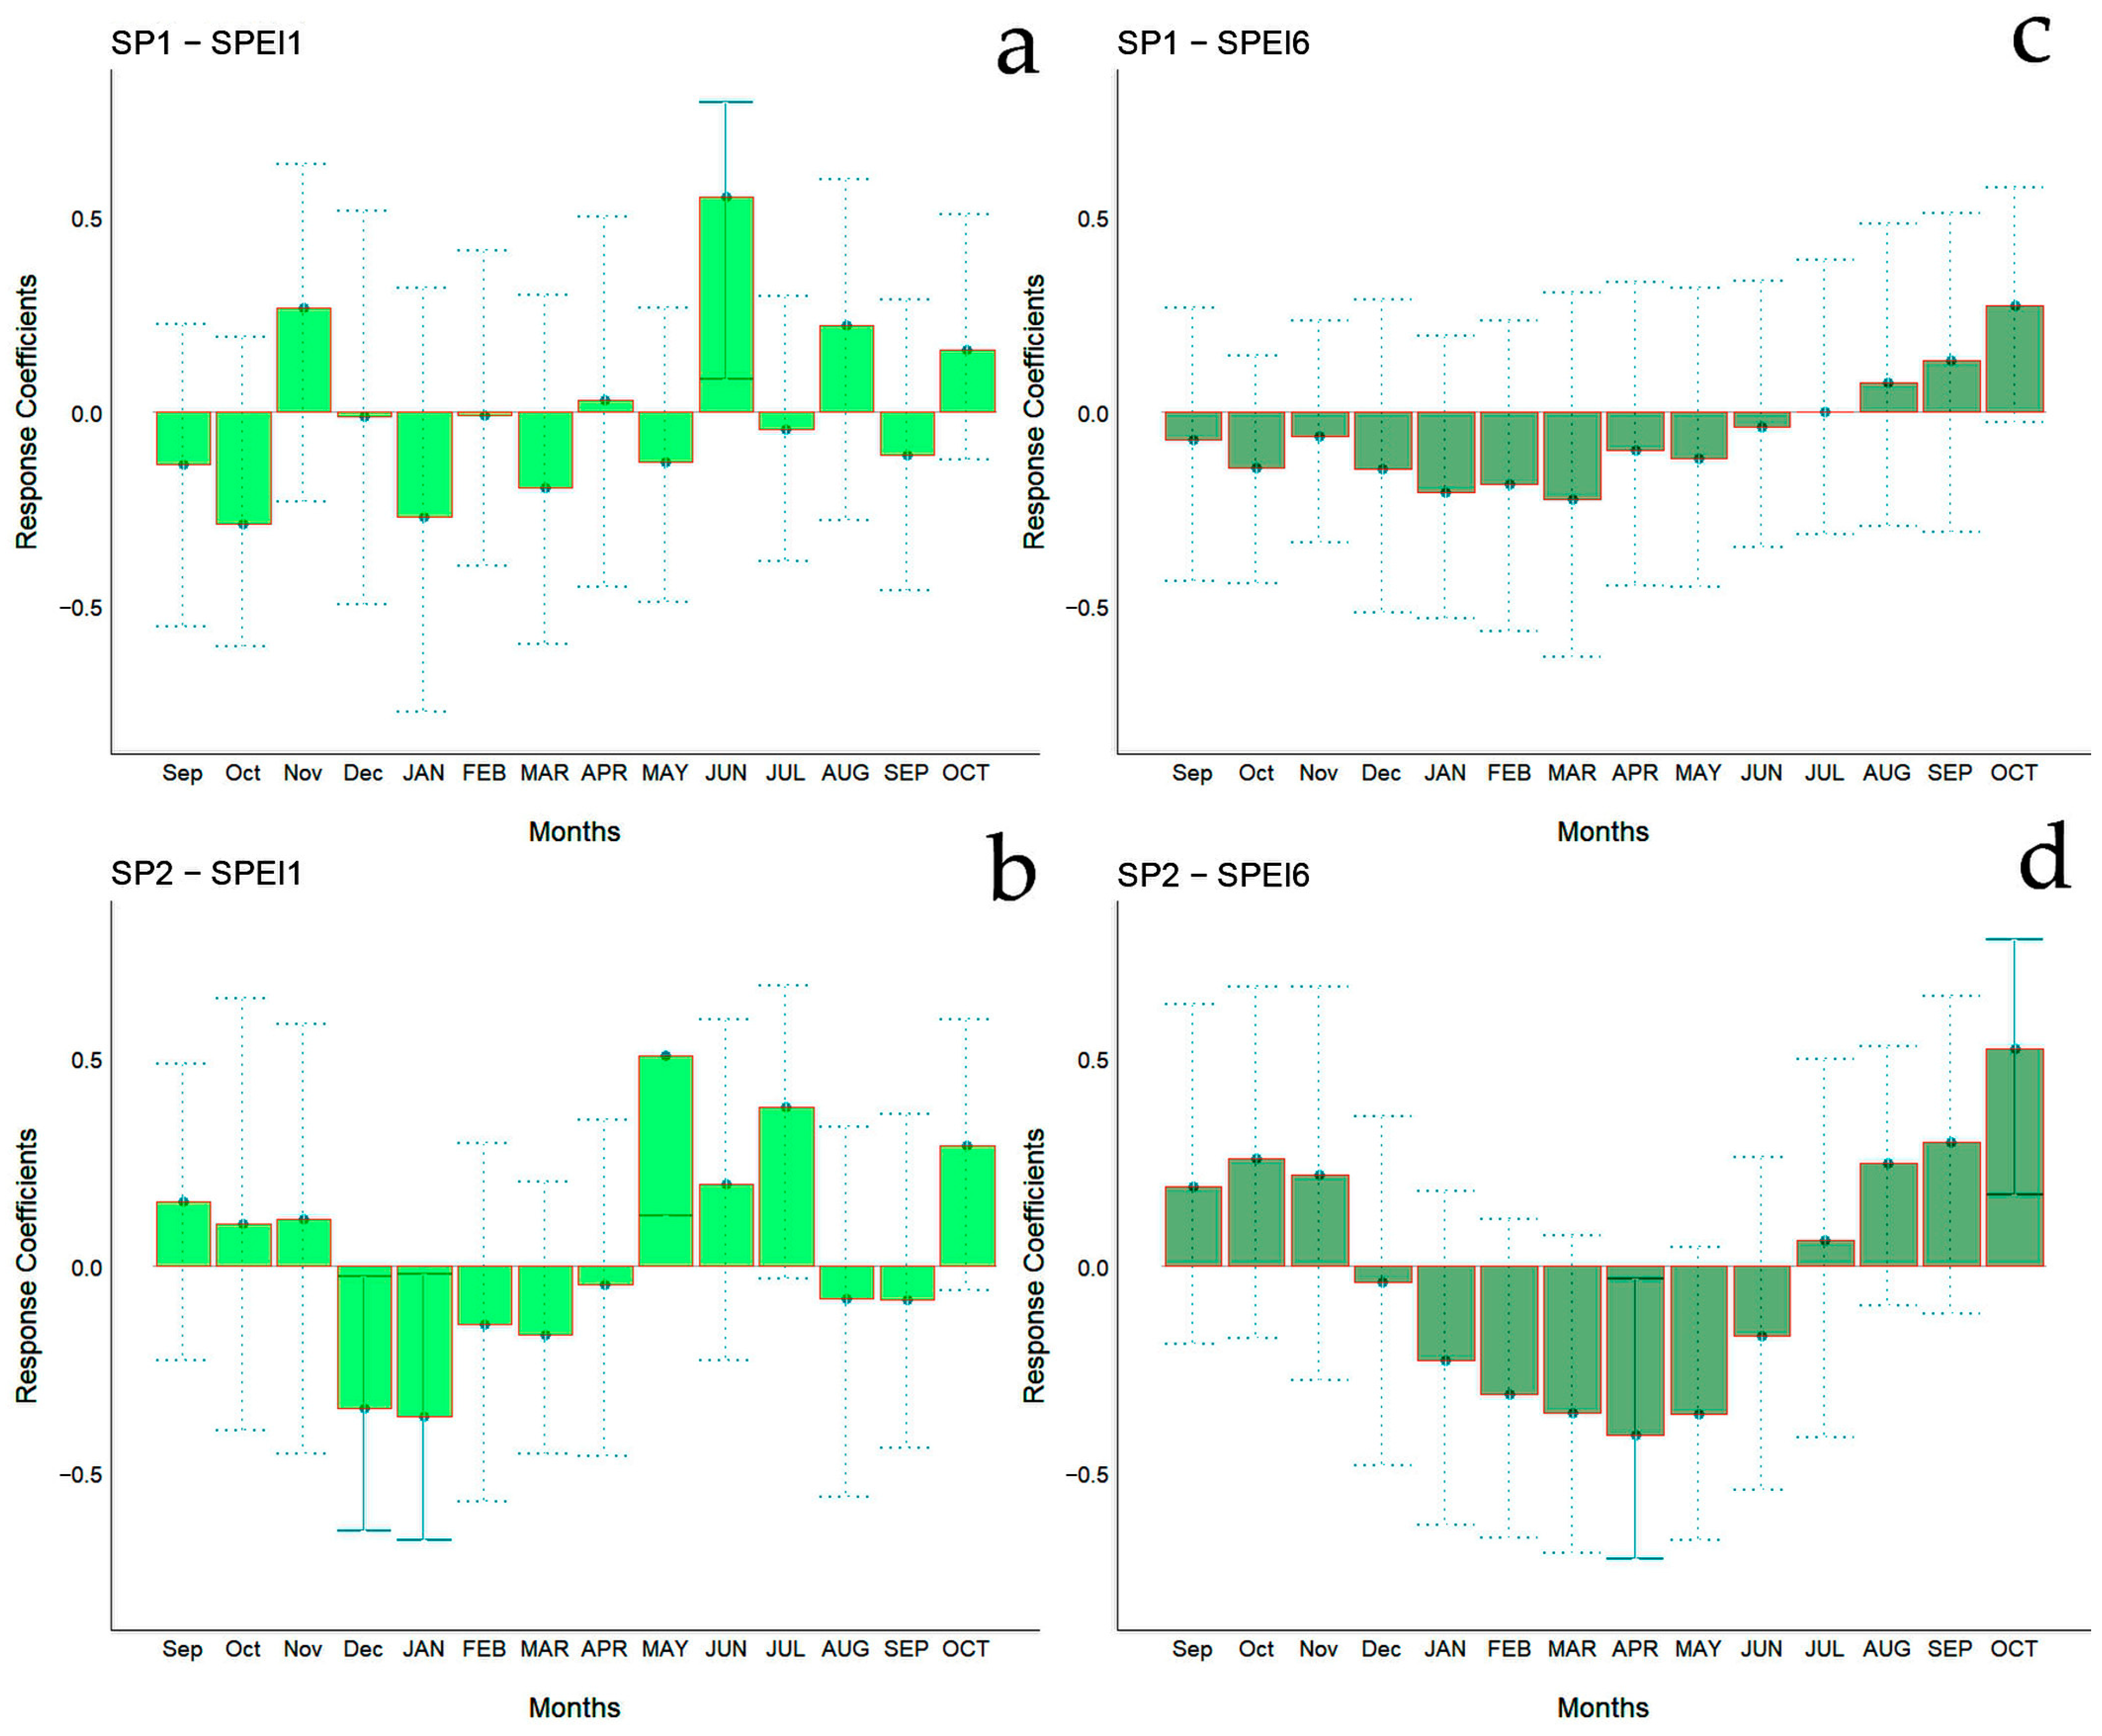
The bootstrapped response correlation analysis relating standardized tree-ring width indices to the SPEI for the Spanish stands is shown in Figure 7 and for the Chilean plantations in Figure 8. For the Spanish stands, significant positive correlations were observed between RWI and the current year’s May and June (spring) SPEI1, and only for SP2 was a significant negative correlation between RWI in December of the previous year and January of the current year’s SPEI1 observed (Figure 6g). With respect to SPEI6, while SP1 showed no correlation, SP2 displayed a significant negative correlation in April of the current year and a positive correlation in October of the current year (Figure 6h).
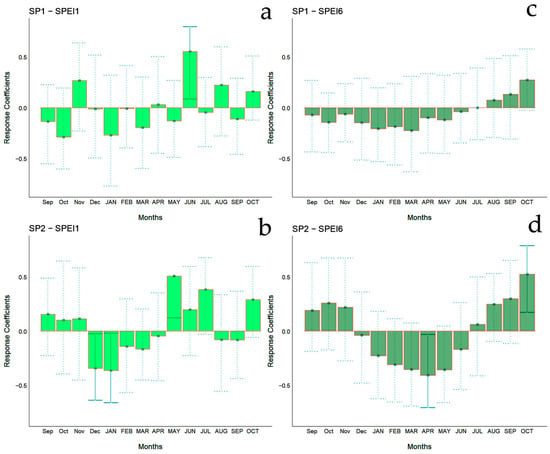
Figure 7.
Bootstrapped response correlation analysis relating tree-ring width indices to SPEI-1 (a,b) and SPEI-6 (c,d) calculated at one- and six-month temporal resolutions. Correlations were calculated from September of the previous year to October of the current year. Significant (p < 0.05) values are shown with continuous error lines. Spanish stands: SP1 (Doñana) and SP2 (Sierra Morena). Monthly climatic variables from the previous and current years are abbreviated with lowercase and uppercase letters, respectively.
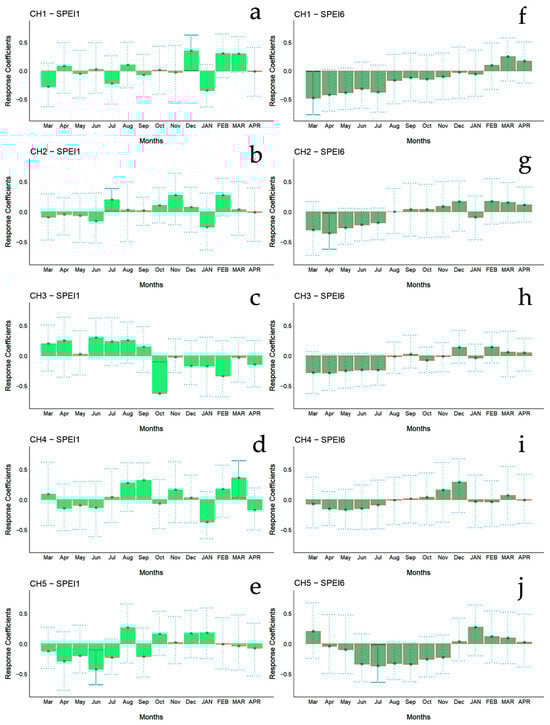
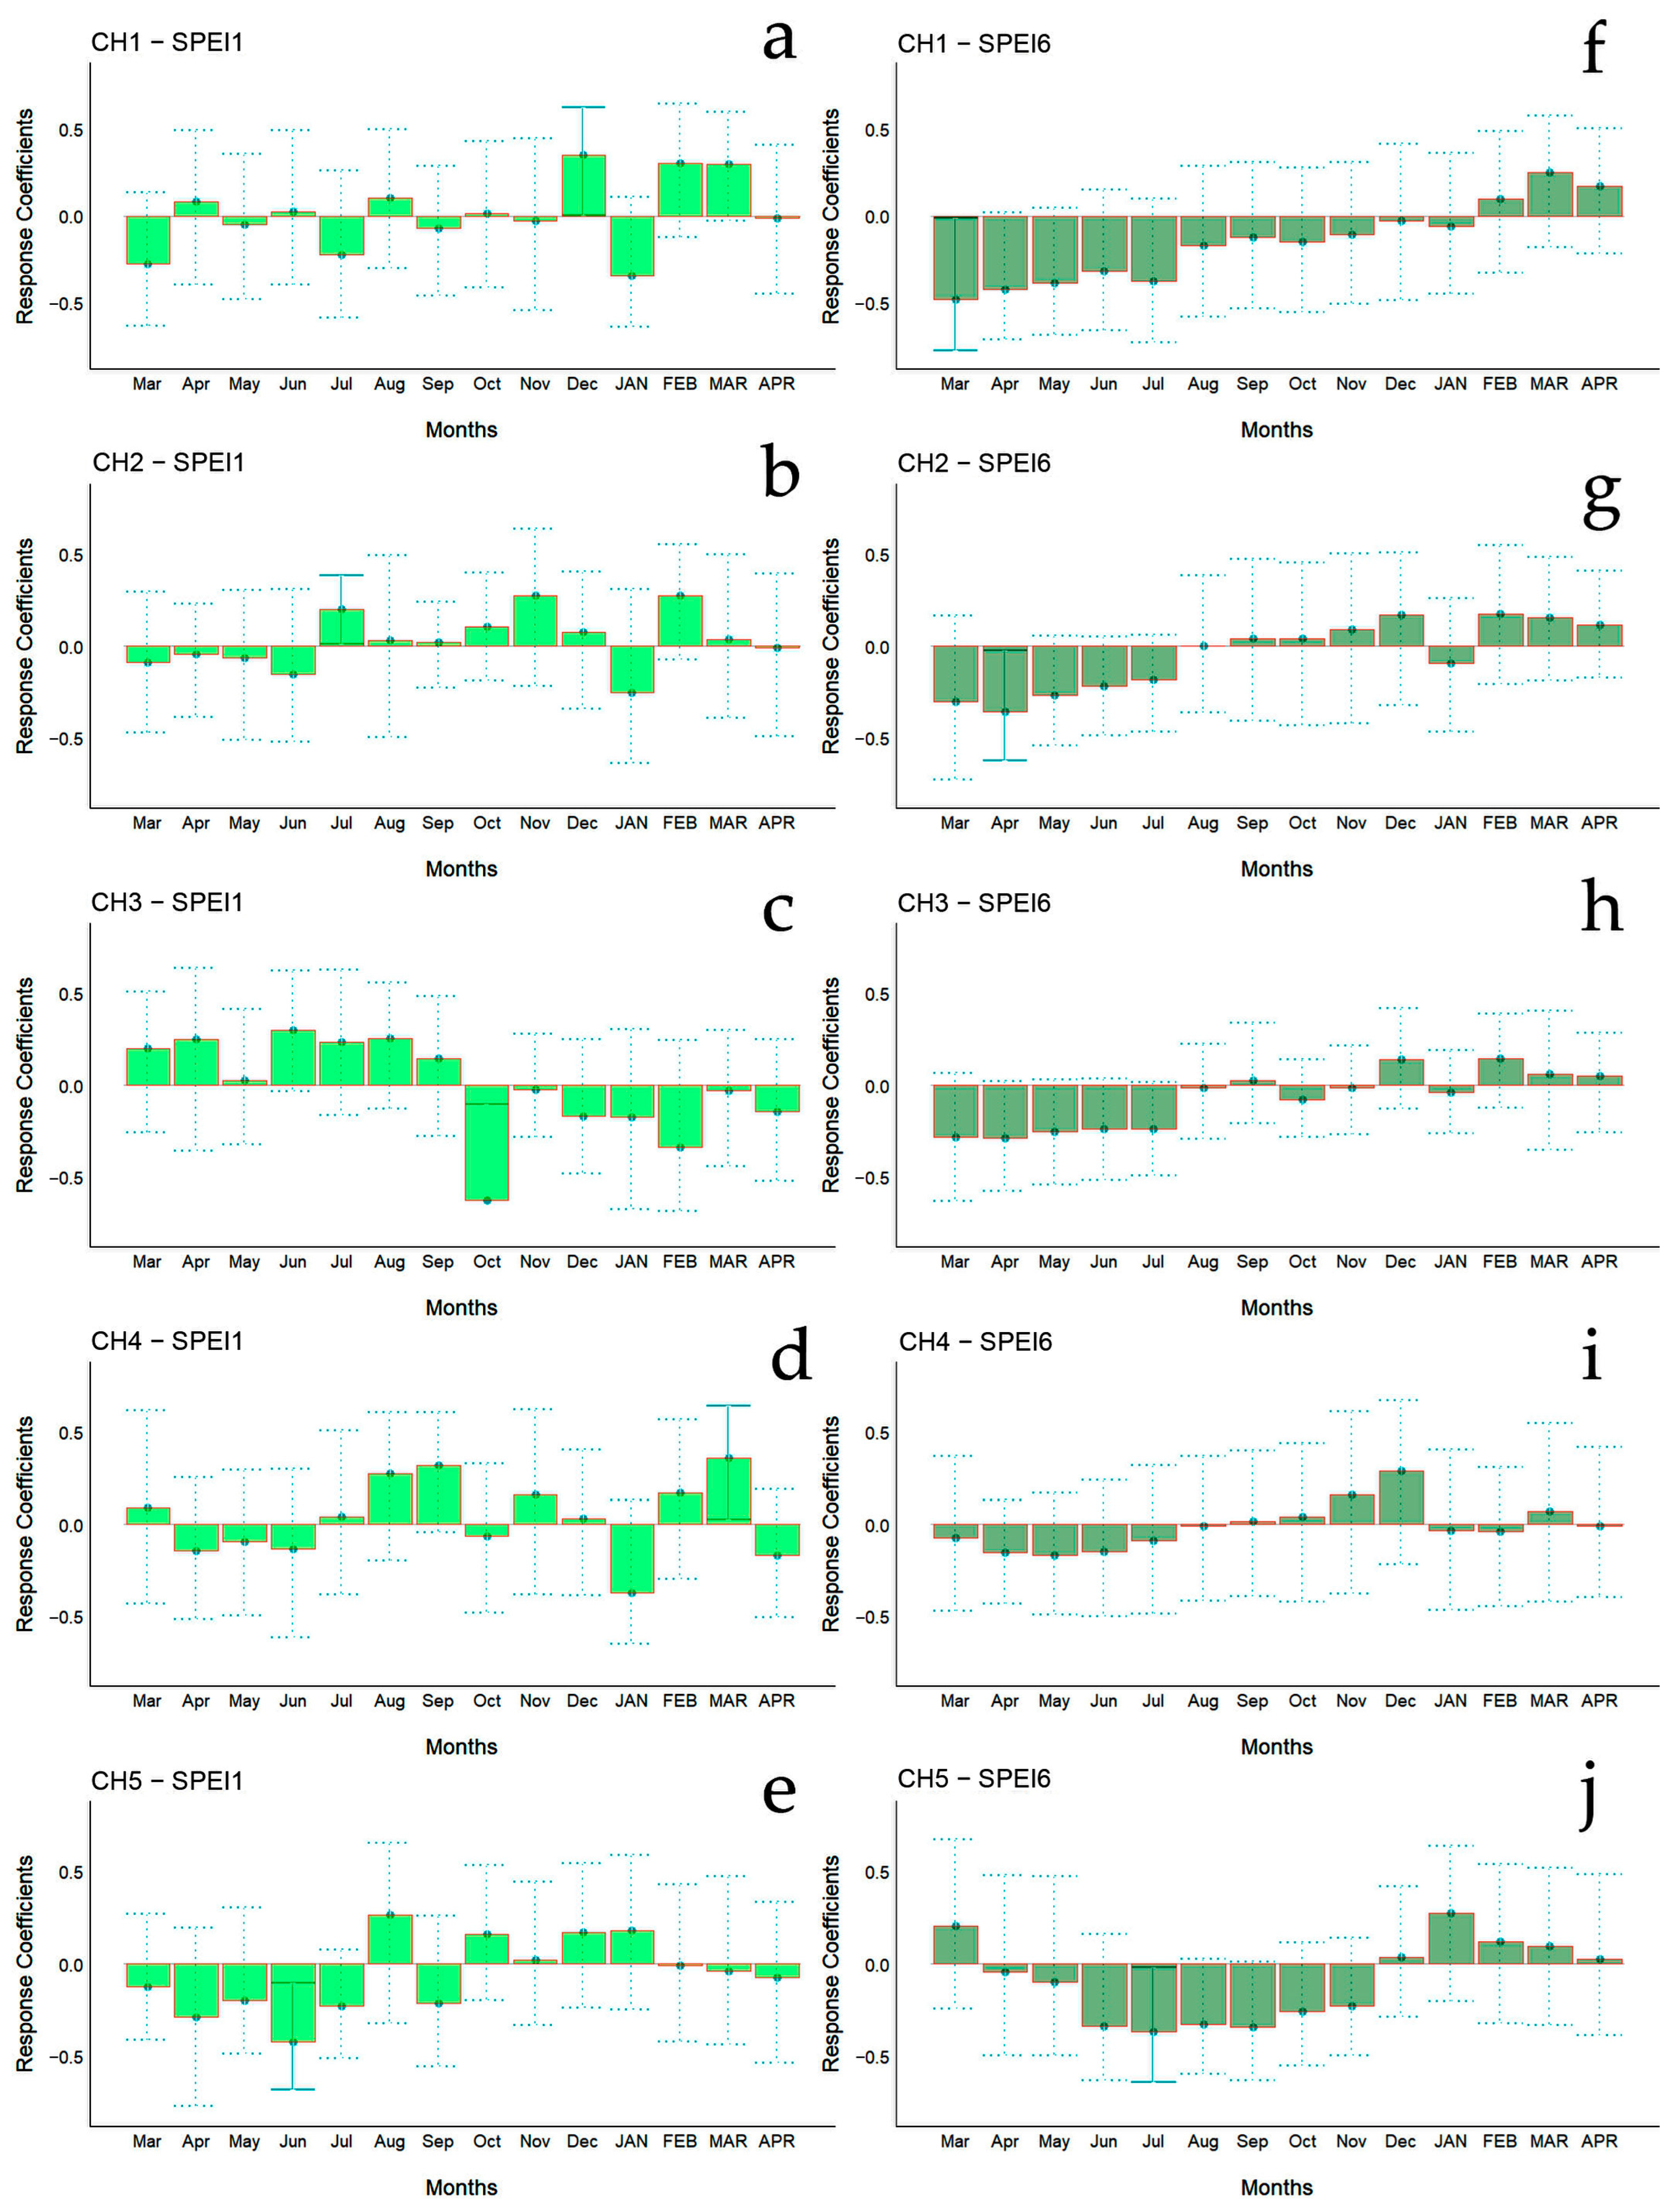
Figure 8.
Bootstrapped response correlation analysis relating tree-ring width indices to SPEI calculated at one- (a–e) and six-month (f–j) temporal resolutions. Correlations were calculated from the previous March to the current April. Significant (p < 0.05) values are shown with continuous error lines. Chilean plantations: CH1 (Peñuelas), CH2 (Cahuil), CH3 (Paredones), CH4 (Manquimiliu), and CH5 (Pastene). Monthly climatic variables from the previous and current years are abbreviated with lowercase and uppercase letters, respectively.
For Chilean plantations, in terms of SPEI1, significant positive correlations were found in CH1 and CH4 in December of the previous year and in March of the current year (beginning and end of summer), respectively, while for CH2 it was during July of the previous year (winter) (Figure 6c); significant negative correlations were found in the CH3 and CH5 sites in October and June of the previous year (mid-spring and end of autumn, respectively) (Figure 6c). The SPEI6 showed negative correlations in the CH1, CH2, and CH5 sites, particularly from March to July of the previous year (autumn to winter) (Figure 6d).
3.3. Comparing Growth between Countries and between Forest Types
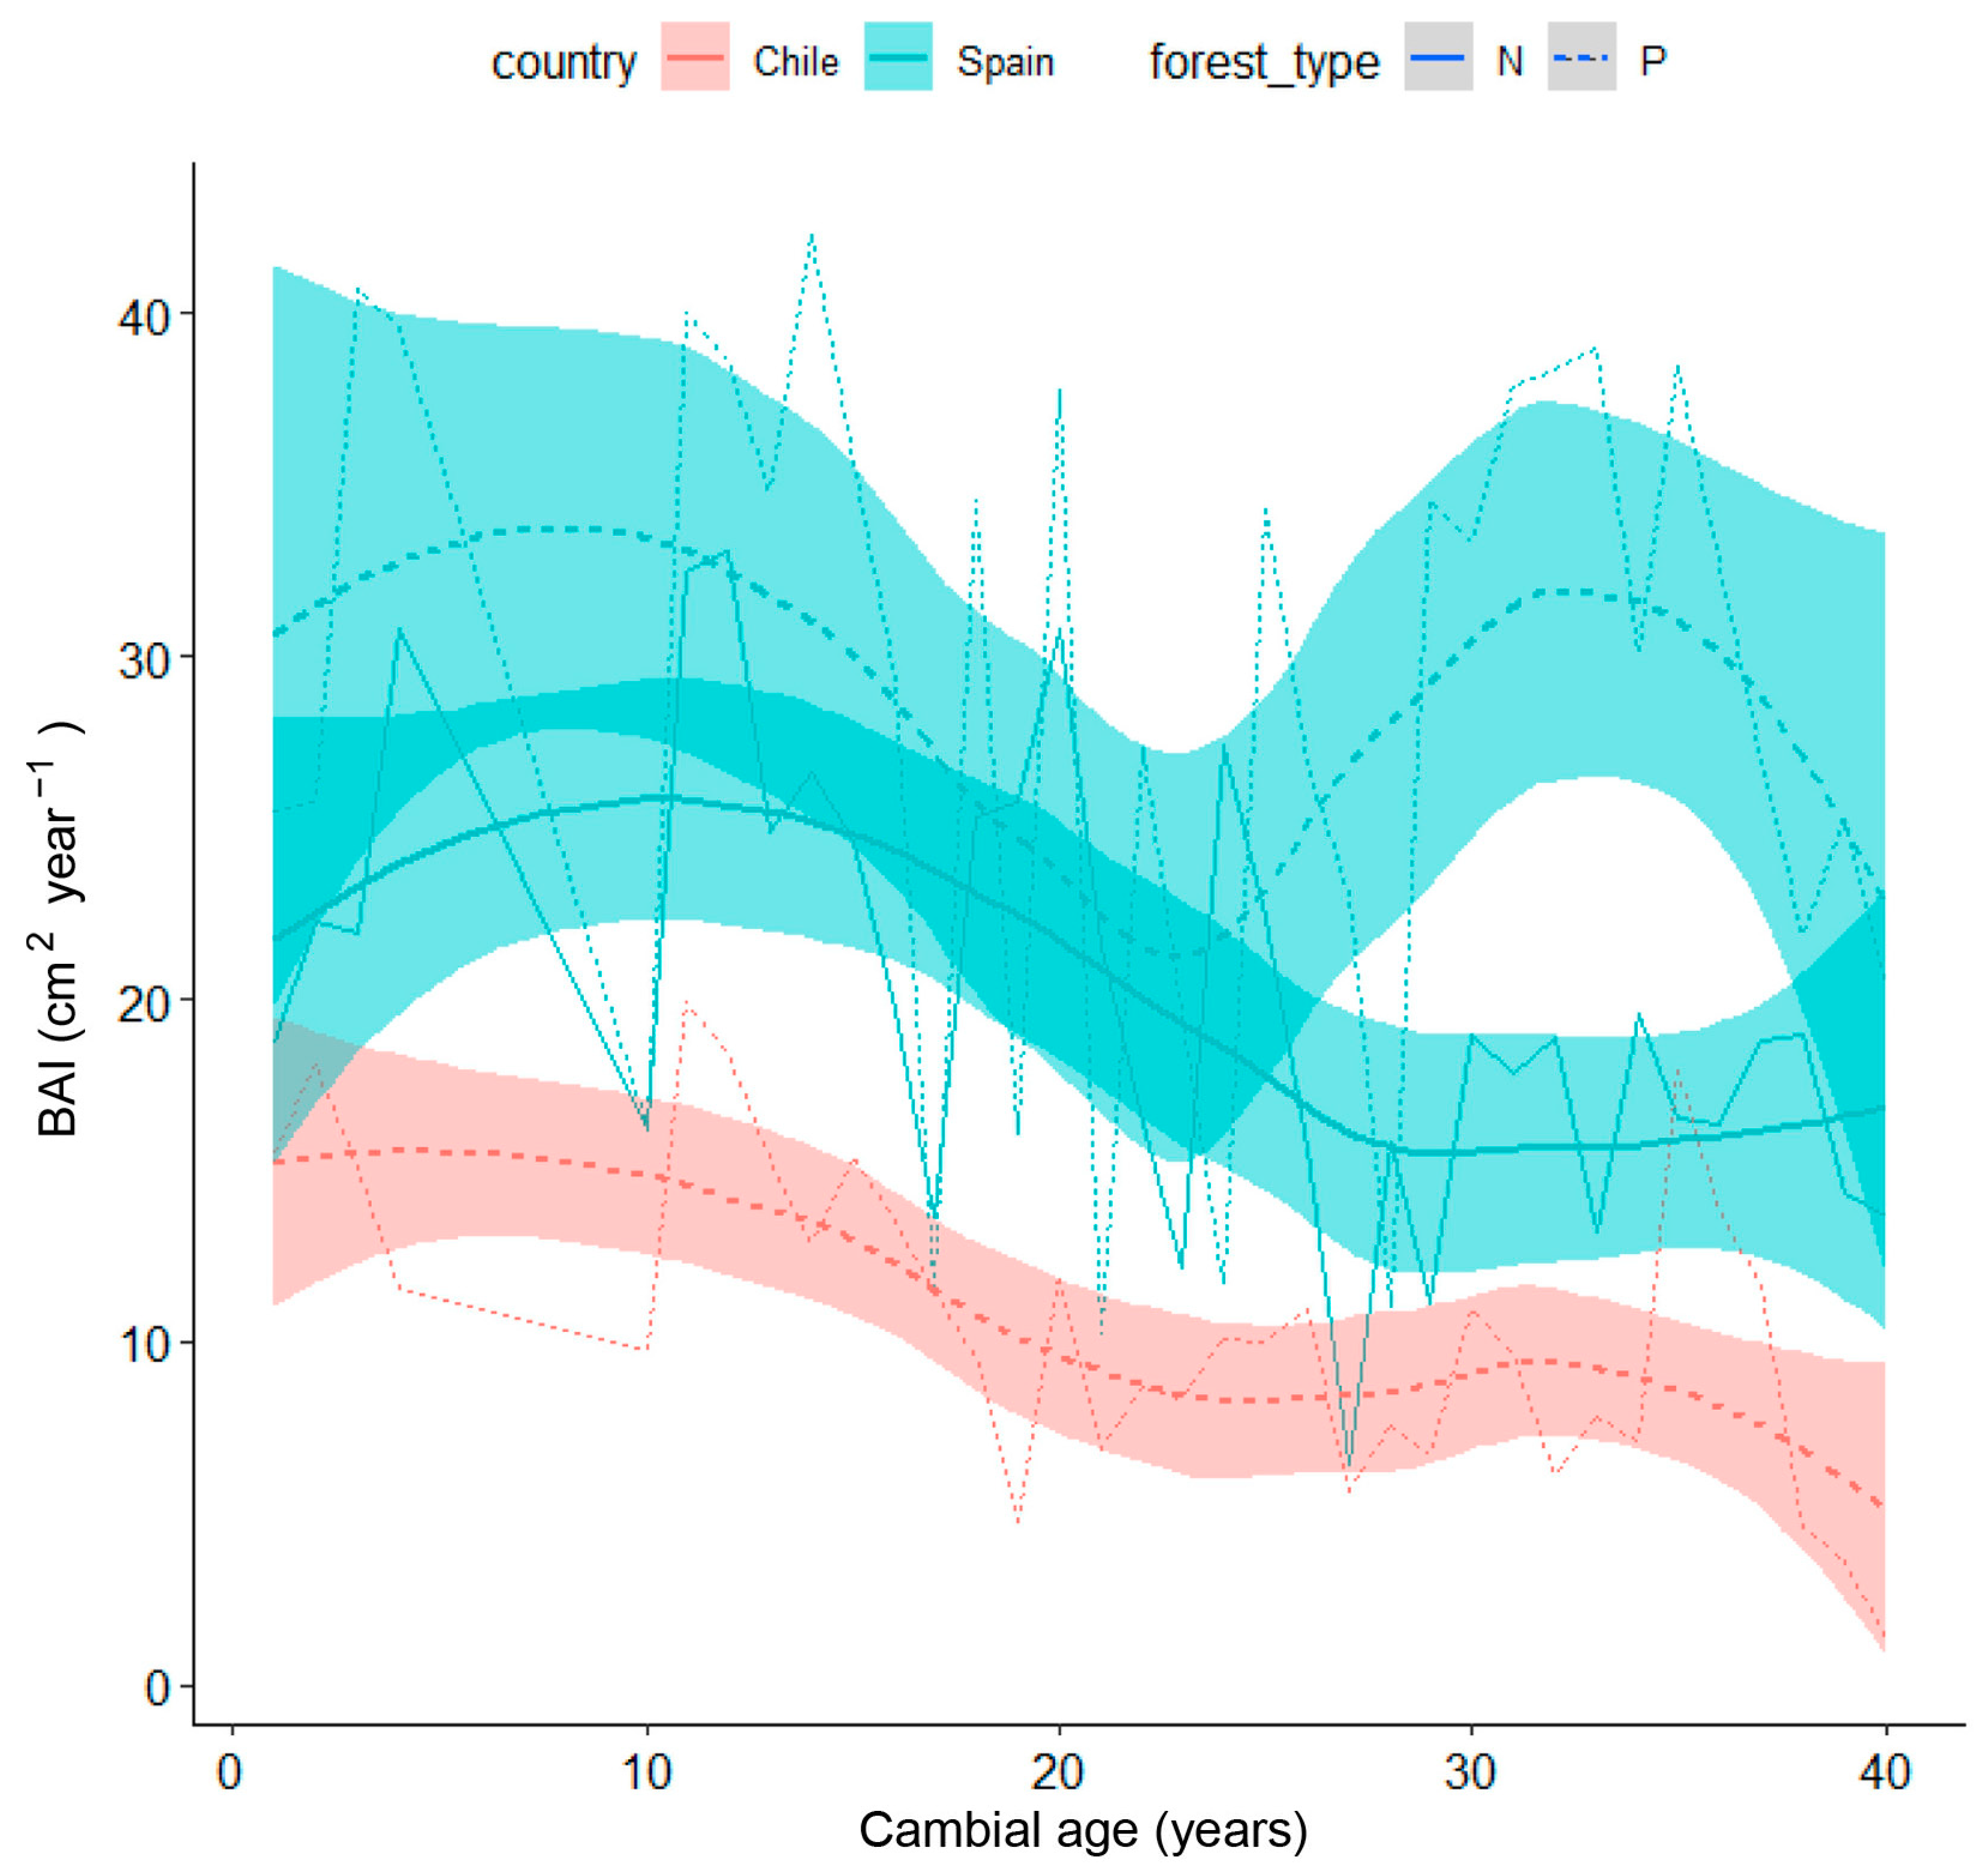
Mean curves of site-grouped BAI according to tree age (cambial year) in natural and planted stands from Spain and Chile are presented in Figure 9, showing how BAI differently decreased in both countries as trees aged and enlarged. In Chilean plantations, BAI showed a progressively decreasing trend, while in Spanish stands, it showed higher values, particularly in the planted site, but also higher year-to-year variability, probably associated with drought events.

Figure 9.
Loess Regression of the mean curves of site-grouped BAI according to tree age in stone pine in Spain (light blue lines and shaded areas) vs. Chile (pink lines and shaded areas). The shaded areas represent the higher and lower limits for the mean value of each forest type corresponding to each country. Abbreviations of forest type: N (solid line), natural; P, (dashed line) planted.
4. Discussion
4.1. Growth Patterns
Characterizing the growth of P. pinea in native and exotic Mediterranean habitats is interesting in light of the challenges posed by the increasing climatic variability. In particular, the analysis of tree growth responses to climate variability in natural and planted stands in Chile and Spain provides relevant information to implement appropriate management strategies under challenging scenarios. Diameter increments in both countries showed inter-annual variability, as already reported for the species in other countries, including Syria [37], Turkey [38], Italy [8,39], and the entire Mediterranean region [9].
In general, we found lower BAI values in Chilean plantations than in the Spanish natural and planted stands. Because the limiting factor for growth is water, this difference could be attributed to an inferior drought adaptation in Chile than in the native forests and plantations from southern Spain, since the genetic material used to establish those plantations comes from reduced genetic origins [40]. Therefore, for new afforestation in non-native environments, the use of seeds from provenances with a more isohydric (water-saver) strategy towards drought stress is recommended [41].
In our study, the BAI of Chilean plantations was more similar to that of the natural Spanish stand than to the BAI of the Spain plantation. However, the Spanish plantation presented more variability than the Spanish natural stand, suggesting that plantations would be more sensitive to climate change than natural stands [42]. Natural or planted stone pine stands will be threatened by the more arid conditions induced by climate change, as reported by several authors [43], most probably increasing their susceptibility to pests and pathogens [44].
The decreasing growth trend in Chilean plantations detected here seems to be affected by the lack of management, with high densities having been kept over time; however, the low variability on plantation density in Spain and Chile calls for future studies addressing this management variable. Thinning could contribute to the reduction in vulnerability, especially in heavy treatments [45].
4.2. Growth Response to Climate
In Southern Europe, severe aridity is expected in the coming decades [46], intensifying drought stress in semi-arid environments [47]. This aridification trend will pose additional stress to stone pine stands because of severe hydric limitations and increasing temperatures in the studied Spanish stands. This climatic trend was also reported for central–southern Chile [48], outside the species’ natural distribution area. Therefore, alterations in the function and productivity of stone pine plantations are also foreseeable. Furthermore, dense plantations may be more vulnerable to drought stress than native forests [49,50], suggesting a potential susceptibility of Chilean plantations that should be monitored in the coming decades.
The decline in growth trends in P. pinea plantations has become a significant concern, particularly in the Mediterranean region where this species is native and widely cultivated. Several studies have documented this decline, attributing it to a combination of climatic changes, pest outbreaks, and anthropogenic pressures. A previous study showed that increased temperatures and reduced rainfall during the critical growing season have led to significant reductions in the species’ radial growth; the study highlighted a correlation between severe drought events and decreased tree growth, with notable reductions observed during the droughts of the early 2000s [51]. Pests and diseases have also contributed to the decline in P. pinea growth; for instance, it has been demonstrated that infestations by pine processionary moth (Thaumetopea pityocampa) have become more prevalent due to mild winters that enhance the insect’s survival and reproduction rates [52]. In addition, unsustainable forestry practices such as poor thinning have degraded the quality of P. pinea plantations [53]. Those factors underscore the extent of growth decline. In fact, in a long-term analysis, it has been found that P. pinea’s annual growth rates have decreased by approximately 20% over the past three decades in Italy [54]. Similarly, data from the Spanish National Forest Inventory reveal a consistent decline in basal area increment across several P. pinea plantations, with some regions reporting reductions of up to 30% in recent years [55].
Climate–growth relationships were characterized in Italian stone pine populations. The authors found regional variability and suggested that detecting differences in growth responses to site-specific climate patterns may aid in the selection of appropriate climate change mitigation strategies [8]. We detected differences between countries in the timing of significant correlations between tree-ring width indices and rainfall. Peaks occurred between autumn and spring in the Spanish natural stand, and between autumn and summer in the Spanish plantation, whereas in the Chilean plantations, it occurred during the whole year. In the case of mean temperature, in both countries, correlations were positive in winter and negative in spring and summer.
Stands located in both countries showed different responses to rainfall, temperature, and SPEI. Growth was more sensitive to climate, particularly to drought, in Chilean plantations than in the Spanish stands. Significant positive correlations between RWI and SPEI1 were found in both countries, whereas in Chilean plantations, the SPEI6 presented negative correlations. The correlation between SPEI and RWI showed different patterns between and within countries.
In stone pine, a previous study conducted in coastal areas of Italy and Greece reported that SPEI performed better than rainfall as a short-term driver for tree growth under dry climate, suggesting that temperature plays a secondary role as compared to rainfall [43]. In our study, the opposite was found for the Chilean plantations, with rainfall performing better than either SPEI1 or SPEI6. The same authors indicated that rainfall accumulated over 1 to 2 years in dry sites and over 3 to 6 years in wet sites is a key driver of stone pine radial growth, which is probably linked to fluctuating water table levels [43]; thus, future studies including rainfall accumulated over 1 to 6 years could provide new insights.
A stone pine isohydric (drought-avoiding) strategy and xylem plasticity were found to provide a competitive advantage under moderate water shortage compared to other pines [56]. No differences have been reported in the growth responses to drought between natural and planted P. pinea forests, but resistance to drought was reported to be higher in natural forests than in plantations [42].
A negative impact of summer temperature was found only in one out of five Chilean plantations (CH4) and in the Spanish plantation (SP1), showing a pattern similar to a previously reported one [42]. It should be noted that canopy dieback and drought-induced mortality are currently affecting some stands in the SP1 site, characterized by poor access to shallow water pools (JJC, pers. comm.). The different responses of RWI to both rainfall and temperature in Chilean plantations suggest site-specific climate patterns, with a trend in greater control by climate in arid sites than in humid sites, as previously reported [8]. Site-specific variables, such as slope, soil type, tree density, and tree genetic origin, may either buffer [57] or exacerbate climate effects on tree growth.
A study carried out in different European countries showed that productivity in the driest site was low and explained by consecutive years of rainfall signals [43], suggesting that tree growth was sustained mostly by soil moisture stored in the top layers from recent rainfall, a typical behavior of shallow-rooted conifers [58]. This behavior may explain the species’ vulnerability to drought stress, particularly under low rainfall, with the consequent drop in water table levels. Overall, our studied plantations did not show higher sensitivity to climate variability than the natural stand and, therefore, may be useful to assist in mitigating climate change.
Both naturally regenerated and planted stone pine stands are under threat due to the increasing occurrence and severity of droughts, a trend that will continue in the medium and long term [41]. To cope with those challenges, adequate management is crucial to preserve stone pine stands, including stand density reduction through thinning to reduce competition [57], fertilization, or even irrigation in extreme cases [59]. Regarding patterns in climate–growth relationships, the relevance of using multi-annual climatic signals in explaining growth variability reported by recent studies [43] suggests the convenience of conducting other analyses besides BAI, such as resilience indices.
5. Conclusions
We found heterogeneity in growth responses to climate within and between countries and forest types. In particular, P. pinea plantations did not show higher sensitivity to climate than the natural stands and, therefore, may be useful to assist in mitigating climate change. However, both natural and planted stands will be threatened by the more arid conditions caused by climate warming.
The comparative analysis of the growth of P. pinea plantations revealed differences influenced by environmental conditions and forest management in the two regions. In both countries, P. pinea trees are well adapted to the Mediterranean climate characterized by hot, dry summers and mild, wet winters but are facing growth challenges due to increasing drought stress. To enhance the sustainability and productivity of P. pinea plantations in Chile, our results suggest implementing adaptive management strategies that account for regional climatic conditions, including the optimization of management practices. Establishing comprehensive monitoring systems to continually assess tree growth, health, and productivity in plantations could be essential for making informed management decisions and adapting practices to a global change context.
Supplementary Materials
The following supporting information can be downloaded at: https://www.mdpi.com/article/10.3390/biology13080628/s1, Figure S1. Fitted diameter growth curves by forest types and study sites, and derived diameter growth rates of Pinus pinea at Spain and Chile. Forest type: N, Natural; P, Planted. Table S1. ANOVA statistics for basal area increment (BAI), basal area increment in the last 20 years (BAI20) and cumulative radial growth (CG).
Author Contributions
Conceptualization, R.M.N.-C. and V.L.-M.; methodology, A.M.C.-V.; software, A.M.C.-V.; validation, A.M.C.-V. and R.D.R.; analysis, V.L.-M., J.J.C. and R.M.N.-C.; resources, V.L.-M. and R.M.N.-C.; writing—original draft preparation, R.M.N.-C. and V.L.-M.; writing—review and editing, C.D. and R.D.R.; visualization, A.M.C.-V. and R.D.R. All authors have read and agreed to the published version of the manuscript.
Funding
This research was funded by ANID BASAL FB210015 (CENAMAD); by the program “Development and contributions for the use of high value forest and fruit-forest species for Chile”, Ministry of Agriculture; and by SILVADAPT.NET (RED2018-102719-T) Ministerio de Ciencia, Innovación y Universidades (Spain).
Institutional Review Board Statement
Not applicable.
Informed Consent Statement
Not applicable.
Data Availability Statement
The raw data supporting the conclusions of this article will be made available by the authors upon request.
Acknowledgments
Jorgelina Brasca edited the English style.
Conflicts of Interest
The funders played no role in the design of the study; in the collection, analyses, or interpretation of data; in the writing of the manuscript; or in the decision to publish the results.
References
- IPCC Summary for Policymakers. In Climate Change 2022—Impacts, Adaptation and Vulnerability; Cambridge University Press: Cambridge, UK; New York, NY, USA, 2022; pp. 3–34.
- Zhao, X.; Chen, F.; Seim, A.; Hu, M.; Akkemik, Ü.; Kopabayeva, A.; Mazarzhanova, K.; Zhang, R.; Maisupova, B.; Kirillov, V.; et al. Global Warming Leads to Growth Increase in Pinus sylvestris in the Kazakh Steppe. For. Ecol. Manag. 2024, 553, 121635. [Google Scholar] [CrossRef]
- Mechergui, K.; Saleh Altamimi, A.; Jaouadi, W.; Naghmouchi, S. Climate Change Impacts on Spatial Distribution, Tree-Ring Growth, and Water Use of Stone Pine (Pinus pinea L.) Forests in the Mediterranean Region and Silvicultural Practices to Limit Those Impacts. iForest Biogeosciences For. 2021, 14, 104–112. [Google Scholar] [CrossRef]
- Sánchez-Salguero, R.; Camarero, J.J.; Dobbertin, M.; Fernández-Cancio, Á.; Vilà-Cabrera, A.; Manzanedo, R.D.; Zavala, M.A.; Navarro-Cerrillo, R.M. Contrasting Vulnerability and Resilience to Drought-Induced Decline of Densely Planted vs. Natural Rear-Edge Pinus Nigra Forests. For. Ecol. Manag. 2013, 310, 956–967. [Google Scholar] [CrossRef]
- Valeriano, C.; Gazol, A.; Colangelo, M.; González de Andrés, E.; Camarero, J.J. Modeling Climate Impacts on Tree Growth to Assess Tree Vulnerability to Drought During Forest Dieback. Front. Plant Sci. 2021, 12, 672855. [Google Scholar] [CrossRef]
- Arend, M.; Link, R.M.; Patthey, R.; Hoch, G.; Schuldt, B.; Kahmen, A. Rapid Hydraulic Collapse as Cause of Drought-Induced Mortality in Conifers. Proc. Natl. Acad. Sci. USA 2021, 118, 2025251118. [Google Scholar] [CrossRef]
- Milano, M.; Ruelland, D.; Fernandez, S.; Dezetter, A.; Fabre, J.; Servat, E. Facing Climatic and Anthropogenic Changes in the Mediterranean Basin: What Will Be the Medium-Term Impact on Water Stress? Comptes rendus. Géoscience 2012, 344, 432–440. [Google Scholar] [CrossRef]
- Mazza, G.; Cutini, A.; Manetti, M.C. Site-Specific Growth Responses to Climate Drivers of Pinus pinea L. Tree Rings in Italian Coastal Stands. Ann. For. Sci. 2014, 71, 927–936. [Google Scholar] [CrossRef]
- Peñuelas, J.; Sardans, J.; Filella, I.; Estiarte, M.; Llusià, J.; Ogaya, R.; Carnicer, J.; Bartrons, M.; Rivas-Ubach, A.; Grau, O.; et al. Impacts of Global Change on Mediterranean Forests and Their Services. Forests 2017, 8, 463. [Google Scholar] [CrossRef]
- Cutini, A. Pinus pinea L. In Pines of Silvicultural Importance; CABI, Ed.; CABI Publishing: New York, NY, USA, 2002; pp. 329–343. ISBN 0 85199 539 X. [Google Scholar]
- Perdiguero, P.; Soto, Á.; Collada, C. Comparative Analysis of Pinus pinea and Pinus pinaster Dehydrins under Drought Stress. Tree Genet. Genomes 2015, 11, 70. [Google Scholar] [CrossRef]
- Freire, J.A.; Rodrigues, G.C.; Tomé, M. Climate Change Impacts on Pinus pinea L. Silvicultural System for Cone Production and Ways to Contour Those Impacts: A Review Complemented with Data from Permanent Plots. Forests 2019, 10, 169. [Google Scholar] [CrossRef]
- Sülüsoglu, M. The Management of Villagers Owned Stone Pine (Pinus pinea L.) Plantations in Kozak Region, Turkey, a Case Study; FAO Working Paper; FAO: Rome, Italy, 2004. [Google Scholar]
- Pardos, M.; Calama, R.; Mayoral, C.; Madrigal, G.; Sanchez-Gonzalez, M. Addressing Post-Transplant Summer Water Stress in Pinus pinea and Quercus ilex Seedlings. iForest Biogeosciences For. 2015, 8, 348–358. [Google Scholar] [CrossRef]
- Montero, G.; Calama, R.; Ruiz, R. Selvicoltura de Pinus pinea L. In Compendio de Selvicoltura de Especies; Montero, G., Serrada, R., Reque, J., Eds.; INIA-Fundación Conde del Valle de Salazar: Madrid, Spain, 2008; pp. 431–470. [Google Scholar]
- Natalini, F.; Alejano, R.; Pardos, M.; Calama, R.; Vázquez-Piqué, J. Declining Trends in Long-Term Pinus pinea L. Growth Forecasts in Southwestern Spain. Dendrochronologia 2024, 88, 126252. [Google Scholar] [CrossRef]
- Calama, R.; Montero, G. Cone and Seed Production from Stone Pine (Pinus pinea L.) Stands in Central Range (Spain). Eur. J. For. Res. 2006, 126, 23–35. [Google Scholar] [CrossRef]
- Vallejo, R. Tercer Inventario Forestal Nacional. Ministerio de Agricultura, Alimentación y Medio Ambiente (España/Spain). Version 1.6. Available online: https://www.gbif.org/es/dataset/fab4c599-802a-4bfc-8a59-fc7515001bfa# (accessed on 30 July 2024).
- Garfì, V.; Garfì, G. Differential Tree Growth Response to Management History and Climate in Multi-Aged Stands of Pinus pinea L. Plants 2023, 13, 61. [Google Scholar] [CrossRef]
- Abad Viñas, R.; Caudullo, G.; Oliveira, S.; de Rigo, D. Pinus pinea in Europe: Distribution, Habitat, Usage and Threats. In European Atlas of Forest Tree Species; San-Miguel-Ayanz, J., de Rigo, D., Caudullo, G., Houston Durrant, T., Mauri, A., Eds.; Publication; Office of the European Union: Luxembourg, 2016; p. e01b4fc+. [Google Scholar]
- Harris, I.; Jones, P.D.; Osborn, T.J.; Lister, D.H. Updated High-resolution Grids of Monthly Climatic Observations—The CRU TS3.10 Dataset. Int. J. Climatol. 2014, 34, 623–642. [Google Scholar] [CrossRef]
- Maxwell, R.S.; Larsson, L.-A. Measuring Tree-Ring Widths Using the CooRecorder Software Application. Dendrochronologia 2021, 67, 125841. [Google Scholar] [CrossRef]
- Holmes, R. Computer Assisted Quality Control in Treering Dating and Measurement. Tree-Ring Bull. 1983, 43, 69–78. [Google Scholar]
- Schulman, E. Dendroclimatic Changes in Semiarid America; University of Arizona Press: Tucson, AZ, USA, 1956. [Google Scholar]
- Schöngart, J.; Wittmann, F.; Worbes, M.; Piedade, M.T.F.; Krambeck, H.-J.; Junk, W.J. Management Criteria for Ficus insipida Willd. (Moraceae) in Amazonian White-Water Floodplain Forests Defined by Tree-Ring Analysis. Ann. For. Sci. 2007, 64, 657–664. [Google Scholar] [CrossRef]
- Worbes, M.; Schöngart, J. Measures for Sustainable Forest Management in the Tropics—A Tree-Ring Based Case Study on Tree Growth and Forest Dynamics in a Central Amazonian Lowland Moist Forest. PLoS ONE 2019, 14, e0219770. [Google Scholar] [CrossRef]
- Loader, C. Local Regression and Likelihood; Statistics and Computing; Springer: New York, NY, USA, 1999; ISBN 978-0-387-98775-0. [Google Scholar]
- Bunn, A.G. Statistical and Visual Crossdating in R Using the DplR Library. Dendrochronologia 2010, 28, 251–258. [Google Scholar] [CrossRef]
- R Development Core Team R: A Language and Environment for Statistical Computing; Foundation for Statistical Computing: Vienna, Austria, 2022.
- Fritts, H. Tree Rings and Climate; Academic Press: New York, NY, USA, 1976. [Google Scholar]
- Wigley, T.M.L.; Briffa, K.R.; Jones, P.D. On the Average Value of Correlated Time Series, with Applications in Dendroclimatology and Hydrometeorology. J. Clim. Appl. Meteorol. 1984, 23, 201–213. [Google Scholar] [CrossRef]
- Briffa, K.R.; Jones, P.D. Basic Chronology Statistics and Assessment. In Methods of Dendrochronology: Applications in the Environmental Sciences; Cook, E.R., Kairiukstis, L.A., Eds.; Kluwer Academic Publishers: Dordrecht, The Netherlands, 1990; pp. 137–152. ISBN 978-0-7923-0586-6. [Google Scholar]
- Funk, C.; Peterson, P.; Landsfeld, M.; Pedreros, D.; Verdin, J.; Shukla, S.; Husak, G.; Rowland, J.; Harrison, L.; Hoell, A.; et al. The Climate Hazards Infrared Precipitation with Stations—A New Environmental Record for Monitoring Extremes. Sci. Data 2015, 2, 150066. [Google Scholar] [CrossRef]
- Vicente-Serrano, S.M.; Beguería, S.; López-Moreno, J.I. A Multiscalar Drought Index Sensitive to Global Warming: The Standardized Precipitation Evapotranspiration Index. J. Clim. 2010, 23, 1696–1718. [Google Scholar] [CrossRef]
- Zang, C.; Biondi, F. Treeclim: An R Package for the Numerical Calibration of Proxy-climate Relationships. Ecography 2015, 38, 431–436. [Google Scholar] [CrossRef]
- Efron, B.; Tibshirani, R.J. An Introduction to the Bootstrap, 1st ed.; Chapman and Hall/CRC: New York, NY, USA, 1994; ISBN 9780429246593. [Google Scholar]
- Yu Karpukhin, M.; Yussef, A.M. Electing Drought-Resistant Pinus pinea L. (Stone Pine) Using Dendroclimatology. IOP Conf. Ser. Earth Environ. Sci. 2021, 699, 012051. [Google Scholar] [CrossRef]
- Akkemik, Ü. Dendroclimatology of Umbrella Pine (Pinus pinea L.) in Istanbul, Turkey. Tree-Ring Bull. 2000, 56, 17–20. [Google Scholar]
- Piraino, S.; Roig, F.A. Spring-Summer Drought Induces Extremely Low Radial Growth Reactions in North-Tyrrhenian Pinus pinea L. Floresta e Ambient. 2020, 27, 20180303. [Google Scholar] [CrossRef]
- Loewe-Muñoz, V.; Balzarini, M.; Delard, C.; Del Río, R.; Álvarez, A. Inter-Annual Variability of Pinus pinea L. Cone Productivity in a Non-Native Habitat. New For. 2020, 51, 1055–1068. [Google Scholar] [CrossRef]
- Balekoglu, S.; Caliskan, S.; Dirik, H.; Rosner, S. Response to Drought Stress Differs among Pinus pinea Provenances. For. Ecol. Manag. 2023, 531, e120779. [Google Scholar] [CrossRef]
- Camarero, J.J.; Gazol, A.; Linares, J.C.; Fajardo, A.; Colangelo, M.; Valeriano, C.; Sánchez-Salguero, R.; Sangüesa-Barreda, G.; Granda, E.; Gimeno, T.E. Differences in Temperature Sensitivity and Drought Recovery between Natural Stands and Plantations of Conifers Are Species-Specific. Sci. Total Environ. 2021, 796, 148930. [Google Scholar] [CrossRef]
- Mazza, G.; Sarris, D. Identifying the Full Spectrum of Climatic Signals Controlling a Tree Species’ Growth and Adaptation to Climate Change. Ecol. Indic. 2021, 130, 108109. [Google Scholar] [CrossRef]
- Trowbridge, A.M.; Adams, H.D.; Collins, A.; Dickman, L.T.; Grossiord, C.; Hofland, M.; Malone, S.; Weaver, D.K.; Sevanto, S.; Stoy, P.C.; et al. Hotter Droughts Alter Resource Allocation to Chemical Defenses in Piñon Pine. Oecologia 2021, 197, 921–938. [Google Scholar] [CrossRef]
- Sohn, J.A.; Saha, S.; Bauhus, J. Potential of Forest Thinning to Mitigate Drought Stress: A Meta-Analysis. For. Ecol. Manag. 2016, 380, 261–273. [Google Scholar] [CrossRef]
- IPCC. Climate Change and Land: An IPCC Special Report on Climate Change, Desertification, Land Degradation, Sustainable Land Management, Food Security, and Greenhouse Gas Fluxes in Terrestrial Ecosystems; IPCC: Cambridge, UK; New York, NY, USA, 2019. [Google Scholar]
- Giorgi, F.; Lionello, P. Climate Change Projections for the Mediterranean Region. Glob. Planet. Chang. 2008, 63, 90–104. [Google Scholar] [CrossRef]
- Loewe-Muñoz, V.; del Río, R.; Delard, C.; Balzarini, M. Short-Term Stem Diameter Variations in Irrigated and Non-Irrigated Stone Pine (Pinus pinea L.) Trees in a Xeric Non-Native Environment. Ann. For. Sci. 2021, 78, 99. [Google Scholar] [CrossRef]
- Luyssaert, S.; Marie, G.; Valade, A.; Chen, Y.-Y.; Njakou Djomo, S.; Ryder, J.; Otto, J.; Naudts, K.; Lansø, A.S.; Ghattas, J.; et al. Trade-Offs in Using European Forests to Meet Climate Objectives. Nature 2018, 562, 259–262. [Google Scholar] [CrossRef] [PubMed]
- Navarro-Cerrillo, R.; Rodriguez-Vallejo, C.; Silveiro, E.; Hortal, A.; Palacios-Rodríguez, G.; Duque-Lazo, J.; Camarero, J. Cumulative Drought Stress Leads to a Loss of Growth Resilience and Explains Higher Mortality in Planted than in Naturally Regenerated Pinus Pinaster Stands. Forests 2018, 9, 358. [Google Scholar] [CrossRef]
- de Luis, M.; Novak, K.; Raventós, J.; Gričar, J.; Prislan, P.; Čufar, K. Climate Factors Promoting Intra-Annual Density Fluctuations in Aleppo Pine (Pinus halepensis) from Semiarid Sites. Dendrochronologia 2011, 29, 163–169. [Google Scholar] [CrossRef]
- Battisti, A.; Stastny, M.; Netherer, S.; Robinet, C.; Schopf, A.; Roques, A.; Larsson, S. Expansion of Geographic Range in the Pine Processionary Moth Caused by Increased Winter Temperatures. Ecol. Appl. 2005, 15, 2084–2096. [Google Scholar] [CrossRef]
- Calama, R.; De-Dios-García, J.; del Río, M.; Madrigal, G.; Gordo, J.; Pardos, M. Mixture Mitigates the Effect of Climate Change on the Provision of Relevant Ecosystem Services in Managed Pinus pinea L. Forests. For. Ecol. Manag. 2021, 481, 118782. [Google Scholar] [CrossRef]
- Cherubini, P.; Fontana, G.; Rigling, D.; Dobbertin, M.; Brang, P.; Innes, J.L. Tree-life History Prior to Death: Two Fungal Root Pathogens Affect Tree-ring Growth Differently. J. Ecol. 2002, 90, 839–850. [Google Scholar] [CrossRef]
- Zavala, M.A.; Angulo, Ó.; de la Parra, R.B.; Moreno-Fernández, D.; Madrigal-González, J. Scaling up Tree Growth to Assess Forest Resilience under Increasing Aridity: The Case of Iberian Dry-Edge Pine Forests. Landsc. Ecol. 2024, 39, 6. [Google Scholar] [CrossRef]
- Férriz, M.; Martin-Benito, D.; Fernández-de-Simón, M.B.; Conde, M.; García-Cervigón, A.I.; Aranda, I.; Gea-Izquierdo, G. Functional Phenotypic Plasticity Mediated by Water Stress and [CO2] Explains Differences in Drought Tolerance of Two Phylogenetically Close Conifers. Tree Physiol. 2023, 43, 909–924. [Google Scholar] [CrossRef] [PubMed]
- Navarro-Cerrillo, R.M.; Sánchez-Salguero, R.; Rodriguez, C.; Duque Lazo, J.; Moreno-Rojas, J.M.; Palacios-Rodriguez, G.; Camarero, J.J. Is Thinning an Alternative When Trees Could Die in Response to Drought? The Case of Planted Pinus nigra and P. sylvestris Stands in Southern Spain. For. Ecol. Manag. 2019, 433, 313–324. [Google Scholar] [CrossRef]
- Zhang, X.; Ma, Y.; Fu, S.; Qian, J.; Zhu, Q.; Feng, C.; Li, Z.; Zhu, W.; Chen, H. Effect and Mechanisms of Conifer and Broadleaf Mixtures on the Soil Characteristics in Limestone Mountains. Turk. J. Agric. For. 2024, 48, 199–211. [Google Scholar] [CrossRef]
- Loewe-Muñoz, V.; del Rio, R.; Delard, C.; Balzarini, M. Irrigation and Fertilization as Tools to Boost Growth Stability of Stone Pine (Pinus pinea L.) Plantations. For. Ecol. Manag. 2020, 463, 118017. [Google Scholar] [CrossRef]
Disclaimer/Publisher’s Note: The statements, opinions and data contained in all publications are solely those of the individual author(s) and contributor(s) and not of MDPI and/or the editor(s). MDPI and/or the editor(s) disclaim responsibility for any injury to people or property resulting from any ideas, methods, instructions or products referred to in the content. |
© 2024 by the authors. Licensee MDPI, Basel, Switzerland. This article is an open access article distributed under the terms and conditions of the Creative Commons Attribution (CC BY) license (https://creativecommons.org/licenses/by/4.0/).