

Low Magnetic Field Exposure Alters Prostate Cancer Cell Properties

 , , ,
, , , 
Abstract
:Simple Summary
Abstract
1. Introduction
2. Materials and Methods
2.1. Cell Culture
2.2. Magnetic Shielding—Extremely Low Magnetic/Hypomagnetic Treatment
2.3. RNA Extraction and qRT-PCR
2.4. EV Isolation and Characterisation
2.5. Liquid Chromatography with Tandem Mass Spectrometry (LC-MS/MS) and STRING Protein–Protein Interaction Network Analysis
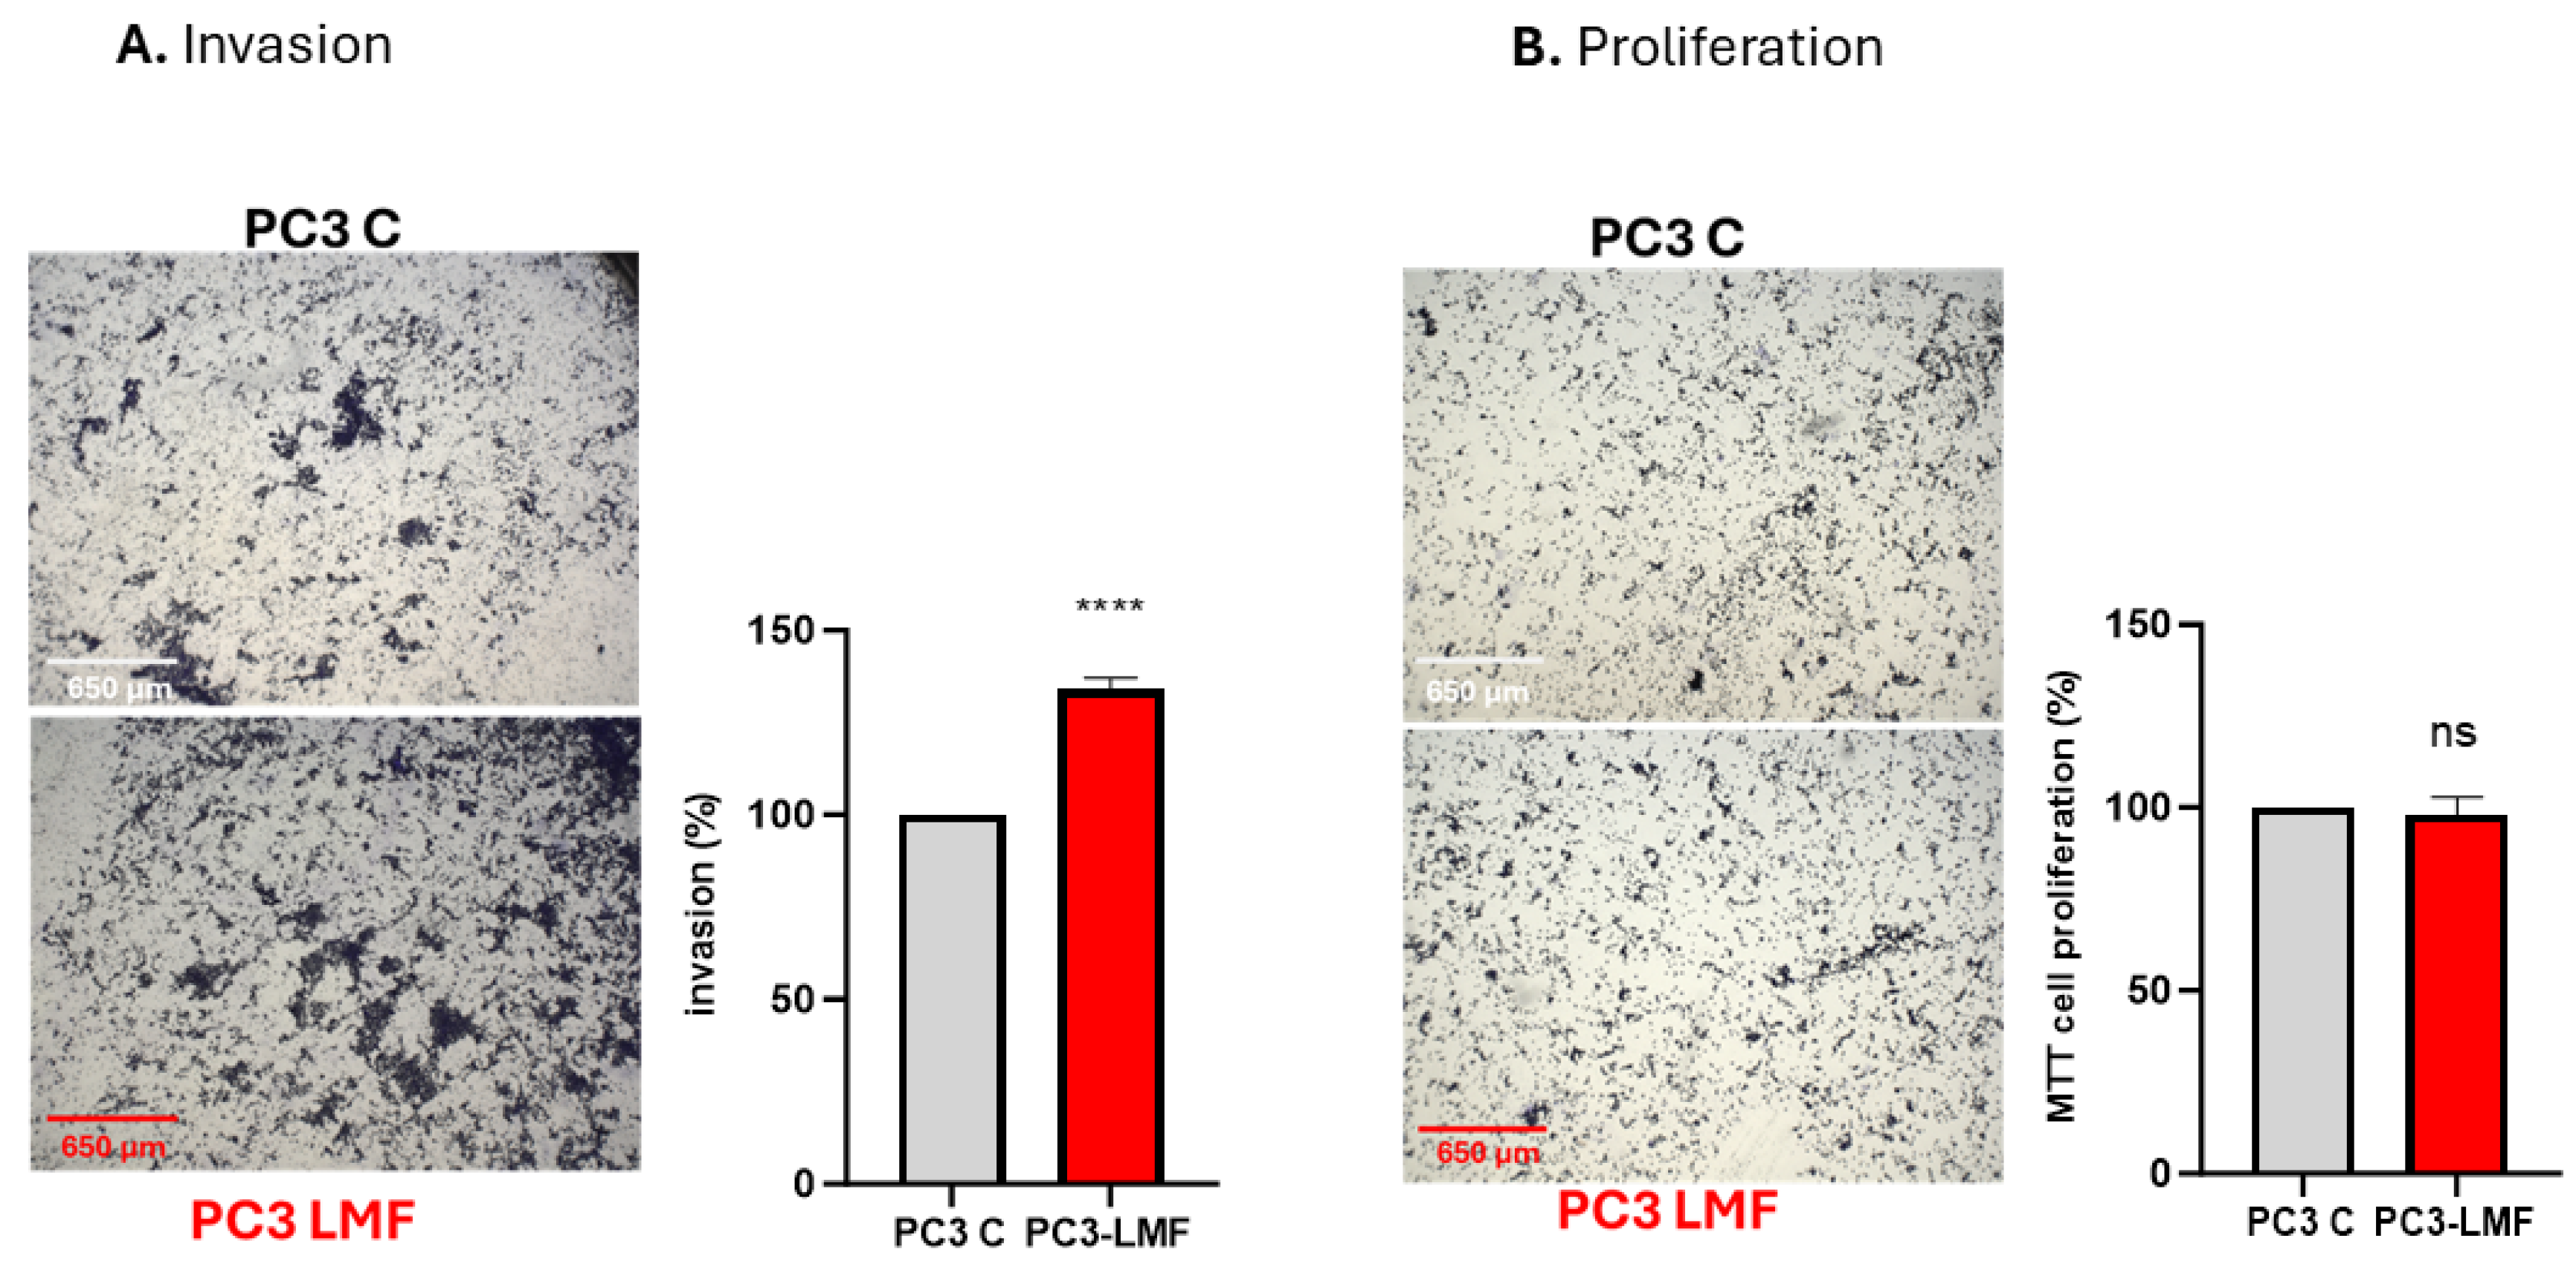
2.6. Assays for Cellular Invasion and Proliferation
2.7. Data Analysis
3. Results
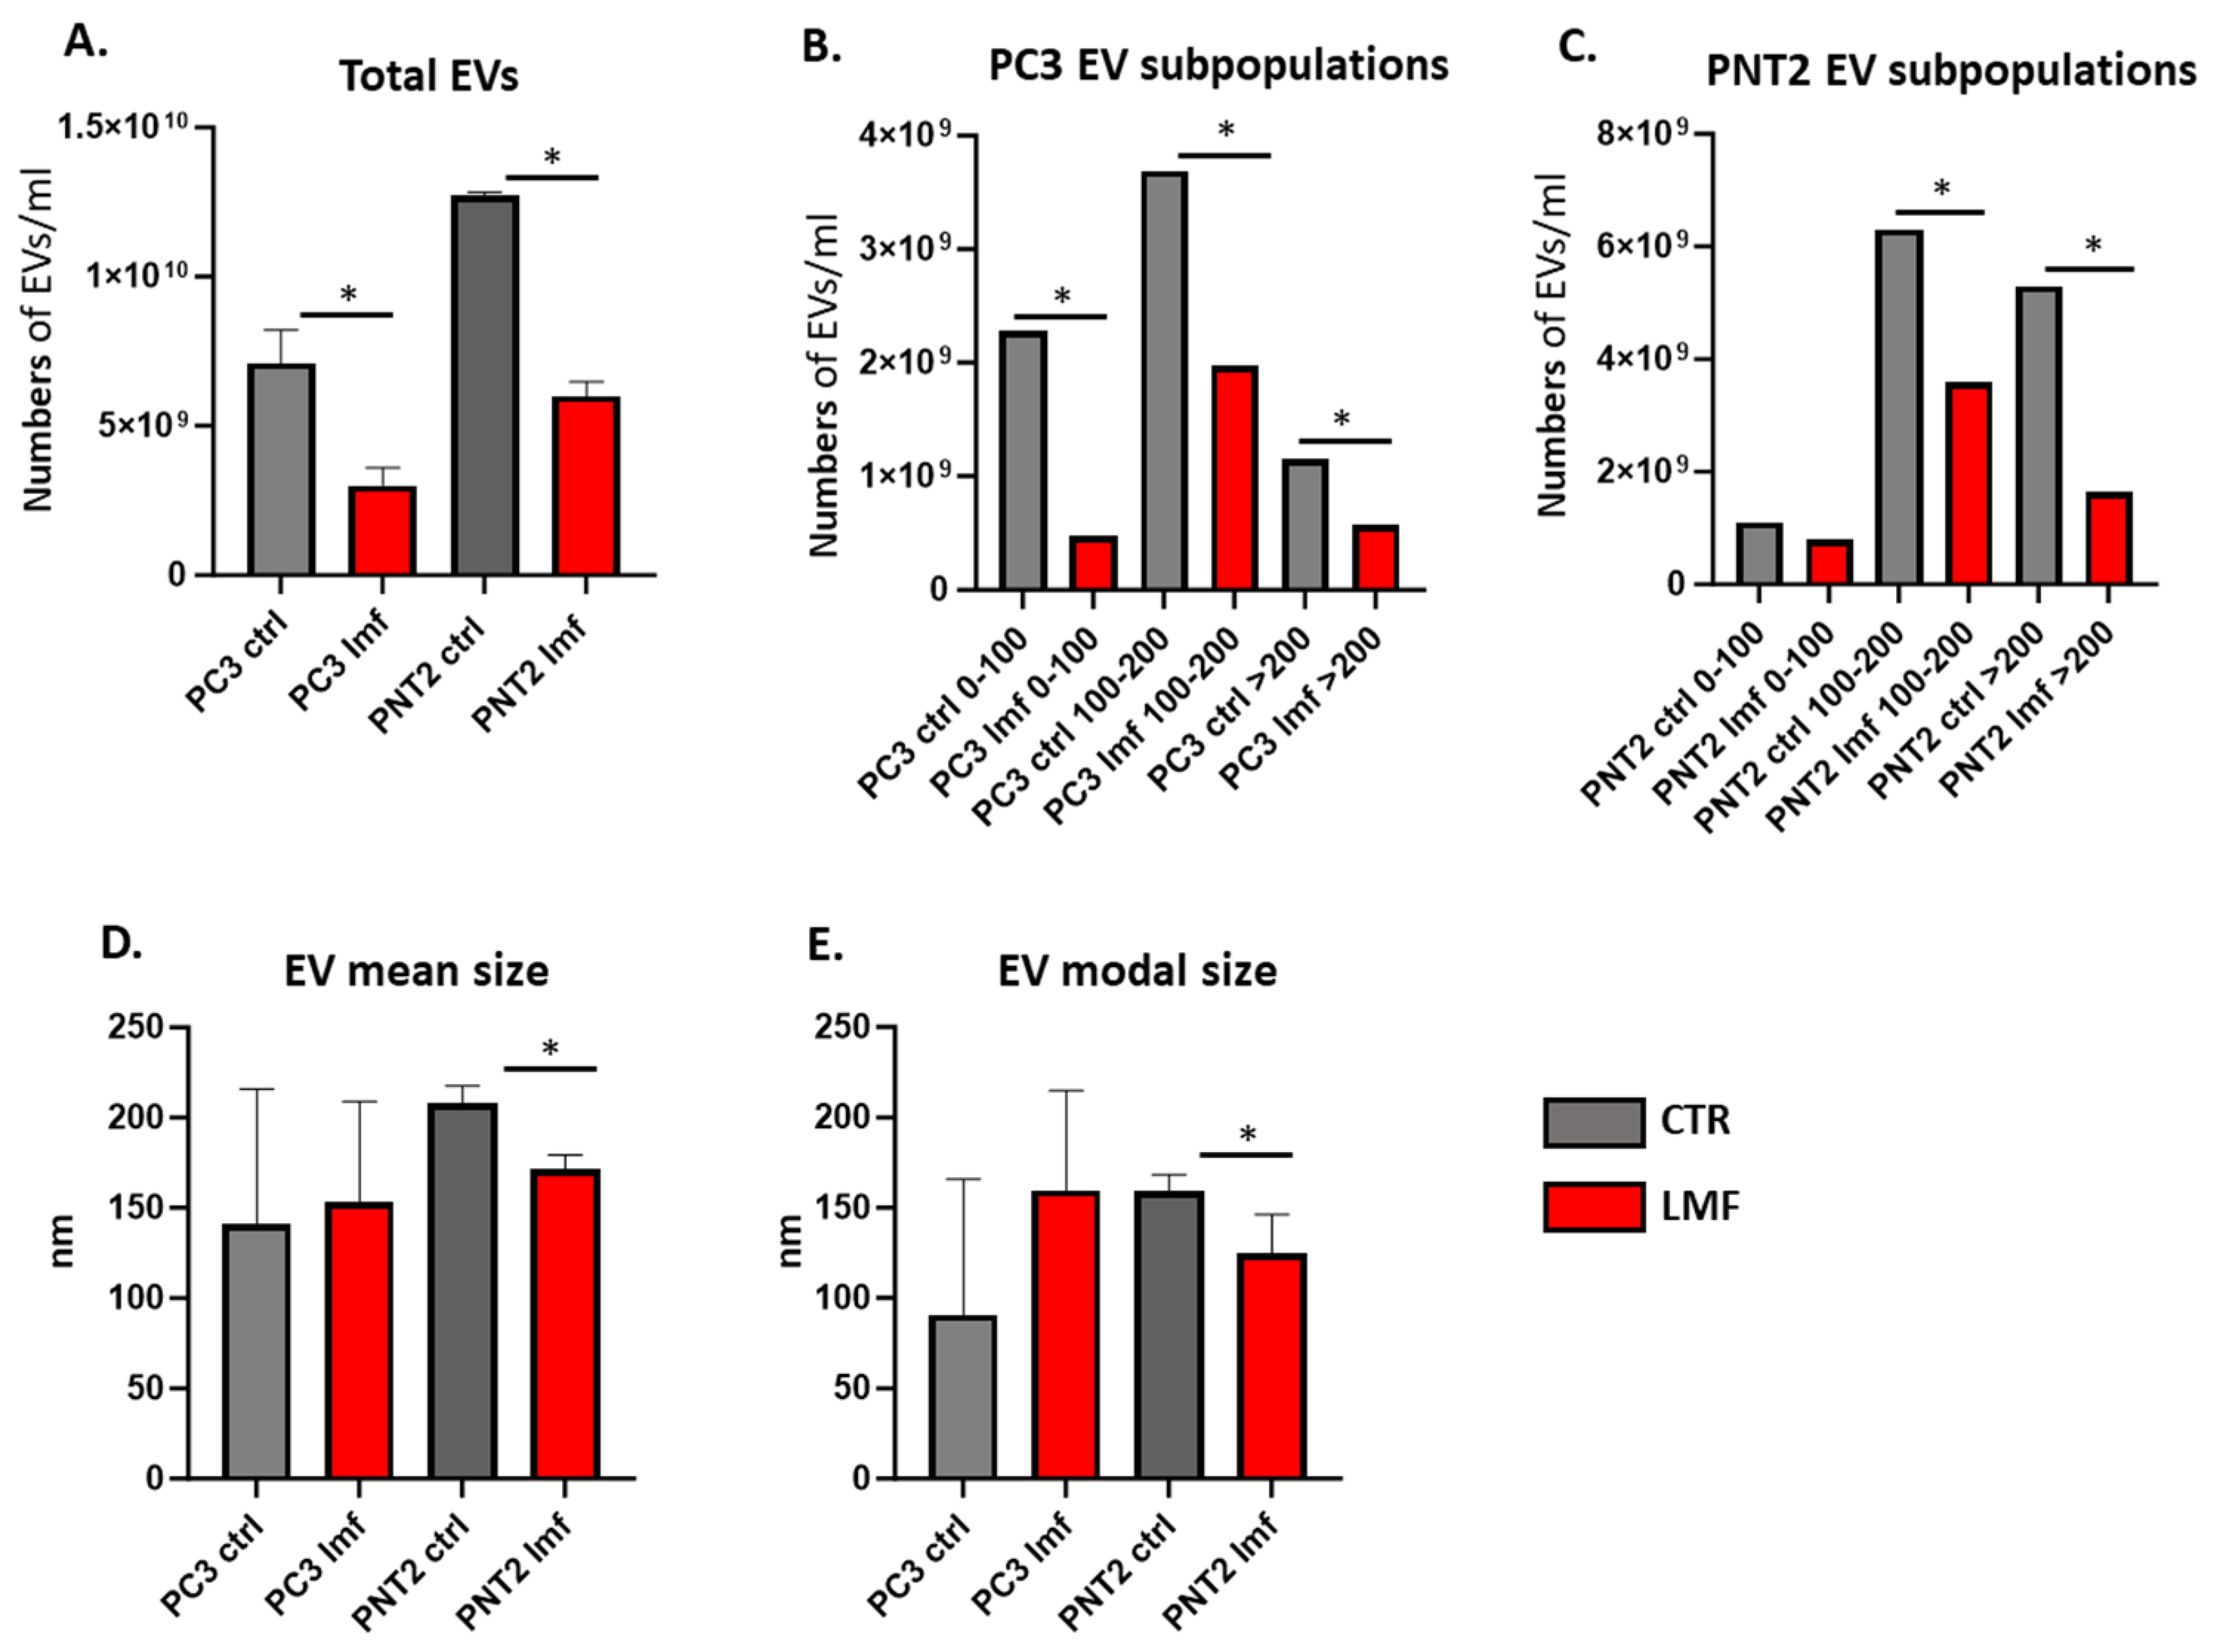
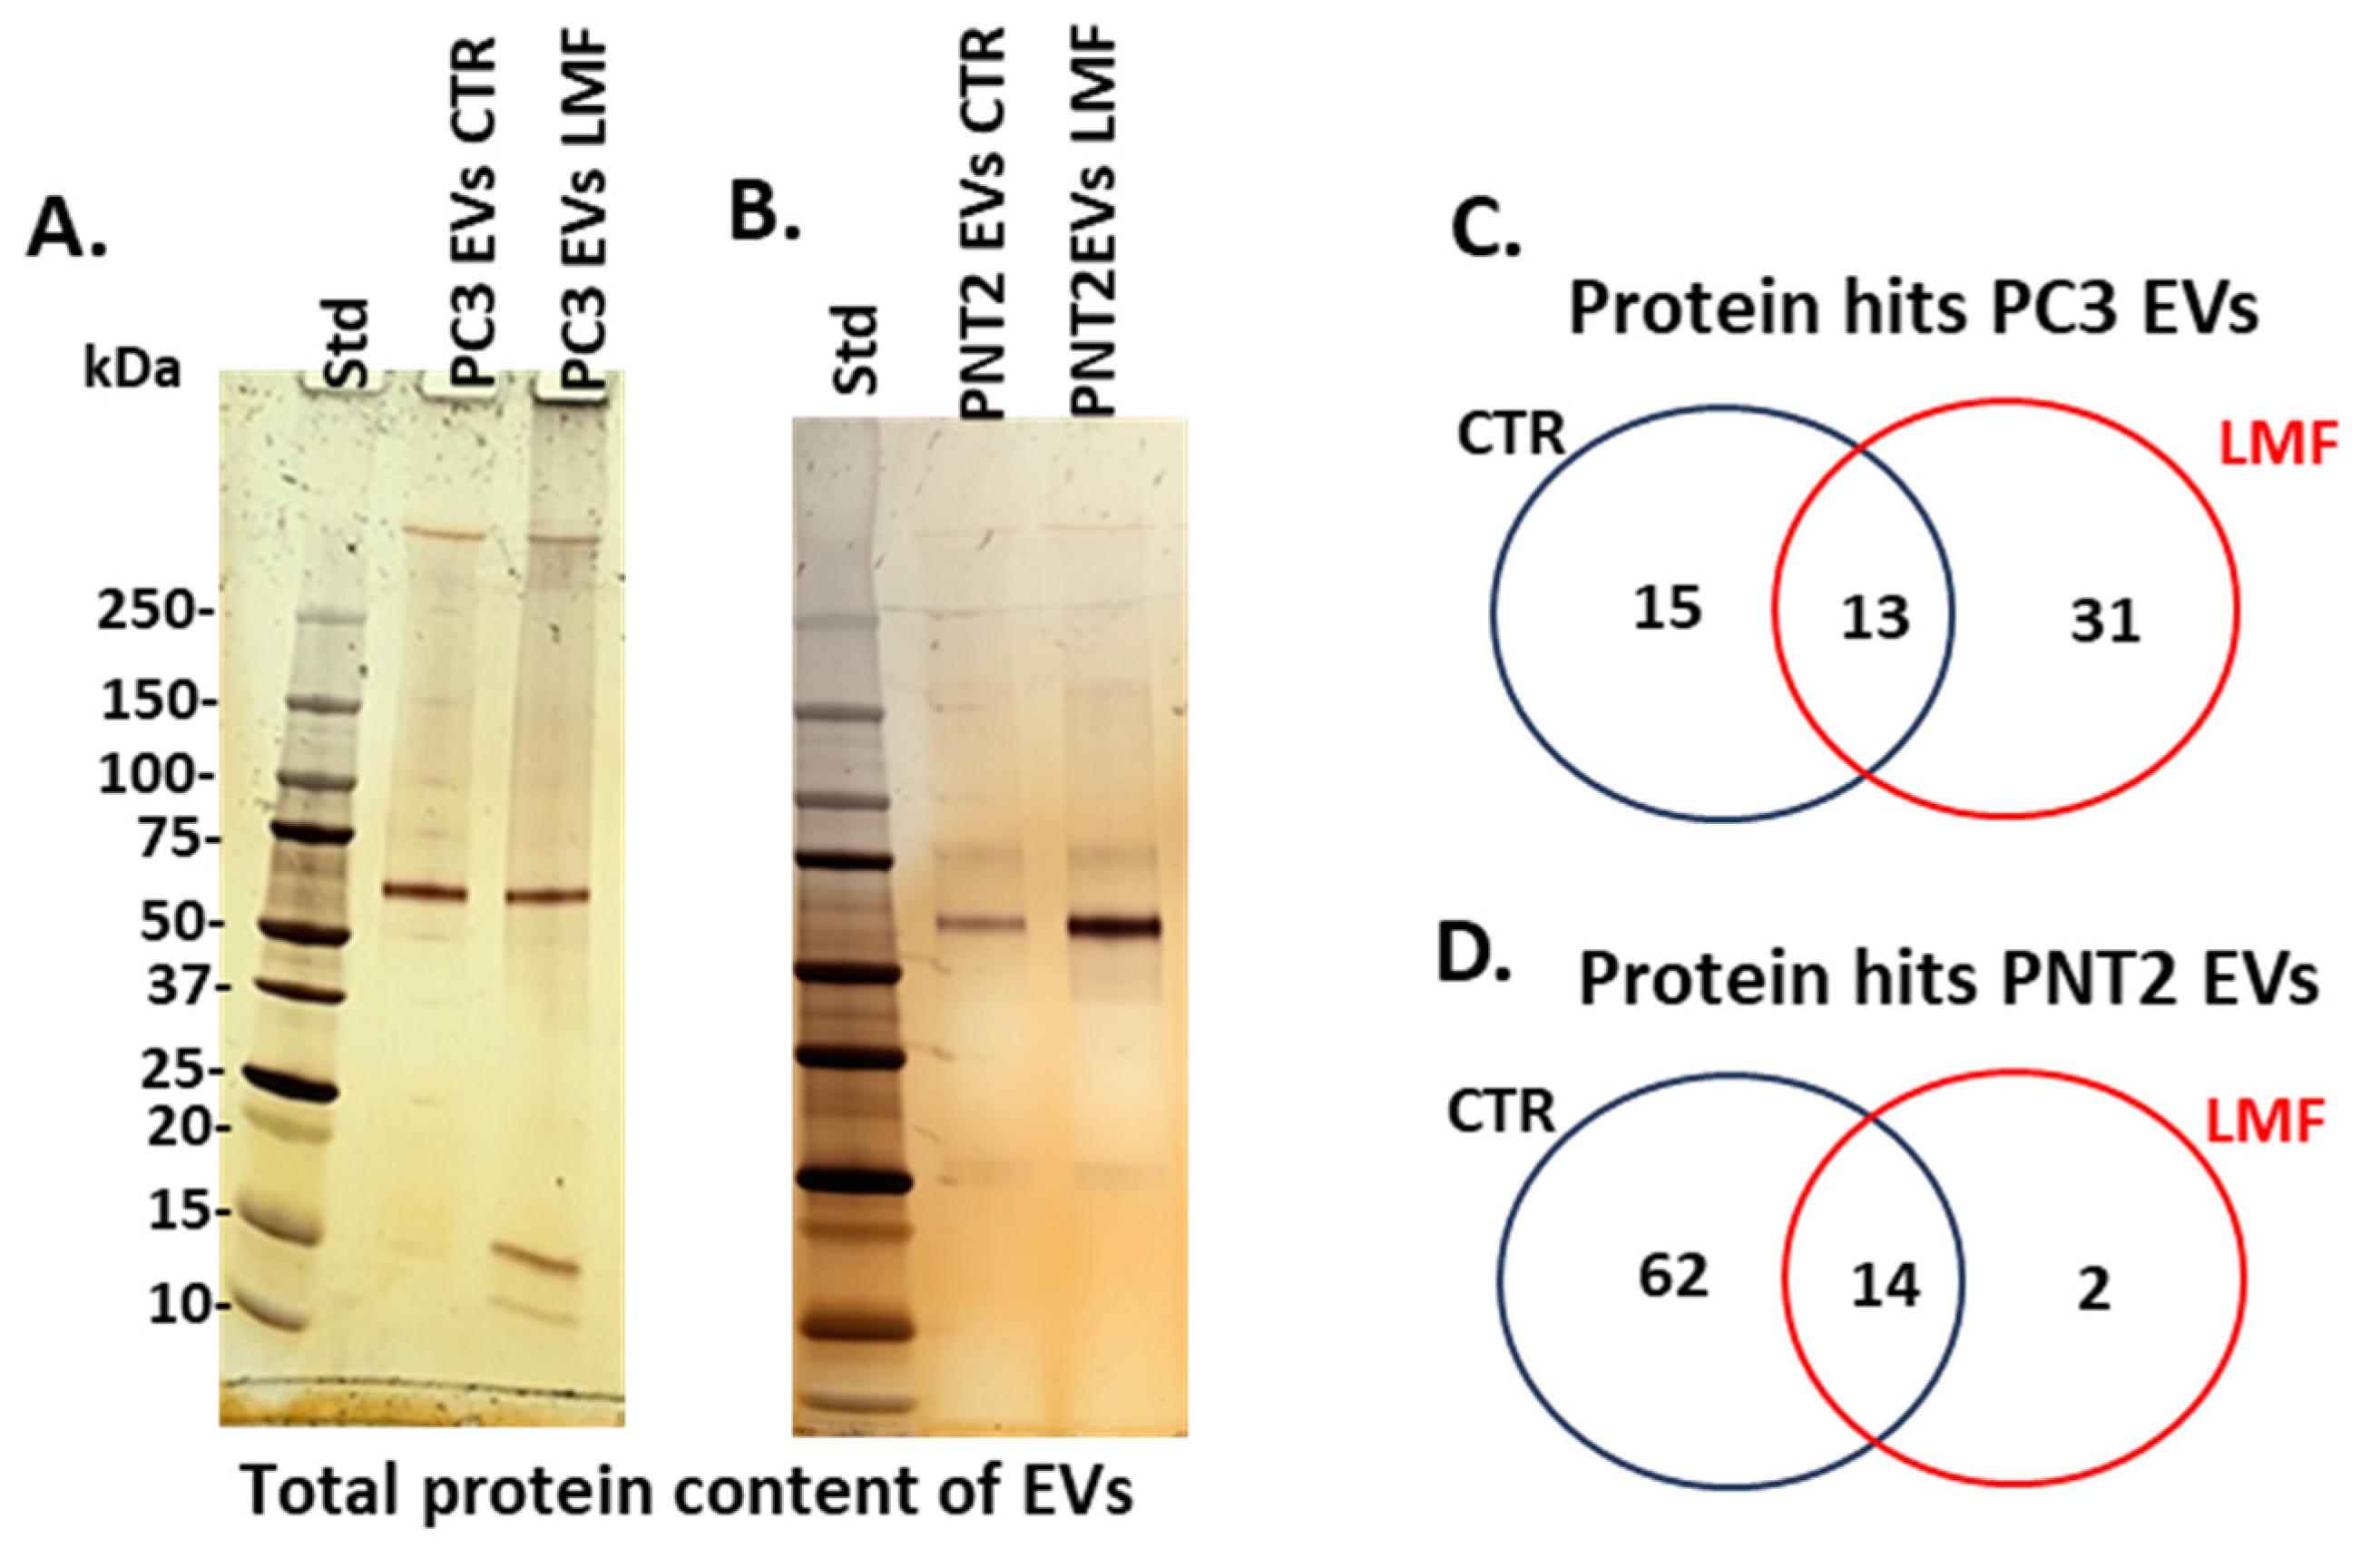
3.1. EV Profiles from PC3 and PNT2 Cells Were Modified in Response to 4 h LMF Exposure
3.2. Proteomic EV Cargoes Showed a Shift to More Pro-Cancerous Signature in PC3 Cells Following 4 h LMF Exposure
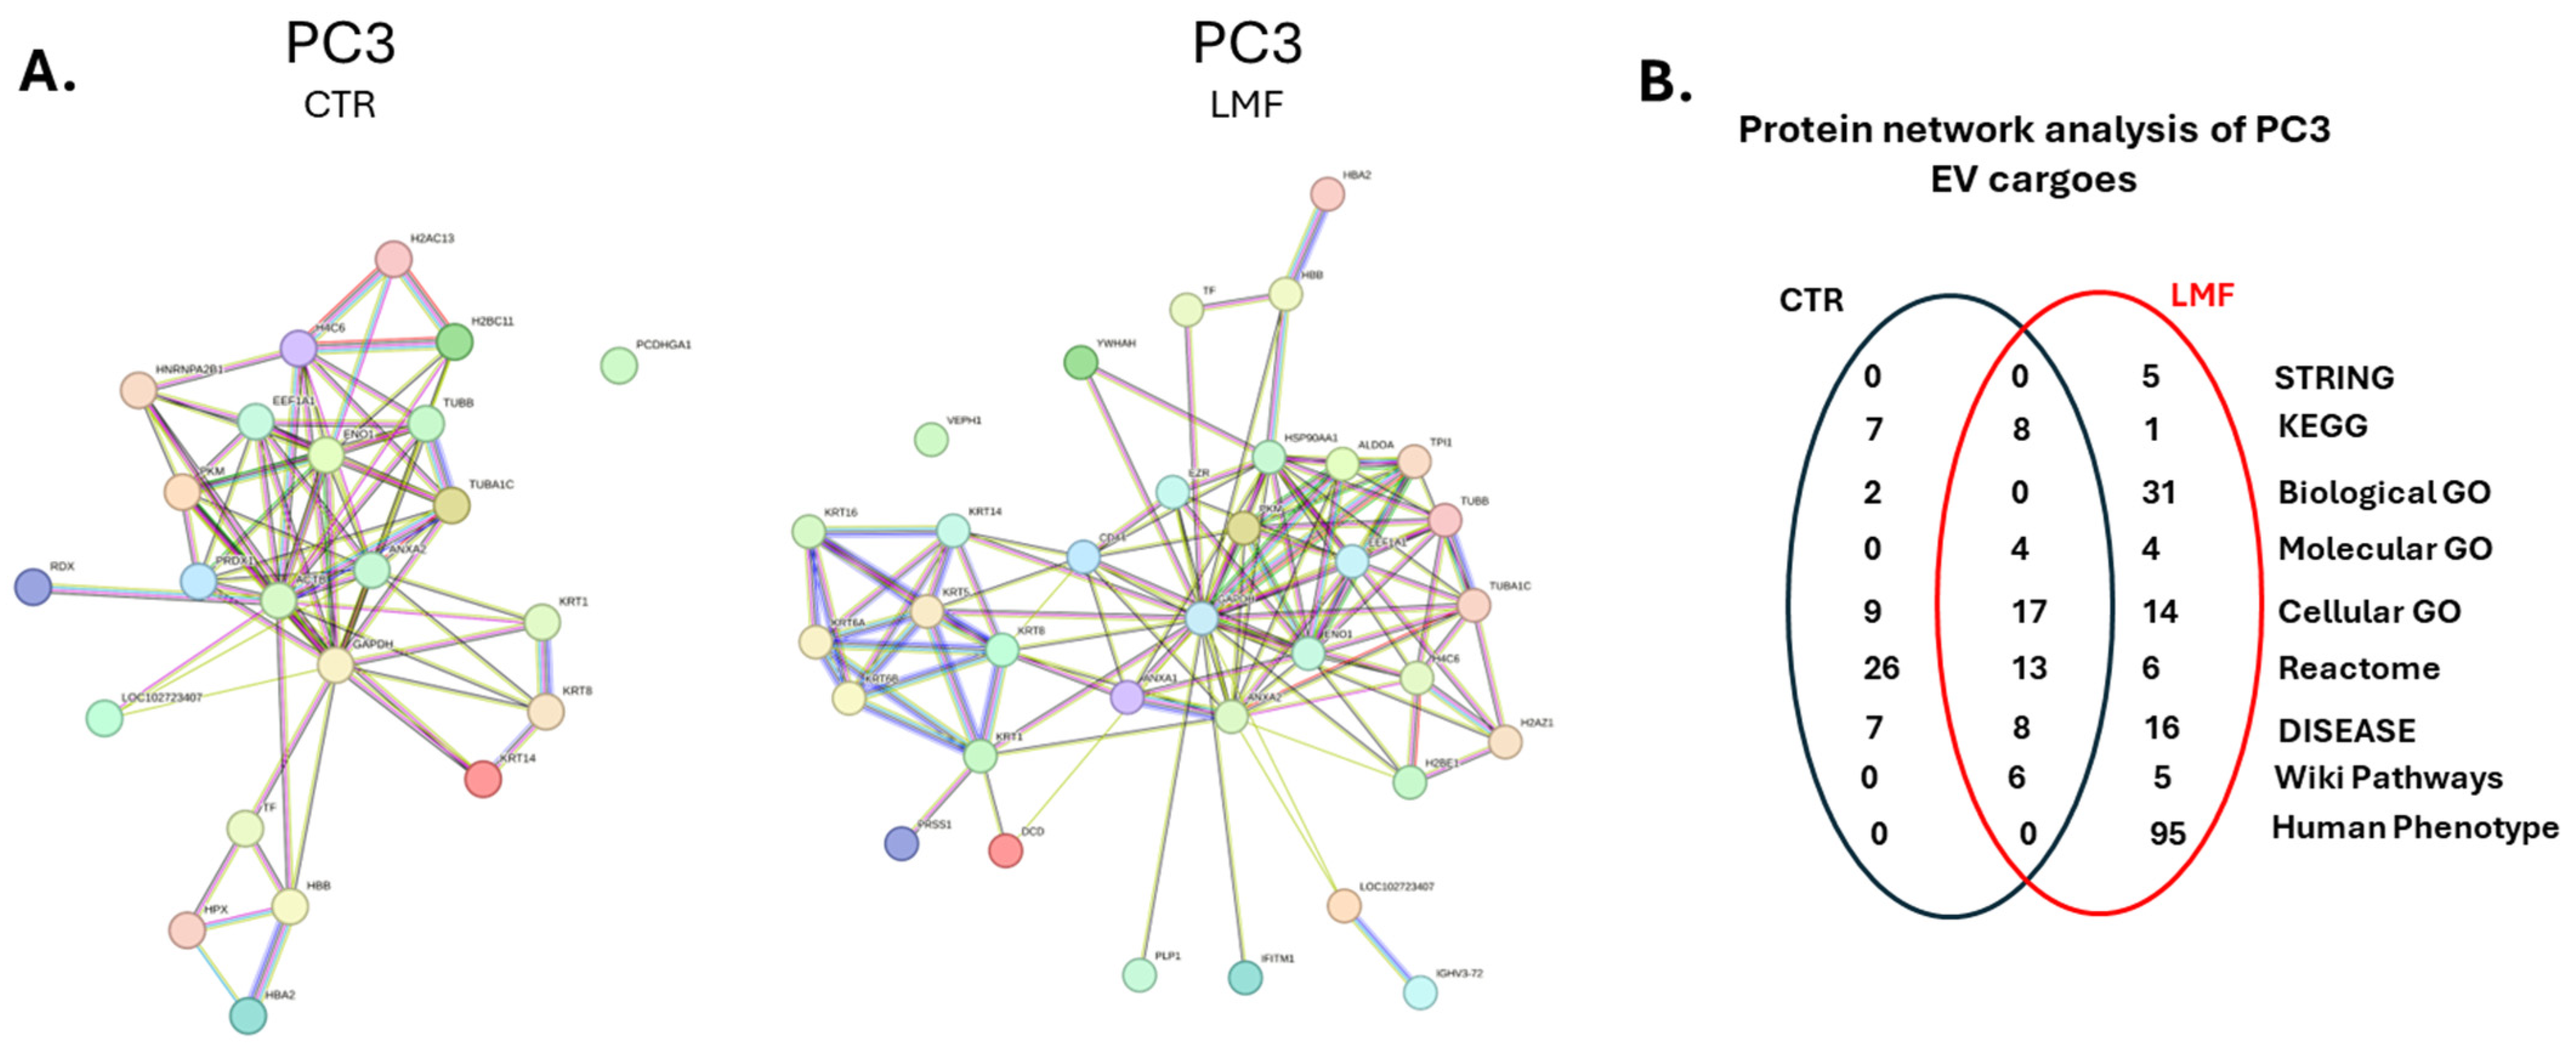
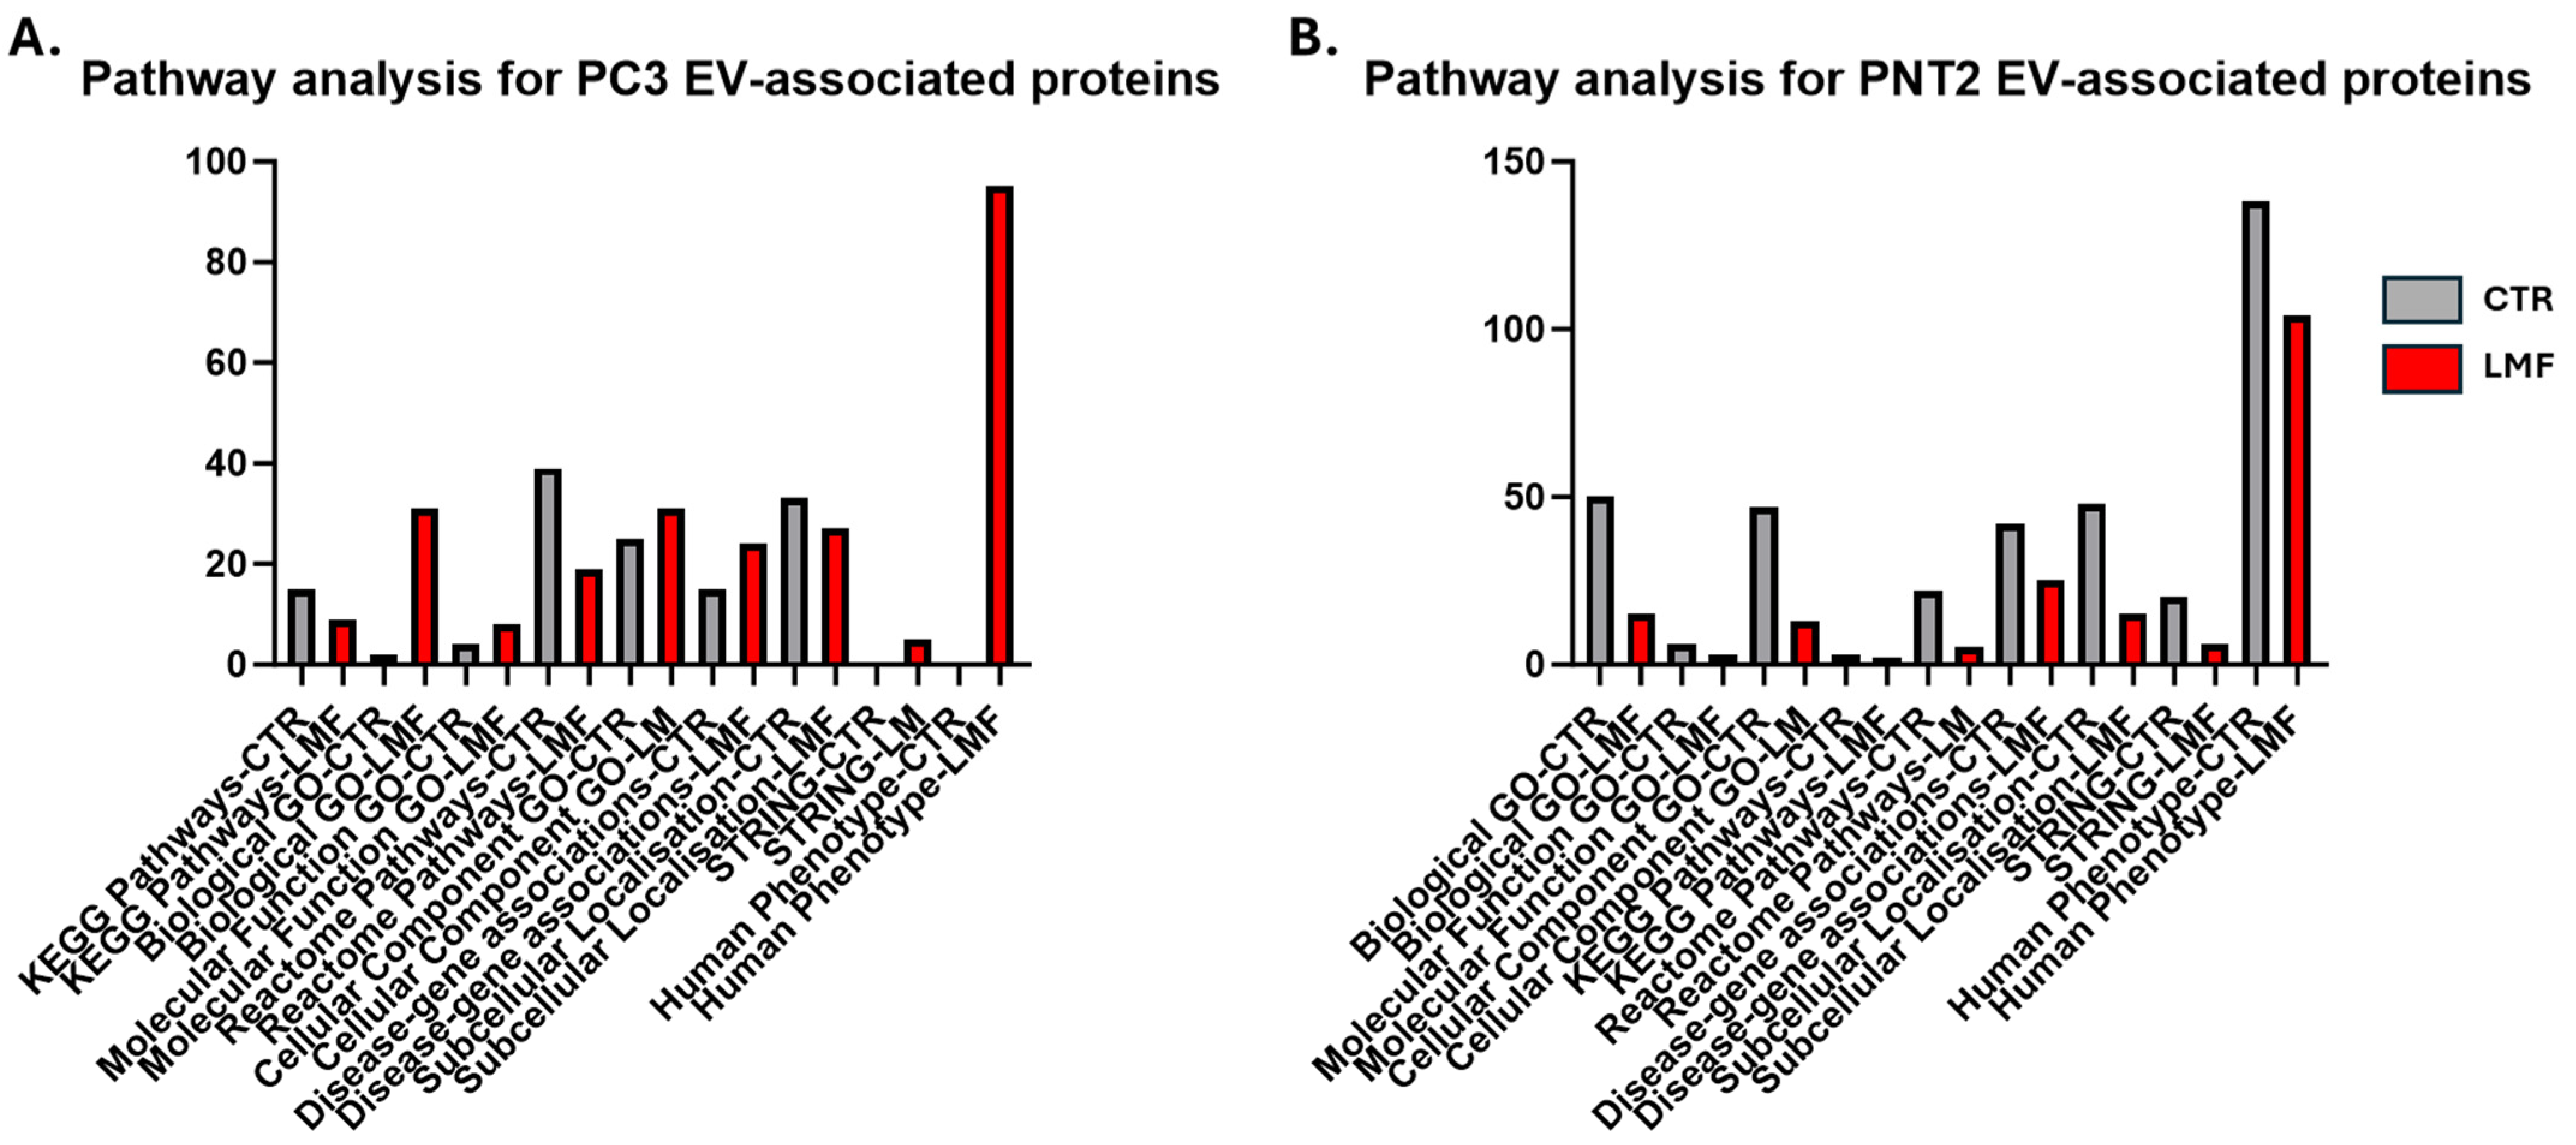
3.3. Protein–Protein Interaction Network Analysis for EV Protein Cargoes, Comparing LMF Treated to Control Untreated PC3 Cells
3.4. Protein–Protein Interaction Network Analysis for EV Protein Cargoes, Comparing LMF Treated to Control Untreated PNT2 Cells
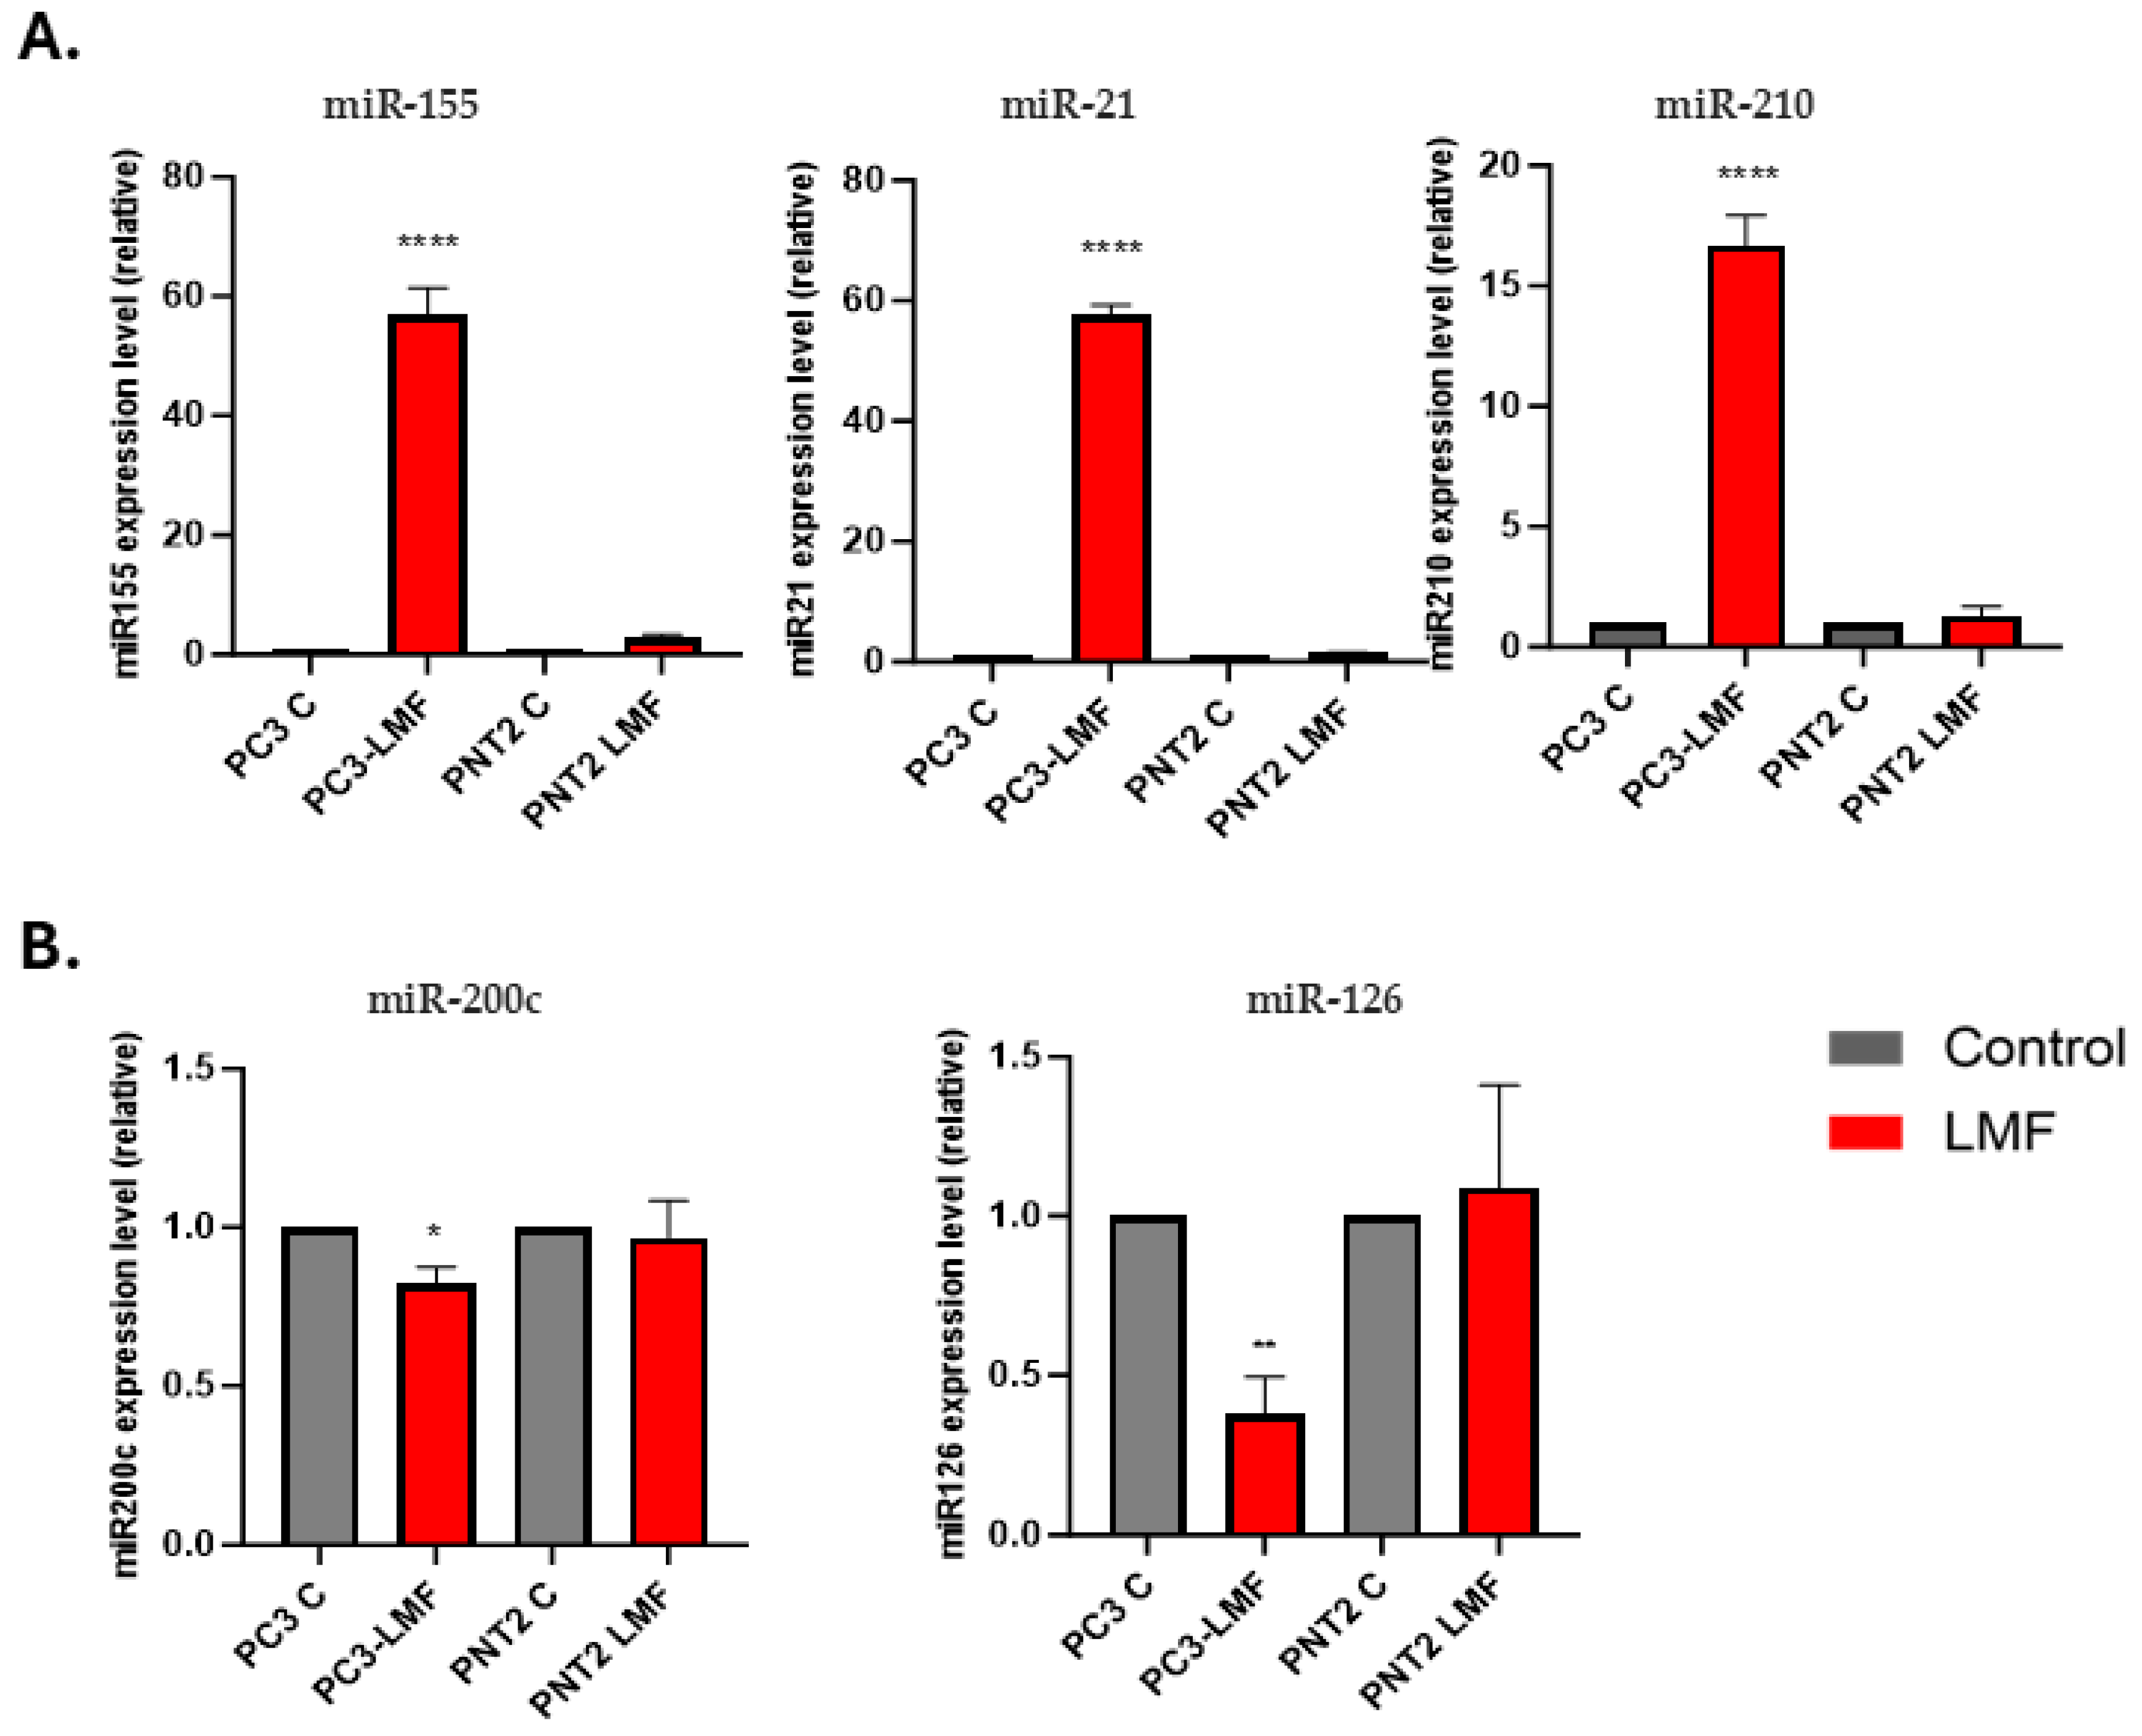
3.5. Expression Levels of Oncogenic and Tumour Suppressor miRNAs Were Differently Modulated in Response to LMF Exposure, Only in PC3 Cells
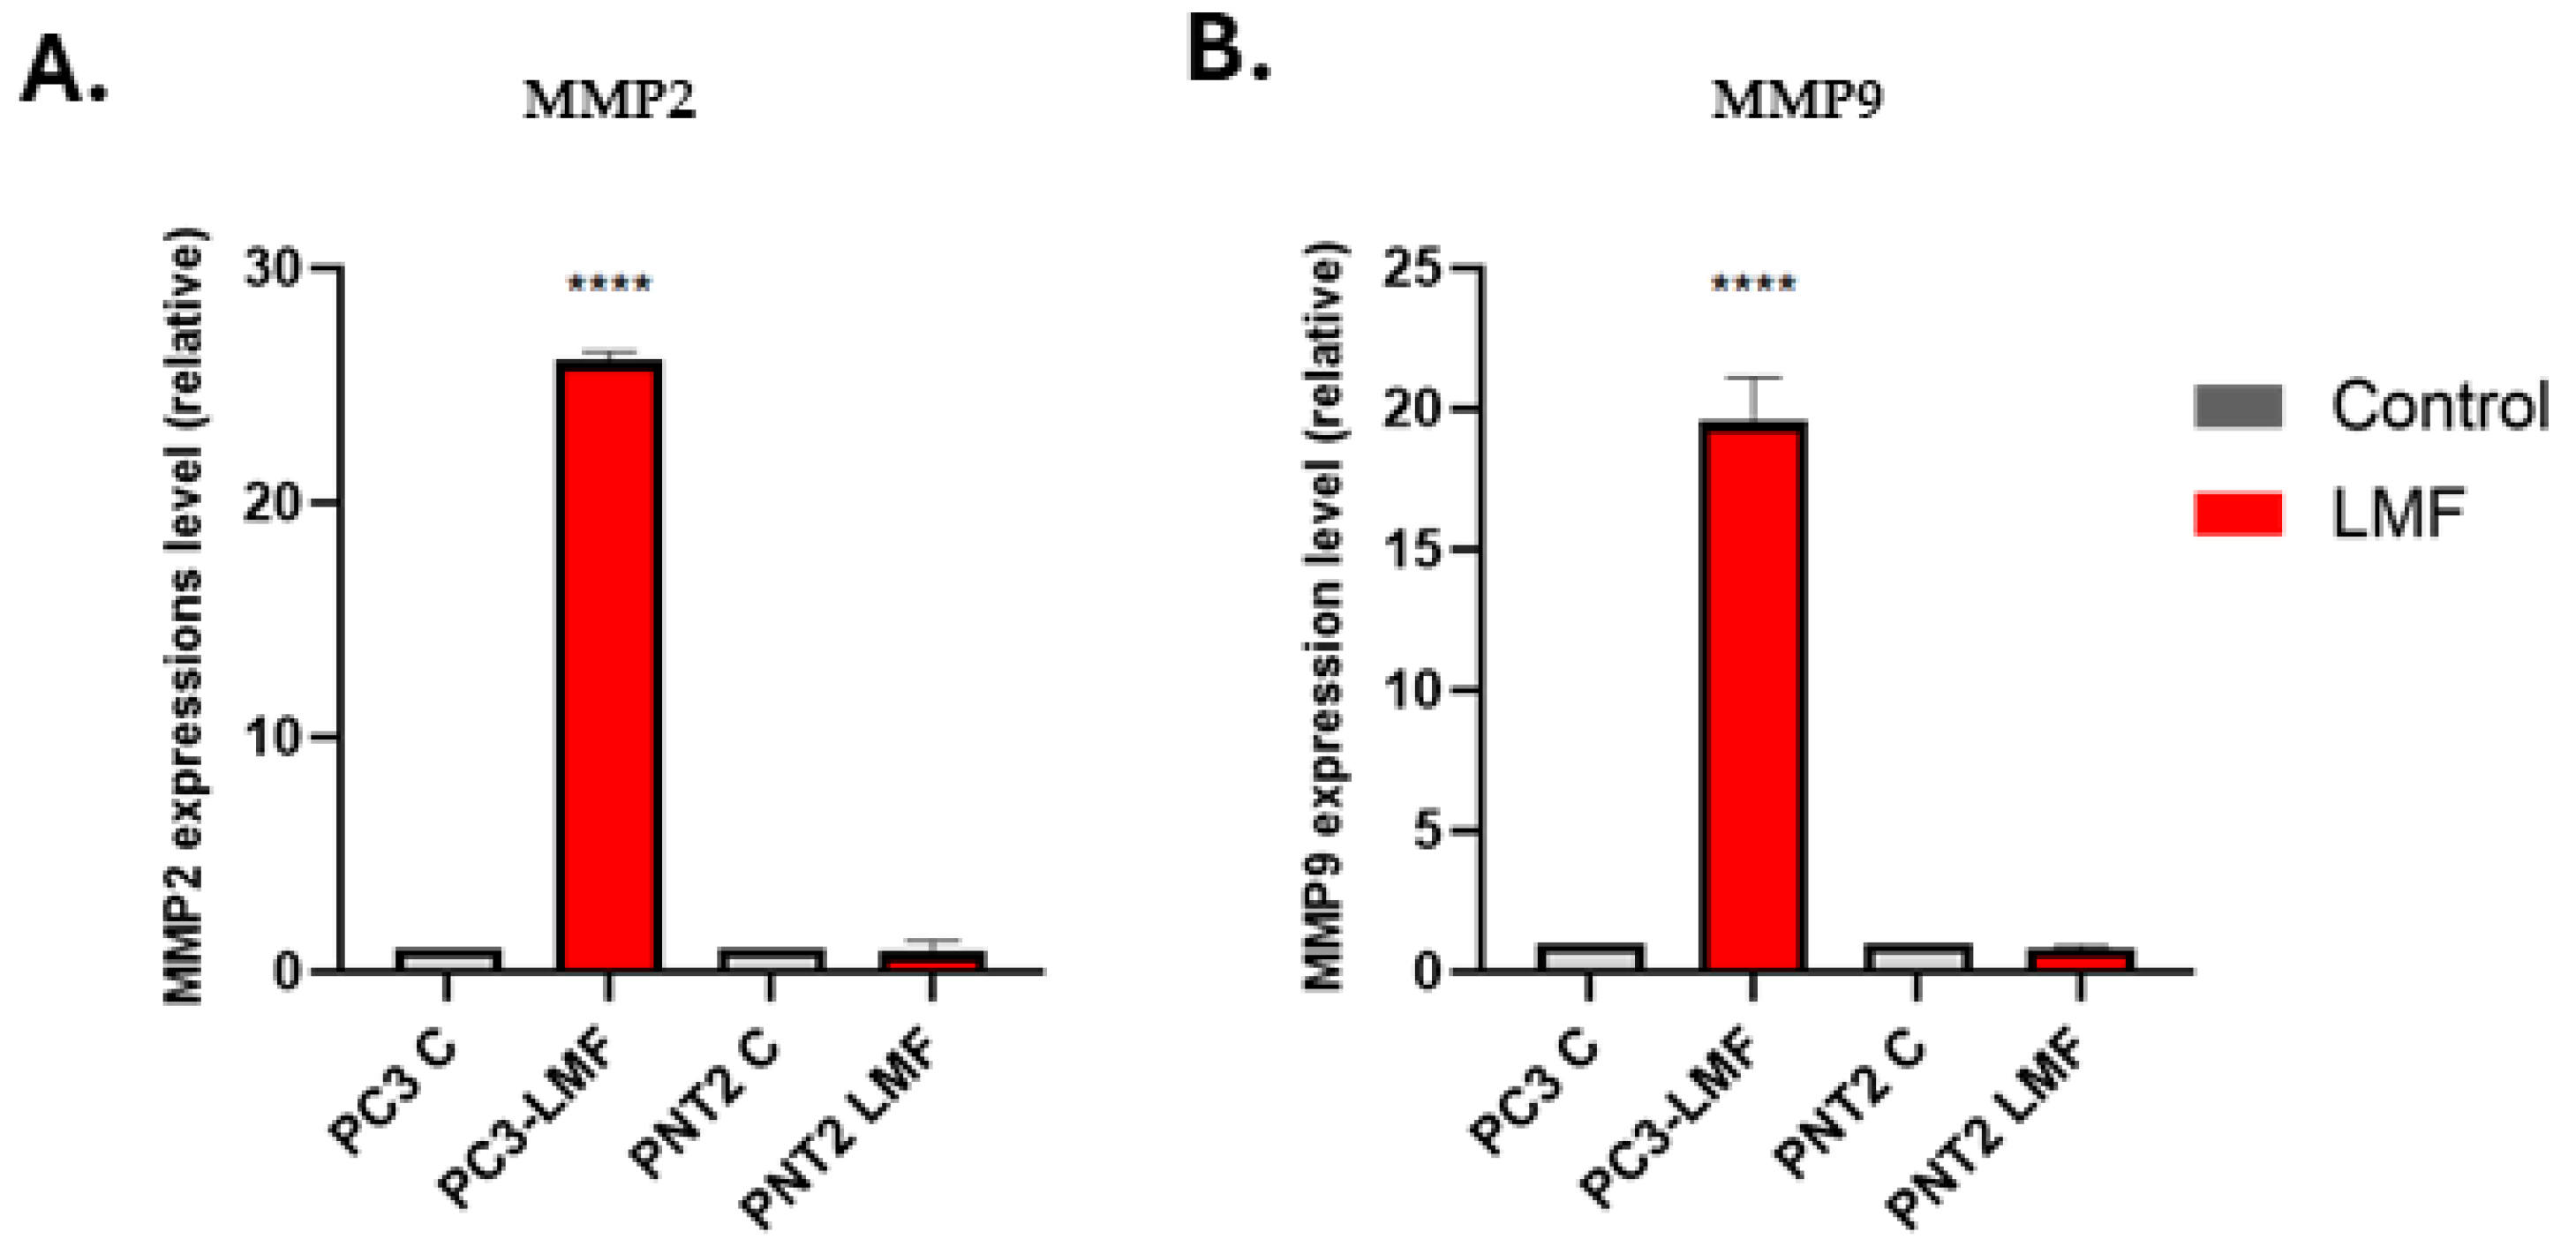
3.6. LMF Exposure Enhanced the Expression Levels of Matrix Metalloproteinases (MMP2 and MMP9) in PC3 Cells
4. Discussion
5. Conclusions
Supplementary Materials
Author Contributions
Funding
Institutional Review Board Statement
Informed Consent Statement
Data Availability Statement
Acknowledgments
Conflicts of Interest
References
- Wang, L.; Lu, B.; He, M.; Wang, Y.; Wang, Z.; Du, L. Prostate Cancer Incidence and Mortality: Global Status and Temporal Trends in 89 Countries from 2000 to 2019. Front. Public Health 2022, 10, 811044. [Google Scholar] [CrossRef] [PubMed]
- Bergengren, O.; Pekala, K.R.; Matsoukas, K.; Fainberg, J.; Mungovan, S.F.; Bratt, O.; Bray, F.; Brawley, O.; Luckenbaugh, A.N.; Mucci, L.; et al. 2022 Update on Prostate Cancer Epidemiology and Risk Factors-A Systematic Review. Eur. Urol. 2023, 84, 191–206. [Google Scholar] [CrossRef] [PubMed]
- Berenguer, C.V.; Pereira, F.; Câmara, J.S.; Pereira, J.A.M. Underlying Features of Prostate Cancer-Statistics, Risk Factors, and Emerging Methods for Its Diagnosis. Curr. Oncol. 2023, 30, 2300–2321. [Google Scholar] [CrossRef] [PubMed]
- Pernar, C.H.; Ebot, E.M.; Wilson, K.M.; Mucci, L.A. The Epidemiology of Prostate Cancer. Cold Spring Harb. Perspect. Med. 2018, 8, a030361. [Google Scholar] [CrossRef]
- Mullins, J.K.; Loeb, S. Environmental exposures and prostate cancer. Urol. Oncol. 2012, 30, 216–219. [Google Scholar] [CrossRef]
- Brain, J.D.; Kavet, R.; McCormick, D.L.; Poole, C.; Silverman, L.B.; Smith, T.J.; Valberg, P.A.; Van Etten, R.A.; Weaver, J.C. Childhood leukemia: Electric and magnetic fields as possible risk factors. Environ. Health Perspect. 2003, 111, 962–970. [Google Scholar] [CrossRef]
- Mazzoccoli, G. Chronobiology Meets Quantum Biology: A New Paradigm Overlooking the Horizon? Front. Physiol. 2022, 13, 892582. [Google Scholar] [CrossRef]
- Turchinovich, A.; Weiz, L.; Langheinz, A.; Burwinkel, B. Characterization of extracellular circulating microRNA. Nucleic Acids Res. 2011, 39, 7223–7233. [Google Scholar] [CrossRef] [PubMed] [PubMed Central]
- Mortoglou, M.; Tabin, Z.K.; Arisan, E.D.; Kocher, H.M.; Uysal-Onganer, P. Non-coding RNAs in pancreatic ductal adenocarcinoma: New approaches for better diagnosis and therapy. Transl Oncol. 2021, 14, 101090. [Google Scholar] [CrossRef] [PubMed] [PubMed Central]
- Lanning, B.; Webber, J.; Uysal-Onganer, P.; Jiang, W.G.; Clayton, A.; Dart, D.A. Prostate Cancer Cell Extracellular Vesicles Increase Mineralisation of Bone Osteoblast Precursor Cells in an In Vitro Model. Biology 2021, 10, 318. [Google Scholar] [CrossRef]
- Mortoglou, M.; Miralles, F.; Arisan, E.D.; Dart, A.; Jurcevic, S.; Lange, S.; Uysal-Onganer, P. microRNA-21 Regulates Stemness in Pancreatic Ductal Adenocarcinoma Cells. Int. J. Mol. Sci. 2022, 23, 1275. [Google Scholar] [CrossRef] [PubMed] [PubMed Central]
- Arisan, E.D.; Rencuzogullari, O.; Keskin, B.; Grant, G.H.; Uysal-Onganer, P. Inhibition on JNK Mimics Silencing of Wnt-11 Mediated Cellular Response in Androgen-Independent Prostate Cancer Cells. Biology 2020, 9, 142. [Google Scholar] [CrossRef] [PubMed]
- Alavanda, C.; Dirimtekin, E.; Mortoglou, M.; Arslan Ates, E.; Guney, A.I.; Uysal-Onganer, P. BRCA Mutations and MicroRNA Expression Patterns in the Peripheral Blood of Breast Cancer Patients. ACS Omega 2024, 9, 17217–17228. [Google Scholar] [CrossRef] [PubMed]
- Kosgodage, U.S.; Uysal-Onganer, P.; MacLatchy, A.; Kraev, I.; Chatterton, N.P.; Nicholas, A.P.; Inal, J.M.; Lange, S. Peptidylarginine Deiminases Post-Translationally Deiminate Prohibitin and Modulate Extracellular Vesicle Release and MicroRNAs in Glioblastoma Multiforme. Int. J. Mol. Sci. 2018, 20, 103. [Google Scholar] [CrossRef]
- Koushyar, S.; Uysal-Onganer, P.; Jiang, W.G.; Dart, D.A. Prohibitin Links Cell Cycle, Motility and Invasion in Prostate Cancer Cells. Int. J. Mol. Sci. 2023, 24, 9919. [Google Scholar] [CrossRef]
- Uysal-Onganer, P.; D’Alessio, S.; Mortoglou, M.; Kraev, I.; Lange, S. Peptidylarginine Deiminase Inhibitor Application, Using Cl-Amidine, PAD2, PAD3 and PAD4 Isozyme-Specific Inhibitors in Pancreatic Cancer Cells, Reveals Roles for PAD2 and PAD3 in Cancer Invasion and Modulation of Extracellular Vesicle Signatures. Int. J. Mol. Sci. 2021, 22, 1396. [Google Scholar] [CrossRef]
- Arisan, E.D.; Rencuzogullari, O.; Cieza-Borrella, C.; Miralles Arenas, F.; Dwek, M.; Lange, S.; Uysal-Onganer, P. MiR-21 Is Required for the Epithelial-Mesenchymal Transition in MDA-MB-231 Breast Cancer Cells. Int. J. Mol. Sci. 2021, 22, 1557. [Google Scholar] [CrossRef]
- Dirimtekin, E.; Mortoglou, M.; Alavanda, C.; Benomar Yemlahi, A.; Arslan Ates, E.; Guney, I.; Uysal-Onganer, P. miR-34a-FOXP1 Loop in Ovarian Cancer. ACS Omega 2023, 8, 27743–27750. [Google Scholar] [CrossRef]
- Cheng, L.; Hill, A.F. Therapeutically harnessing extracellular vesicles. Nat. Rev. Drug Discov. 2022, 21, 379–399. [Google Scholar] [CrossRef]
- Robinson, H.; Roberts, M.J.; Gardiner, R.A.; Hill, M.M. Extracellular vesicles for precision medicine in prostate cancer—Is it ready for clinical translation? Semin. Cancer Biol. 2023, 89, 18–29. [Google Scholar] [CrossRef]
- Kosgodage, U.S.; Trindade, R.P.; Thompson, P.R.; Inal, J.M.; Lange, S. Chloramidine/Bisindolylmaleimide-I-Mediated Inhibition of Exosome and Microvesicle Release and Enhanced Efficacy of Cancer Chemotherapy. Int. J. Mol. Sci. 2017, 18, 1007. [Google Scholar] [CrossRef] [PubMed]
- Uysal-Onganer, P.; MacLatchy, A.; Mahmoud, R.; Kraev, I.; Thompson, P.R.; Inal, J.M.; Lange, S. Peptidylarginine Deiminase Isozyme-Specific PAD2, PAD3 and PAD4 Inhibitors Differentially Modulate Extracellular Vesicle Signatures and Cell Invasion in Two Glioblastoma Multiforme Cell Lines. Int. J. Mol. Sci. 2020, 21, 1495. [Google Scholar] [CrossRef] [PubMed]
- Stratton, D.; Lange, S.; Inal, J.M. Pulsed extremely low-frequency magnetic fields stimulate microvesicle release from human monocytic leukaemia cells. Biochem. Biophys. Res. Commun. 2013, 430, 470–475. [Google Scholar] [CrossRef] [PubMed]
- Stratton, D.; Malibha-Pinchbeck, M.; Inal, J. Extremely low-frequency magnetic fields significantly enhance the cytotoxicity of methotrexate and can reduce migration of cancer cell lines via transiently induced plasma membrane damage. Biochem. Biophys. Res. Commun. 2022, 626, 192–199. [Google Scholar] [CrossRef] [PubMed]
- Dart, D.A.; Koushyar, S.; Uysal-Onganer, P. Exploring the potential link between prostate cancer and magnetic fields. Med. Hypotheses 2024, 189, 111384. [Google Scholar] [CrossRef]
- Davey, A.; McAuley, D.F.; O’Kane, C.M. Matrix metalloproteinases in acute lung injury: Mediators of injury and drivers of repair. Eur. Respir. J. 2011, 38, 959–970. [Google Scholar] [CrossRef]
- Gohji, K.; Fujimoto, N.; Hara, I.; Fujii, A.; Gotoh, A.; Okada, H.; Arakawa, S.; Kitazawa, S.; Miyake, H.; Kamidono, S.; et al. Serum matrix metalloproteinase-2 and its density in men with prostate cancer as a new predictor of disease extension. Int. J. Cancer 1998, 79, 96–101. [Google Scholar] [CrossRef]
- Moses, M.A.; Wiederschain, D.; Loughlin, K.R.; Zurakowski, D.; Lamb, C.C.; Freeman, M.R. Increased incidence of matrix metalloproteinases in urine of cancer patients. Cancer Res. 1998, 58, 1395–1399. [Google Scholar]
- Livak, K.J.; Schmittgen, T.D. Analysis of relative gene expression data using real-time quantitative PCR and the 2(-Delta Delta C(T)) Method. Methods 2001, 25, 402–408. [Google Scholar] [CrossRef]
- Kato, T.; Fujita, Y.; Nakane, K.; Kojima, T.; Nozawa, Y.; Deguchi, T.; Ito, M. ETS1 promotes chemoresistance and invasion of paclitaxel-resistant, hormone-refractory PC3 prostate cancer cells by up-regulating MDR1 and MMP9 expression. Biochem. Biophys. Res. Commun. 2012, 417, 966–971. [Google Scholar] [CrossRef]
- Welsh, J.A.; Goberdhan DC, I.; O’Driscoll, L.; Buzas, E.I.; Blenkiron, C.; Bussolati, B.; Cai, H.; Di Vizio, D.; Driedonks TA, P.; Erdbrügger, U.; et al. Minimal information for studies of extracellular vesicles (MISEV2023): From basic to advanced approaches. J. Extracell. Vesicles 2024, 13, e12404. [Google Scholar] [CrossRef] [PubMed]
- Dart, D.A.; Bevan, C.L.; Uysal-Onganer, P.; Jiang, W.G. Analysis of androgen receptor expression and activity in the mouse brain. Sci. Rep. 2024, 14, 11115. [Google Scholar] [CrossRef] [PubMed]
- de Nóbrega, M.; Dos Reis, M.B.; Pereira, É.R.; de Souza, M.F.; de Syllos Cólus, I.M. The potential of cell-free and exosomal microRNAs as biomarkers in liquid biopsy in patients with prostate cancer. J. Cancer Res. Clin. Oncol. 2022, 148, 2893–2910. [Google Scholar] [CrossRef] [PubMed]
- Cavallari, I.; Ciccarese, F.; Sharova, E.; Urso, L.; Raimondi, V.; Silic-Benussi, M.; D’Agostino, D.M.; Ciminale, V. The miR-200 Family of microRNAs: Fine Tuners of Epithelial-Mesenchymal Transition and Circulating Cancer Biomarkers. Cancers 2021, 13, 5874. [Google Scholar] [CrossRef]
- Angel, C.Z.; Lynch, S.M.; Nesbitt, H.; McKenna, M.M.; Walsh, C.P.; McKenna, D.J. miR-210 is induced by hypoxia and regulates neural cell adhesion molecule in prostate cells. J. Cell. Physiol. 2020, 235, 6194–6203. [Google Scholar] [CrossRef]
- Sung, H.; Ferlay, J.; Siegel, R.L.; Laversanne, M.; Soerjomataram, I.; Jemal, A.; Bray, F. Global cancer statistics 2020: GLOBOCAN estimates of incidence and mortality worldwide for 36 cancers in 185 countries. CA A Cancer J. Clin. 2021, 71, 209–249. [Google Scholar] [CrossRef]
- Gandaglia, G.; Leni, R.; Bray, F.; Fleshner, N.; Freedland, S.J.; Kibel, A.; Stattin, P.; Van Poppel, H.; La Vecchia, C. Epidemiology and prevention of prostate cancer. Eur. Urol. Oncol. 2021, 4, 877–892. [Google Scholar] [CrossRef]
- Sarimov, R.M.; Serov, D.A.; Gudkov, S.V. Hypomagnetic Conditions and Their Biological Action (Review). Biology 2023, 12, 1513. [Google Scholar] [CrossRef]
- Aydemir, E.; Arslan, İ.İ.; Görkay, A.H. The Application of Electromagnetic Fields in Cancer. Adv. Exp. Med. Biol. 2024, 1450, 103–120. [Google Scholar] [CrossRef]
- Akoto, T.; Saini, S. Role of Exosomes in Prostate Cancer Metastasis. Int. J. Mol. Sci. 2021, 22, 3528. [Google Scholar] [CrossRef]
- Henrich, S.E.; McMahon, K.M.; Plebanek, M.P.; Calvert, A.E.; Feliciano, T.J.; Parrish, S.; Tavora, F.; Mega, A.; De Souza, A.; Carneiro, B.A.; et al. Prostate cancer extracellular vesicles mediate intercellular communication with bone marrow cells and promote metastasis in a cholesterol-dependent manner. J. Extracell. Vesicles 2020, 10, e12042. [Google Scholar] [CrossRef] [PubMed]
- Linder, S.; Cervero, P.; Eddy, R.; Condeelis, J. Mechanisms and roles of podosomes and invadopodia. Nat. Rev. Mol. Cell Biol. 2023, 24, 86–106. [Google Scholar] [CrossRef] [PubMed]
- Boran, C.; Kandirali, E.; Yilmaz, F.; Serin, E.; Akyol, M. Reliability of the 34βE12, keratin 5/6, p63, bcl-2, and AMACR in the diagnosis of prostate carcinoma. Urol. Oncol. 2011, 29, 614–623. [Google Scholar] [CrossRef] [PubMed]
- Guo, L.; Liu, Y.; Yang, T.; Wang, G.; Liu, J.; Li, S.; Liu, B.; Cai, J. CAV1 and KRT5 are potential targets for prostate cancer. Medicine 2023, 102, e36473. [Google Scholar] [CrossRef] [PubMed]
- Chang, Y.T.; Peng, H.Y.; Hu, C.M.; Tien, S.C.; Chen, Y.I.; Jeng, Y.M.; Chang, M.C. Pancreatic cancer-derived small extracellular vesical ezrin activates fibroblasts to exacerbate cancer metastasis through STAT3 and YAP-1 signaling pathways. Mol. Oncol. 2023, 17, 1628–1647. [Google Scholar] [CrossRef]
- Chen, Z.; Wang, J.; Lu, Y.; Lai, C.; Qu, L.; Zhuo, Y. Ezrin expression in circulating tumor cells is a predictor of prostate cancer metastasis. Bioengineered 2022, 13, 4076–4084. [Google Scholar] [CrossRef]
- Dryhurst, D.; Ausió, J. Histone H2A.Z deregulation in prostate cancer. Cause or effect? Cancer Metastasis Rev. 2014, 33, 429–439. [Google Scholar] [CrossRef]
- Yang, B.; Tong, R.; Liu, H.; Wu, J.; Chen, D.; Xue, Z.; Ding, C.; Zhou, L.; Xie, H.; Wu, J.; et al. H2A.Z regulates tumorigenesis, metastasis and sensitivity to cisplatin in intrahepatic cholangiocarcinoma. Int. J. Oncol. 2018, 52, 1235–1245. [Google Scholar] [CrossRef]
- Zhou, S.; Cai, Y.; Liu, X.; Jin, L.; Wang, X.; Ma, W.; Zhang, T. Role of H2B mono-ubiquitination in the initiation and progression of cancer. Bull. Du Cancer 2021, 108, 385–398. [Google Scholar] [CrossRef]
- Ronquist, K.G.; Ronquist, G.; Larsson, A.; Carlsson, L. Proteomic analysis of prostate cancer metastasis-derived prostasomes. Anticancer Res. 2010, 30, 285–290. [Google Scholar]
- Hishida, S.; Kawakami, K.; Fujita, Y.; Kato, T.; Takai, M.; Iinuma, K.; Nakane, K.; Tsuchiya, T.; Koie, T.; Miura, Y.; et al. Proteomic analysis of extracellular vesicles identified PI3K pathway as a potential therapeutic target for cabazitaxel-resistant prostate cancer. Prostate 2021, 81, 592–602. [Google Scholar] [CrossRef] [PubMed]
- Gómez-Herranz, M.; Taylor, J.; Sloan, R.D. IFITM proteins: Understanding their diverse roles in viral infection, cancer, and immunity. J. Biol. Chem. 2023, 299, 102741. [Google Scholar] [CrossRef] [PubMed]
- Stewart, G.D.; Lowrie, A.G.; Riddick, A.C.; Fearon, K.C.; Habib, F.K.; Ross, J.A. Dermcidin expression confers a survival advantage in prostate cancer cells subjected to oxidative stress or hypoxia. Prostate 2007, 67, 1308–1317. [Google Scholar] [CrossRef] [PubMed]
- Acikgoz, E.; Soner, B.C.; Ozdil, B.; Guven, M. CD133+/CD44+ prostate cancer stem cells exhibit embryo-like behavior patterns. Acta Histochem. 2021, 123, 151743. [Google Scholar] [CrossRef] [PubMed]
- Zhou, X.; Yeasmin Khusbu, F.; Xie, Y.; Yang, P. Emodin-Induced Necroptosis in Prostate Cancer Cells via the Mitochondrial Fission HSP90/MLKL/PGAM Pathway. Chem. Biodivers. 2023, 20, e202201130. [Google Scholar] [CrossRef]
- He, T.; Zhang, Q.; Xu, P.; Tao, W.; Lin, F.; Liu, R.; Li, M.; Duan, X.; Cai, C.; Gu, D.; et al. Extracellular vesicle-circEHD2 promotes the progression of renal cell carcinoma by activating cancer-associated fibroblasts. Mol. Cancer 2023, 22, 117. [Google Scholar] [CrossRef]
- Fu, J.-P.; Mo, W.-C.; Liu, Y.; Bartlett, P.F.; He, R.-Q. Elimination of the geomagnetic field stimulates the proliferation of mouse neural progenitor and stem cells. Protein Cell 2016, 7, 624–637. [Google Scholar] [CrossRef] [PubMed]
- Fu, J.-P.; Mo, W.-C.; Liu, Y.; He, R.-Q. Decline of cell viability and mitochondrial activity in mouse skeletal muscle cell in a hypomagnetic field. Bioelectromagnetics 2016, 37, 212–222. [Google Scholar] [CrossRef]
- Katiukhin, L.N. Rheological Properties of the Erythrocytes in Weakened Static Magnetic Field of the Earth In Vitro Study. J. Sci. Res. Rep. 2019, 22, 1–12. [Google Scholar] [CrossRef]
- Ciorba, D.; Morariu, V.V. Life in zero magnetic field. Iii. Activity of aspartate aminotransferase and alanine aminotransferase during in vitro aging of human blood. Electro-Magnetobiology 2009, 20, 313–321. [Google Scholar] [CrossRef]
- Krylov, V.; Machikhin, A.; Sizov, D.; Guryleva, A.; Sizova, A.; Zhdanova, S.; Tchougounov, V.; Burlakov, A. Influence of hypomagnetic field on the heartbeat in zebrafish embryos. Front. Physiol. 2022, 13, 1040083. [Google Scholar] [CrossRef] [PubMed]
- Mo, W.-C.; Fu, J.-P.; Ding, H.-M.; Liu, Y.; Hua, Q.; He, R.-Q. Hypomagnetic Field Alters Circadian Rhythm and Increases Algesia in Adult Male Mice. Prog. Biochem. Biophys. 2015, 42, 639–646. [Google Scholar] [CrossRef]
- Novikov, V.V.; Yablokova, E.V.; Fesenko, E.E. The Effect of a “Zero” Magnetic Field on the Production of Reactive Oxygen Species in Neutrophils. Biophysics 2018, 63, 365–368. [Google Scholar] [CrossRef]
- Baek, S.; Choi, H.; Park, H.; Cho, B.; Kim, S.; Kim, J. Effects of a hypomagnetic field on DNA methylation during the differentiation of embryonic stem cells. Sci. Rep. 2019, 9, 1333. [Google Scholar] [CrossRef] [PubMed]
- Poiata, A.; Creanga, D.E.; Morariu, V.V. Life in zero magnetic field. V. E. coli resistance to antibiotics. Electromagn. Biol. Med. 2009, 22, 171–182. [Google Scholar] [CrossRef]
- Ilyin, V.K.; Orlov, O.I.; Morozova, Y.A.; Skedina, M.A.; Vladimirov, S.K.; Plotnikov, E.V.; Artamonov, A.A. Prognostic model for bacterial drug resistance genes horizontal spread in space-crews. Acta Astronaut. 2022, 190, 388–394. [Google Scholar] [CrossRef]
- Zhang, B.; Wang, L.; Zhan, A.; Wang, M.; Tian, L.; Guo, W.; Pan, Y. Long-term exposure to a hypomagnetic field attenuates adult hippocampal neurogenesis and cognition. Nat. Commun. 2021, 12, 1174. [Google Scholar] [CrossRef]
- Jagetia, G.C.; Martino, C.F.; Castello, P.R. Modulation of Hydrogen Peroxide Production in Cellular Systems by Low Level Magnetic Fields. PLoS ONE 2011, 6, e22753. [Google Scholar] [CrossRef]
- Juutilainen, J.; Herrala, M.; Luukkonen, J.; Naarala, J.; Hore, P.J. Magnetocarcinogenesis: Is there a mechanism for carcinogenic effects of weak magnetic fields? Proc. R. Soc. B Biol. Sci. 2018, 285, 20180590. [Google Scholar] [CrossRef]
- Hu, P.; Mo, W.-C.; Fu, J.-P.; Liu, Y.; He, R.Q. Long-term hypogeomagnetic field exposure reduces muscular mitochondrial function and exercise capacity in adult male mice. Prog. Biochem. Biophys. 2020, 47, 426–438. [Google Scholar] [CrossRef]
- Jia, B.; Xie, L.; Zheng, Q.; Yang, P.F.; Zhang, W.J.; Ding, C.; Qian, A.R.; Shang, P.A. A Hypomagnetic Field Aggravates Bone Loss Induced by Hindlimb Unloading in Rat Femurs. PLoS ONE 2014, 9, e105604. [Google Scholar] [CrossRef] [PubMed]
- Wan, G.-J.; Jiang, S.-L.; Zhao, Z.-C.; Xu, J.-J.; Tao, X.-R.; Sword, G.A.; Gao, Y.-B.; Pan, W.-D.; Chen, F.-J. Bio-effects of near-zero magnetic fields on the growth, development and reproduction of small brown planthopper, Laodelphax striatellus and brown planthopper, Nilaparvata lugens. J. Insect Physiol. 2014, 68, 7–15. [Google Scholar] [CrossRef] [PubMed]
- Ogneva, I.V.; Usik, M.A.; Burtseva, M.V.; Biryukov, N.S.; Zhdankina, Y.S.; Sychev, V.N.; Orlov, O.I. Drosophila melanogaster Sperm under Simulated Microgravity and a Hypomagnetic Field: Motility and Cell Respiration. Int. J. Mol. Sci. 2020, 21, 5985. [Google Scholar] [CrossRef] [PubMed]
- Fesenko, E.E.; Mezhevikina, L.M.; Osipenko, M.A.; Gordon, R.Y.; Khutzian, S.S. Effect of the “zero” Magnetic Field on Early Embryogenesis in Mice. Electromagn. Biol. Med. 2010, 29, 1–8. [Google Scholar] [CrossRef] [PubMed]
- Mo, W.-C.; Liu, Y.; Cooper, H.M.; He, R.-Q. Altered development of Xenopus embryos in a hypogeomagnetic field. Bioelectromagnetics 2012, 33, 238–246. [Google Scholar] [CrossRef] [PubMed]
- Temour’yants, N.A.; Kostyuk, A.S.; Tumanyants, K.N. Dynamics and Infradian Rhythmics of Thermal/Pain Sensitivity of the Helix Mollusc under the Action of Electromagnetic Fields. Neurophysiology 2011, 42, 276–285. [Google Scholar] [CrossRef]
- Dart, D.A.; Uysal-Onganer, P.; Jiang, W.G. Prostate-specific PTen deletion in mice activates inflammatory microRNA expression pathways in the epithelium early in hyperplasia development. Oncogenesis 2017, 6, 400. [Google Scholar] [CrossRef]
- Lian, M.; Mortoglou, M.; Uysal-Onganer, P. Impact of Hypoxia-Induced miR-210 on Pancreatic Cancer. Curr. Issues Mol. Biol. 2023, 45, 9778–9792. [Google Scholar] [CrossRef]
- Jalil, A.T.; Abdulhadi, M.A.; Al-Ameer, L.R.; Abbas, H.A.; Merza, M.S.; Zabibah, R.S.; Fadhil, A.A. The emerging role of microRNA-126 as a potential therapeutic target in cancer: A comprehensive review. Pathol. Res. Pract. 2023, 248, 154631. [Google Scholar] [CrossRef]
- Brabletz, S.; Brabletz, T. The ZEB/miR-200 feedback loop--a motor of cellular plasticity in development and cancer? EMBO Rep. 2010, 11, 670–677. [Google Scholar] [CrossRef]
- Pinheiro, L.C.L.; Pereira, É.R.; Francelino, A.L.; Guembarovski, A.F.M.L.; Fuganti, P.E.; de Oliveira, K.B.; Miqueloto, C.A.; Serpeloni, J.M.; Guembarovski, R.L. Metalloproteinase 9 immunostaining profile is positively correlated with tumor grade, extraprostatic extension and biochemical recurrence in prostate cancer. Pathol Res Pract. 2024, 253, 155024. [Google Scholar] [CrossRef] [PubMed]
- Mandel, A.; Larsson, P.; Sarwar, M.; Semenas, J.; Syed Khaja, A.S.; Persson, J.L. The interplay between AR, EGF receptor and MMP-9 signaling pathways in invasive prostate cancer. Mol Med. 2018, 24, 34. [Google Scholar] [CrossRef] [PubMed]
- Zhang, L.; Shi, J.; Feng, J.; Klocker, H.; Lee, C.; Zhang, J. Type IV collagenase (matrix metalloproteinase-2 and -9) in prostate cancer. Prostate Cancer Prostatic Dis. 2004, 7, 327–332. [Google Scholar] [CrossRef]
- dos Reis, S.T.; Villanova, F.E.; Andrade, P.M.; Pontes, J., Jr.; de Sousa-Canavez, J.M.; Sañudo, A.; Antunes, A.A.; Dall’oglio, M.F.; Srougi, M.; Moreira Leite, K.R. Matrix metalloproteinase-2 polymorphism is associated with prognosis in prostate cancer. Urol. Oncol. 2010, 28, 624–627. [Google Scholar] [CrossRef] [PubMed]
- Lovaas, J.D.; Zhu, L.; Chiao, C.Y.; Byles, V.; Faller, D.V.; Dai, Y. SIRT1 enhances matrix metalloproteinase-2 expression and tumor cell invasion in prostate cancer cells. Prostate 2013, 73, 522–530. [Google Scholar] [CrossRef] [PubMed]
- Zhong, W.D.; Han, Z.D.; He, H.C.; Bi, X.C.; Dai, Q.S.; Zhu, G.; Ye, Y.K.; Liang, Y.X.; Qin, W.J.; Zhang, Z.; et al. CD147, MMP-1, MMP-2 and MMP-9 protein expression as significant prognostic factors in human prostate cancer. Oncology 2008, 75, 230–236. [Google Scholar] [CrossRef]
- Trudel, D.; Fradet, Y.; Meyer, F.; Têtu, B. Matrix metalloproteinase 9 is associated with Gleason score in prostate cancer but not with prognosis. Hum. Pathol. 2010, 41, 1694–1701. [Google Scholar] [CrossRef]
- Ma, F.; Wang, Z.; Abdularab, A.; Dai, L.; Niu, Y.; Jiang, N. Matrix metalloproteinase 9 and prostate cancer risk: A meta-analysis of 1059 participants. Minerva Urol. E Nefrol. Ital. J. Urol. Nephrol. 2017, 69, 324–329. [Google Scholar] [CrossRef]
- Nelson, A.R.; Fingleton, B.; Rothenberg, M.L.; Matrisian, L.M. Matrix metalloproteinases: Biologic activity and clinical implications. J. Clin. Oncol. Off. J. Am. Soc. Clin. Oncol. 2000, 18, 1135–1149. [Google Scholar] [CrossRef]
- Mo, W.; Liu, Y.; Bartlett, P.F.; He, R. Transcriptome profile of human neuroblastoma cells in the hypomagnetic field. Sci. China Life Sci. 2014, 57, 448–461. [Google Scholar] [CrossRef]
- Roemer, K.; Mo, W.-C.; Zhang, Z.-J.; Liu, Y.; Bartlett, P.F.; He, R.-Q. Magnetic Shielding Accelerates the Proliferation of Human Neuroblastoma Cell by Promoting G1-Phase Progression. PLoS ONE 2013, 8, e54775. [Google Scholar] [CrossRef]
- Eldashev, I.S.; Shchegolev, B.F.; Surma, S.V.; Belostotskaya, G.B. Influence of low-intensity magnetic fields on the development of satellite muscle cells of a newborn rat in primary culture. Biophysics 2011, 55, 765–770. [Google Scholar] [CrossRef]
- Sarimov, R.M.; Serov, D.A.; Gudkov, S.V. Biological Effects of Magnetic Storms and ELF Magnetic Fields. Biology 2023, 12, 1506. [Google Scholar] [CrossRef] [PubMed]
- Singh, A.; Kumar, P.; Pathak, S.; Jain, K.; Garg, P.Y.; Pant, M.; Mahapatro, A.K.; Rath, D.; Wang, L.; Kim, S.-K.; et al. A threefold increase in SAR performance for magnetic hyperthermia by compositional tuning in zinc-substituted iron oxide superparamagnetic nanoparticles with superior biocompatibility. J. Alloys Compd. 2023, 968, 171868. [Google Scholar] [CrossRef]
- Singh, A.; Kumar, P.; Pathak, S.; Jain, K.; Garg, P.; Pant, M.; Mahapatro, A.K.; Singh, R.K.; Rajput PMKim, S.-K.; Maurya, K.K.; et al. Tailored nanoparticles for magnetic hyperthermia: Highly stable aqueous dispersion of Mn-substituted magnetite superparamagnetic nanoparticles by double surfactant coating for improved heating efficiency. J. Alloys Compd. 2024, 976, 172999. [Google Scholar] [CrossRef]
- Li, B.; Zu, M.; Jiang, A.; Cao, Y.; Wu, J.; Shahbazi, M.A.; Shi, X.; Reis, R.L.; Kundu, S.C.; Xiao, B. Magnetic natural lipid nanoparticles for oral treatment of colorectal cancer through potentiated antitumor immunity and microbiota metabolite regulation. Biomaterials 2024, 307, 122530. [Google Scholar] [CrossRef]


| Protein ID | Protein Name | PC3 ctrl | PC3 LMF | PNT2 ctrl | PNT2 LMF |
|---|---|---|---|---|---|
| H6VRG0 KRT1 | Keratin, type II cytoskeletal 1 | V | |||
| H6VRG2 KRT1 | Keratin, type II cytoskeletal 1 | V | V | V | |
| P02533 | Keratin, type I cytoskeletal 14 | V | V | V | V |
| P08779 | Keratin, type I cytoskeletal 16 | V | V | V | |
| P13647 | Keratin, type II cytoskeletal 5 | V | V | V | |
| B4E1T1 KRT5 | cDNA FLJ54081, highly similar to Keratin, type II cytoskeletal 5 | V | V | ||
| P04259 | Keratin, type II cytoskeletal 6B | V | V | ||
| A0A0S2Z428 | HCG2039812, KRT6A | V | V | V | |
| A0A804GS07 | Actin, cytoplasmic 2 | V | V | ||
| Q6GMX6 IGH@ | IGH@ protein | V | V | ||
| P0DOX5 | Immunoglobulin gamma-1 heavy chain | V | V | ||
| A0A384NYT8 TUBB | Tubulin beta chain | V | V | ||
| P05787-2 KRT8 | Isoform 2 of Keratin, type II cytoskeletal 8 | V | V | V | |
| A0A0K0K1H8 HEL-S-71p | Serotransferrin | V | V | V | V |
| A0A5E4 | Uncharacterised protein | V | |||
| A0A024R5Z7 | Annexin 2 | V | V | V | |
| A0A4D5RA86 ANXA1 | Annexin 1 | V | |||
| A0A087WVQ9 | Elongation factor 1-alpha | V | V | ||
| A0A087WV01 | Elongation factor 1-alpha | V | |||
| A0A5C2GAZ2 | IGH + IGL c262_heavy_IGHV3-15_IGHD4-17_IGHJ4 | V | V | ||
| Q2TSD0 V9HVZ4 GAPDH | Glyceraldehyde-3-phosphate dehydrogenase | V | V | V | |
| A0A0B4J1Y9 | Immunoglobulin heavy variable 3–72 | V | |||
| B3KPS3 TUBA1C | Tubulin alpha chain | V | V | ||
| A0A2R3Z0D6 HBB | Haemoglobin subunit beta | V | |||
| Q0VAS5 HIST1H4H | Histone H4 | V | V | ||
| A0A7S5BYV3 | IGH c429_heavy_IGHV1-24_IGHD1-7_IGHJ4 | V | |||
| E2DRY6 ENO1 | Phosphopyruvate hydratase | V | |||
| A0A2U8J951 IgH | Ig heavy chain variable region | V | |||
| B2R6J2 VIL2 | cDNA, FLJ92973, highly similar to Homo sapiens villin 2 (ezrin) (VIL2), mRNA | V | |||
| Q0KKI6 | Immunoglobulin light chain (Fragment) | V | V | ||
| A0A286YES1 IGHG3 | Immunoglobulin heavy constant gamma 3 | V | |||
| P0C0S5 | Histone H2A.Z | V | V | ||
| H0Y8D1 | Serine protease 1 | V | V | V | |
| A0A0M4FNU3 ALDOA | Fructose-bisphosphate aldolase | V | |||
| A0A0K2BMD8 HBA2 | Mutant haemoglobin alpha 2 globin chain | V | V | V | |
| A0A024R5Z9 | Pyruvate kinase | V | V | V | |
| A0A0S2Z4D4 | Proteolipid protein 1 isoform 1 | V | |||
| A0A024R210 IFITM1 | Interferon-induced transmembrane protein 1 (9–27) | V | |||
| A0A2R8Y619 | Histone H2B type 2-K1 | V | |||
| P81605-2 DCD | Isoform 2 of Dermcidin | V | V | ||
| A0A385KNS5 CD44 | CD44 antigen | V | |||
| Q2QD09 TPI1 | Triosephosphate isomerase | V | |||
| Q2VPJ6 HSP90AA1 | HSP90AA1 protein | V | |||
| Q14D04-2 VEPH1 | Isoform 2 of Ventricular zone-expressed PH domain-containing protein homolog 1 | V | |||
| A0A024R1K7 | Tyrosine 3-monooxygenase/tryptophan 5-monooxygenase activation protein, eta polypeptide | V | |||
| H6VRF8 KRT1 | Keratin, type II cytoskeletal 1 | V | V | V | |
| A0A2R8Y793 | Actin, cytoplasmic 1 | V | |||
| P0C0S8 | Histone H2A type 1 | V | |||
| A0A024R4F1 | Phosphopyruvate hydratase | V | V | ||
| P0DOY2 | Immunoglobulin lambda constant 2 | V | |||
| A0A481SHK9 HBB | Haemoglobin subunit beta | V | |||
| A0A024RCJ2 | Histone H2B | V | |||
| A0A024RA28 HNRNPA2B1 | Heterogeneous nuclear ribonucleoprotein A2/B1 | V | |||
| Q9BS19 | Epididymis secretory sperm binding protein | V | |||
| A0A0A0MRQ5 | Peroxiredoxin-1 | V | |||
| A0A286YFJ8 | Immunoglobulin heavy constant gamma 4 | V | |||
| A0A5C2GPU9 | IG c1228_heavy_IGHV3-33_IGHD1-1_IGHJ4 | V | |||
| Q9Y5H4-2 PCDHGA1 | Isoform 2 of Protocadherin gamma-A1 | V | |||
| A0A2R8Y5P0 | Radixin | V | |||
| P48668 | Keratin, type II cytoskeletal 6C, KRT6C | V | V | ||
| P15924 | Desmoplakin | V | |||
| B4DKV4 KRT6B | cDNA FLJ60647, highly similar to Keratin, type II cytoskeletal 6B | V | |||
| Q04695 | Keratin, type I cytoskeletal 17, KRT17 | V | |||
| Q86YZ3 | Hornerin | V | |||
| Q02413 | Desmoglein-1 | V | |||
| P12035 | Keratin, type II cytoskeletal 3 | V | |||
| A0A0C4DGB6 | Albumin | V | |||
| Q0IIN1 KRT77 | Keratin 77 | V | |||
| A0A024R952 | Plakophilin 1 (Ectodermal dysplasia/skin fragility syndrome) | V | |||
| Q86Y46 | Keratin, type II cytoskeletal 73 | V | |||
| Q8N1N4 | Keratin, type II cytoskeletal 78 | V | |||
| A0A494C0J7 | TGc domain-containing protein | V | |||
| A0A1U9X8X5 CDSN | Corneodesmosin | V | |||
| Q9HB00 | Desmocollin 1 | V | |||
| Q5D862 | Filaggrin-2, FLG2 | V | |||
| Q5K634 | SCCA2/SCCA1 fusion protein isoform 1 | V | |||
| P05089-2 ARG1 | Isoform 2 of Arginase-1, ARG1 | V | |||
| Q3SYB5 SERPINB12 | Serpin B12 | V | |||
| P47929 | Galectin-7, LGALS7B | V | |||
| A0A087WYS6 | Proteasome (Prosome, macropain) subunit, alpha type, 8 | V | |||
| A0A384P5Q0 | Catalase | V | |||
| E7DVW5 | Fatty acid binding protein 5 (Psoriasis-associated) | V | |||
| P05109 | Protein S100-A8 | V | |||
| A0JNT2 KRT83 | KRT83 | V | |||
| B4DF70 PRDX2 | cDNA FLJ60461, highly similar to Peroxiredoxin-2 | V | |||
| Q6KB66-3 KRT80 | Isoform 3 of Keratin, type II cytoskeletal 80, KRT80 | V | |||
| P42357-2 HAL | Isoform 2 of Histidine ammonia-lyase | V | |||
| A0A024RC29 DSC3 | Desmocollin 3 | V | |||
| B0AZM8 TGM1 | cDNA, FLJ79468, highly similar to Protein-glutamine gamma-glutamyltransferase K | V | |||
| A0A2R8YD45 | Tripeptidyl-peptidase 1, TPP1 | V | |||
| Q9NZT1 | Calmodulin-like protein 5 | V | |||
| A0A7P0TAI0 HSPA5 | 78 kDa glucose-regulated protein | V | |||
| A0A0B4J259 | Lysozyme C | V | |||
| J3KSD8 | Bleomycin hydrolase (Fragment) | V | |||
| A0A2R8Y5E5 | Glutathione S-transferase P, GSTP1 | V | |||
| A0A248RGE3 RPS27A | Ubiquitin-40S ribosomal protein S27a (Fragment) | V | |||
| A0A024RD80 | Heat shock protein 90kDa alpha (Cytosolic), class B member 1, HSP90AB1 | V | |||
| A0A024R8D7 | Lipocalin 1 (Tear prealbumin), isoform CRA_a | V | |||
| A0A087WVQ6 | Clathrin heavy chain, CLTC | V | |||
| A0A0K2BMD8 HBA2 | Mutant haemoglobin alpha 2 globin chain | V | |||
| A0A087WUB9 | Beta-catenin-like protein 1, CTNNBL1 | V | |||
| A0A0S2Z3L4 CTSD | Cathepsin D isoform 2 (Fragment), CTSD | V | |||
| Q5T750 | Skin-specific protein 32 | V | |||
| A0A0U1RQT9 | Synaptophysin-like protein 1 (Fragment), SYPL1 | V | |||
| Q9Y3R4 | Sialidase-2, NEU2 | V | |||
| B4DGC3 APOD | Apolipoprotein D | V | |||
| F5GX11 | Proteasome subunit alpha type-1, PSMA1 | V | |||
| A0A024RAM2 | Glutaredoxin (Thioltransferase) | ||||
| P0DOX8 IGL1 | Immunoglobulin lambda-1 light Chain, IGL1 | V | |||
| B4DTN4 | N6-adenosine-methyltransferase catalytic subunit, METTL3 | V | |||
| A0A140VK00 | Testicular tissue protein Li 227 | V | |||
| A0A1B4WRL5 HBB | Beta globin (Fragment) | V | |||
| B3VL17 | Beta globin (Fragment) | V | |||
| A0A1B0GVI3 KRT10 | Keratin, type I cytoskeletal 10 KRT10 | V | V | ||
| P02790 | Hemopexin | V | V | ||
| B4DE59 A0A024R1X8 JUP | Junction plakoglobin | V | V | ||
| A1A508 PRSS3 | PRSS3 protein | V | V | ||
| Q86W19 PRSS1 | Protease serine 1 (Fragment), PRSS1 | V | |||
| A0A024RAY2 | Keratin 18 | V | |||
| B2R4M6 S100A9 | Protein S100 | V | V |
| STRING Cluster Pathways | PC3 ctrl | PC3 LMF |
|---|---|---|
| Pachyonychia congenita and Epidermolysis bullosa simplex Dowling–Meara type | V | |
| Formation of the cornified envelope and Serpin, conserved site | V | |
| Phosphoglycerate kinase and Aerobic glycolysis | V | |
| Glycolysis and sugar phosphatase activity | V | |
| Carbon metabolism and Pyruvate metabolism | V | |
| KEGG Pathways | PC3 ctrl | PC3 LMF |
| African trypanosomiasis | V | V |
| Glycolysis/Gluconeogenesis | V | V |
| Malaria | V | |
| Systemic lupus erythematosus | V | V |
| Biosynthesis of amino acids | V | V |
| Viral myocarditis | V | |
| HIF-1 signalling pathway | V | V |
| Phagosome | V | |
| Pathogenic E.coli infection | V | V |
| Carbon metabolism | V | V |
| Alcoholism | V | |
| Tight junction | V | |
| Viral carcinogenesis | V | V |
| Salmonella infection | V | |
| Amyotrophic lateral sclerosis | V | |
| S. aureus infection | V | |
| Biological Process GO | PC3 ctrl | PC3 LMF |
| Hydrogen peroxidase catabolic process | V | |
| Retina homeostasis | V | |
| Nitric oxide transport | V | |
| Positive regulation of plasminogen activation | V | |
| Positive regulation of vesicle function | V | |
| Canonical glycolysis | V | |
| Glycolytic process | V | |
| Killing of host by symbiont cells | V | |
| Intermediate filament organisation | V | |
| Keratinisation | V | |
| Keratinocyte differentiation | V | |
| Complement activation | V | |
| Glucose metabolic process | V | |
| Hexose metabolic process | V | |
| Antimicrobial humoral response | V | |
| Humoral immune response | V | |
| Epidermis development | V | |
| Supramolecular fibre organisation | V | |
| Defence response to bacterium | V | |
| Epithelial cell differentiation | V | |
| Monocarboxylic acid metabolic process | V | |
| Cytoskeleton organisation | V | |
| Defence response to other organism | V | |
| Innate immune response | V | |
| Epithelium development | V | |
| Response to other organism | V | |
| Defence response | V | |
| Immune response | V | |
| Immune system process | V | |
| Response to external stimulus | V | |
| Organelle organisation | V | |
| Response to stress | V | |
| Cellular component organisation | V | |
| Wiki Pathways | ||
| Aerobic glycolysis | V | V |
| Glycolysis and gluconeogenesis | V | V |
| Glycolysis in senescence | V | V |
| Metabolic reprogramming in colon cancer | V | V |
| Pathogenic Escherichia coli infection | V | V |
| Clear cell renal cell carcinoma pathways | V | V |
| Cori cycle | V | |
| Sudden infant death syndrome (SIDS) susceptibility pathways | V | |
| VEGFA-VEGFR2 signalling | V | |
| HIF1A and PPARG regulation of glycolysis | V | |
| Corticotropin-releasing hormone signalling pathway | V | |
| Molecular Function GO | PC3 ctrl | PC3 LMF |
| Structural constituent of cytoskeleton | V | V |
| Cadherin binding | V | V |
| Structural molecule activity | V | V |
| Protein binding | V | V |
| Phospholipidase A2 inhibitor activity | V | |
| Structural constituent of skin epidermis | V | |
| Disordered domain-specific binding | V | |
| Protein dimerization activity | V | |
| Cellular Component GO | PC3 ctrl | PC3 LMF |
| Haptoglobin–haemoglobin complex | V | V |
| Haemoglobin complex | V | V |
| Endocytic vesicle lumen | V | V |
| CENP-A containing nucleosome | V | |
| Blood microparticle | V | |
| Ficolin-1-rich granule lumen | V | V |
| Nuclear matrix | V | |
| Nucleosome | V | |
| Keratin filament | V | V |
| Cortical cytoskeleton | V | |
| Secretory granule lumen | V | V |
| Cell cortex | V | |
| Endocytic vesicle | V | |
| Chromosomal region | V | |
| Extracellular exosome | V | V |
| Secretory granule | V | V |
| Polymeric cytoskeletal fibre | V | V |
| Supramolecular fibre | V | V |
| Extracellular space | V | V |
| Vesicle | V | V |
| Cytoplasmic vesicle | V | V |
| Cytoskeleton | V | V |
| Intracellular non-membrane-bounded organelle | V | |
| Cytosol | V | V |
| Protein containing complex | V | V |
| Extrinsic component of external side of plasma membrane | V | |
| Immunoglobulin complex, circulating | V | |
| M band | V | |
| Cornified envelope | V | |
| Myelin sheath | V | |
| Blood microparticle | V | |
| Intermediate filament | V | V |
| Basal plasma membrane | V | |
| Basolateral plasma membrane | V | |
| Extrinsic component of membrane | V | |
| Collagen-containing extracellular matrix | V | |
| Apical plasma membrane | V | |
| Side of membrane | V | |
| Cell surface | V | |
| Intracellular non-membrane bound organelle | V | |
| Disease–Gene Associations | PC3 ctrl | PC3 LMF |
| Amyloidosis | V | V |
| Cutaneous T-cell lymphoma | V | |
| non-Hodgkin lymphoma | V | V |
| Primary cutaneous amyloidosis | V | |
| Familial visceral amyloidosis | V | V |
| Skin carcinoma | V | |
| Borst–Jadassohn intraepidermal carcinoma | V | V |
| Hematopoietic system disease | V | V |
| Carcinoma | V | V |
| Seborrheic keratosis | V | V |
| Mycosis fungoides | V | V |
| Alpha thalassemia | V | |
| Blood protein disease | V | |
| Organ system cancer | V | |
| Hepatocellular carcinoma | V | |
| Inherited metabolic disorder | V | |
| Alpha thalassemia | V | |
| Keratosis | V | |
| Palmoplantar keratosis | V | |
| Pachyonychia congenita | V | |
| Nonepidermolytic palmoplantar keratoderma | V | |
| Congenital haemolytic anaemia | V | |
| Primary cutaneous amyloidosis | V | |
| Autosomal dominant disease | V | |
| Epidermolysis bullosa simplex Dowling–Meara type | V | |
| Epidermolysis bullosa simplex with mottled pigmentation | V | |
| Focal nonepidermolytic palmoplantar keratoderma | V | |
| Basal cell carcinoma | V | |
| Skin disease | V | |
| Steatocystoma multiplex | V | |
| Blood protein disease | V | |
| Reactome Pathways | PC3 ctrl | PC3 LMF |
| Erythrocytes take up oxygen and release carbon dioxide | V | V |
| Scavenging of heme from plasma | V | V |
| Erythrocytes take up carbon dioxide and release oxygen | V | V |
| Chaperone mediated Autophagy | V | V |
| Prefoldin-mediated transfer of substrate to CCT/Tric | V | |
| RHO GTPases activate IQGAPs | V | |
| Recyclin pathway of L1 | V | |
| RNA polymerase I promoter opening | V | |
| Gluconeogenesis | V | V |
| Packaging of telomere ends | V | |
| DNA methylation | V | |
| Activated PKN1 stimulates transcription of androgen receptor | V | |
| Gene and protein expression by JAK-STAT signalling | V | |
| SIRT1 negatively regulates rRNA expression | V | |
| Cleavage of damaged purine | V | |
| Recognition and association of DNA glycosylase with site containing an affected purine | V | |
| B-WICH complex positively regulates rRNA expression | V | |
| HDACs deacetylate histones | V | |
| Assembly of the ORC complex at the origin of replication | V | |
| Diseases of programmed cell death | V | |
| Glycolysis | V | V |
| HCMV early events | V | |
| HATs acetylate histones | V | |
| HCMV late events | V | |
| Formation of the cornified envelope | V | V |
| Autophagy | V | V |
| Factors involved in megakaryocyte development and platelets | V | |
| RHO GTPase effectors | V | |
| Neutrophil degranulation | V | V |
| M phase | V | V |
| Cellular responses to stress | V | V |
| Vesicle-mediated transport | V | |
| Infectious disease | V | |
| Hemostasis | V | |
| Developmental biology | V | V |
| Innate immune system | V | V |
| Disease | V | |
| Post-translational protein modification | V | |
| Immune system | V | |
| Type I hemidesmosome assembly | V | |
| HSF1 activation | V | |
| Binding and uptake in ligands by scavenger receptors | V | |
| RHO-GTPases activate PNKs | V | |
| Metabolism of carbohydrates | V | |
| Immune system | V | |
| Human Phenotype | PC3 ctrl | PC3 LMF |
| Palmoplantar blistering | V | |
| Blistering by anatomical location | V | |
| Onychogryphosis | V | |
| Lower limb pain | V | |
| Nail dystrophy | V | |
| Hyperhidrosis | V | |
| Palmoplantar keratoderma | V | |
| Hoarse voice | V | |
| Nail dysplasia | V | |
| Steatocystoma multiplex | V | |
| Eruptive vellus hair cyst | V | |
| Abnormal fingernail morphology | V | |
| Linear arrays of macular hyperkeratosis in flexural areas | V | |
| Hypohidrosis or hyperhidrosis | V | |
| Neoplasm of the skin | V | |
| Onychogryphosis of toenails | V | |
| Abnormality of the digestive system | V | |
| Angular cheilitis | V | |
| Hyperplastic callus formation | V | |
| Onychogryphosis of fingernail | V | |
| Paronychia | V | |
| Abnormality of skin morphology | V | |
| Pain | V | |
| Abnormality of temperature regulation | V | |
| Palmoplantar hyperhidrosis | V | |
| Constitutional symptom | V | |
| Epidermoid cyst | V | |
| Abdominal symptom | V | |
| Neoplasm by anatomical site | V | |
| Pain | V | |
| Ear pain | V | |
| Thickened skin | V | |
| Sign or symptom | V | |
| Fingernail dysplasia | V | |
| Oral leukoplakia | V | |
| Follicular hyperkeratosis | V | |
| White lesion of the oral mucosa | V | |
| Jaundice | V | |
| Mottled pigmentation of the trunk and proximal extremities | V | |
| Discrete 2 to 5 mm hyper- and hypopigmented macules | V | |
| Alopecia | V | |
| Abnormality of digestive system physiology | V | |
| Focal friction-related palmoplantar hyperkeratosis | V | |
| Generalised reticulate brown pigmentation | V | |
| Localised skin lesion | V | |
| Natal tooth | V | |
| Pain in head and neck region | V | |
| Cholestasis | V | |
| Punctate palmoplantar hyperkeratosis | V | |
| Skin fragility with non-scarring blistering | V | |
| Smooth tongue | V | |
| Foot pain | V | |
| Genital blistering | V | |
| Hyperkeratotic papule | V | |
| Fever | V | |
| Acute episodes of neuropathic symptoms | V | |
| Reticulated skin pigmentation | V | |
| Depigmentation/hyperpigmentation of skin | V | |
| Aplasia cutis congenita on trunk or limbs | V | |
| Hypomelanotic macule | V | |
| Generalised abnormality of skin | V | |
| Abnormality of the skeletal system | V | |
| Chronic haemolytic anaemia | V | |
| Erythematous papule | V | |
| Dermatological manifestations of systemic disorders | V | |
| Upper limb pain | V | |
| Cholelithiasis | V | |
| Spotty hyperpigmentation | V | |
| Spotty hypopigmentation | V | |
| Diffuse palmoplantar hyperkeratosis | V | |
| Erosion of oral mucosa | V | |
| Abnormal circulating protein concentration | V | |
| Lower limb amyotrophy | V | |
| Abnormal hair quantity | V | |
| Nonspherocytic haemolytic anaemia | V | |
| Lamina lucida cleavage | V | |
| Abnormality of blood and blood-forming tissues | V | |
| Feeding difficulties | V | |
| Anaemia of inadequate production | V | |
| Abnormal oral mucosa morphology | V | |
| Anaemia | V | |
| Abnormal skeletal morphology | V | |
| Oral mucosal blisters | V | |
| Decreased body weight | V | |
| Female reproductive system disease | V | |
| Cutaneous photosensitivity | V | |
| Abnormal hair morphology | V | |
| Abnormality of the respiratory system | V | |
| Congestive heart failure | V | |
| Absent toenail | V | |
| Abnormality of the immune system | V | |
| Cholecystitis | V | |
| Abnormality of the musculoskeletal system | V | |
| Ovarian endometrioid carcinoma | V | |
| Normocytic anaemia | V |
| STRING Cluster Pathways | PNT2 ctrl | PNT2 LMF |
|---|---|---|
| Formation of the cornified envelope and Autosomal recessive congenital ichthyosis | V | |
| Formation of the cornified envelope and Serpin, conserved site | V | V |
| Desmosome and Ichthyosis vulgaris | V | V |
| Keratinisation and Cornified envelope | V | |
| Mixed, incl. Pachyonychia congenita and Epidermolysis bullosa simplex Dowling–Meara type | V | |
| Pachyonychia congenita and Epidermolysis bullosa simplex Dowling–Meara type | V | V |
| Mixed, incl. Pachyonychia congenita and Netherton syndrome | V | |
| Mixed, incl. Ichthyosis vulgaris and Bullous congenital ichthyosiform erythroderma | V | |
| Pachyonychia congenita and Epidermolysis bullosa simplex Dowling–Meara type | V | V |
| Mixed, incl. S100/CaBP-9k-type, calcium binding, subdomain, and Cystatin superfamily | V | |
| Naxos disease and Subcorneal pustular dermatosis | V | |
| Ichthyosis vulgaris and Epidermolytic acanthoma | V | V |
| S100/CaBP-9k-type, calcium binding, subdomain, and Annexin | V | |
| S-100/ICaBP-type calcium binding domain | V | |
| Keratin filament and Keratin, type I | V | |
| Detoxification of ROS and mRNA, protein, and metabolite induction pathway by cyclosporin A | V | |
| Mixed, incl. COVID-19, thrombosis and anticoagulation, and Scavenging of heme from plasma | V | |
| Mixed, incl. Glutathione metabolism and Detoxification of Reactive Oxygen Species | V | |
| Alcoholic pancreatitis and Typhus | V | V |
| Cell adhesive protein binding involved in bundle of His cell-Purkinje myocyte communication | V | |
| KEGG Pathways: | PNT2 ctrl | PNT LMF |
| Oestrogen signalling pathway | V | V |
| Staphylococcus aureus infection | V | V |
| Biosynthesis of amino acids | V | |
| Biological Process GO | PNT2 ctrl | PNT LMF |
| Intermediate filament organisation | V | V |
| Intermediate filament cytoskeleton organisation | V | |
| Epidermis development | V | V |
| Keratinocyte differentiation | V | V |
| Keratinisation | V | V |
| Skin development | V | V |
| Epithelial cell differentiation | V | V |
| Supramolecular fibre organisation | V | V |
| Epithelium development | V | |
| Tissue development | V | |
| Cellular oxidant detoxification | V | |
| Response to toxic substance | V | |
| Multicellular organismal process | V | |
| Anatomical structure development | V | V |
| Cell differentiation | V | |
| Developmental process | V | |
| Cytoskeleton organisation | V | V |
| Animal organ development | V | |
| Peptide cross-linking | V | |
| Retina homeostasis | V | |
| Humoral immune response | V | V |
| Immune response | V | |
| Cell–cell adhesion | V | |
| Multicellular organismal homeostasis | V | |
| Antimicrobial humoral response | V | V |
| Response to biotic stimulus | V | |
| Cellular process | V | |
| Response to reactive oxygen species | V | |
| Peptidyl-cysteine S-nitrosylation | V | |
| Hydrogen peroxide catabolic process | V | |
| Catabolic process | V | |
| Biological process involved in interspecies interaction between organisms | V | |
| Response to other organism | V | |
| Establishment of skin barrier | V | |
| Cell adhesion | V | |
| Defence response to other organism | V | V |
| Immune system process | V | |
| Cellular catabolic process | V | |
| Response to external stimulus | V | V |
| Tissue homeostasis | V | |
| Homeostatic process | V | |
| Ageing | V | |
| Response to oxidative stress | V | |
| Glucose metabolic process | V | |
| Peptidyl-cysteine S-trans-nitrosylation | V | |
| Neutrophil aggregation | V | |
| Defence response to fungus | V | |
| Cell envelope organisation | V | |
| Defence response | V | |
| Defence response to bacterium | V | |
| Response to bacterium | V | |
| Sequestering of zinc ion | V | |
| Wiki Pathways | PNT2 ctrl | PNT LMF |
| Aerobic glycolysis | V | |
| Glycolysis in senescence | V | |
| Network map of SARS-CoV-2 signalling pathway | V | |
| Corticotropin-releasing hormone signalling pathway | V | |
| Molecular Function GO | PNT2 ctrl | PNT LMF |
| Structural constituent of skin epidermis | V | V |
| Structural molecule activity | V | V |
| Antioxidant activity | V | |
| Fatty acid binding | V | |
| Structural constituent of cytoskeleton | V | V |
| Calcium ion binding | V | |
| Cellular Component GO | PNT2 ctrl | PNT LMF |
| Extracellular space | V | V |
| Extracellular exosome | V | V |
| Extracellular region | V | |
| Vesicle | V | V |
| Cornified envelope | V | V |
| Intermediate filament cytoskeleton | V | |
| Intermediate filament | V | V |
| Keratin filament | V | V |
| Secretory granule | V | V |
| ficolin-1-rich granule | V | |
| Secretory granule lumen | V | |
| Polymeric cytoskeletal fiber | V | |
| Cytoplasmic vesicle | V | |
| Desmosome | V | |
| Supramolecular fiber | V | |
| ficolin-1-rich granule lumen | V | |
| Cytosol | V | V |
| Tertiary granule | V | |
| Cytoskeleton | V | V |
| Cytoplasm | V | |
| Melanosome | V | |
| Collagen-containing extracellular matrix | V | V |
| Blood microparticle | V | V |
| Tertiary granule lumen | V | |
| ficolin-1-rich granule membrane | V | |
| Vacuolar lumen | V | |
| Endomembrane system | V | |
| Azurophil granule lumen | V | |
| Organelle | V | |
| Lysosome | V | |
| Specific granule lumen | V | |
| Endocytic vesicle lumen | V | V |
| Keratohyalin granule | V | |
| Membrane-bounded organelle | V | |
| Intracellular organelle | V | |
| Intracellular non-membrane-bounded organelle | V | V |
| Intracellular anatomical structure | V | |
| Cell periphery | V | |
| Cell–cell junction | V | |
| Proteasome core complex, alpha-subunit complex | V | |
| Fascia adherens | V | |
| Secretory granule membrane | V | |
| Haptoglobin–haemoglobin complex | V | |
| Cytoplasmic vesicle membrane | V | |
| Haemoglobin complex | V | |
| Bounding membrane of organelle | V | |
| Endocytic vesicle | V | |
| Disease–Gene Associations | PNT2 ctrl | PNT LMF |
| Keratosis | V | V |
| Palmoplantar keratosis | V | V |
| Integumentary system disease | V | |
| Skin disease | V | V |
| Amyloidosis | V | |
| Pachyonychia congenita | V | V |
| Familial visceral amyloidosis | V | |
| Nonepidermolytic palmoplantar keratoderma | V | V |
| Autosomal dominant disease | V | V |
| Bullous skin disease | V | V |
| Dermatitis | V | |
| Acanthoma | V | V |
| Pemphigus | V | |
| Steatocystoma multiplex | V | V |
| Borst–Jadassohn intraepidermal carcinoma | V | V |
| Subcorneal pustular dermatosis | V | |
| Carcinoma | V | V |
| Epidermolysis bullosa | V | |
| Seborrheic keratosis | V | V |
| Mycosis fungoides | V | V |
| Basal cell carcinoma | V | V |
| Skin cancer | V | |
| Hair disease | V | |
| Ichthyosis | V | |
| Inherited metabolic disorder | V | |
| Autosomal genetic disease | V | V |
| Disease | V | |
| Genetic disease | V | |
| Monogenic disease | V | |
| Arrhythmogenic right ventricular cardiomyopathy | V | |
| Primary cutaneous amyloidosis | V | V |
| Epidermolysis bullosa simplex Dowling–Meara type | V | V |
| Epidermolysis bullosa simplex with mottled pigmentation | V | V |
| Focal nonepidermolytic palmoplantar keratoderma | V | V |
| Epidermolytic acanthoma | V | V |
| Bullous congenital ichthyosiform erythroderma | V | V |
| Disease of anatomical entity | V | V |
| Immune system disease | V | |
| Epidermolytic hyperkeratosis | V | V |
| Stomach cancer | V | |
| Naxos disease | V | |
| Autoimmune disease of skin and connective tissue | V | |
| Hematopoietic system disease | V | |
| Reactome Pathways | PNT2 ctrl | PNT LMF |
| Formation of the cornified envelope | V | V |
| Neutrophil degranulation | V | |
| Developmental Biology | V | |
| Innate Immune System | V | |
| Immune System | V | |
| Cellular response to chemical stress | V | |
| Scavenging of heme from plasma | V | V |
| Cellular responses to stress | V | |
| Chaperone-Mediated Autophagy | V | |
| Apoptotic cleavage of cell adhesion proteins | V | |
| Antimicrobial peptides | V | |
| ER-Phagosome pathway | V | |
| Apoptosis | V | |
| Transport of small molecules | V | |
| The role of GTSE1 in G2/M progression after G2 checkpoint | V | |
| Metal sequestration by antimicrobial proteins | V | |
| Detoxification of Reactive Oxygen Species | V | |
| PCP/CE pathway | V | |
| Class I MHC-mediated antigen processing and presentation | V | |
| RUNX1 regulates transcription of genes involved in differentiation of HSCs | V | |
| Erythrocytes take up oxygen and release carbon dioxide | V | |
| Transport of fatty acids | V | |
| Type I hemidesmosome assembly | V | |
| Cell junction organisation | V | |
| Uptake of dietary cobalamins into enterocytes | V | |
| Human Phenotype (Monarch) | PNT2 ctrl | PNT LMF |
| Abnormal blistering of the skin | V | V |
| Palmoplantar keratoderma | V | V |
| Hyperkeratosis | V | |
| Nail dystrophy | V | V |
| Palmoplantar blistering | V | V |
| Abnormal epidermal morphology | V | |
| Epidermal thickening | V | |
| Blistering by anatomical location | V | V |
| Epidermal acanthosis | V | V |
| Follicular hyperkeratosis | V | V |
| Abnormality of the nail | V | |
| Hypohidrosis or hyperhidrosis | V | V |
| Alopecia | V | V |
| Nail dysplasia | V | V |
| Cheilitis | V | |
| Angular cheilitis | V | V |
| Hyperhidrosis | V | V |
| Onychogryphosis | V | V |
| Abnormal hair quantity | V | V |
| Erythema | V | V |
| Lower limb pain | V | V |
| Scaling skin | V | V |
| Abnormality of skin physiology | V | |
| Natal tooth | V | V |
| Steatocystoma multiplex | V | V |
| Eruptive vellus hair cyst | V | V |
| Linear arrays of macular hyperkeratosis in flexural areas | V | V |
| Neoplasm of the skin | V | V |
| Abnormality of the skin | V | |
| Onychogryphosis of toenails | V | V |
| Abnormality of skin morphology | V | V |
| Hyperplastic callus formation | V | V |
| Recurrent skin infections | V | V |
| Pruritus | V | |
| Onychogryphosis of fingernail | V | V |
| Abnormal fingernail morphology | V | V |
| Inflammatory abnormality of the skin | V | V |
| Abnormal oral mucosa morphology | V | V |
| Paronychia | V | V |
| Fragile skin | V | V |
| Palmoplantar hyperhidrosis | V | V |
| Epidermoid cyst | V | V |
| Hoarse voice | V | V |
| Absent toenail | V | V |
| Ear pain | V | V |
| Fingernail dysplasia | V | V |
| Abnormality of the respiratory system | V | V |
| Abnormality of immune system physiology | V | V |
| Abnormality of the dentition | V | V |
| Sparse hair | V | |
| Erythroderma | V | |
| Oral leukoplakia | V | V |
| White lesion of the oral mucosa | V | V |
| Skin erosion | V | V |
| Increased inflammatory response | V | |
| Decreased body weight | V | V |
| Localised skin lesion | V | V |
| Acantholysis | V | |
| Parakeratosis | V | |
| Constitutional symptom | V | V |
| Aplasia cutis congenita | V | V |
| Abnormality of the immune system | V | |
| Generalised abnormality of skin | V | V |
| Cutaneous photosensitivity | V | V |
| Pain in head and neck region | V | V |
| Neoplasm by anatomical site | V | V |
| Alopecia universalis | V | |
| Orthokeratosis | V | |
| Abnormality of the hand | V | |
| Abnormality of the lower limb | V | |
| Sepsis | V | |
| Onycholysis | V | |
| Failure to thrive | V | |
| Abnormality of the face | V | V |
| Sign or symptom | V | |
| Pain | V | V |
| Abnormality of nail colour | V | |
| Recurrent infections | V | |
| Abnormality of metabolism/homeostasis | V | |
| Growth abnormality | V | V |
| Mottled pigmentation of the trunk and proximal extremities | V | V |
| Discrete 2 to 5 mm hyper- and hypopigmented macules | V | V |
| Palmoplantar scaling skin | V | |
| Abnormal circulating transferrin concentration | V | |
| Unusual infection | V | |
| Abnormality of limbs | V | |
| Abnormal oral cavity morphology | V | |
| Impaired myocardial contractility | V | |
| Congenital bullous ichthyosiform erythroderma | V | V |
| Focal friction-related palmoplantar hyperkeratosis | V | V |
| Localised epidermolytic hyperkeratosis | V | |
| Generalised reticulate brown pigmentation | V | V |
| Abnormal immunoglobulin level | V | |
| Congenital ichthyosiform erythroderma | V | |
| Pain | V | V |
| Congenital alopecia totalis | V | |
| Punctate palmoplantar hyperkeratosis | V | V |
| Skin fragility with non-scarring blistering | V | V |
| Widely spaced toes | V | |
| Smooth tongue | V | V |
| 4–5 finger syndactyly | V | |
| Abdominal symptom | V | V |
| Foot pain | V | V |
| Genital blistering | V | V |
| Chapped lip | V | |
| Hyperkeratotic papule | V | V |
| Phenotypic abnormality | V | V |
| Skin plaque | V | V |
| Acute episodes of neuropathic symptoms | V | V |
| Reticulated skin pigmentation | V | V |
| Depigmentation/hyperpigmentation of skin | V | |
| Aplasia cutis congenita on trunk or limbs | V | V |
| Hypomelanotic macule | V | V |
| Tapered distal phalanges of finger | V | |
| Hypovolemic shock | V | |
| Abnormal circulating metabolite concentration | V | |
| Abnormal circulating protein concentration | V | V |
| Aplasia/Hypoplasia of the eyebrow | V | |
| Abnormality of hair texture | V | |
| 3–4 finger syndactyly | V | |
| Erythematous papule | V | V |
| Obsolete Bilateral external ear deformity | V | |
| Abnormal cellular phenotype | V | |
| Hypernatremia | V | |
| Patchy palmoplantar hyperkeratosis | V | |
| Upper limb pain | V | V |
| Abnormality of digestive system physiology | V | V |
| Sparse scalp hair | V | |
| Spotty hyperpigmentation | V | V |
| Spotty hypopigmentation | V | |
| Diffuse palmoplantar hyperkeratosis | V | V |
| Right ventricular cardiomyopathy | V | |
| Erosion of oral mucosa | V | V |
| Increased neuronal autofluorescent lipopigment | V | |
| Lamina lucida cleavage | V | V |
| Mitten deformity | V | |
| Autoamputation of digits | V | |
| Abnormal dermoepidermal hemidesmosome morphology | V | |
| Abnormality of the digestive system | V | |
| Abnormality of the skeletal system | V | |
| Abnormality of the musculoskeletal system | V | |
| Abnormal musculoskeletal physiology | V | |
| Conjunctival hamartoma | V | |
| Abnormal skeletal morphology | V | |
| Oral mucosal blisters | V | |
| Heat intolerance | V | |
| Squamous cell carcinoma of the skin | V | |
| Abnormal conjunctiva morphology | V | |
| Bronchomalacia | V | |
| Milia | V | |
| Abnormal epiglottis morphology | V | |
| Abnormality of temperature regulation | V | |
| Ridged nail | V | |
| Dystrophic toenail | V | |
| Distal lower limb amyotrophy | V | |
| Atrophic scars | V | |
| Respiratory distress | V | |
| Poor appetite | V |
Disclaimer/Publisher’s Note: The statements, opinions and data contained in all publications are solely those of the individual author(s) and contributor(s) and not of MDPI and/or the editor(s). MDPI and/or the editor(s) disclaim responsibility for any injury to people or property resulting from any ideas, methods, instructions or products referred to in the content. |
© 2024 by the authors. Licensee MDPI, Basel, Switzerland. This article is an open access article distributed under the terms and conditions of the Creative Commons Attribution (CC BY) license (https://creativecommons.org/licenses/by/4.0/).
Share and Cite
Lange, S.; Inal, J.M.; Kraev, I.; Dart, D.A.; Uysal-Onganer, P. Low Magnetic Field Exposure Alters Prostate Cancer Cell Properties. Biology 2024, 13, 734. https://doi.org/10.3390/biology13090734
Lange S, Inal JM, Kraev I, Dart DA, Uysal-Onganer P. Low Magnetic Field Exposure Alters Prostate Cancer Cell Properties. Biology. 2024; 13(9):734. https://doi.org/10.3390/biology13090734
Chicago/Turabian StyleLange, Sigrun, Jameel M. Inal, Igor Kraev, Dafydd Alwyn Dart, and Pinar Uysal-Onganer. 2024. "Low Magnetic Field Exposure Alters Prostate Cancer Cell Properties" Biology 13, no. 9: 734. https://doi.org/10.3390/biology13090734
APA StyleLange, S., Inal, J. M., Kraev, I., Dart, D. A., & Uysal-Onganer, P. (2024). Low Magnetic Field Exposure Alters Prostate Cancer Cell Properties. Biology, 13(9), 734. https://doi.org/10.3390/biology13090734