3.1.1. DdRab2 Plays a Role in the Regulation of Vesicular Trafficking
Dictyostelium discoideum has proven to be a useful system in which to investigate the molecular mechanisms regulating endosomal and lysosomal membrane trafficking. Rab GTPases have been implemented in playing an important role in the regulation in vesicle trafficking between intracellular organelles [
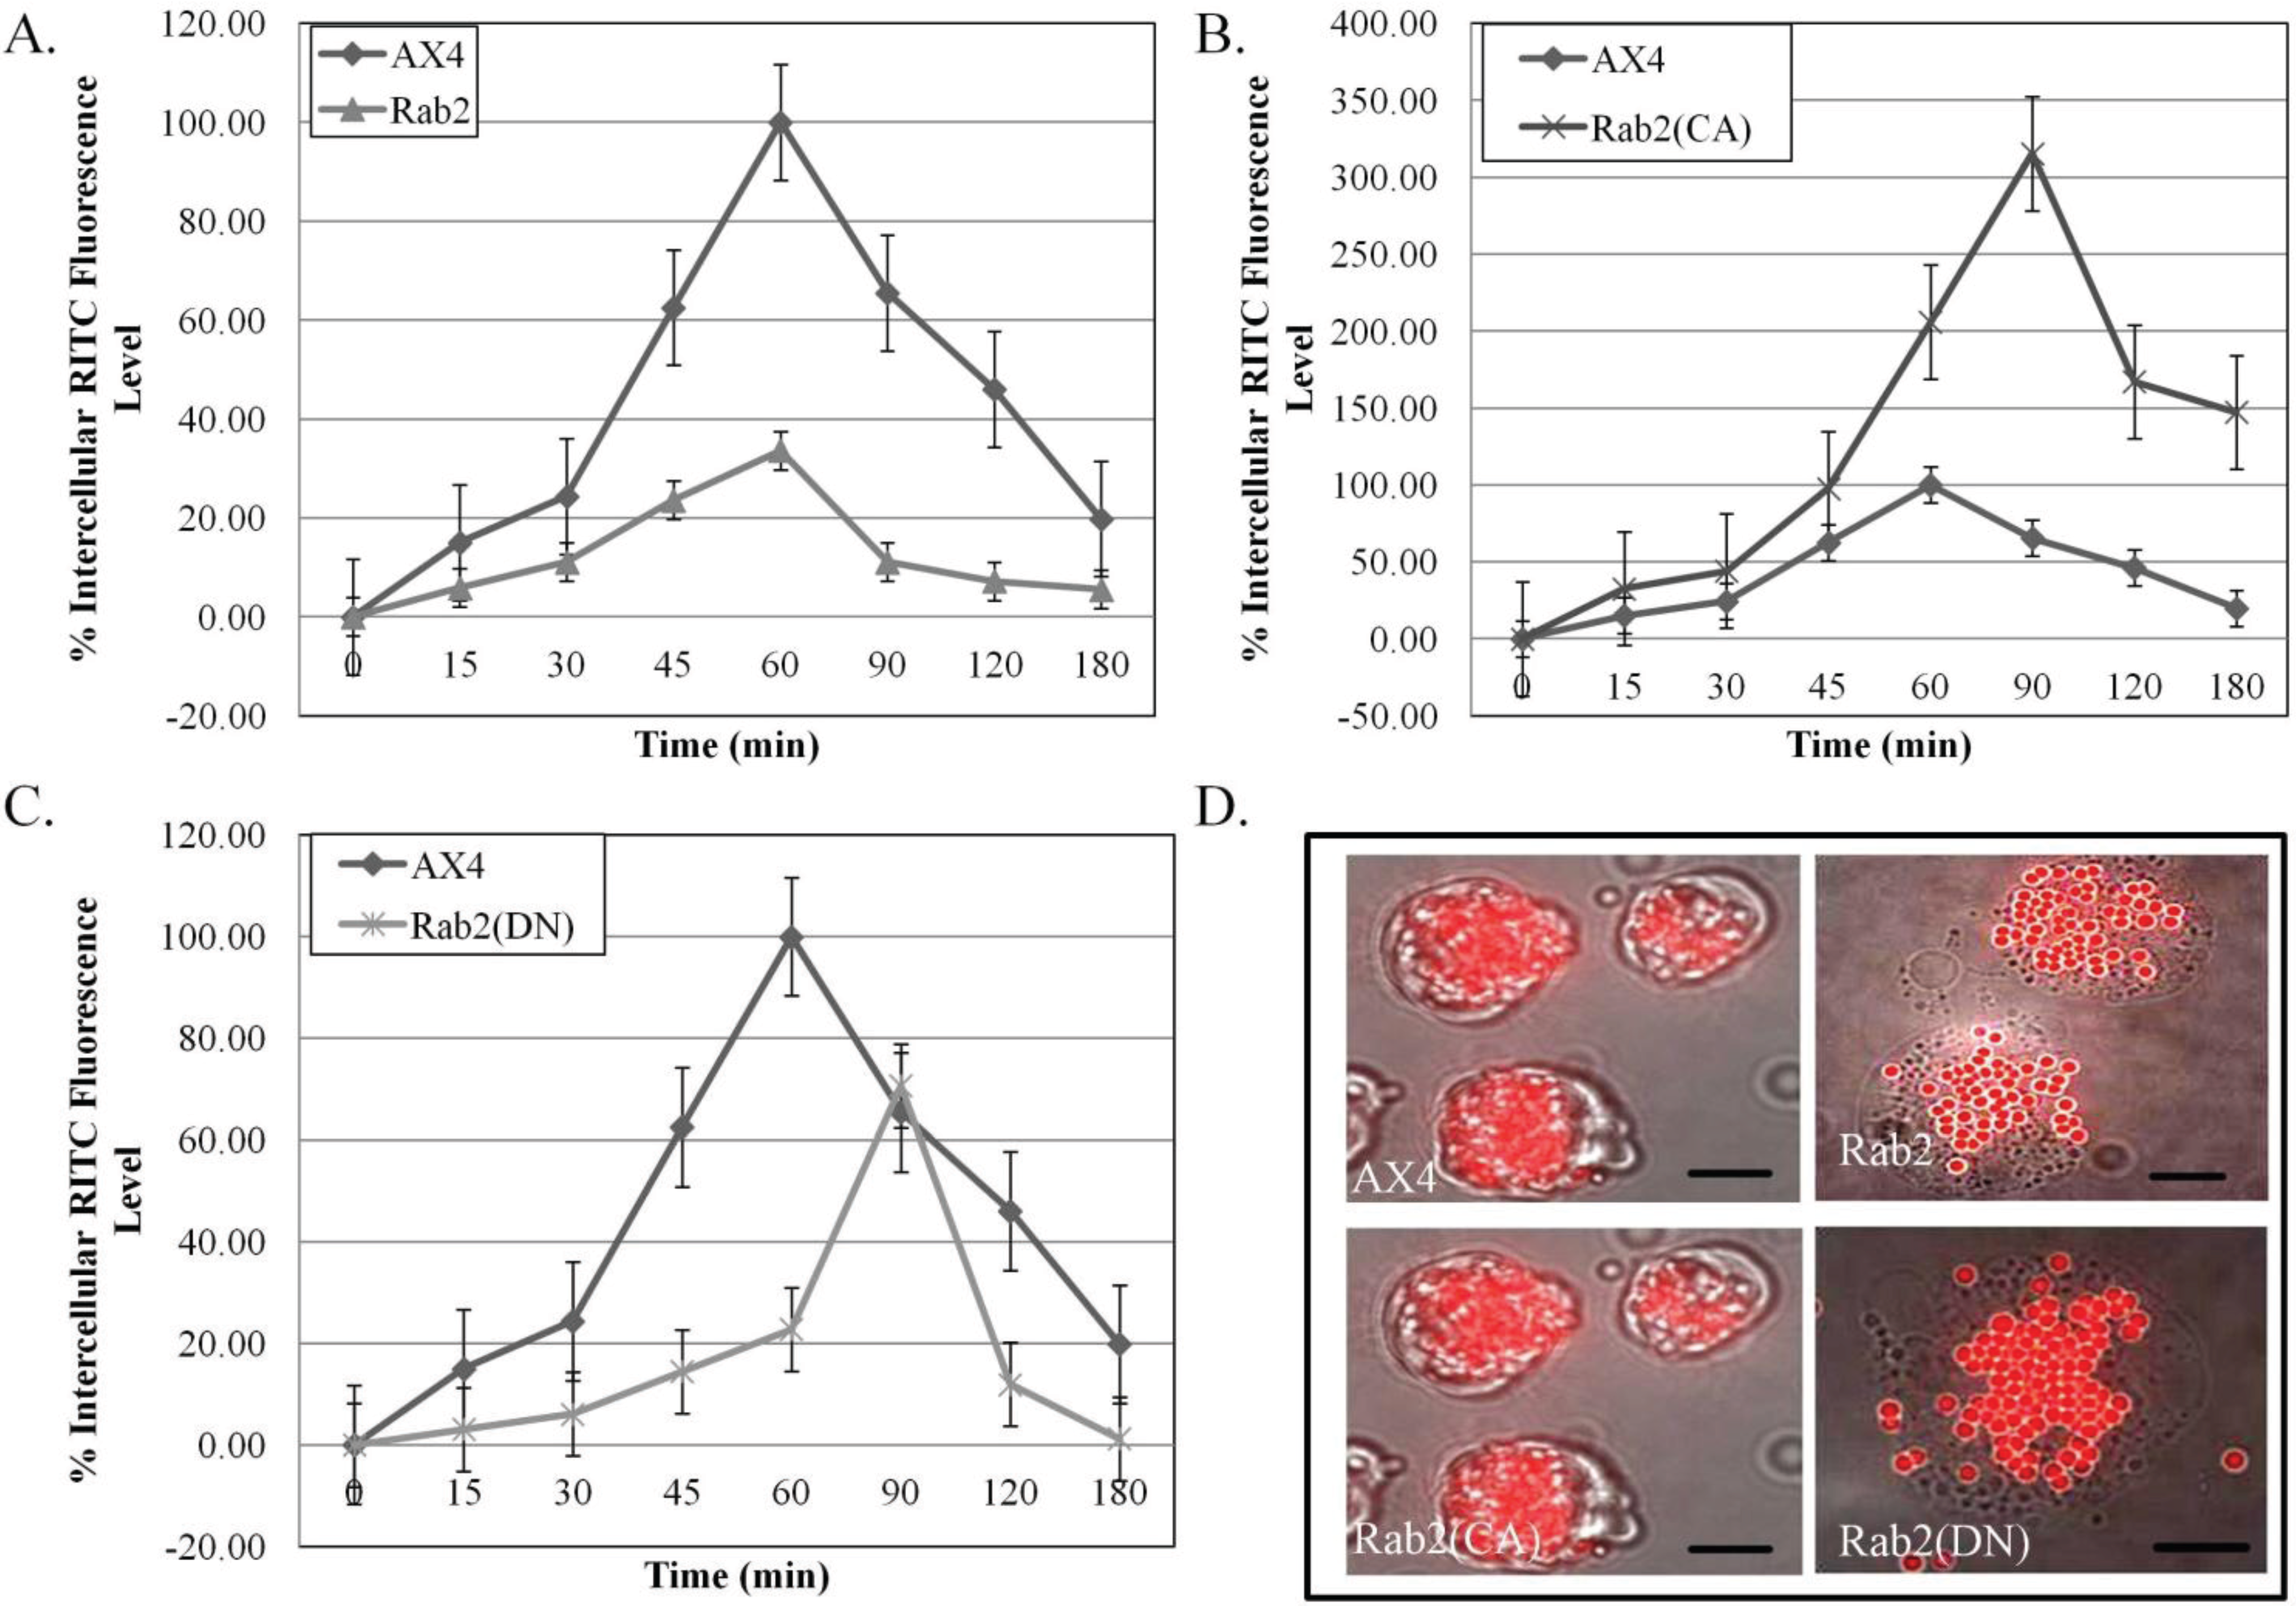
10]. The following experiment was performed in order to determine the role of DdRab2 in the endocytic pathway. For all experiments, cell lines were constructed to over-express DdRab2, DdRab2(CA), and DdRab2 (DN). Western blot analysis confirmed that all constructs were expressed at comparable levels (data not shown). The rate of phagocytosis was measured by assaying DdRab2 over-expressing, DdRab2(CA), and DdRab2(DN) cell lines for their ability to internalize latex beads compared to the parent strain AX4 cell line. Graphical representation shown in
Figure 1A shows a decrease in the internalization of latex beads in the DdRab2 over-expressing cell line. At the 60 min time point when the parent strain AX4 cells have a phagocytosis rate of 100%, the DdRab2 over-expressing cell line has a phagocytosis rate of only 30%, a 70% decrease. Conversely, in the DdRab2(CA) cell line (
Figure 1B) the rate of phagocytosis was increased. At the 60 min time point, the rate of phagocytosis shows an increase of 100% in the DdRab2(CA) cell line. The parent strain AX4 cells reach 100% phagocytosis at 60 min while the DdRab2(CA) cell line reach their maximum rate of phagocytosis after 90 min. Similar to the DdRab2 over-expressing cell line, the DdRab2(DN) cell line (
Figure 1C) shows a decrease in the rate of phagocytosis. Up to the 60-min time point, DdRab2(DN) cells show as much of an 80% decrease compared to the AX4 cells. While the AX4 cells reach 100% phagocytosis after 60 min, the DdRab2(DN) cell line does not reach its maximum rate of phagocytosis until 90 min, similar to that of the DdRab2(CA) cell line.
Figure 1D shows a photographic representation of the graphical results. The increase in the internalization of latex beads in the DdRab2(CA) cell line, and decrease in the internalization of latex beads in the DdRab2 over-expressing and DdRab2(DN) cell lines is apparent confirming the graphical evidence.
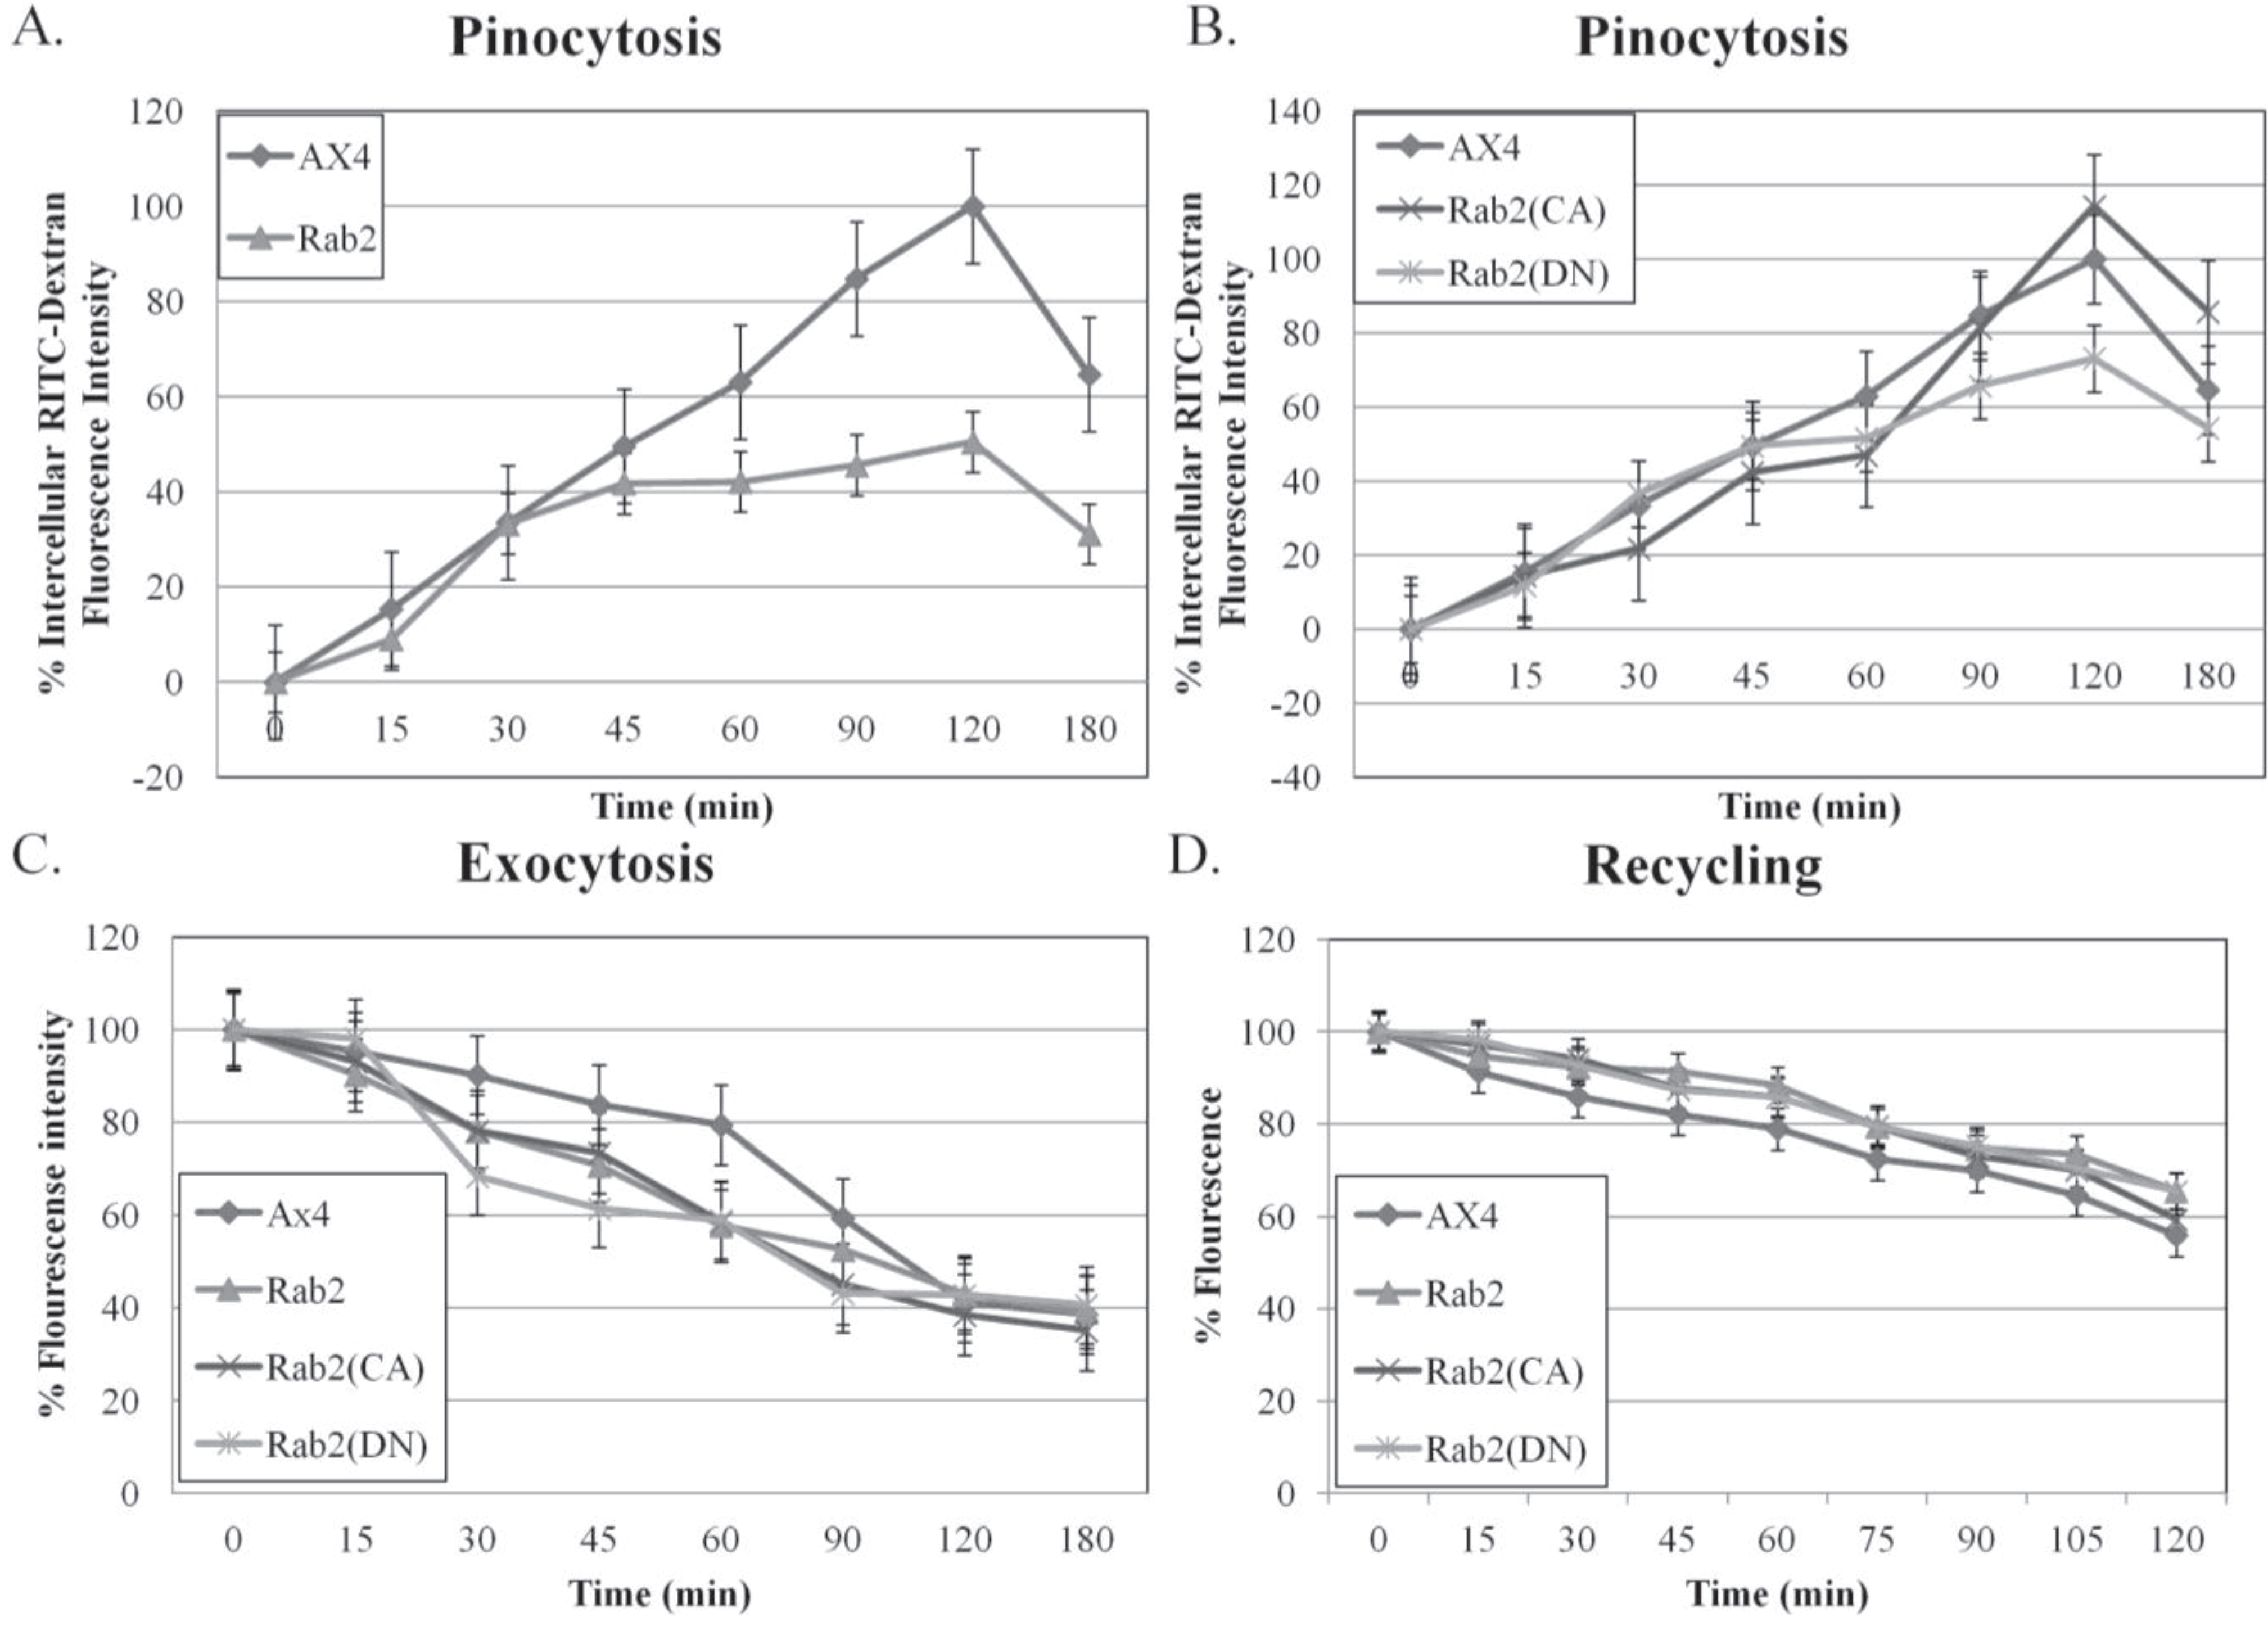
Given the dramatic effect of wild type and mutant DdRab2 overexpression on phagocytosis, further study into the role of DdRab2 in the endocytic pathway was done. The ability of the DdRab2 over-expressing, and DdRab2 mutant cell lines to internalize the fluid phase marker rhodamine isothiocyanate-dextran (RITC-dextran) was measured as a way to study pinocytosis. Analysis of the data shown in
Figure 2A shows a decrease of 55% in the internalization of RITC-dextran by the wild type DdRab2 overexpressing cell line as compared to the parent strain AX4 cells. Interestingly, the DdRab2(CA) cell line shows a slight increase of approximately 20% while the DdRab2(DN) cell line showed a slight decrease of approximately 35% in the internalization of RTIC-dextran compared to the AX4 cells (
Figure 2B).
Figure 1.
Phagocytosis is altered in DdRab2 over-expressing and DdRab2(CA) cell lines. (A–C) Graphical representation with standard error of the internalization of latex beads to quantify phagocytosis over 180 min showing significant differences (p > 0.05) in internal fluorescence in the Rab2 (▲) and Rab2(CA) (×) cell lines over the AX4 (♦) parent strain. Data is presented as the average of three individual experiments with relative fluorescence to AX4 which is being considered 100% at 60 min. (A) The Rab2 over-expressing cell line showed a significant decrease in internal fluorescence representing phagocytosis compared to the WT-AX4 cell line; (B) The Rab2(CA) expressing cell line showed a significant increase in internal fluorescence representing phagocytosis compared to WT-AX4 cells. Rab2(CA) expressing cells interestingly showed a decrease in the rate of phagocytosis compared to WT-AX4 cells, not reaching their maximum internalization until the 90 min time point compared to the WT-AX4 cells reaching maximum internalization at 60 min; (C) Rab2(DN) expressing cell lines showed no significant difference in the internal fluorescence representing phagocytosis as compared to AX4 cells, however, the rate of phagocytosis in this cell line was decreased reaching maximum phagocytosis at 90 min compared to the WT-AX4 cells reaching maximum phagocytosis at 60 min; (D) Overlaid images of bright field with visualization of red latex beads in AX4, Rab2 over-expressing, Rab2(CA), and Rab2(DN) cell lines. The image shows a decrease in the amount of beads compared to the AX4 in the Rab2 over-expressing cell line, and an increase in the amount of beads in the Rab2(CA) expressing cell line confirming the amount of internal fluorescence representing phagocytosis observed in the graphical representation. Scale Bar: 5 µm.
![Biology 03 00514 g001]()
Figure 2.
Pinocytosis and Exocytosis are altered in DdRab2 over-expressing, DdRab2(CA), and DdRab2(DN) cells. (A,B) Graphical representation with standard error of the rate of pinocytosis in Rab2 over-expressing, Rab2(CA), and Rab2 (DN) cell lines compared to the parent strain AX4 cells. Data for pinocytosis, exocytosis, and recycling is the average of three independent experiments with a p-value > 0.05. Cell lines were incubated in HL5 medium containing RITC-dextran (100 mg/mL) over 180 min. Data are presented as relative fluorescence to AX4 which is considered 100% RITC-dextran internalization at 120 min. At the indicated times, cells were washed by centrifugation and accumulated RITC-dextran was measured using a fluorimeter. (A) The intercellular fluorescence representing pinocytosis in the Rab2 over-expressing cell line is decreased compared to AX4 cells, however, this decrease was not significantly significant; (B) The intercellular fluorescence representing pinocytosis in the Rab2(CA), and Rab2(DN) cell lines. The Rab2(CA) cell line shows a slight increase in pinocytosis at the 120-min time point while the Rab2(DN) cell line shows a slight decrease in the rate of pinocytosis after 120 min compared to the AX4 cells (increase and decrease not statistically significant); (C) Graphical representation with standard error of the rate of exocytosis. After 180 minof RITC-dextran accumulation, cells were washed and re-suspended in growth medium. At the indicated times, the remaining intracellular RITC- dextran was measured. Rab2, Rab2(CA), and Rab2(DN) cells did not show a significant change in intercellular fluorescence representing exocytosis; (D) Graphical representation with standard error of RITC-Dextran recycling over 120 min showed no significant difference in recycling amongst all cell lines.
![Biology 03 00514 g002]()
The rates of exocytosis and fluid phase recycling of RITC-dextran were also quantified. The ability of the DdRab2 over-expressing, and DdRab2 mutant cell lines to release the marker was slightly decreased compared to the AX4 cell line; however this difference was at its greatest with just a 20% decrease. The rate of fluid phase recycling of RITC-dextran showed no difference in any of the cell lines compared to the AX4 parent strain (
Figure 2C,D).
Figure 3.
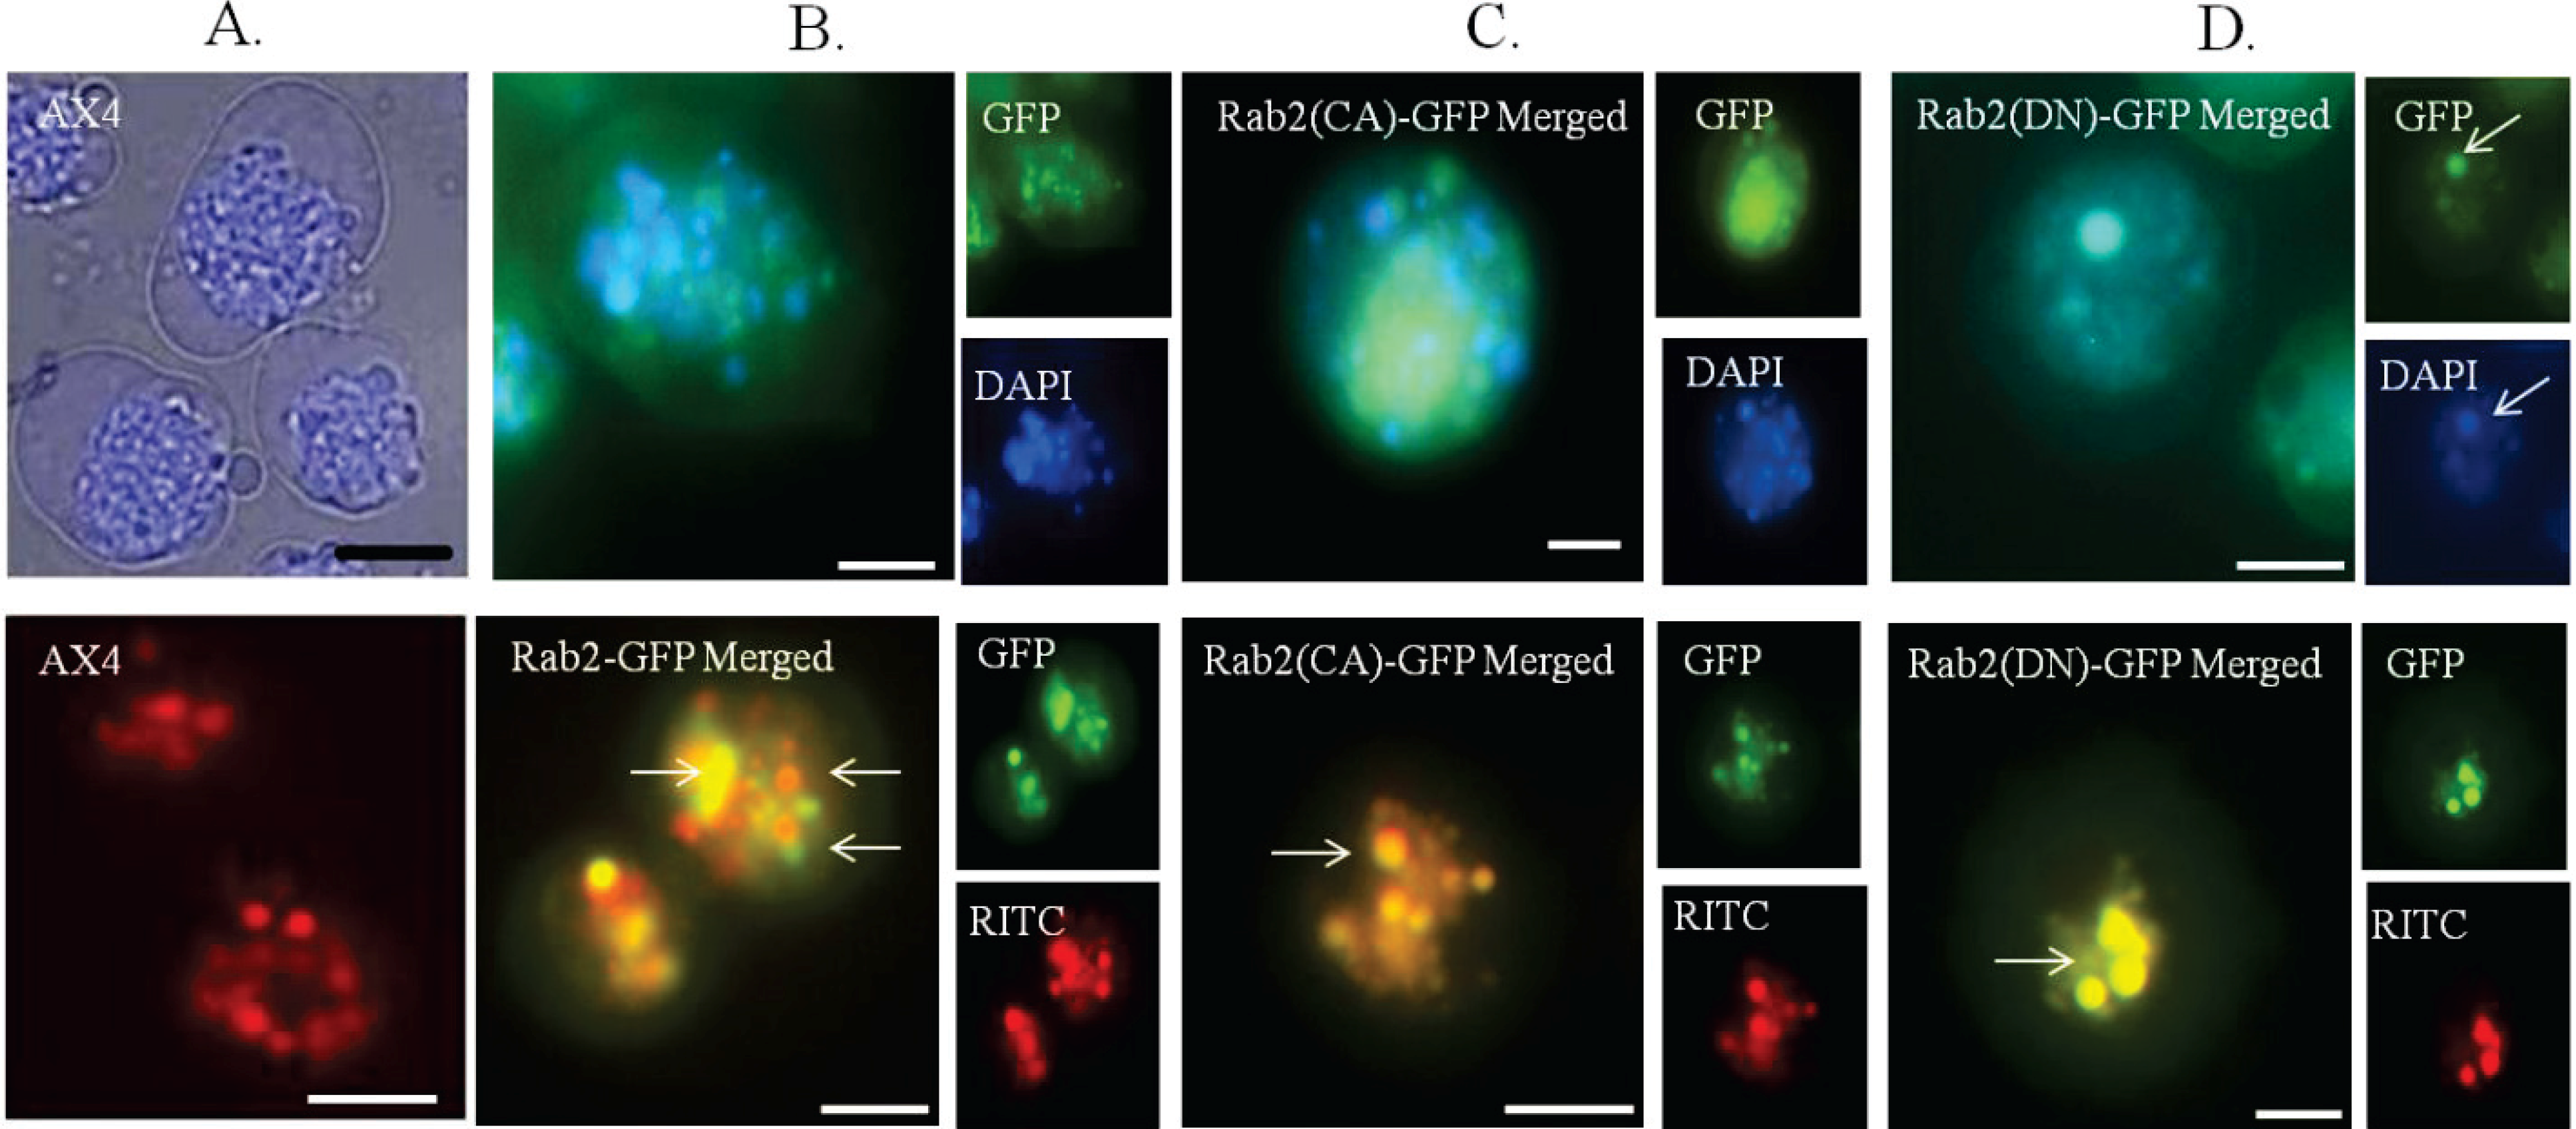
DdRab2(DN) associates with lysosomes and endosomes. (A–D top panel) Distribution of LysoTracker® dye in the AX4 cell line (A) and overlaid images of LysoTracker® blue (DAPI) with GFP visualization in the Rab2-GFP (B) over-expressing, Rab2(CA)-GFP (C), Rab2(DN)-GFP (D) cell lines. The Rab2-GFP over-expressing (B), and Rab2(CA)-GFP (C) cell lines do not show association with the lysosomes. Rab2(DN)-GFP cells show co-localization with the lysosomes. (A–D bottom panel) The vesicles of the endocytic system from endosome to lysosome are shown as red staining membranes due to the uptake of RITC-dextran after 60 min of treatment. (A) WT-AX4 cells with the endosomes shown in red. (B) Rab2-GFP over-expressing, and Rab2(CA)-GFP (C), cells show partial association with the endosomal system (indicated by arrows). The Rab2(DN)-GFP (D) cells show complete association with the endosomal system. These images support a role for Rab2 in vesicular trafficking. Scale Bar: 5 µm.
Figure 3.
DdRab2(DN) associates with lysosomes and endosomes. (A–D top panel) Distribution of LysoTracker® dye in the AX4 cell line (A) and overlaid images of LysoTracker® blue (DAPI) with GFP visualization in the Rab2-GFP (B) over-expressing, Rab2(CA)-GFP (C), Rab2(DN)-GFP (D) cell lines. The Rab2-GFP over-expressing (B), and Rab2(CA)-GFP (C) cell lines do not show association with the lysosomes. Rab2(DN)-GFP cells show co-localization with the lysosomes. (A–D bottom panel) The vesicles of the endocytic system from endosome to lysosome are shown as red staining membranes due to the uptake of RITC-dextran after 60 min of treatment. (A) WT-AX4 cells with the endosomes shown in red. (B) Rab2-GFP over-expressing, and Rab2(CA)-GFP (C), cells show partial association with the endosomal system (indicated by arrows). The Rab2(DN)-GFP (D) cells show complete association with the endosomal system. These images support a role for Rab2 in vesicular trafficking. Scale Bar: 5 µm.
Next, a microscopic approach was taken to investigate the role of DdRab2 in vesicular trafficking. Using GFP tagged DdRab2, DdRab2(CA), and DdRab2(DN) proteins, cells were observed and subjected to fluorescence microscopy to visualized and determine possible association of DdRab2 with lysosomes and endosomes. Cells expressing DdRab2-GFP, DdRab2(CA)-GFP, and DdRab2(DN)-GFP were stained with LysoTracker (Molecular Probes) which stains acidic organelles including lysosomes [
33] or cells were allowed to internalize endosomal marker RITC-dextran followed by photography to observe the overlap of the GFP tagged proteins with the lysosomes or endosomes.
Figure 3 (top) shows cells stained with LysoTracker blue,
Figure 3 (bottom) shows cells after the internalization of RITC-dextran. DdRab2-GFP over-expressing, and DdRab2(CA)-GFP cells do not appear to co-localize with lysosomes (
Figure 3B,C top) however, they do appear to partially co-localize with endosomes (
Figure 3B,C bottom). Interestingly, DdRab2(DN)-GFP cells (
Figure 3D) appear to co-localize with both the lysosomes and the endosomes. This microscopic and graphical evidence suggest that DdRab2 is involved in the regulation of vesicular trafficking.
3.1.2. Rab2 Mutants Display Defects in Development and Adhesion
Since analysis of data previously described suggest that DdRab2 plays a role in the regulation of endocytosis, a look into the effect of DdRab2 on development was next examined. This investigation was initiated because several GTPases including Rac1A [
40], Rac1B [
41], Rac1C [
40], and RasGEFB [
42] that were defective in endocytosis also displayed defects in development. Furthermore, Rab2 has been identified as an essential protein for intracellular proliferation of
B. abortus [
43,
44]. In mice, neurons treated with Rab2 show enhanced adhesion followed by a dramatic increase in neurite growth suggesting that Rab2 plays an important role in neuronal differentiation [
45].
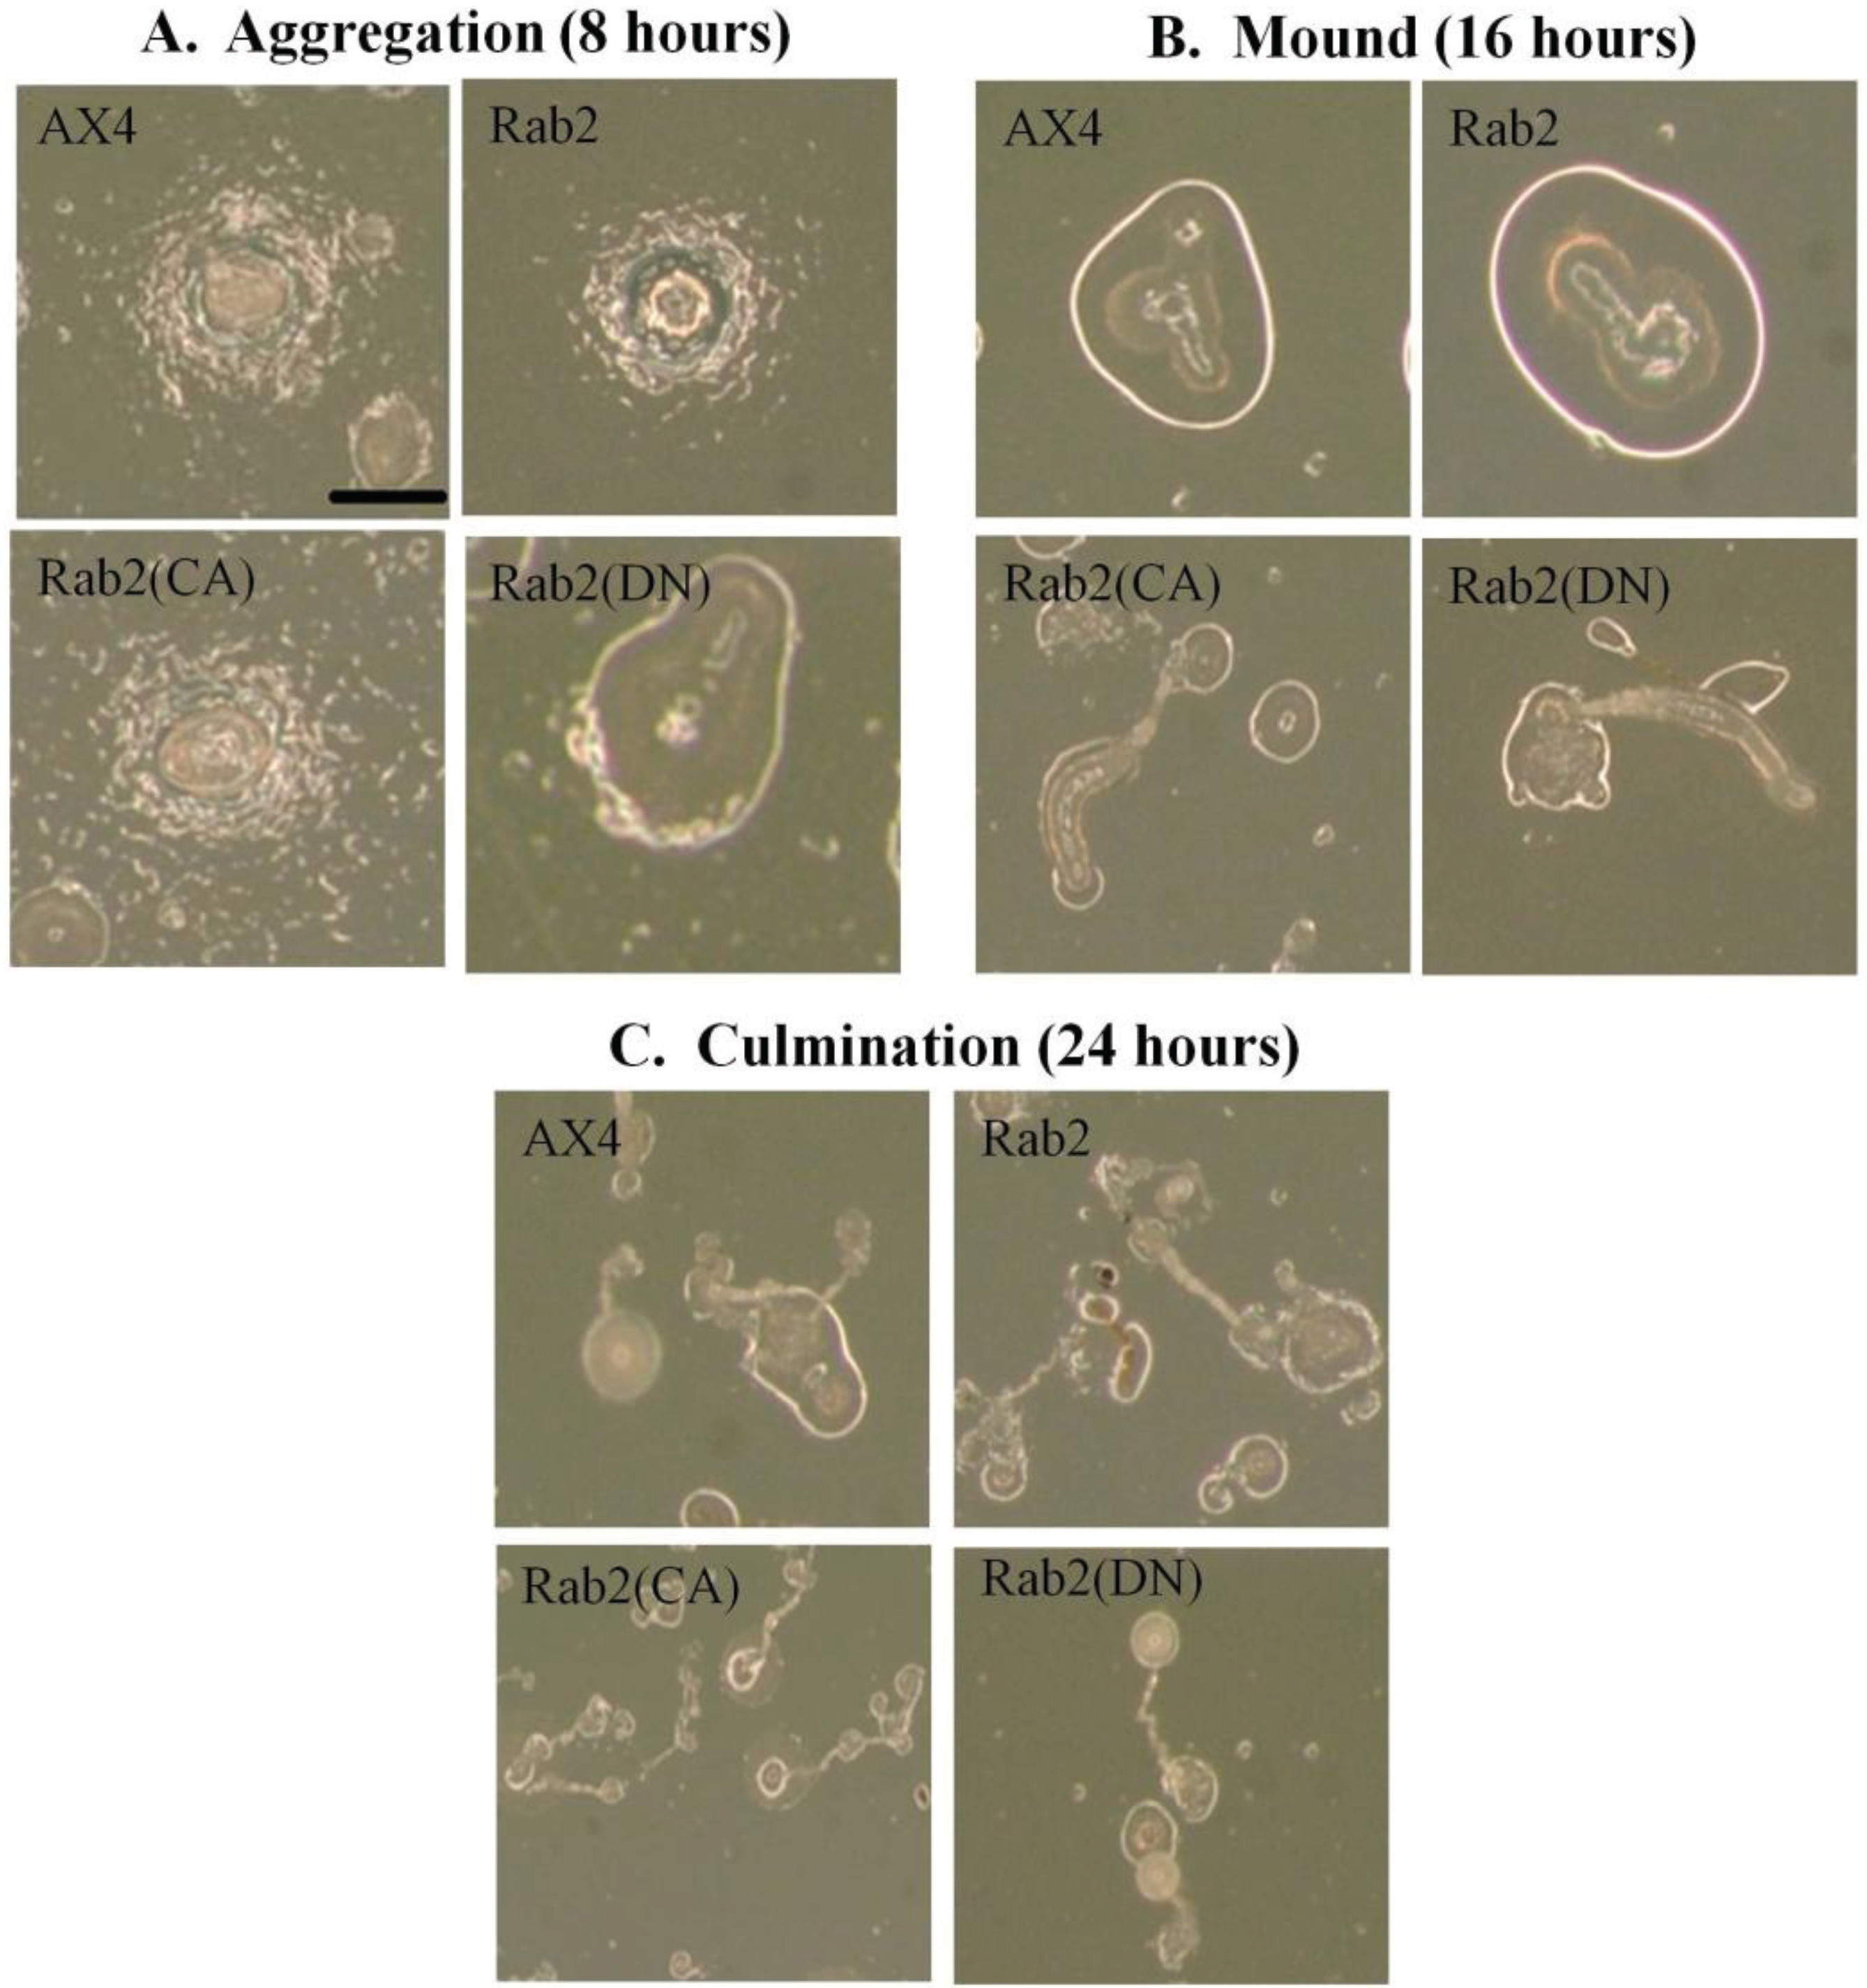
The initial experiments focused on the phases of development that were observed following incubation at 22 °C on KK2 agar plates after 8 h (aggregation), 16 h (mound formation), and 24 h (culmination). Control cells expressing GFP alone were identical to the AX4 cells in both timing and morphology of cell development (data not shown) as were DdRab2 over-expressing cells (
Figure 4A–C). In contrast to these data, DdRab2(CA) expressing mutants formed aggregates that were slightly larger than the control and seemed to attract a greater number of cells into each aggregate mound (
Figure 4A). These aggregates then appeared to dissociate into smaller groups giving rise to deformed mound structures that were very elongated and smaller in size compared to AX4 cells (
Figure 4B). After 24 h, the DdRab2(CA) cell line had formed small fruiting body structures as well as a greater number of fruiting bodies correlating to the increase in mound formation (
Figure 4C).
On the other hand, DdRab2(DN) mutants also appear to be defective in its developmental program. After 8 h, DdRab2(DN) mutants had already completely aggregation, forming mound structures (
Figure 4A). After 16 h, these mutants had formed fruiting body structures (
Figure 4B). After 24 h, the fruiting bodies were still present in the DdRab2(DN) mutants although, the spore containing head appeared larger than that of the AX4 cells (
Figure 4C).
Defects in development particularly the aggregation stage caused by Rabs or Rab-like proteins have been previously linked to alterations with cell–cell adhesion [
3,
37,
46]. Rab5, Rab7, and Rab11 have been implicated in the coordinated regulation of cell–cell adhesion [
47]. We wanted to determine if the defects in development observed could be due to increased cell–cell adhesion. Adhesivety was measured as described previously by Wong, 2002, and Secko
et al. 2006 [
35,
36]. Cells were washed free of antibiotics and starved in KK2 buffer for 4 h. Cells were dissociated by vigorous vortexing to break up existing aggregates and then allowed to re-associate on a rotary shaker [
35,
36]. Some re-association was detected in the AX4 cells after 20 min (approximately 30%) (
Figure 5A,B). The re-association of the DdRab2(CA), and DdRab2(DN) cells was much greater after 20 min at approximately 75% re-association. However, by 40 min, DdRab2(CA), DdRab2(DN), and AX4 cells were roughly equal in re-association (
Figure 5A,B). It has been previously stated that early in the aggregation stage of development,
Dictyostelium cells acquire EDTA-resistant cell binding sites [
37]. To assess the EDTA-resistant cell–cell adhesion, cells were incubated in KK2 buffer + 10 mM EDTA following the four hour KK2 buffer incubation to inhibit EDTA-sensitive cohesion, and aggregates were counted as described above. Both the DdRab2(CA), and DdRab2(DN) cells show a decrease in EDTA-sensitive adhesion after 20 min compared to the AX4 cells (
Figure 5C,D). Cellular response to cAMP was also examined to explain the abnormal development observed in the DdRab2(CA), and DdRab2(DN) cells however, no detectable difference was seen in these cell lines compared to the AX4 cells (data not shown). This led us to believe that the initial increase in cell–cell adhesion observed plays a role in the increased rate of development in the DdRab2(DN) cell line, and the abnormal development in the DdRab2(CA) cell line.
Figure 4.
Over-expressing mutant forms of DdRab2 has an effect on the developmental process. (A) Representative photomicrographs of aggregation after 8 h of incubation at 22 °C on KK2 agar plates. Loose aggregates are visible in the AX4, Rab2, and Rab2(CA) cell lines after 8 h while the Rab2(DN) cells had already aggregated and formed a mound after 8 h; (B) Representative photomicrographs of mound formation after 16 h. After 16 h, wild type AX4, and Rab2 over-expressing cells show normal mound formation. Rab2(CA) cells have formed elongated mound structures. Rab2(DN) cells appear to have already formed fruiting bodies after 16 h; (C) Representative photomicrographs of fruiting body formation after 24 h. WT-AX4 and Rab2 over-expressing cell lines developed into fruiting bodies in the absence of nutrition after 24 h. Rab2(CA) and Rab2(DN) cell lines had formed fruiting bodies after 16 h and were still present after 24 h. The Rab2(CA) cell line appears to have formed a larger number of fruiting bodies that were smaller in size. Scale Bar: 1 mm.
![Biology 03 00514 g004]()
Figure 5.
Mutant forms of DdRab2 show an initial increase in cell–cell adhesion. AX4, pDneo2a-GFP, Rab2, Rab2(CA), and Rab2(DN) cells were washed free of antibiotics and starved for 4 h in KK2 in a shaking suspension. Cells were then dissociated by vortexing, and cell re-association was monitored over time with or without the addition of 10 mM EDTA. Cells were not in aggregates at time zero and the percentage of cell re-association was calculated by scoring non-aggregated cells with a haemocytometer [percentage aggregation = (total number of cells − non-aggregating cells)/total number of cells]. Data represent the mean of three independent experiments ± standard error with a p-value > 0.05. (A,B) cell adhesion of developing cells of the Rab2(CA) (A), and Rab2(DN) (B) cell lines in KK2 buffer. Both the Rab2(CA) and Rab2(DN) cell lines show an initial increase (not significant) in cell adhesion at the 20-min time point, after 20 min, cell adhesion is similar to that of the controls. (C,D) Cell adhesion of developing cells in the presence of 10 mM EDTA. Rab2(CA) (C), and Rab2(DN) (D) cell lines show a slight decrease (not significant) in cell–cell adhesion in the presence of EDTA.
![Biology 03 00514 g005]()
3.1.3. Cell Death Is Decreased in Rab2 Mutants
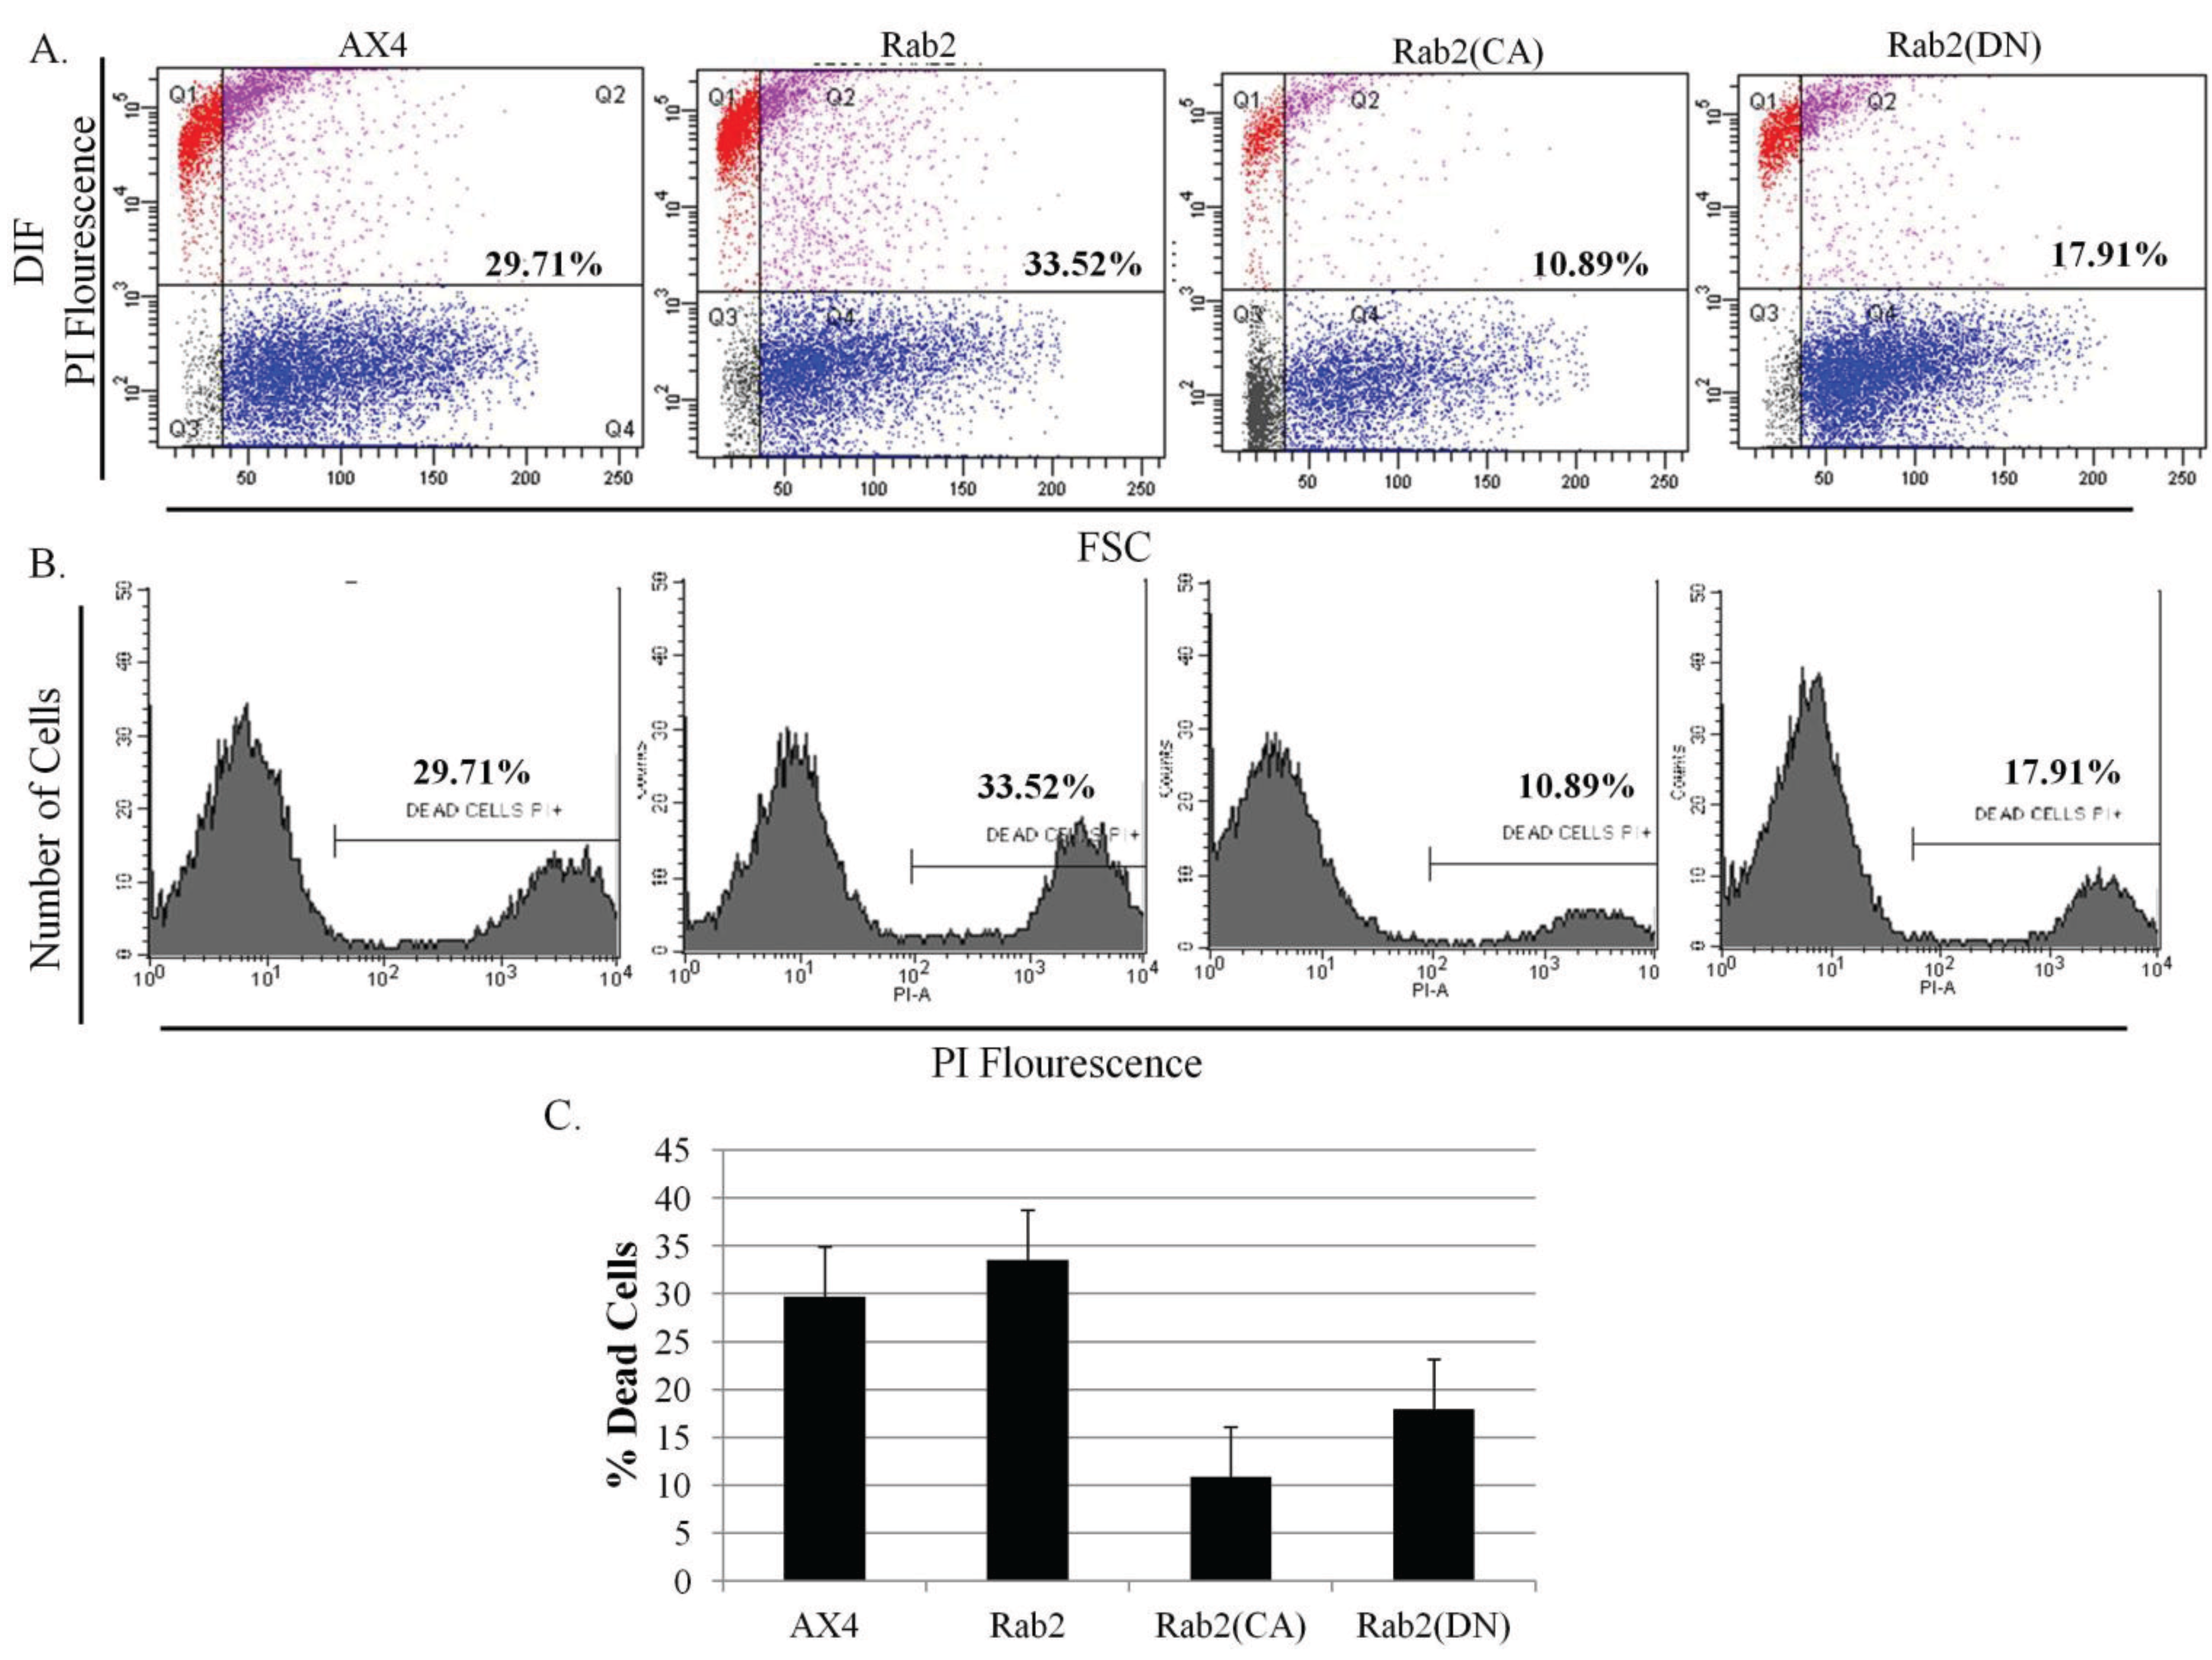
The abnormalities observed in the development program in DdRab2 over-expressing and mutant cell lines (CA, and DN mutations) led us to investigate the role if any of the DdRab2 protein in Dictyostelium cell death. To investigate this hypothesis, all cell lines were starved, subjected to DIF treatment, PI staining and cell death quantification using flow-cytometry.
Analysis of the results in
Figure 6A–C show the percentage of induced cellular death in the parent AX4 cells and DdRab2 over-expressing cells are roughly equivalent. Interestingly, the DdRab2(CA) mutant in cells appears to protect those cells from cell death. The measured cell death in those cells was 20% less than that of the AX4. The mutation of the DdRab2(DN) cells appeared to protect those mutant cells from death only 12% less than the wild typeAX4 cells. Furthermore, the viability of the cells was determined by measuring the amount of ATP, an indicator of cellular metabolic activity [
38].
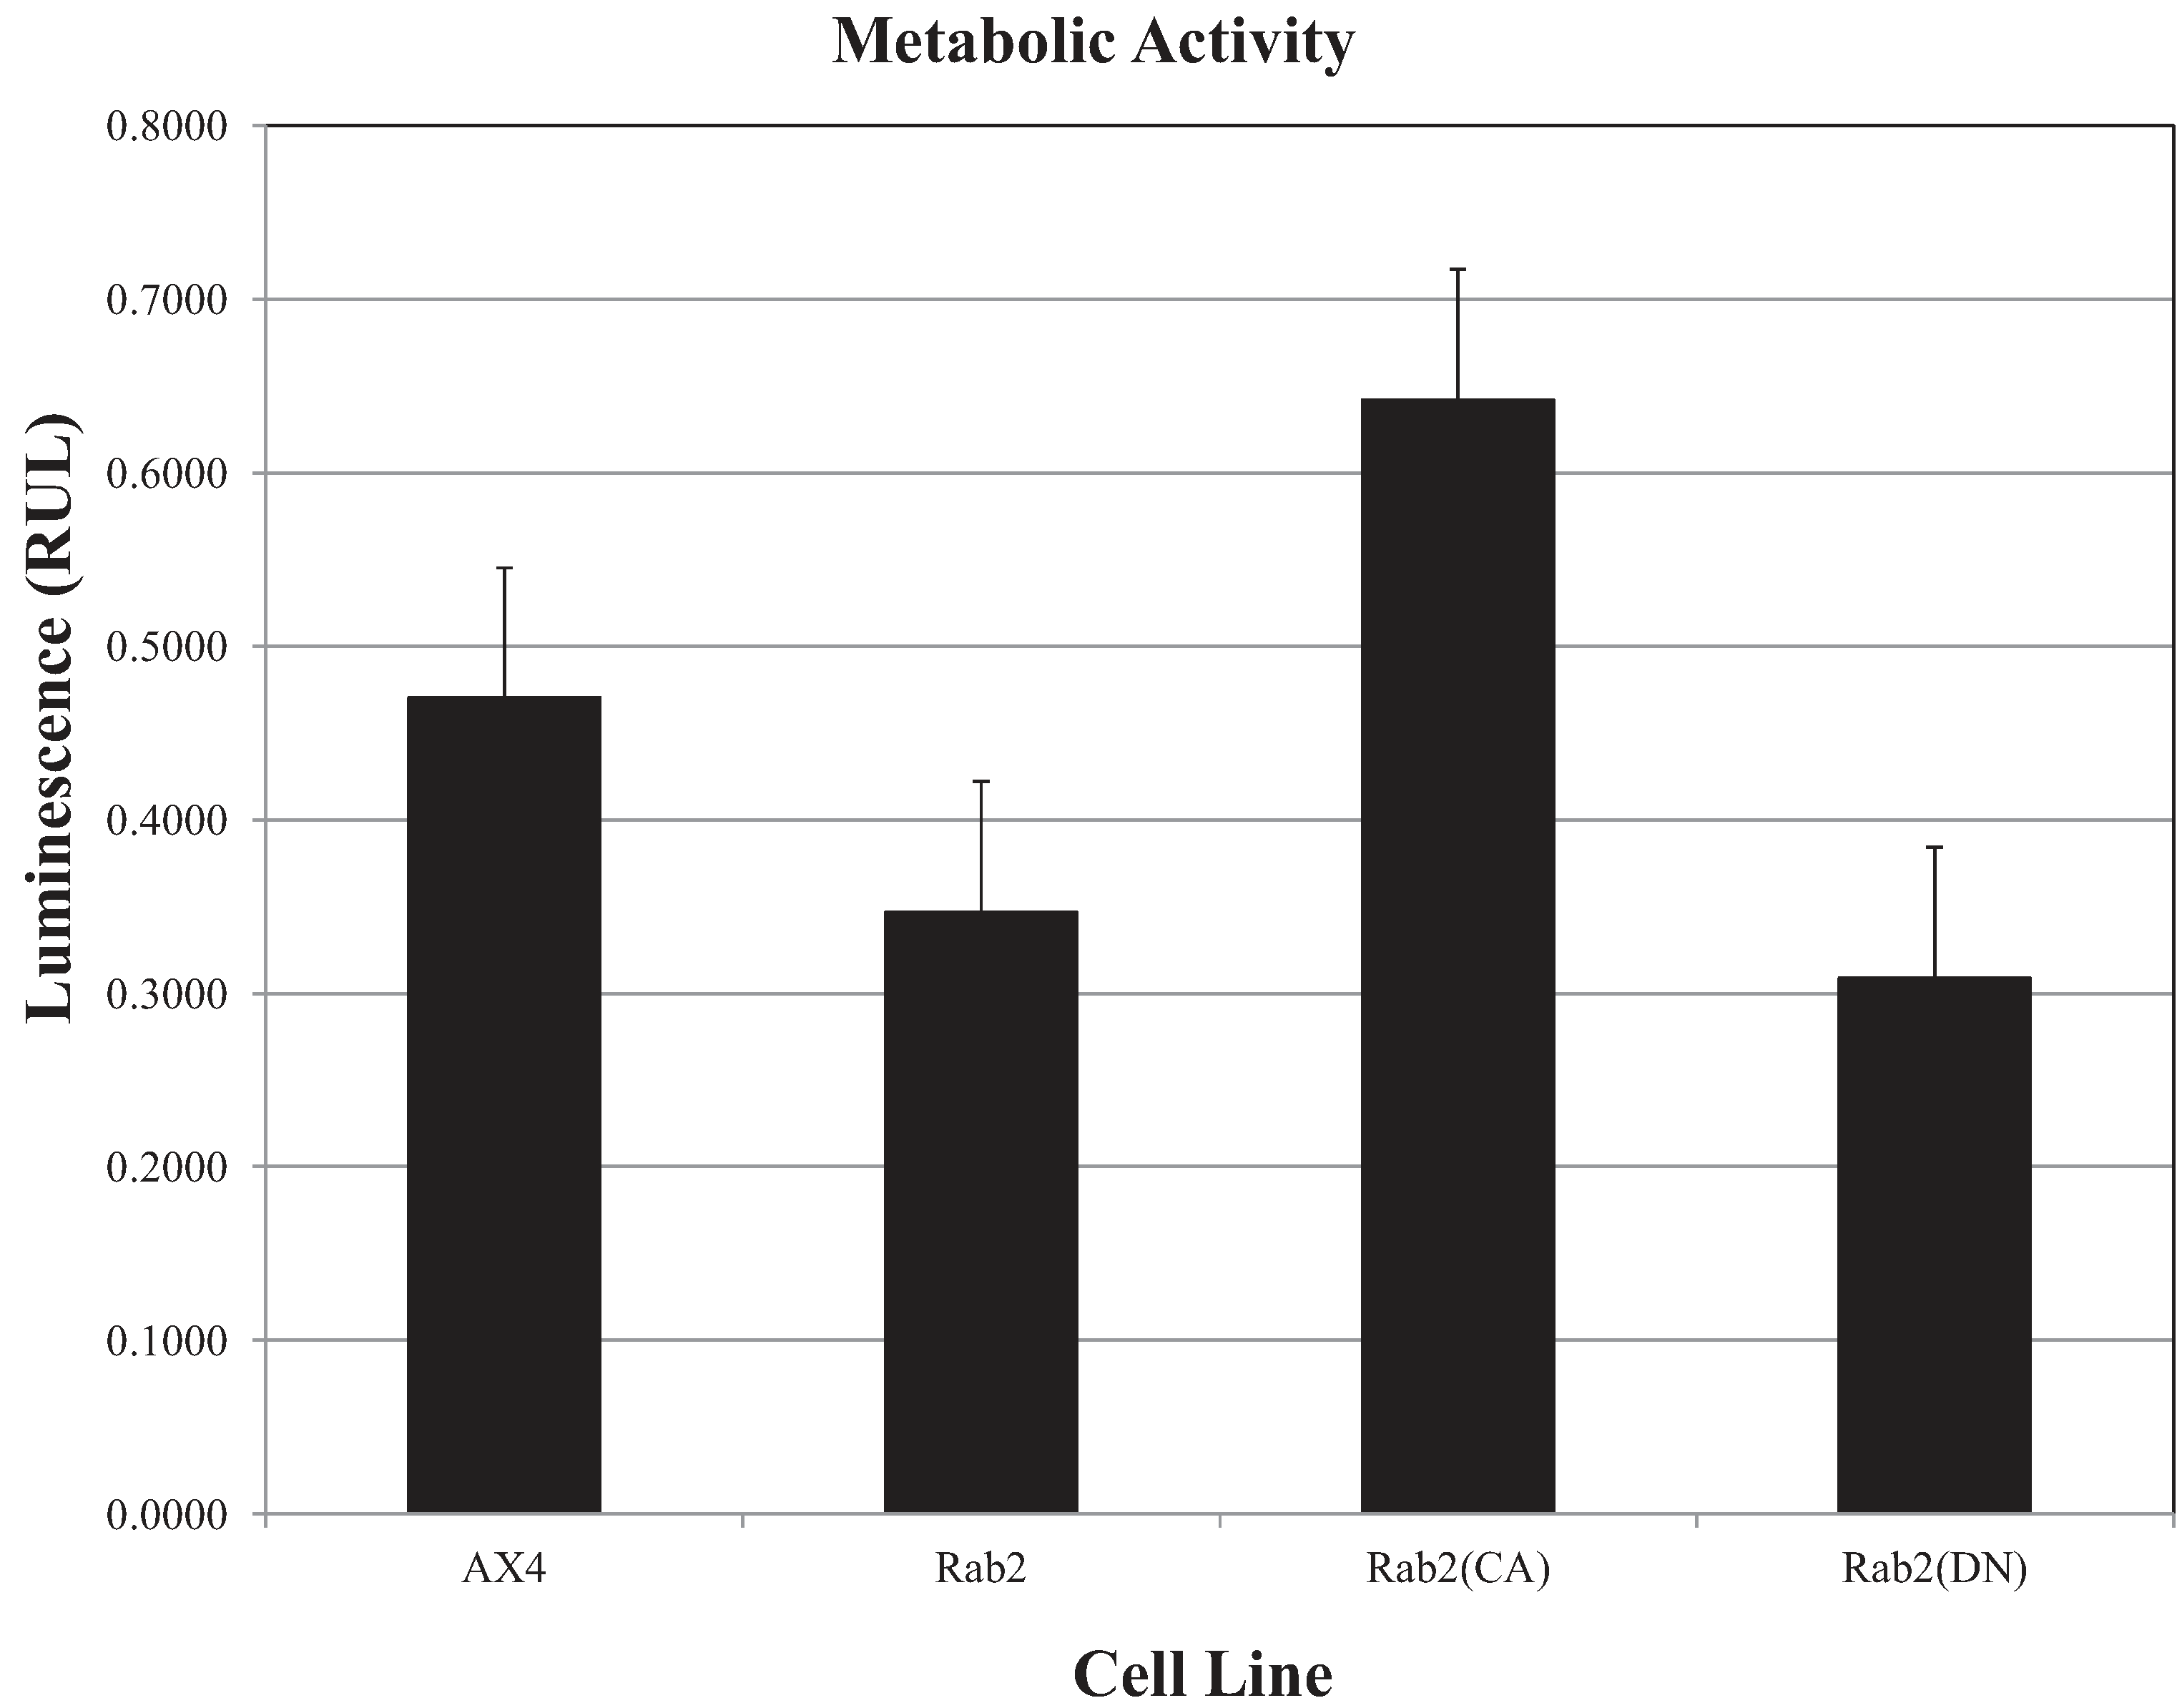
Figure 7 shows that the DdRab2 over-expressing cell line has a slight decrease in metabolic activity correlating with its cell death levels. DdRab2(CA) show an increase in metabolic activity correlating to the decrease in cell death shown in
Figure 6. Interestingly, in DdRab2(DN) cells we observed a decrease in metabolic activity and a decrease in cellular apoptosis indicating that although cell death has been decreased, these cells are not as metabolically active and are not healthy cells.
Figure 6.
Cell death levels are reduced in cells over-expressing mutant forms of DdRab2. (A–C) Cell death quantification using flow cytometry analysis. Data are the result of three independent experiments with a p-value > 0.05 (A) WT-Ax4, Rab2 over-expressing, Rab2(CA), and Rab2(DN) cells were subjected to starvation and cAMP, and incubated with or without DIF for 6 h. Cells were then stained with 1 µg/mL Propidium Iodide for 10 min. Fluorescent PI-positive cells were quantified using flow cytometry. Dot plot data with side scatter and forward scatter showed dead cells distinct from living cells. Rab2(CA) cell line shows a significant decrease, and Rab2(DN) cell lines show a slight decrease (not significantly different) in the levels of cellular apoptosis as compared to the WT-AX4 cells. (B) Histogram of the dot plot data; (C) Quantification for DIF treatment cells undergoing apoptosis. Rab2(CA) showed a significant decrease, and Rab2(DN) cell lines showed a slight decrease (not significant) in the rate of apoptosis as compared to the WT-AX4 cell line.
![Biology 03 00514 g006]()
Figure 7.
ATP levels are affected in DdRab2 over-expressing, and mutant cell lines. To measure the ATP levels, luminescence was recorded 10 min after CellTiter-Glo® reagent was added to cells in a 96-well plate. Data represent the average of three independent experiments with a p-value > 0.05. There was a decrease (not significant) in the luminescent signal from the Rab2 over-expressing, and Rab2(DN) cells, and an increase in Rab2(CA) cells as compared to the AX4 cell lines.
3.1.4. Rab2 Has an Increased Growth Rate and Ability to Re-Grow after Induced Differentiation
The functional role of DdRab2 in protecting cells from cellular death as determined by the previous data analysis using the mutants leads to further investigations into the role of DdRab2 on re-growth of cells after treatment with DIF-1. DIF-1 is a putative morphogen that induces stalk cell formation in
Dictyostelium [
48]. Cells were treated as described by Rivero and Maniak, 2006 [
32].
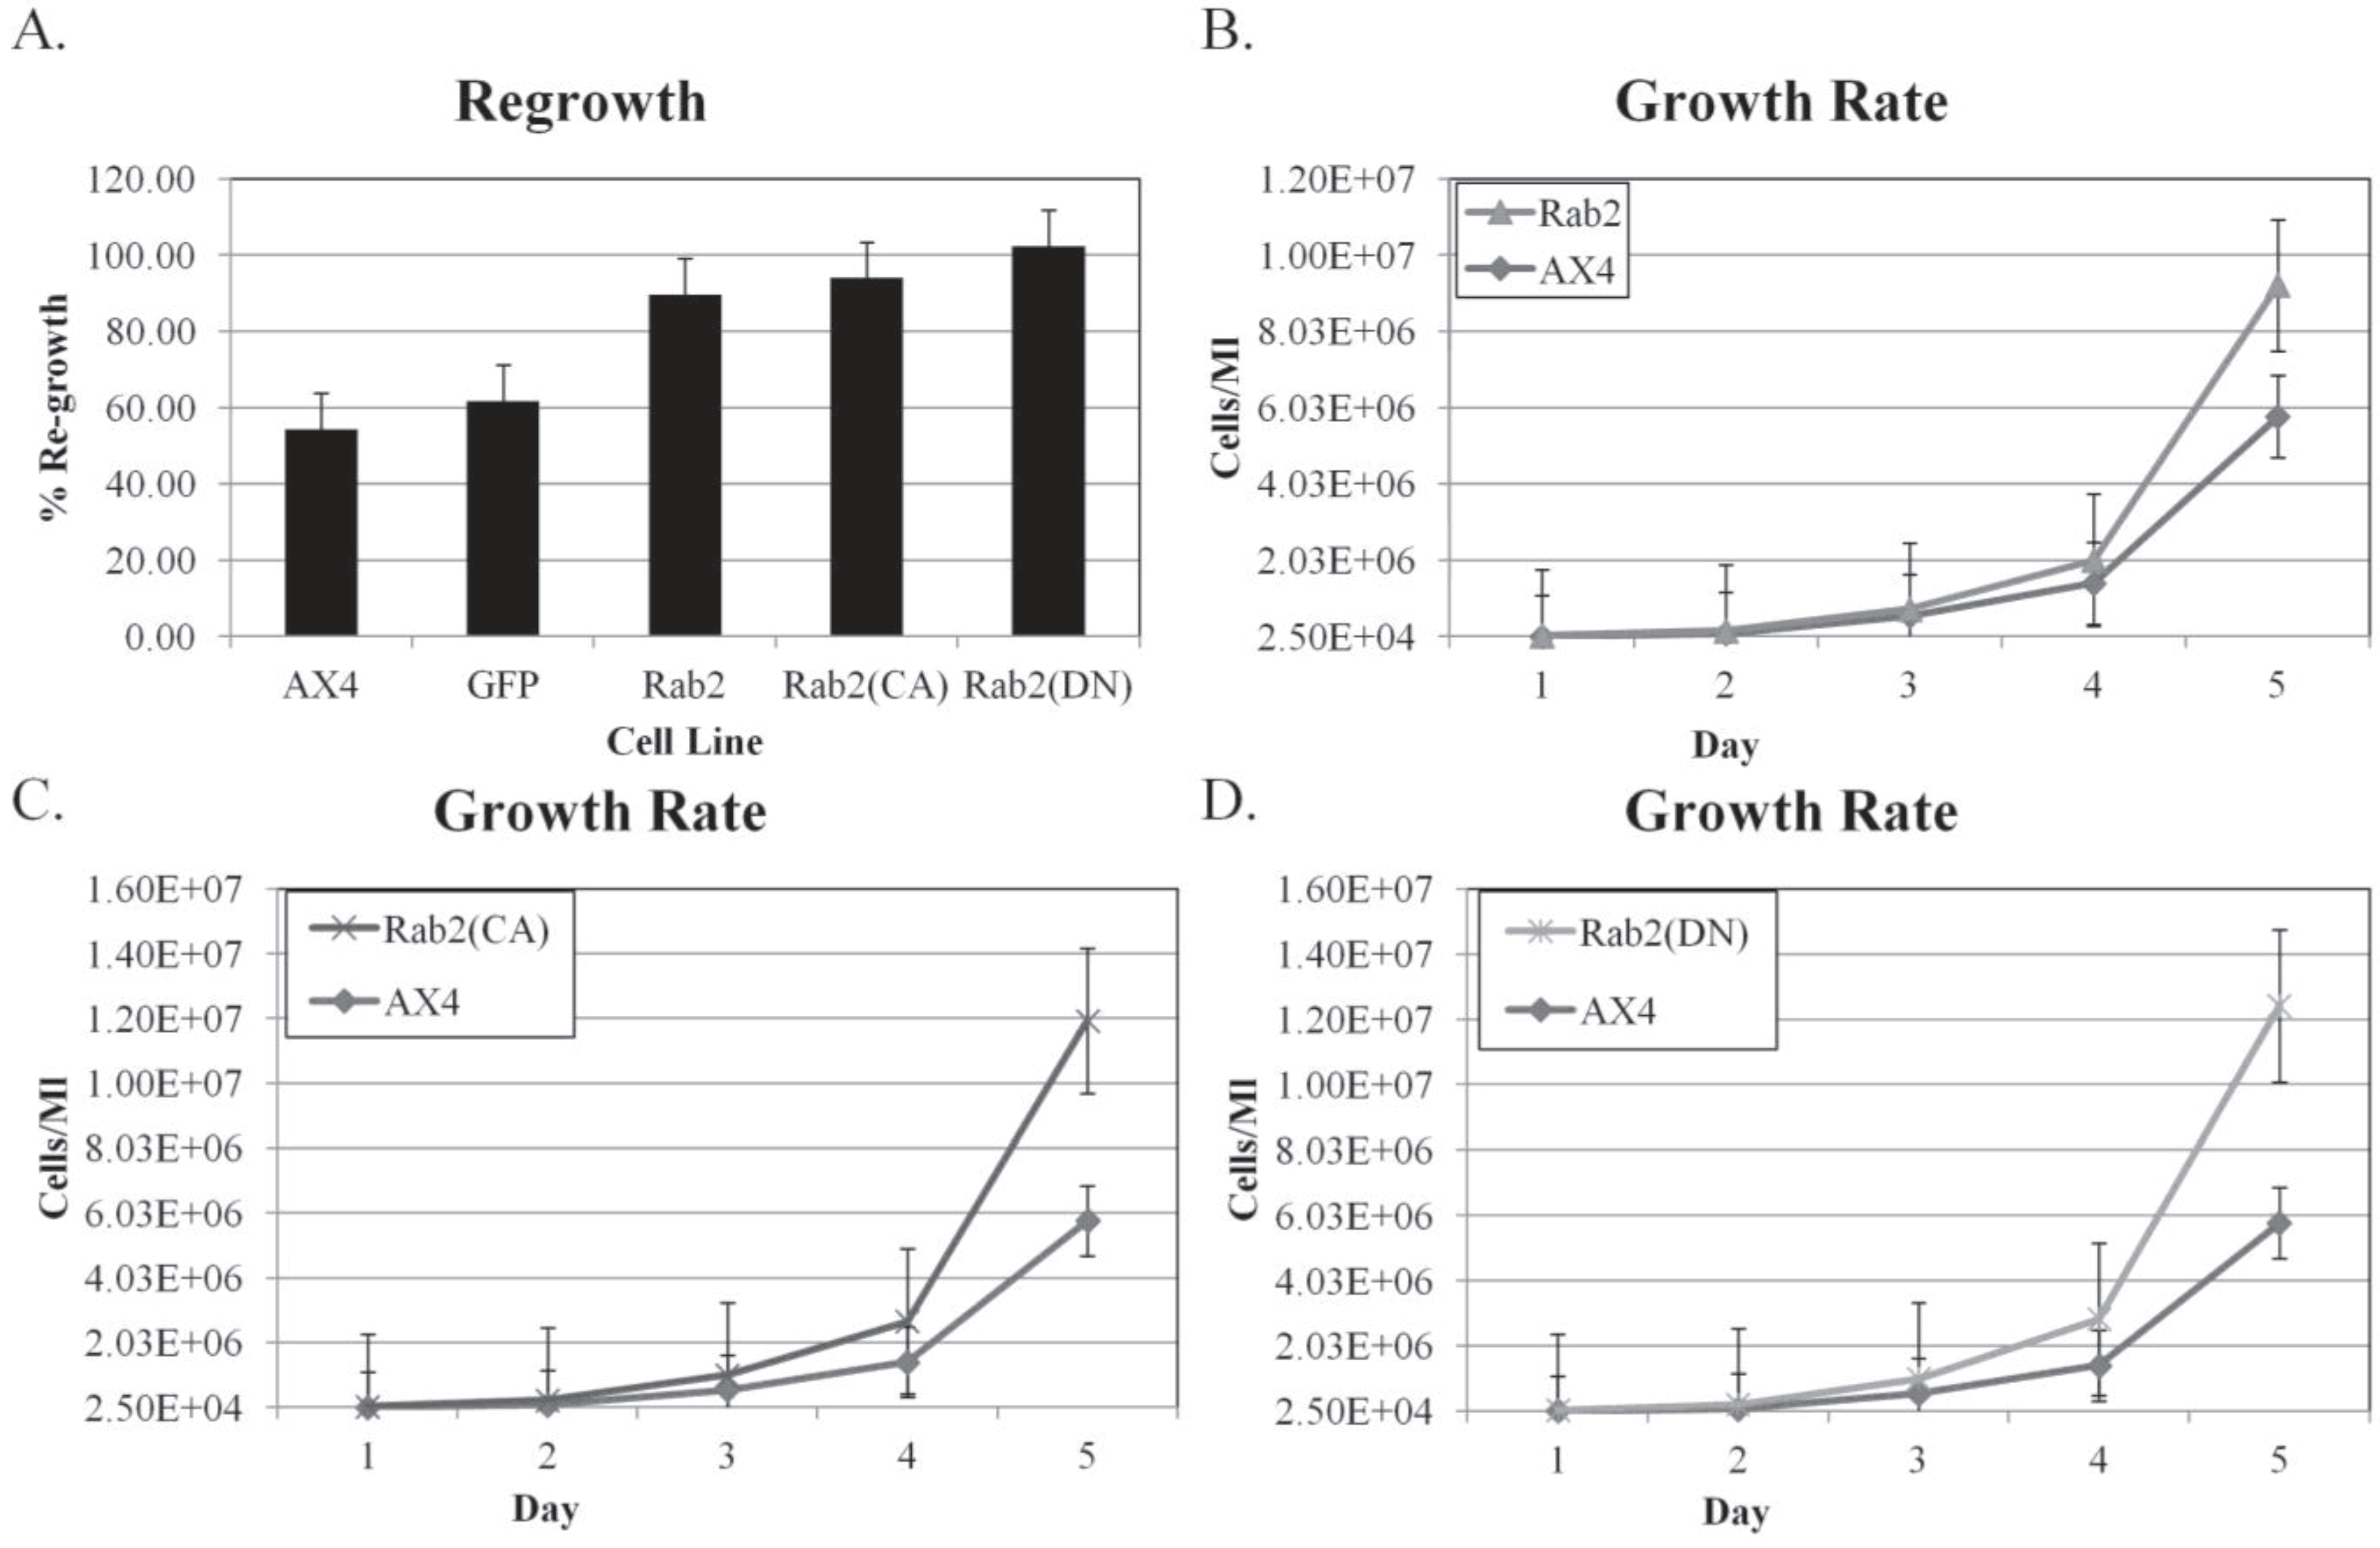
First, the ratio of the number of re-growing cells compared to the control was calculated. As shown in
Figure 8A, DdRab2, DdRab2(CA), and DdRab2(DN) expressing cells have an increased re-growth rate than the control AX4 cells. Interestingly, the DdRab2 over-expressing cells have an increased re-growth rate however, these cells were not shown to protect from cell death and they had a decrease in metabolic activity so the increase in re-growth could be due to an increased growth rate. The DdRab2(CA), and DdRab2(DN) cell lines increase in re-growth was to be expected given their decrease in cellular apoptosis and increase in metabolic activity.
To test the idea that the increase in the re-growth observed was due in part to an increased growth rate of the cells, the growth rate was then calculated. Cells were suspended at a density of 2 × 10
4 and counted each day at the same time for 5 days and then the growth rate was graphed (
Figure 8B–D). All cell lines had an increased growth rate as compared to the AX4 cells. The increase in growth rate correlates to the increase in re-growth shown in
Figure 8A. Interestingly, the DdRab2(DN) cell line has the fastest growth rate at almost 10X that of the AX4 cells and their ability to re-grow after treatment with DIF-1 reached above 100% indicating that they not only completely re-grew after treatment but they had begun to proliferate.
Figure 8.
DdRab2 over-expressing, DdRab2(CA), and DdRab2(DN) cells have increased re-growth and growth rates compared to controls. (A) Percentage of re-growth of the mutant cells after 30 h of treatment with DIF followed by 72 h incubation with HL5. The ratio of the number of cells re-growing in the DIF chamber to the number of cells in the control chamber was calculated. Data are the average of three indepent experiments with a p-value > 0.05. Rab2 over-expressing, Rab2(CA), and Rab2(DN) cell lines had a significantly increased level of re-growth compared to the AX4 and pDneo2a-GFP cell lines. (B–D) Growth rate of Rab2 over-expressing, Rab2(CA), and Rab2(DN) cell lines. Cells were incubated in HL5 medium. At the same time each day cells were counted. Data are the average of three independent experiments with a p-value > 0.05. All cell lines have a significant increase in growth rate compared to the AX4 and pDneo2a-GFP (not shown). The increase in growth rate correlates to the increase in re-growth.
![Biology 03 00514 g008]()


