Author Contributions
Conceptualization, B.W., J.M. and J.X.; Data curation, B.W., Q.W. and J.C.; Formal analysis, B.W., Q.W. and J.C.; Funding acquisition, J.X.; Investigation, B.W.; Methodology, Q.W. and J.M.; Project administration, J.X.; Software, B.W.; Validation, B.W. and J.X.; Writing—original draft, B.W.; Writing—review & editing, Q.W., J.C. and J.M. All authors have read and agreed to the published version of the manuscript.
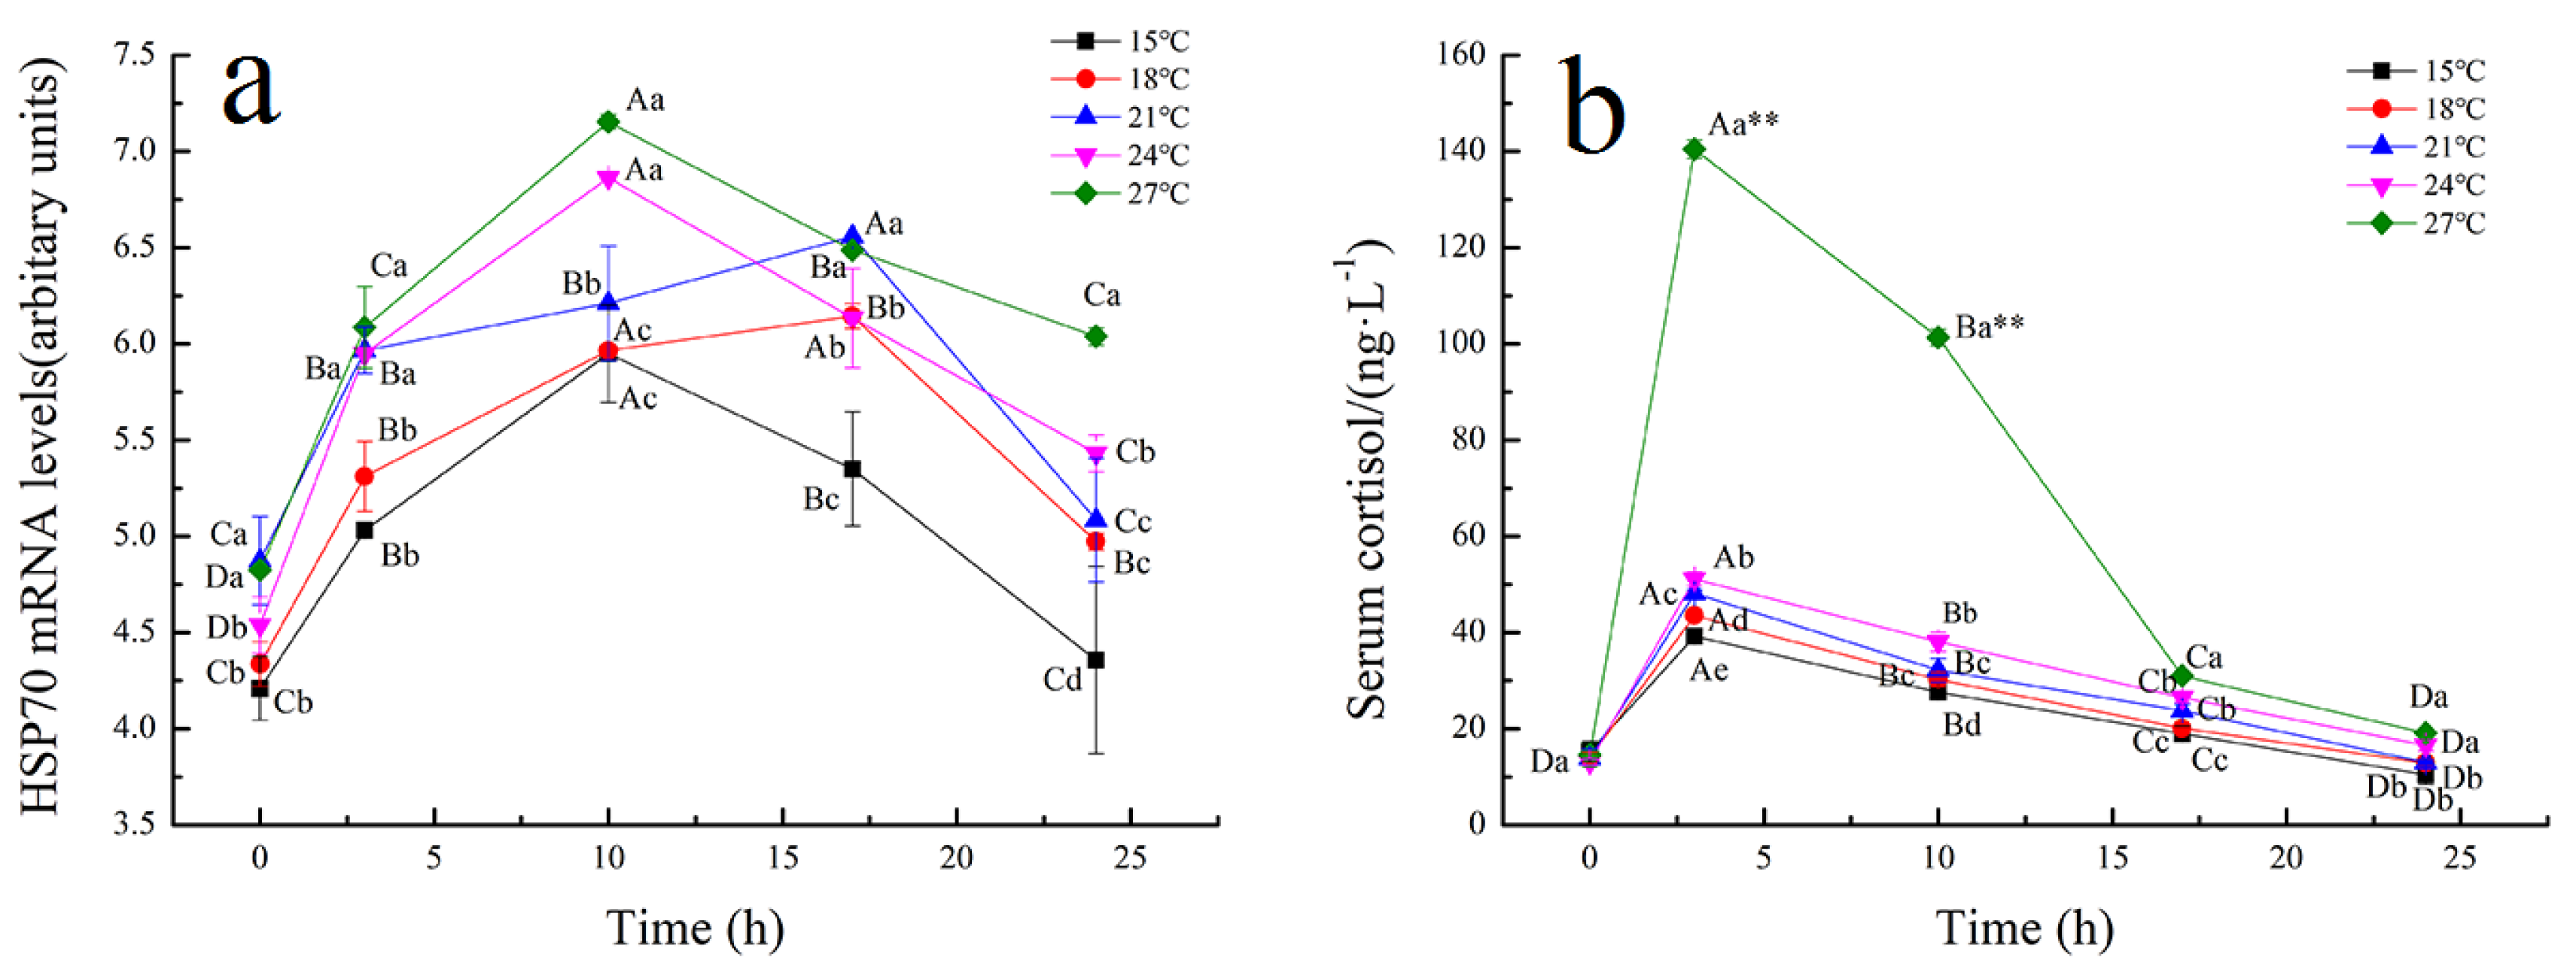
Figure 1.
Effects of temperature on HSP70 (a) and serum cortisol (b) of tiger grouper during simulated transport. Among different temperature transport groups, different small and capital letters indicate the results of Duncan’s test at different transport time. The same letters mean no significant difference (p > 0.05), while different letters mean significant difference (p < 0.05). Different letters without * = p-value < 0.05, different letters with ** = p-value < 0.01.
Figure 2.
Effect of temperature on glutathione reductase (GR) of tiger grouper during simulated transport. Among different temperature transport groups, different small and capital letters indicate the results of Duncan’s test at different transport time. The same letters mean no significant difference (p > 0.05), while different letters mean significant difference (p < 0.05). Different letters without * = p-value < 0.05, different letters with ** = p-value < 0.01.
Figure 3.
Effect of temperature on alkaline phosphatase (AKP) (a), acid phosphatase (ACP) (b), and lysozyme (LZM) (c) of tiger grouper during simulated transport. Among different temperature transport groups, different small and capital letters indicate the results of Duncan’s test at different transport time. The same letters mean no significant difference (p > 0.05), while different letters mean significant difference (p < 0.05). Different letters without * = p-value < 0.05, different letters with ** = p-value < 0.01.
Figure 4.
Effect of temperature on relative expression of 1L-1β (a) and IgM (b) of tiger grouper during simulated transport. Among different temperature transport groups, different small and capital letters indicate the results of Duncan’s test at different transport time. The same letters mean no significant difference (p > 0.05), while different letters mean significant difference (p < 0.05). Different letters without * = p-value < 0.05, different letters with ** = p-value < 0.01.
Figure 5.
Effect of ascorbic acid and β-1,3-glucan addition on HSP70 (a) and serum cortisol (b) of tiger grouper during simulated transport. Among different treatments transport groups, different small letters indicate the results of Duncan’s test at different transport time. The same letters mean no significant difference (p > 0.05), while different letters mean significant difference (p < 0.05). Different letters without * = p-value < 0.05, different letters with ** = p-value < 0.01.
Figure 6.
Effect of ascorbic acid and β-1,3-glucan addition on relative expression of 1L-1β (a) and IgM (b) of tiger grouper during simulated transport. Among different treatments transport groups, different small letters indicate the results of Duncan’s test at different transport time. The same letters mean no significant difference (p > 0.05), while different letters mean significant difference (p < 0.05). Different letters without * = p-value < 0.05, different letters with ** = p-value < 0.01.
Figure 7.
Effect of ascorbic acid and β-1,3-glucan addition on ash (a), moisture (b), fat (c) and protein (d) of muscle of tiger grouper during simulated transport. Among different treatments transport groups, different small letters indicate the results of Duncan’s test at different transport time. The same letters mean no significant difference (p > 0.05), while different letters mean significant difference (p < 0.05). Different letters without * = p-value < 0.05, different letters with ** = p-value < 0.01.
Figure 8.
Effect of ascorbic acid and β-1,3-glucan addition on umami (a) and sweet (b) taste amino acids of tiger grouper during simulated transport. Among different treatments transport groups, different small letters indicate the results of Duncan’s test at different transport time. The same letters mean no significant difference (p > 0.05), while different letters mean significant difference (p < 0.05). Different letters without * = p-value < 0.05, different letters with ** = p-value < 0.01.
Table 1.
Experimental design for exposure to anti-stress agents of live tiger grouper during simulated transport in water.
Table 1.
Experimental design for exposure to anti-stress agents of live tiger grouper during simulated transport in water.
| Samples | Anti-Stress Agent Addition |
|---|
| CK | Control |
| A | 25 mg/L ascorbic acid |
| A-G1 | 25 mg/L ascorbic acid + 2.4 mg/L β-1,3-glucan |
| A-G2 | 25 mg/L ascorbic acid + 3.2 mg/L β-1,3-glucan |
| A-G3 | 25 mg/L ascorbic acid + 4.0 mg/L β-1,3-glucan |
Table 2.
Sequences of primers for Real-time PCR.
Table 2.
Sequences of primers for Real-time PCR.
| Target Gene | Primer Sequence (5′-3′) |
|---|
| HSP70 | F: GACAAGAAGGTTGGGTCTGAAAGG |
| R: GGTTGACCATGCGGTTGTCGAAATCT |
| IgM | F: GCCTCAGCGTCCTTCAGTTT |
| R: TGGCGTCCCAGTCCTGTTTGC |
| IL-1β | F: AGGATGCCTGAGGGACTG |
| R: GGTAATCGTCTCCAGATGTAA |
Table 3.
Survival rate of tiger grouper at different temperatures and survival time (%).
Table 3.
Survival rate of tiger grouper at different temperatures and survival time (%).
| Temperature/°C | Keeping Alive Time/h |
|---|
| 0 | 3 | 10 | 17 | 24 | 48 | 72 |
|---|
| 10 | 100 | - | - | - | - | - | - |
| 13 | 100 | 100 | 100 | 100 | 85 | 65 | - |
| 15 | 100 | 100 | 100 | 100 | 100 | 100 | 95 |
| 18 | 100 | 100 | 100 | 100 | 100 | 100 | 90 |
| 21 | 100 | 100 | 100 | 100 | 100 | 95 | 85 |
| 24 | 100 | 100 | 100 | 100 | 100 | 85 | 80 |
| 27 | 100 | 100 | 100 | 100 | 100 | 85 | 75 |
| 30 | 100 | 100 | 100 | 100 | 90 | 50 | - |
Table 4.
Effect of ascorbic acid and β-1,3-glucan addition on serum biochemical and physiological of tiger grouper during simulated transport.
Table 4.
Effect of ascorbic acid and β-1,3-glucan addition on serum biochemical and physiological of tiger grouper during simulated transport.
| Transport | Samples | Creatine Kinase | Albumin | Total Protein | Uric Acid | Urea | Creatinine |
|---|
| Before transport | CK | 848.50 ± 0.25a | 11.00 ± 0.00a | 41.50 ± 0.00a | 13.00 ± 0.57b | 2.50 ± 0.12a | 17.00 ± 0.00a |
| A | 765.00 ± 0.13b | 7.00 ± 0.23c | 33.50 ± 0.71b | 13.50 ± 0.23b | 2.15 ± 0.16a | 18.00 ± 0.31a |
| A-G1 | 227.00 ± 0.66c | 9.00 ± 0.16b | 32.00 ± 0.36b | 20.00 ± 0.06a | 2.35 ± 0.11a | 13.00 ± 0.06c |
| A-G2 | 235.00 ± 0.57c | 7.50 ± 0.03c | 31.00 ± 0.00b | 21.00 ± 0.71a | 2.05 ± 0.08a | 13.00 ± 0.06c |
| A-G3 | 221.00 ± 0.08c | 10.50 ± 0.00b | 32.00 ± 0.08b | 19.00 ± 0.35a | 2.10 ± 0.06a | 15.50 ± 0.24b |
| After transport | CK | 1986.00 ± 0.58a | 26.00 ± 0.21a | 35.00 ± 0.32b | 14.00 ± 0.03c | 2.25 ± 0.00a | 18.50 ± 0.17a |
| A | 1181.50 ± 0.97b | 23.50 ± 0.00b | 31.00 ± 0.06c | 17.00 ± 0.21b | 2.05 ± 0.28a | 19.50 ± 0.00a |
| A-G1 | 689.50 ± 0.69d | 12.00 ± 0.36c | 39.50 ± 0.00a | 21.50 ± 0.19a | 2.15 ± 0.14a | 14.00 ± 0.00c |
| A-G2 | 391.50 ± 0.73e | 8.00 ± 0.42d | 33.00 ± 0.57c | 21.87 ± 0.09a | 1.94 ± 0.03a | 13.50 ± 0.25c |
| A-G3 | 888.00 ± 0.29c | 12.50 ± 0.00c | 32.50 ± 0.69c | 22.05 ± 0.15a | 2.05 ± 0.00a | 17.00 ± 0.14b |
| Recovery | CK | 273.00 ± 0.93c | 10.00 ± 0.32b | 38.50 ± 0.53c | 16.00 ± 0.32b | 2.35 ± 0.00a | 11.50 ± 0.27d |
| A | 769.00 ± 0.85a | 6.50 ± 0.31c | 46.00 ± 0.33a | 16.50 ± 0.31b | 2.40 ± 0.21a | 20.00 ± 0.32a |
| A-G1 | 267.50 ± 0.23c | 13.00 ± 0.13a | 43.50 ± 0.00b | 17.00 ± 0.13b | 2.30 ± 0.18a | 18.00 ± 0.00b |
| A-G2 | 225.00 ± 0.87d | 6.50 ± 0.19c | 32.50 ± 0.00d | 16.50 ± 0.19b | 2.30 ± 0.05a | 14.00 ± 0.00c |
| A-G3 | 390.50 ± 0.25b | 11.00 ± 0.22b | 34.50 ± 0.22d | 22.00 ± 0.22a | 2.25 ± 0.17a | 18.50 ± 0.19b |
Table 5.
Effect of ascorbic acid and β-1,3-glucan addition on the free amino acids of tiger grouper during simulated transport (mg/100 g).
Table 5.
Effect of ascorbic acid and β-1,3-glucan addition on the free amino acids of tiger grouper during simulated transport (mg/100 g).
| Transport | Samples | Free Amino Acids |
|---|
| Asp * | Thr # | Ser # | Glu * | Gly # | Ala # | Val | Met | Ile |
|---|
| Before transport | CK | 1.84 ± 0.25a | 7.12 ± 0.25c | 3.98 ± 0.17b | 4.06 ± 0.22b | 49.40 ± 0.49d | 38.22 ± 0.71a | 5.45 ± 0.31a | 2.96 ± 0.26a | 4.73 ± 0.34a |
| A | 1.76 ± 0.01a | 11.44 ± 0.06b | 4.87 ± 0.25a | 4.89 ± 0.71a | 86.09 ± 0.91a | 34.33 ± 0.59b | 4.30 ± 0.51b | 2.07 ± 0.21a | 3.01 ± 0.22b |
| A-G1 | 1.65 ± 0.26a | 10.93 ± 0.18b | 3.77 ± 0.17b | 5.03 ± 0.14a | 75.24 ± 0.69b | 31.29 ± 0.06c | 5.98 ± 0.08a | 2.56 ± 0.18a | 3.97 ± 0.62a |
| A-G2 | 1.79 ± 0.32a | 12.14 ± 0.21a | 4.05 ± 0.38b | 4.42 ± 0.61b | 71.25 ± 0.53b | 39.78 ± 0.71a | 5.09 ± 0.22a | 2.13 ± 0.11a | 4.17 ± 0.04a |
| A-G3 | 1.84 ± 0.41a | 11.03 ± 0.01b | 4.97 ± 0.51a | 4.79 ± 0.25a | 66.42 ± 0.66c | 33.86 ± 0.81b | 4.97 ± 0.05a | 2.44 ± 0.01a | 3.57 ± 0.28b |
| After transport | CK | 1.98 ± 0.03c | 5.87 ± 0.45c | 5.10 ± 0.05c | 8.57 ± 0.07a | 63.01 ± 0.21c | 42.56 ± 0.66b | 6.91 ± 0.06a | 3.32 ± 0.28a | 5.89 ± 0.41a |
| A | 3.37 ± 0.19a | 9.85 ± 0.06b | 7.62 ± 0.28a | 6.33 ± 0.21b | 124.35 ± 0.37a | 38.03 ± 0.08d | 5.13 ± 0.10b | 2.62 ± 0.01b | 2.50 ± 0.16c |
| A-G1 | 2.38 ± 0.11b | 10.01 ± 0.32b | 7.99 ± 0.33a | 5.53 ± 0.03c | 75.44 ± 0.41b | 40.24 ± 0.19c | 6.02 ± 0.21a | 2.78 ± 0.06b | 3.11 ± 0.11b |
| A-G2 | 1.93 ± 0.01c | 10.93 ± 0.22a | 6.46 ± 0.05b | 5.09 ± 0.10c | 78.03 ± 0.39b | 46.51 ± 0.73a | 5.67 ± 0.03b | 2.61 ± 0.01b | 3.55 ± 0.06b |
| A-G3 | 1.70 ± 0.22c | 10.90 ± 0.06a | 5.48 ± 0.10c | 5.14 ± 0.19c | 74.29 ± 0.11b | 41.22 ± 0.37c | 5.13 ± 0.18b | 2.48 ± 0.12b | 3.71 ± 0.28b |
| Recovery | CK | 1.82 ± 0.08a | 7.89 ± 0.18c | 4.77 ± 0.27a | 6.59 ± 0.47a | 58.98 ± 0.91c | 40.03 ± 0.57b | 6.84 ± 0.25a | 2.38 ± 0.18a | 4.84 ± 0.10a |
| A | 1.98 ± 0.10a | 11.19 ± 0.27a | 5.18 ± 0.27a | 5.94 ± 0.31b | 96.71 ± 0.43a | 35.28 ± 0.09d | 4.97 ± 0.33b | 2.46 ± 0.02a | 2.92 ± 0.16c |
| A-G1 | 1.73 ± 0.02a | 10.52 ± 0.04b | 4.85 ± 0.03a | 4.96 ± 0.80c | 74.04 ± 0.09b | 37.90 ± 0.18c | 4.99 ± 0.09b | 2.10 ± 0.11a | 4.06 ± 0.71a |
| A-G2 | 1.58 ± 0.16a | 11.88 ± 0.11a | 5.16 ± 0.18a | 4.83 ± 0.33c | 77.13 ± 0.36b | 41.64 ± 0.78a | 4.96 ± 0.18b | 1.92 ± 0.02a | 3.49 ± 0.39b |
| A-G3 | 1.69 ± 0.22a | 11.85 ± 0.65a | 4.86 ± 0.20a | 4.31 ± 0.57c | 73.04 ± 0.74b | 37.49 ± 0.07c | 4.67 ± 0.21b | 2.23 ± 0.18a | 3.39 ± 0.27b |
| | | Leu | Tyr | Phe | Lys | His | Arg | Pro# | Total |
| Before transport | CK | 7.52 ± 0.37a | 3.22 ± 0.02a | 2.88 ± 0.02a | 28.54 ± 0.54a | 3.86 ± 0.25a | 7.86 ± 0.71a | 6.27 ± 0.68a | 177.91 |
| A | 7.73 ± 0.41a | 1.45 ± 0.01c | 1.57 ± 0.11c | 21.89 ± 0.48c | 3.55 ± 0.34b | 5.38 ± 0.42c | 5.49 ± 0.71b | 199.82 |
| A-G1 | 7.88 ± 0.68a | 1.73 ± 0.22b | 2.05 ± 0.18b | 25.33 ± 0.71b | 3.18 ± 0.33b | 6.93 ± 0.74bc | 5.93 ± 0.01a | 193.45 |
| A-G2 | 7.03 ± 0.31a | 1.98 ± 0.17b | 2.47 ± 0.17a | 26.09 ± 0.31b | 4.09 ± 0.06a | 6.41 ± 0.11b | 6.09 ± 0.39a | 198.98 |
| A-G3 | 7.97 ± 0.45a | 2.06 ± 0.28b | 1.99 ± 0.01c | 23.45 ± 0.78c | 3.74 ± 0.28a | 7.07 ± 0.02b | 5.77 ± 0.81ab | 185.94 |
| Aftertransport | CK | 7.83 ± 0.31a | 3.76 ± 0.28a | 3.46 ± 0.15a | 31.35 ± 0.59a | 4.30 ± 0.45a | 10.74 ± 0.33a | 8.18 ± 0.39a | 212.83 |
| A | 7.76 ± 0.28a | 1.34 ± 0.01c | 2.28 ± 0.25b | 24.39 ± 0.63c | 3.63 ± 0.19b | 4.99 ± 0.41d | 6.07 ± 0.08c | 250.26 |
| A-G1 | 8.74 ± 0.41b | 1.43 ± 0.12c | 2.46 ± 0.06b | 29.39 ± 0.71b | 4.12 ± 0.06a | 6.63 ± 0.71c | 7.74 ± 0.73b | 214.01 |
| A-G2 | 7.01 ± 0.37a | 1.55 ± 0.08c | 2.49 ± 0.03b | 27.83 ± 0.39b | 4.23 ± 0.28a | 6.69 ± 0.07c | 6.41 ± 0.36c | 216.99 |
| A-G3 | 7.76 ± 0.63a | 2.38 ± 0.19b | 2.48 ± 0.11b | 24.87 ± 0.23c | 3.93 ± 0.09a | 7.98 ± 0.20b | 5.71 ± 0.51d | 205.16 |
| Recovery | CK | 6.82 ± 0.10b | 2.95 ± 0.01a | 1.79 ± 0.02b | 22.19 ± 0.33c | 3.60 ± 0.17a | 6.59 ± 0.38a | 5.19 ± 0.62c | 183.27 |
| A | 6.98 ± 0.12b | 1.52 ± 0.02b | 1.98 ± 0.10ab | 22.75 ± 0.62c | 3.42 ± 0.31a | 5.21 ± 0.67b | 5.94 ± 0.17b | 214.43 |
| A-G1 | 7.65 ± 0.41a | 1.67 ± 0.13b | 2.30 ± 0.21a | 26.91 ± 0.15a | 2.75 ± 0.07b | 6.87 ± 0.37a | 6.79 ± 0.57a | 200.09 |
| A-G2 | 7.83 ± 0.57a | 1.86 ± 0.03b | 2.19 ± 0.09a | 24.50 ± 0.31b | 2.98 ± 0.35b | 6.61 ± 0.65a | 5.81 ± 0.08b | 204.37 |
| A-G3 | 7.23 ± 0.69a | 1.44 ± 0.02b | 2.26 ± 0.11a | 19.59 ± 0.09d | 3.64 ± 0.41a | 6.55 ± 0.52a | 4.94 ± 0.72c | 189.18 |
Table 6.
Effect of ascorbic acid and β-1,3-glucan addition on nucleotides of tiger grouper during simulated transport in water.
Table 6.
Effect of ascorbic acid and β-1,3-glucan addition on nucleotides of tiger grouper during simulated transport in water.
| Transport | Samples | IMP (mg/100 g) | TAV | AMP (mg/100 g) | TAV |
|---|
| Before transport | CK | 269.18 ± 0.78d | 10.77 | 13.24 ± 0.41ab | 0.26 |
| A | 273.40 ± 0.66c | 10.94 | 14.69 ± 0.59a | 0.29 |
| A-G1 | 271.94 ± 0.96cd | 10.88 | 12.47 ± 0.65b | 0.25 |
| A-G2 | 278.66 ± 0.55b | 11.15 | 13.93 ± 0.32ab | 0.28 |
| A-G3 | 284.39 ± 0.47a | 11.38 | 13.54 ± 0.69ab | 0.27 |
| Aftertransport | CK | 259.47 ± 0.84d | 10.38 | 9.55 ± 0.57b | 0.19 |
| A | 268.06 ± 0.28c | 10.72 | 11.23 ± 0.62ab | 0.22 |
| A-G1 | 269.18 ± 0.71c | 10.77 | 11.37 ± 0.71ab | 0.23 |
| A-G2 | 275.33 ± 0.49b | 11.01 | 12.99 ± 0.45a | 0.26 |
| A-G3 | 280.91 ± 0.78a | 11.24 | 10.81 ± 0.66b | 0.22 |
| Recovery | CK | 273.57 ± 0.67e | 10.94 | 14.43 ± 0.28a | 0.29 |
| A | 280.69 ± 0.71d | 11.23 | 10.98 ± 0.33c | 0.22 |
| A-G1 | 301.42 ± 0.54c | 12.06 | 13.41 ± 0.19a | 0.27 |
| A-G2 | 403.49 ± 0.66a | 16.14 | 12.79 ± 0.25b | 0.26 |
| A-G3 | 390.24 ± 0.91b | 15.61 | 12.63 ± 0.36b | 0.25 |


