A Deterministic–Statistical Hybrid Forecast Model: The Future of the COVID-19 Contagious Process in Several Regions of Mexico
Abstract
:1. Introduction
2. Forecasting the Newly COVID-19-Infected Individuals
2.1. Modeling the Variable Condition of the Contagiousness of COVID-19
2.2. Modeling the Contagious Growth Process
2.3. The Projection Model
2.4. Populating the Multivariate Probability Structure P
2.5. Monet, the Computing Environment, and DAR, the Data Autonomous Representation
3. Results
3.1. Prognostics for 21 Days into the Future
3.2. Assessing the Precision of Prognostics
3.3. The Alternative of Aggregating More Detailed Region Values
4. Generalizing the Method
5. Discussion
Author Contributions
Funding
Conflicts of Interest
Appendix A. The Data Autonomous Representation
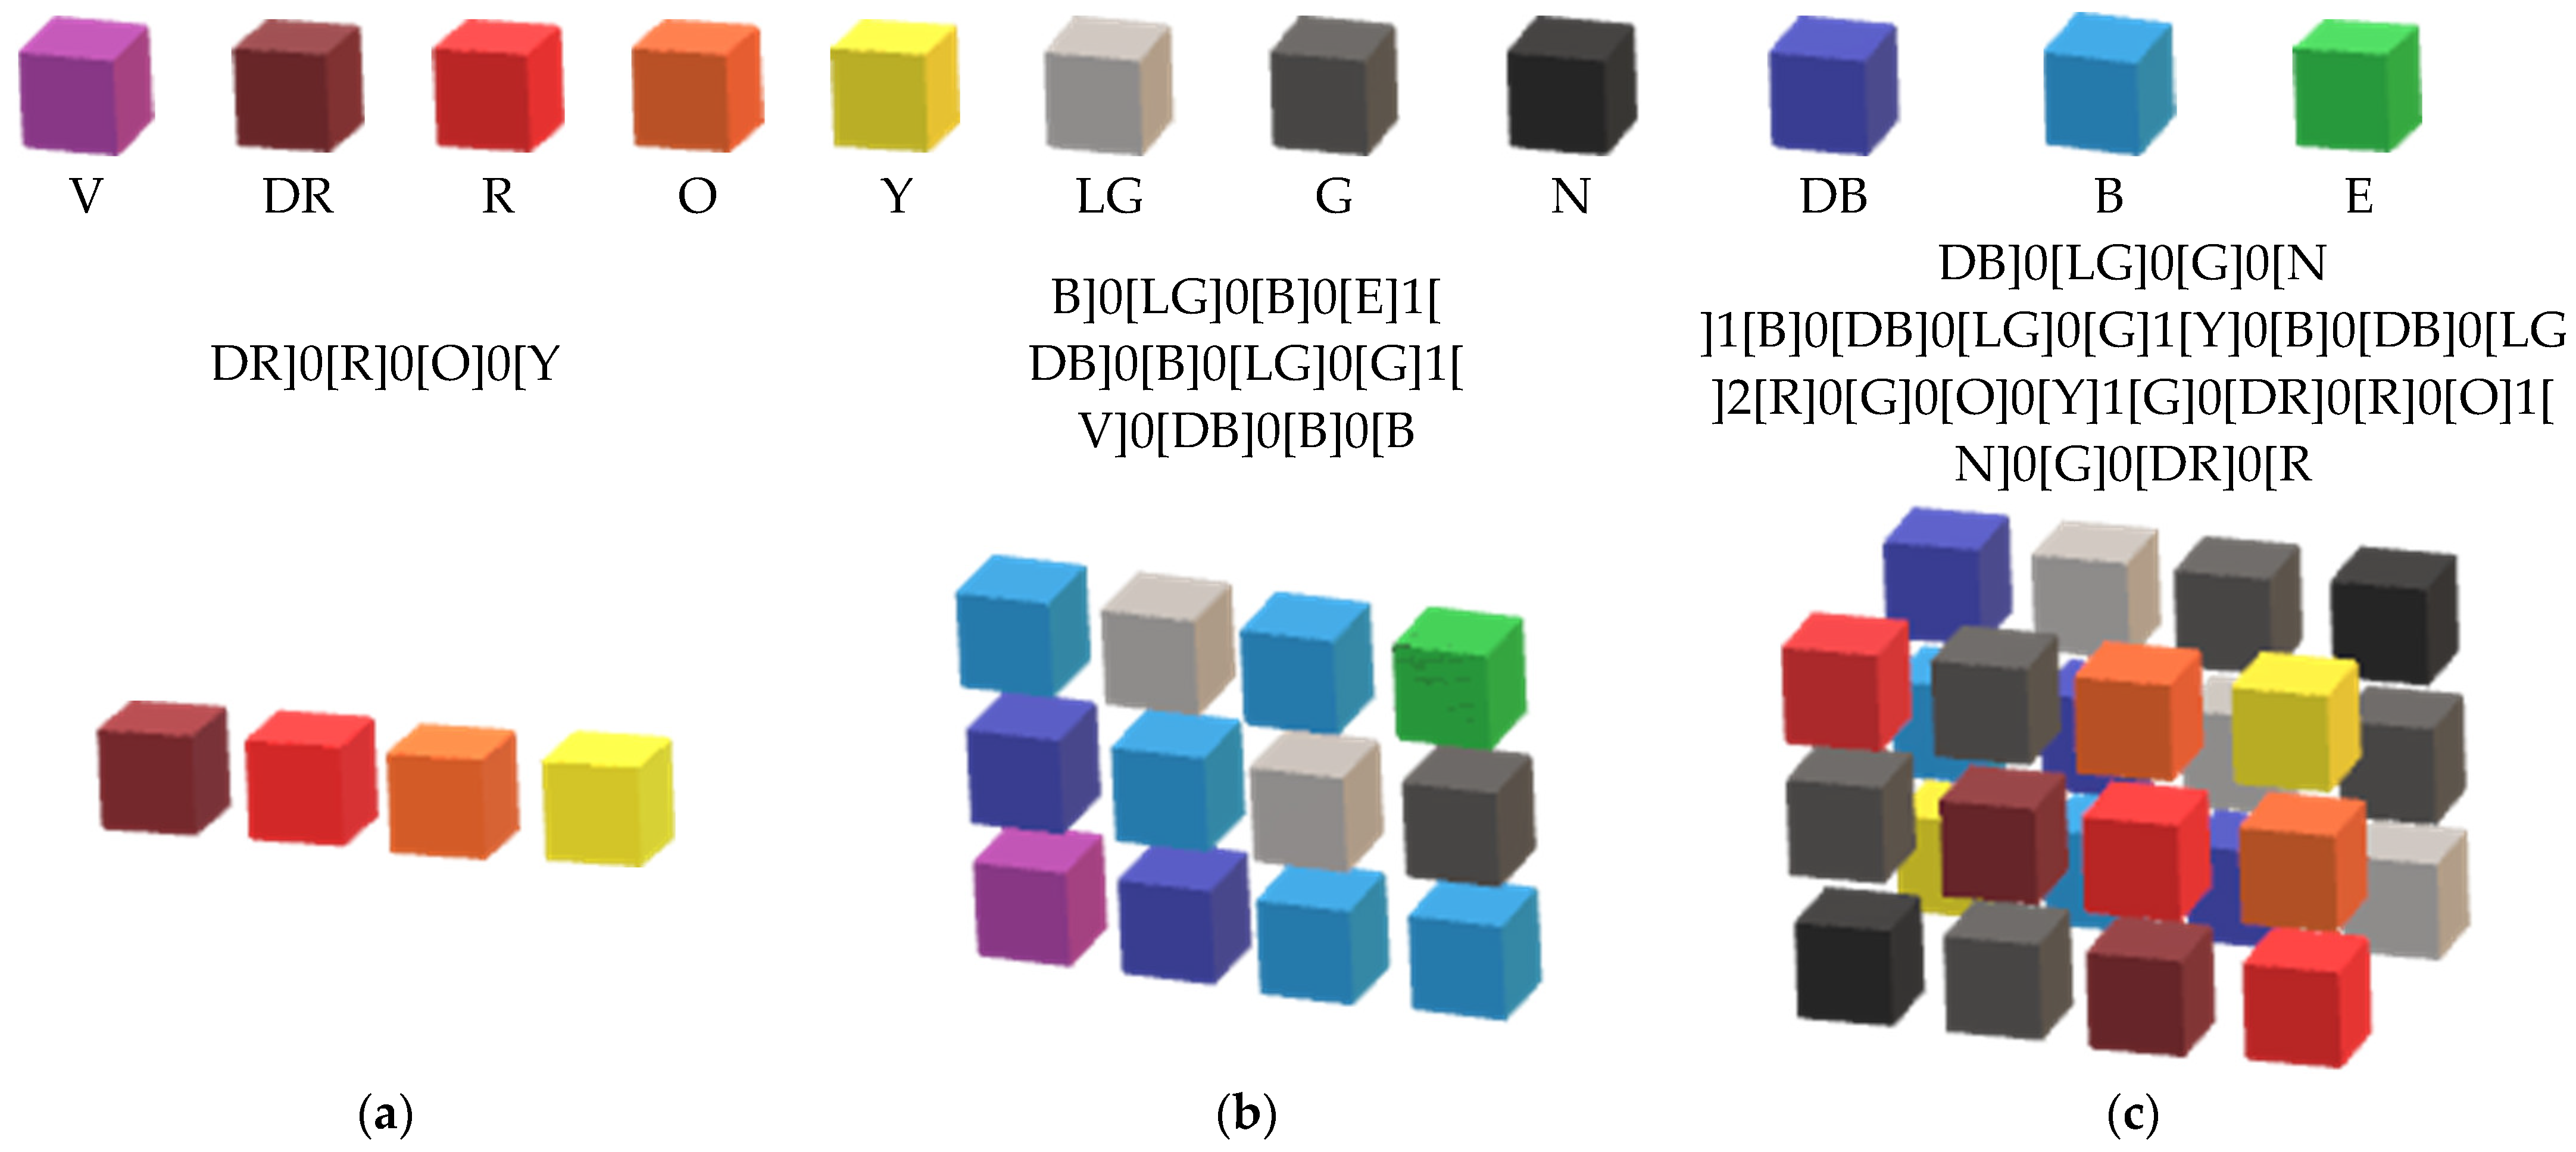
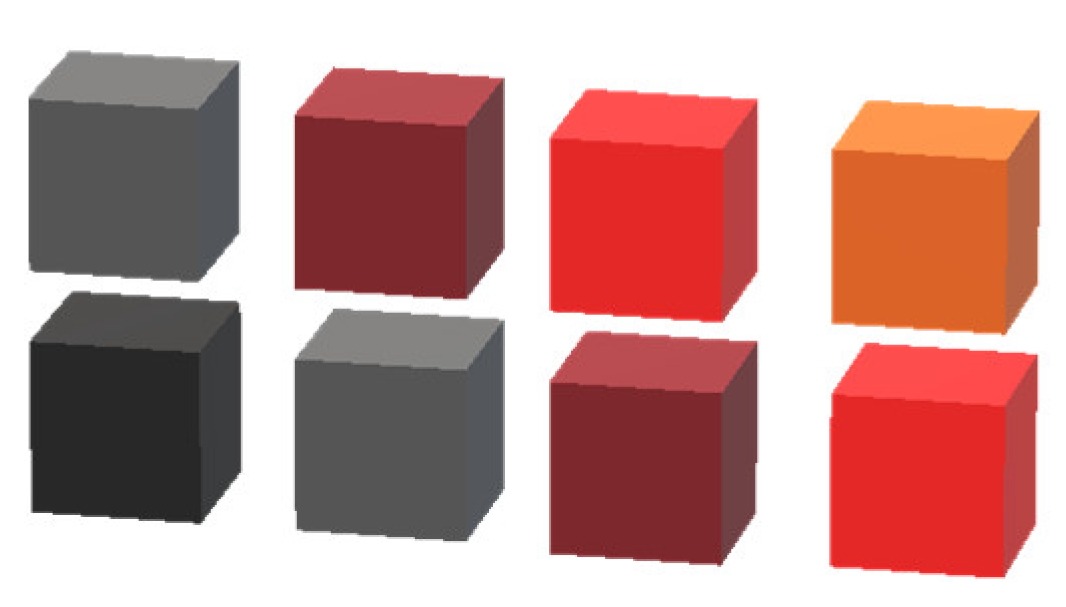
Appendix B. Integrating Differential Equations with Monet
Appendix B.1. Computing Models Using Data at the Corresponding Scale
| <dIdt.LIST> | = STRCTgrow(<dIdt.LIST<IC><dIdt.Init.FLOT></>>, ]0[, 1, 1, <r.InfctRate.FLOT{<Last>{0<RelDepth>0</>}}> * <e.Permness.TREE{<Last>{0<RelDepth>0</>}}> * <S.LIST{<Last>}> * <Daily New Cases.LIST{<Last>}> - <a.RemRate.FLOT> * <Daily New Cases.LIST{<Last>}>, Compact) |
| <Daily New Cases.LIST> | = STRCTgrow(<Daily New Cases.LIST<IC><I.Init.INTG></>>, ]0[, 1, 1, <Daily New Cases.LIST{<Last>}> + <dIdt.LIST{<Last>}> * <Dt.FLOT>, Compact) |
| <dSdt.LIST> | = STRCTgrow(<dSdt.LIST<IC><dSdt.Init.FLOT></>>, ]0[, 1, 1, -1 * <e.Permissiveness.TREE{<Last>{0<RelDepth>0</>}}> * <r.InfctRate.FLOT{<Last>{0<RelDepth>0</>}}> * <S.LIST{<Last>}> * <Daily New Cases.LIST{<Last>}>, Compact) |
| <S.INTG> | = STRCTgrow(<S.LIST<IC><S.Init.INTG></>>, ]0[, 1, 1, <S.LIST{<Last>}> +<dSdt.LIST{<Last>}> * <Dt.FLOT>, Compact) |
| <dRdt.LIST> | = STRCTgrow(<dRdt.LIST<IC><dRdt.Init.FLOT></>>, ]0[, 1, 1, <a.RemRate.FLOT> * <Daily New Cases.LIST{<Last>}>, Compact) |
| <R.LIST> | = STRCTgrow(<R.LIST<IC><R.Init.INTG></>>, ]0[, 1, 1, <R.LIST{<Last>}> +<dRdt.LIST{<Last>}> * <Dt.FLOT>, Compact) |
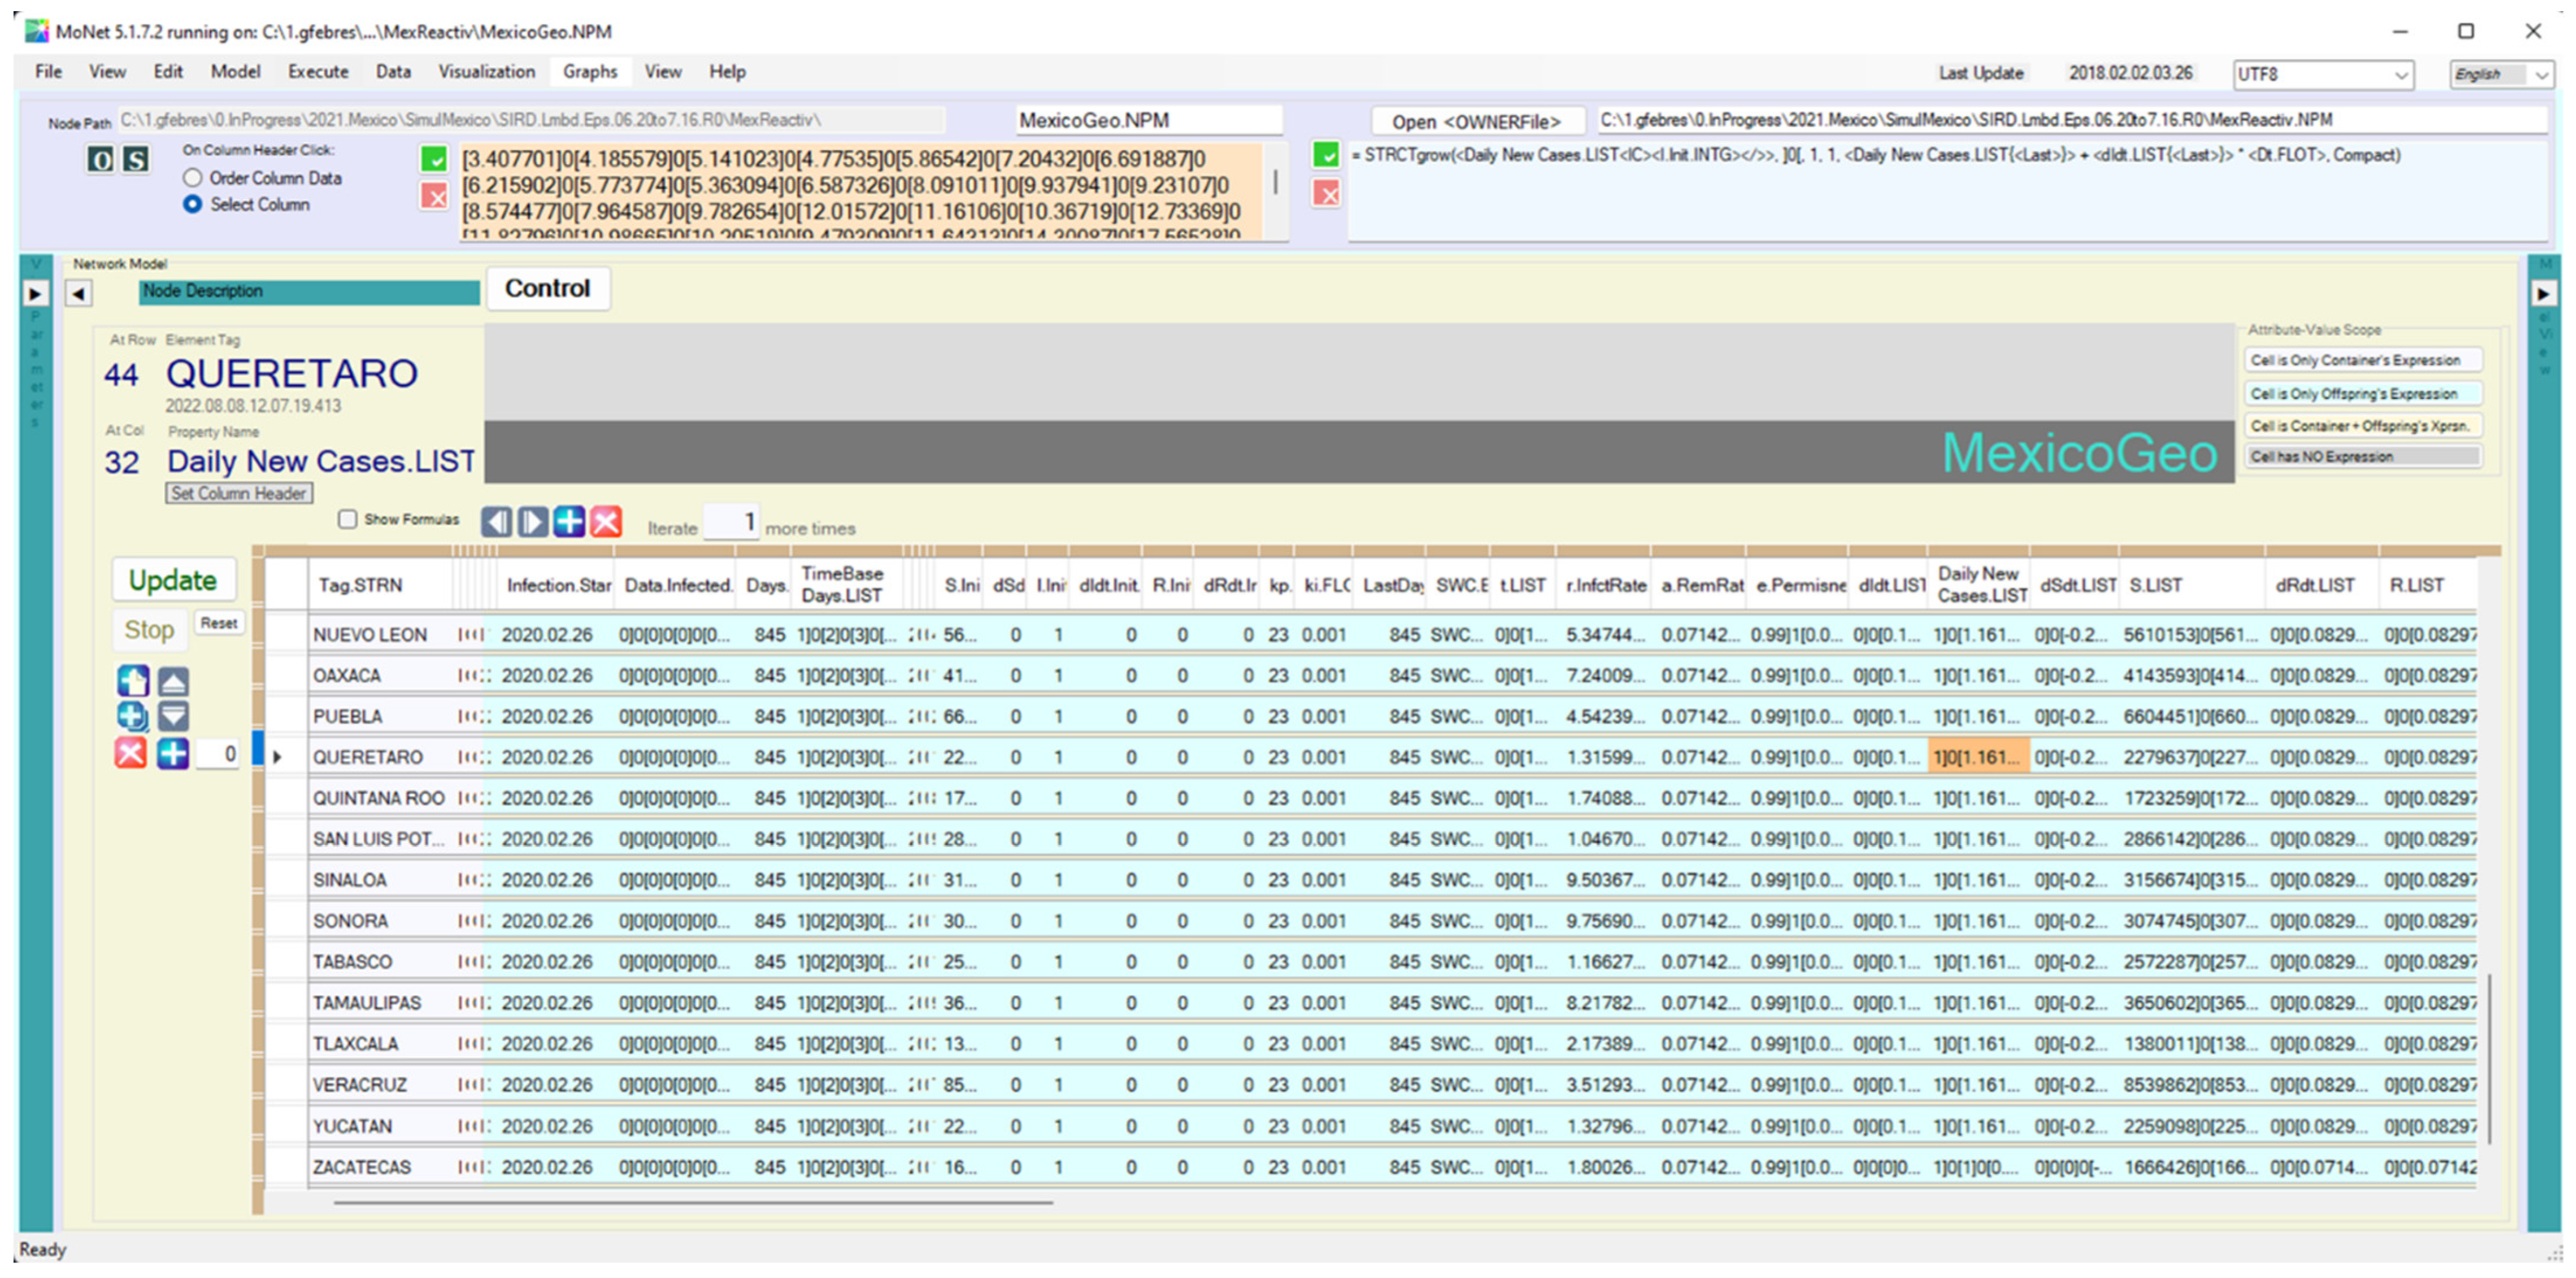

Appendix B.2. Computing Models Aggregating Results from Inner Detailed Scale
| <dIdt.LIST> | = Avg(<dIdt.LIST><~><OFFSPRINGS>.<LEAF></~>, <void>) |
| <Daily New Cases.LIST> | = Sum(<Daily New Cases.LIST><~><OFFSPRINGS>.<LEAF></~>, <void>) |
| <dSdt.LIST> | = Avg(<dIdt.LIST><~><OFFSPRINGS>.<LEAF></~>, <void>) |
| <S.INTG> | = Sum(<Daily New Cases.LIST><~><OFFSPRINGS>.<LEAF></~>, <void>) |
| <dRdt.LIST> | = Avg(<dIdt.LIST><~><OFFSPRINGS>.<LEAF></~>, <void>) |
| <R.LIST> | = Sum(<Daily New Cases.LIST><~><OFFSPRINGS>.<LEAF></~>, <void>) |
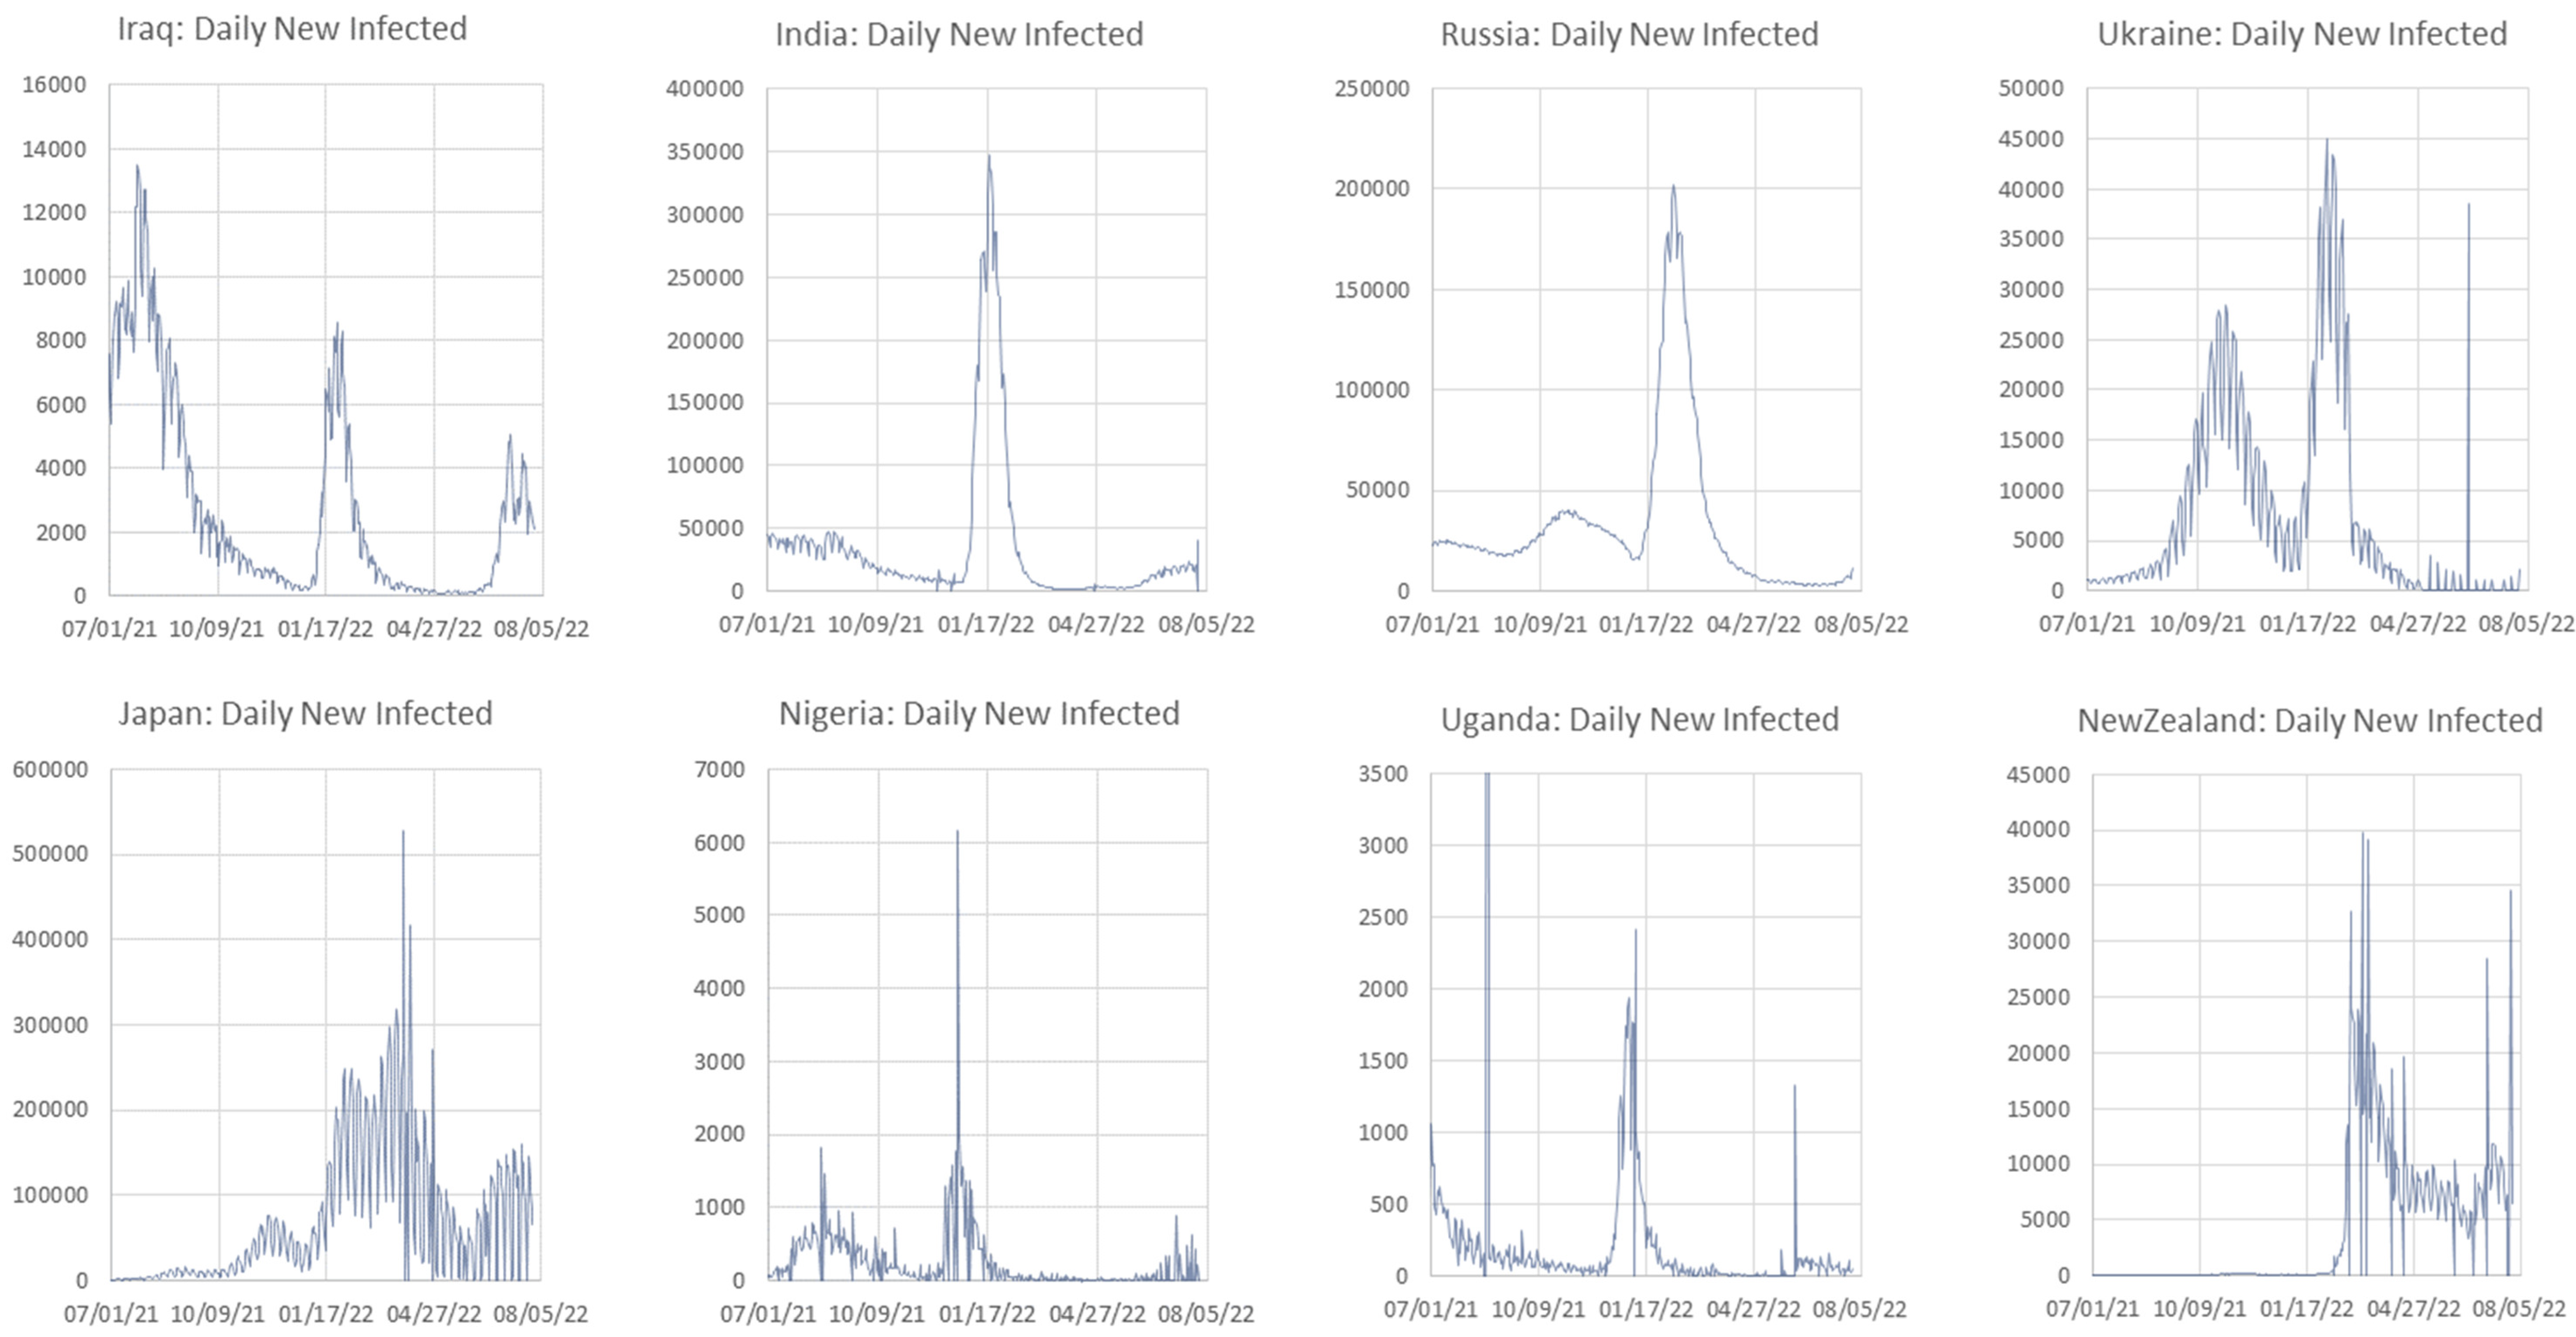
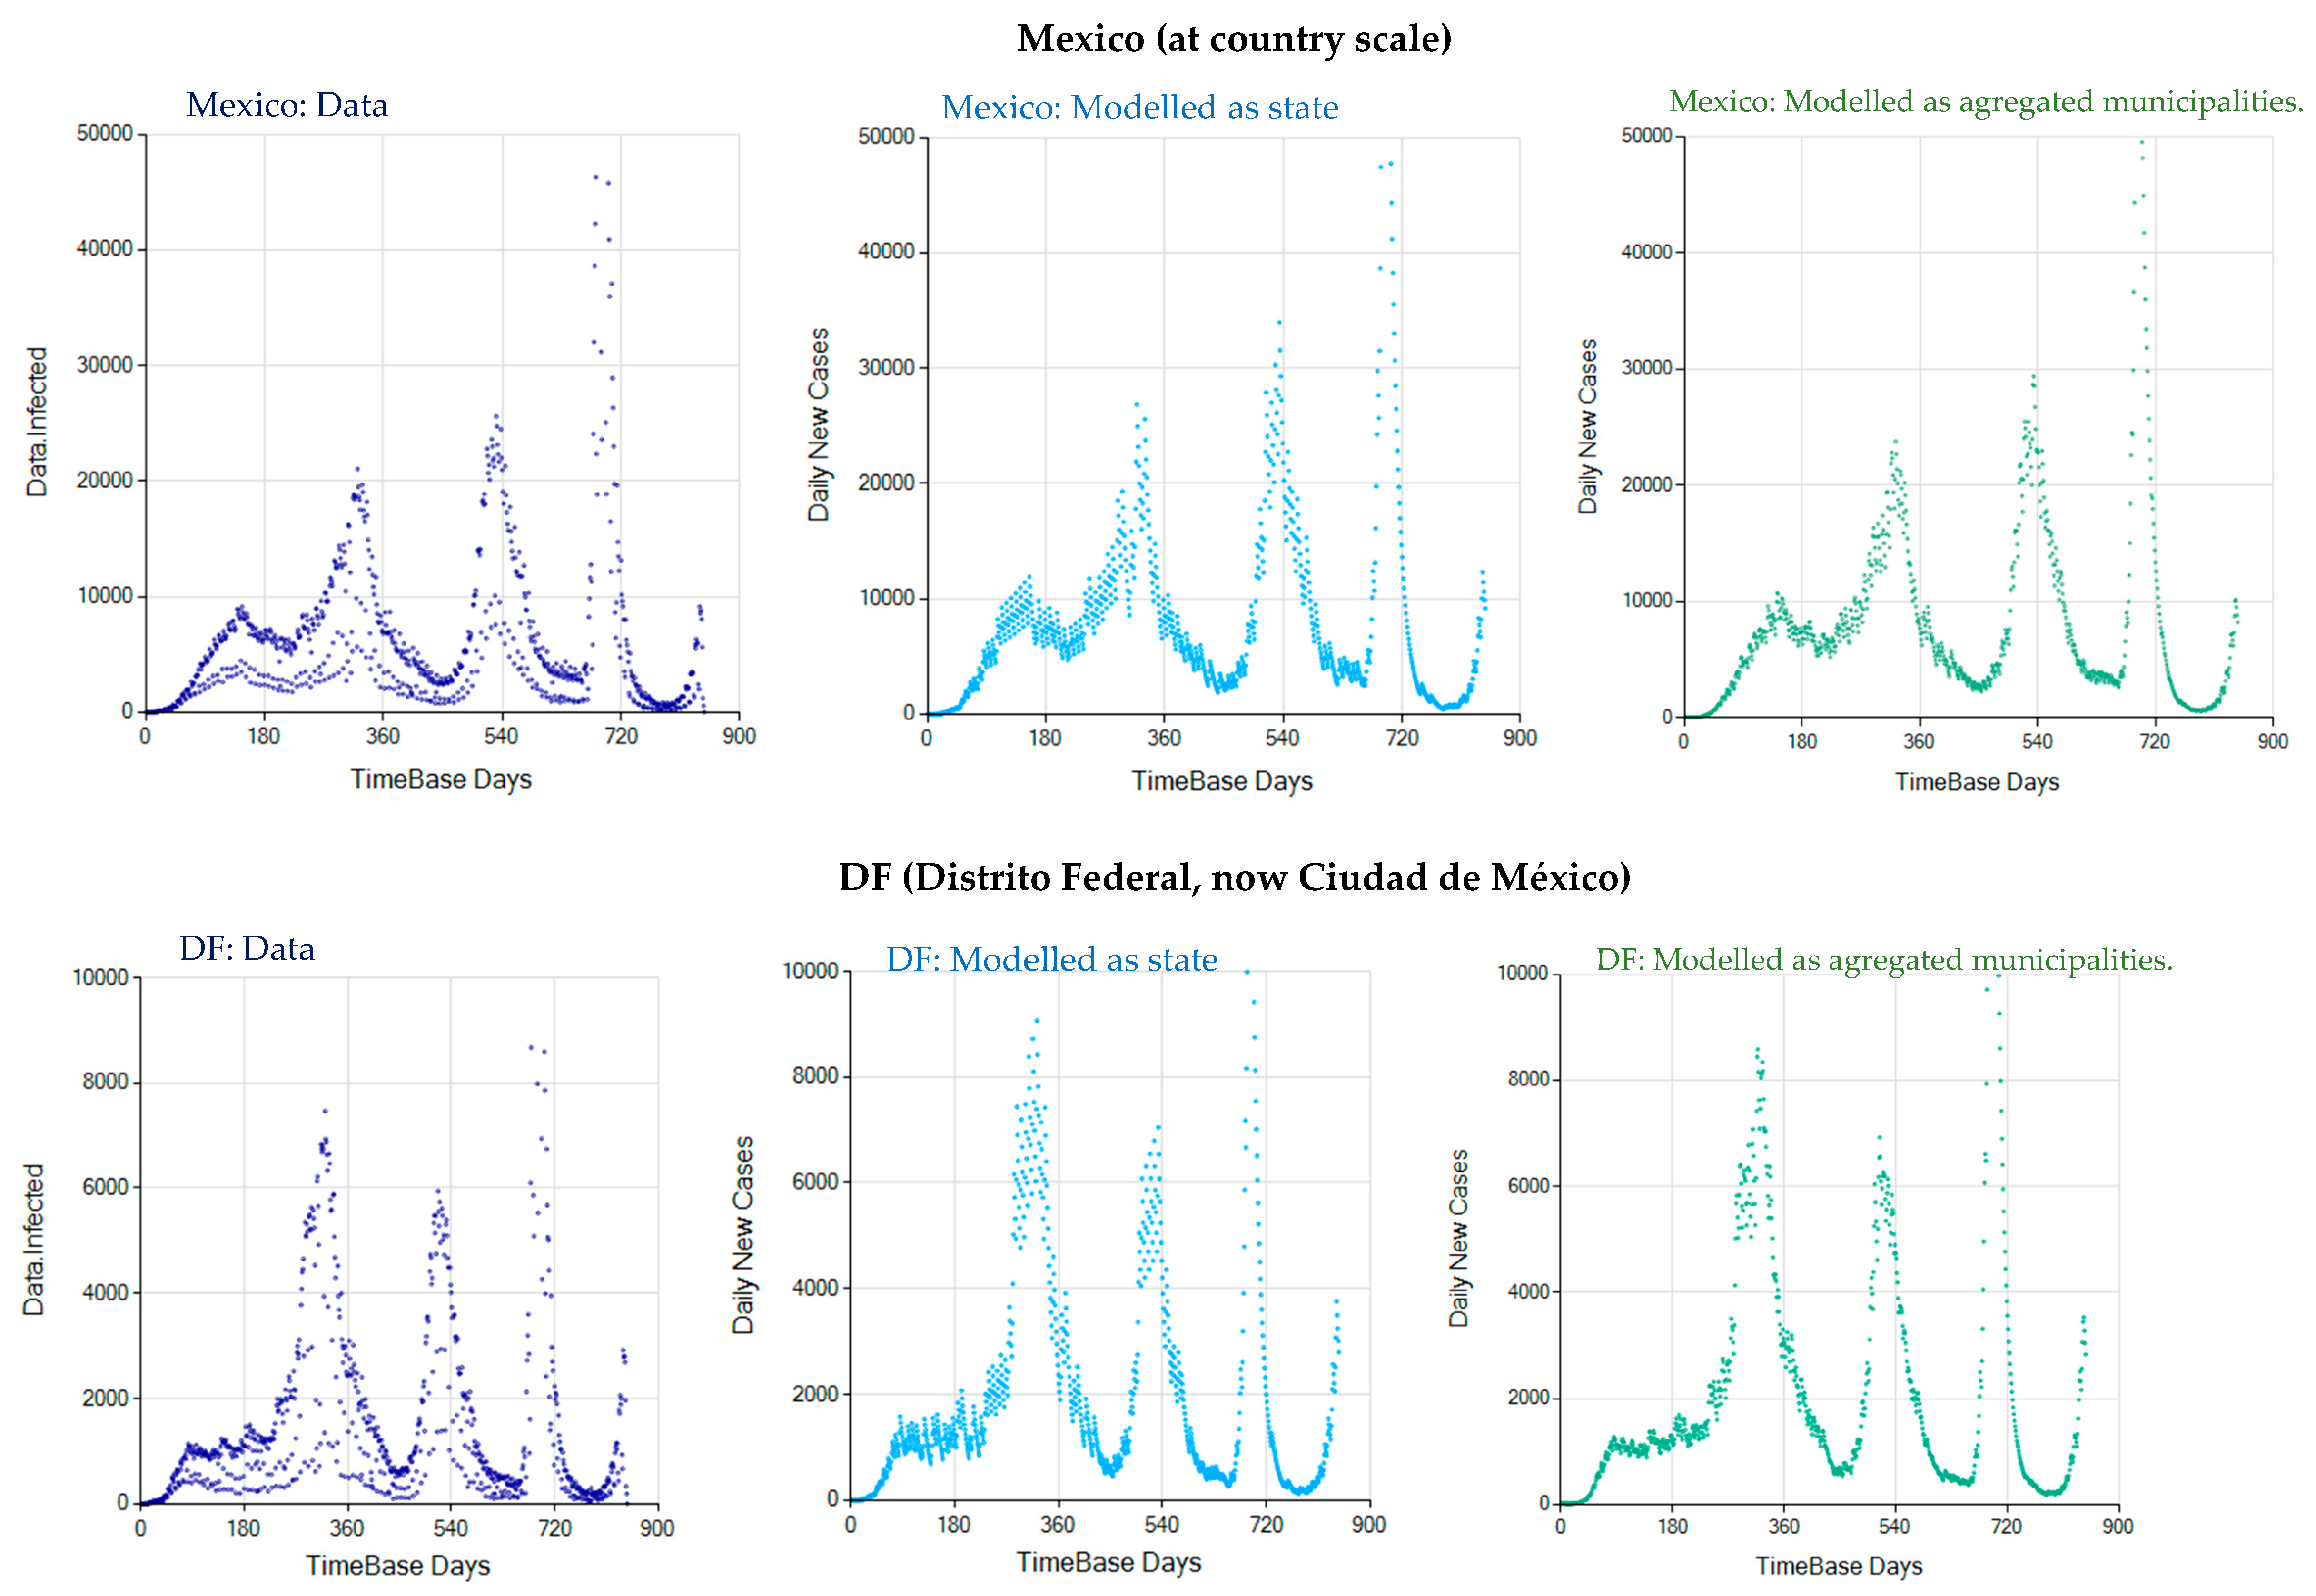
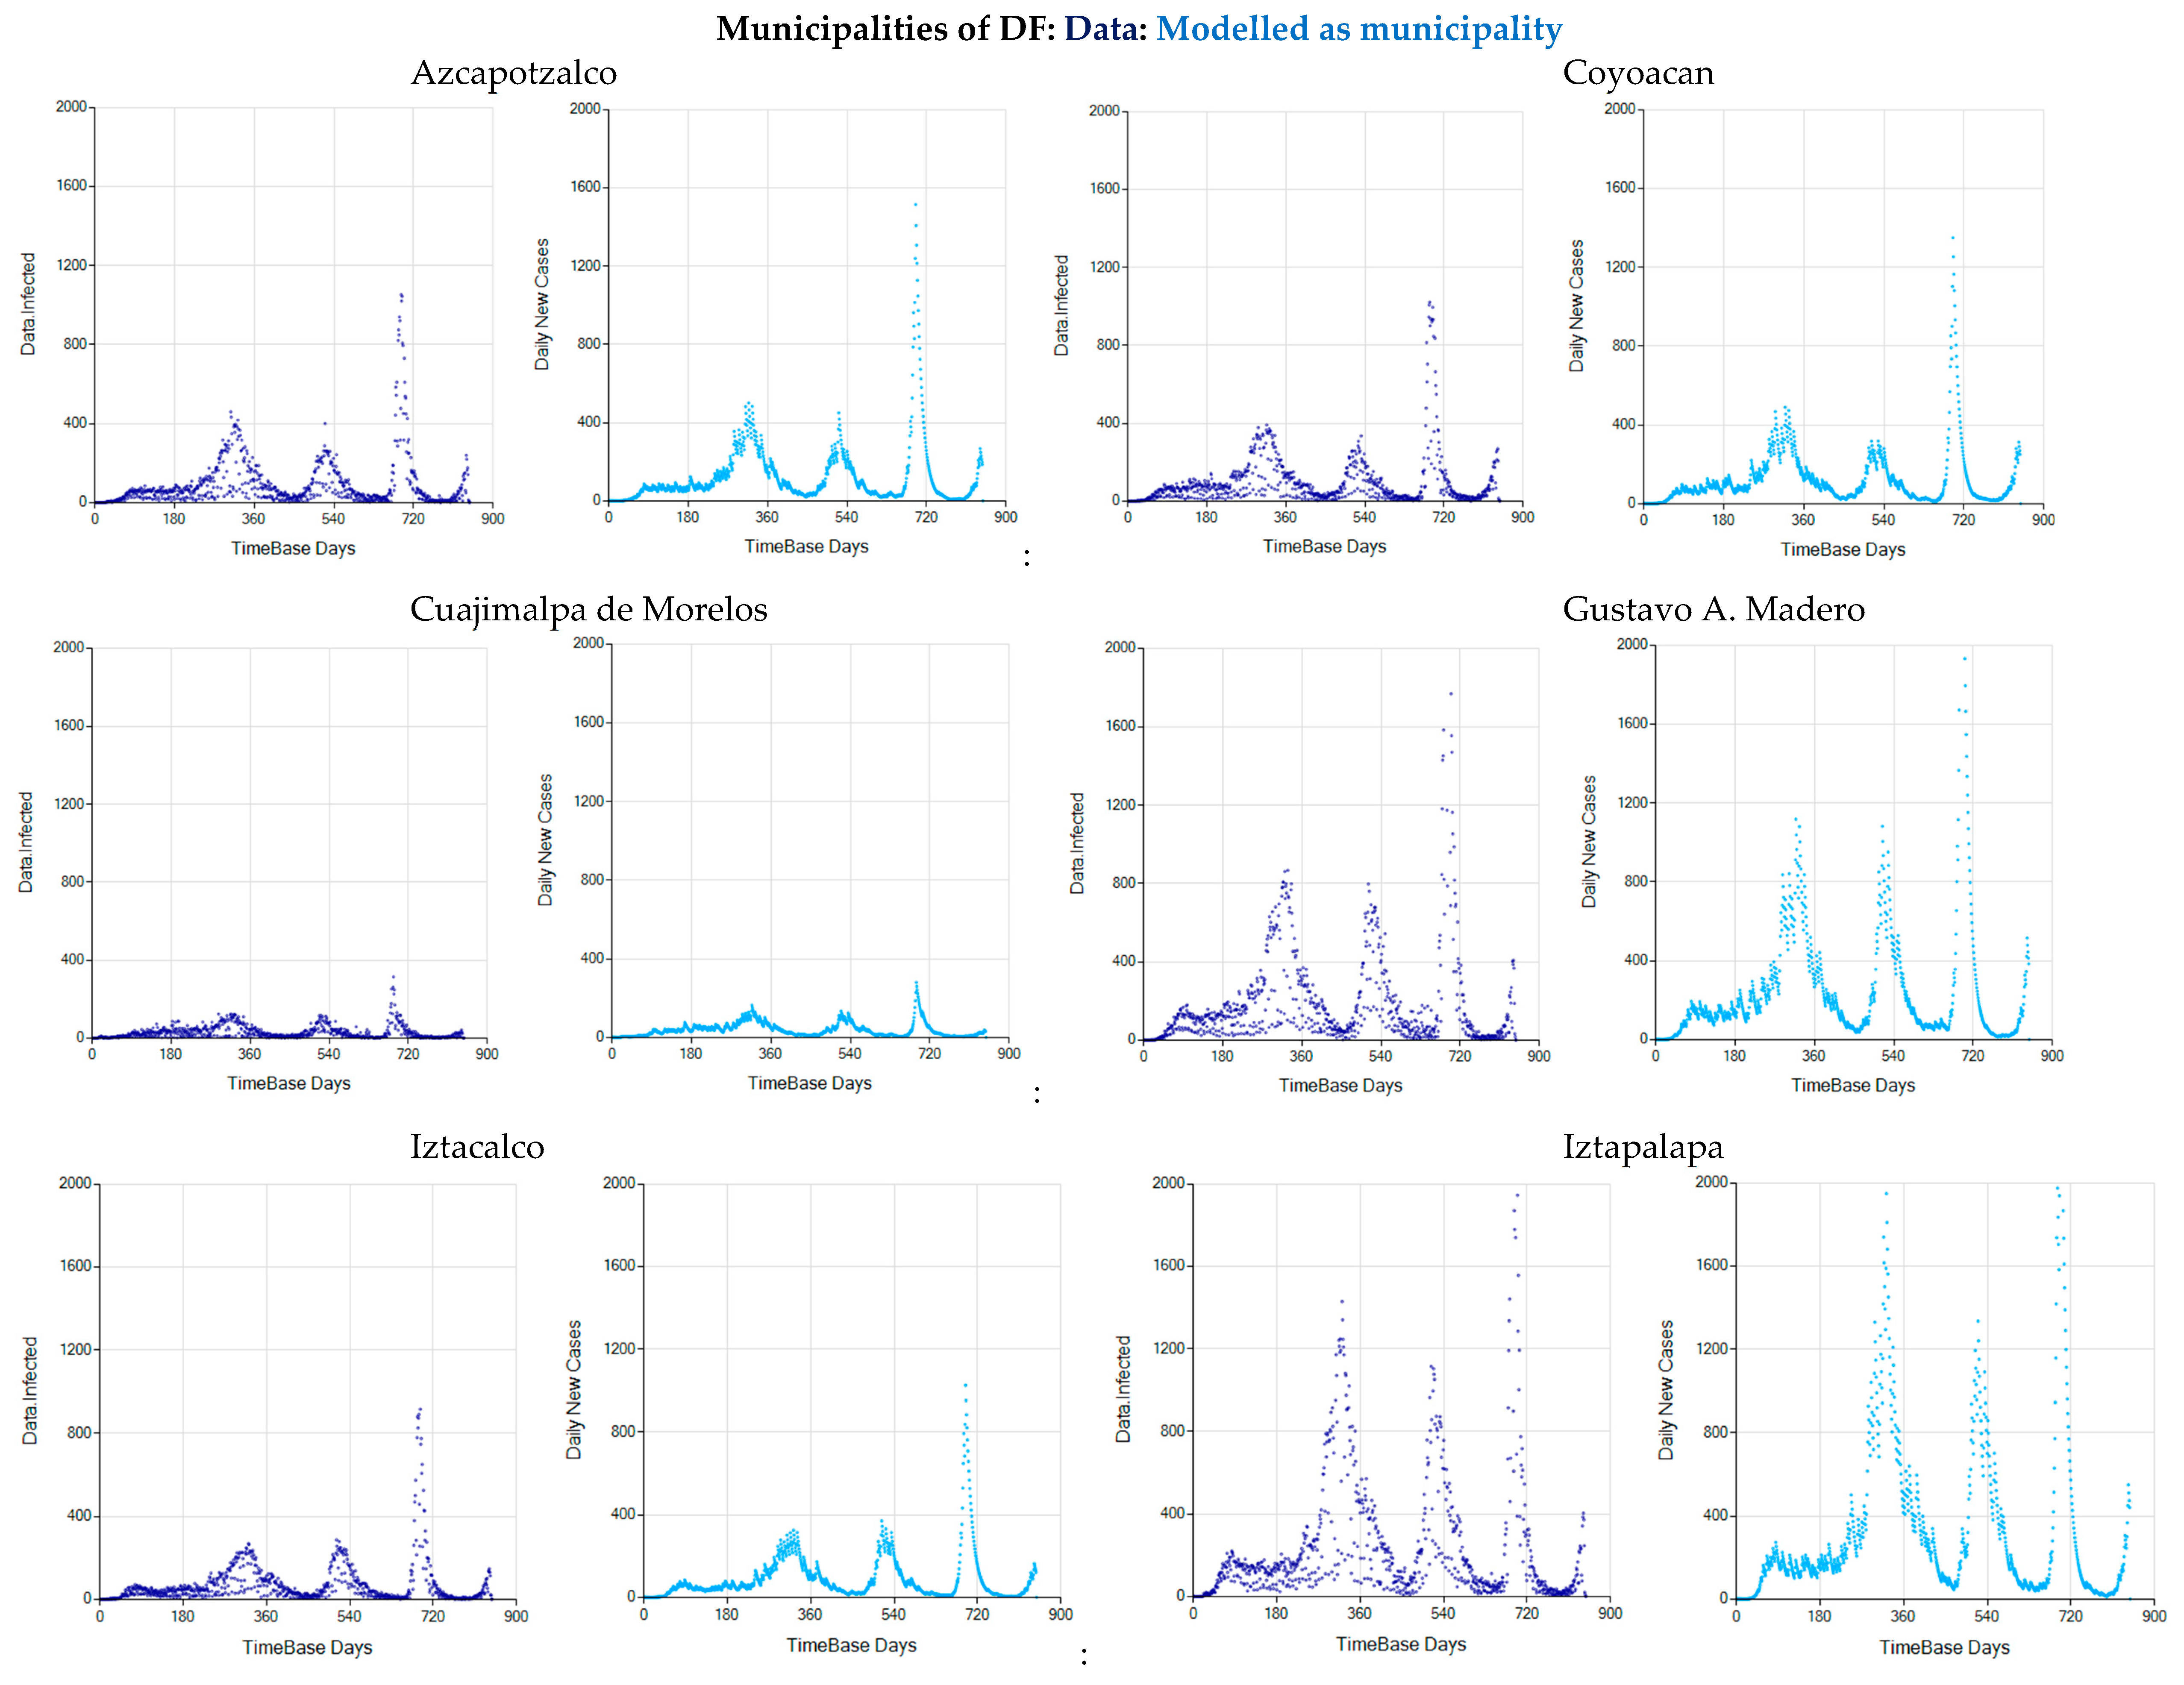
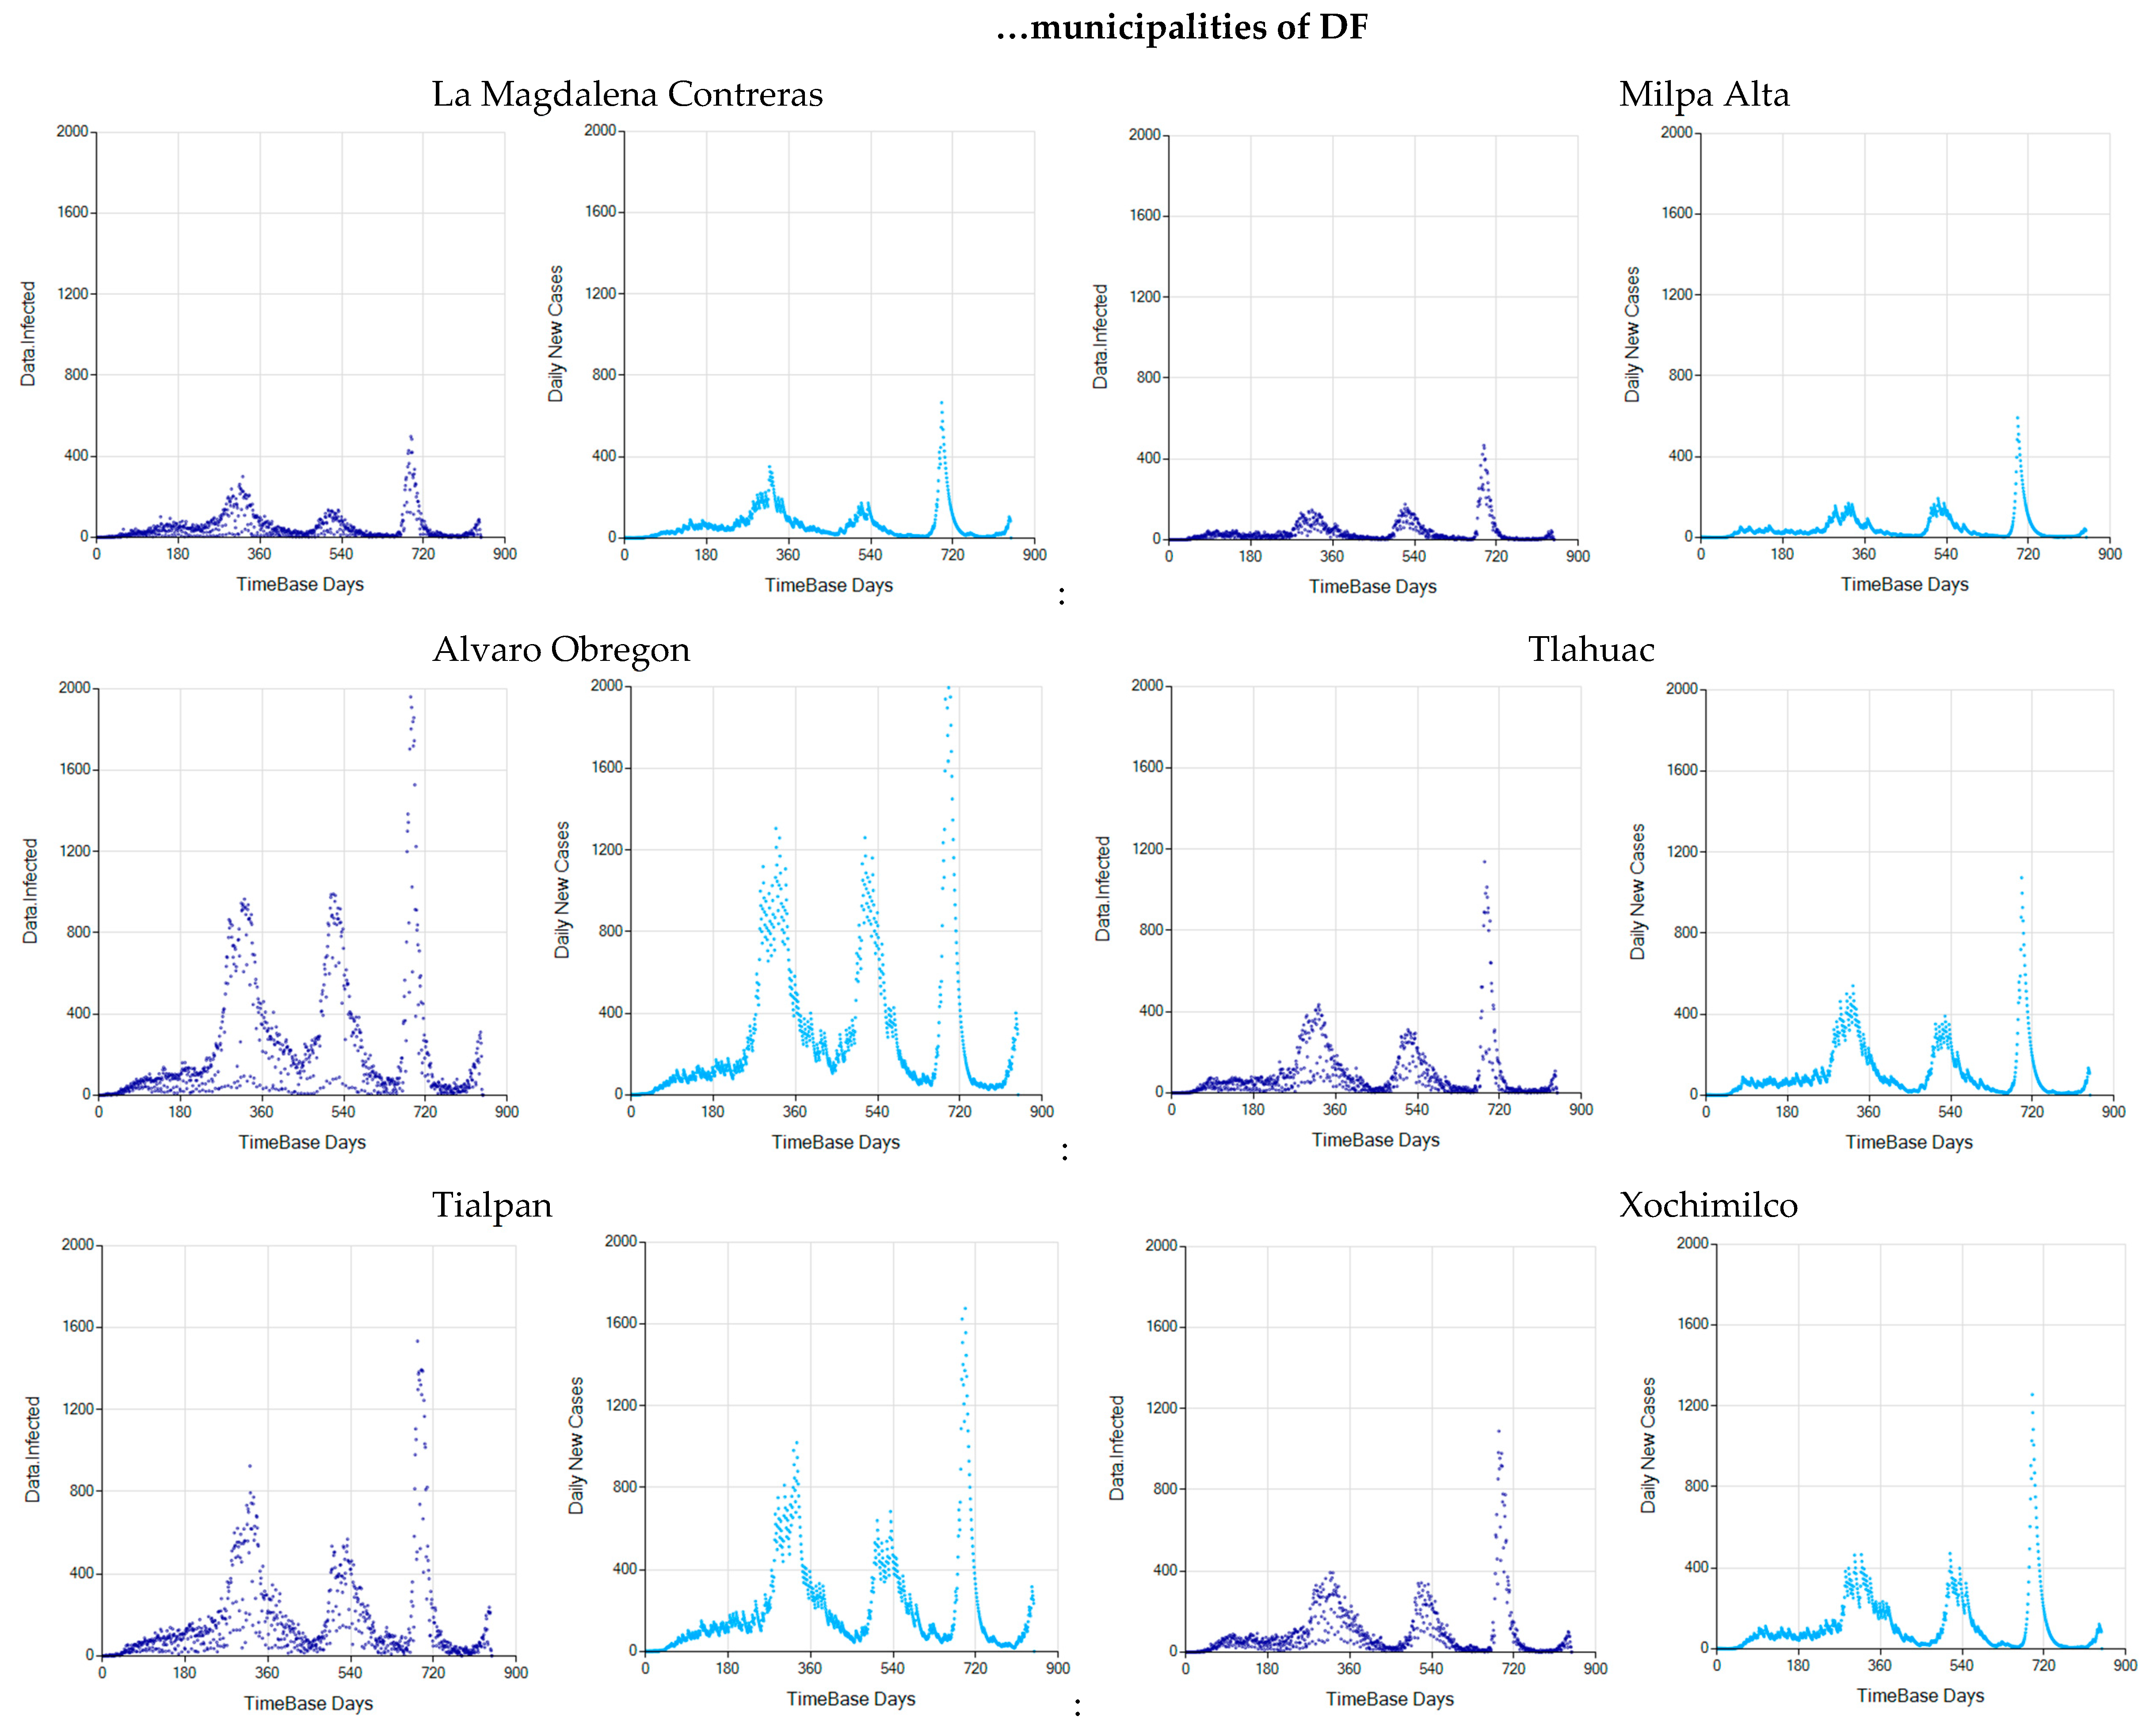
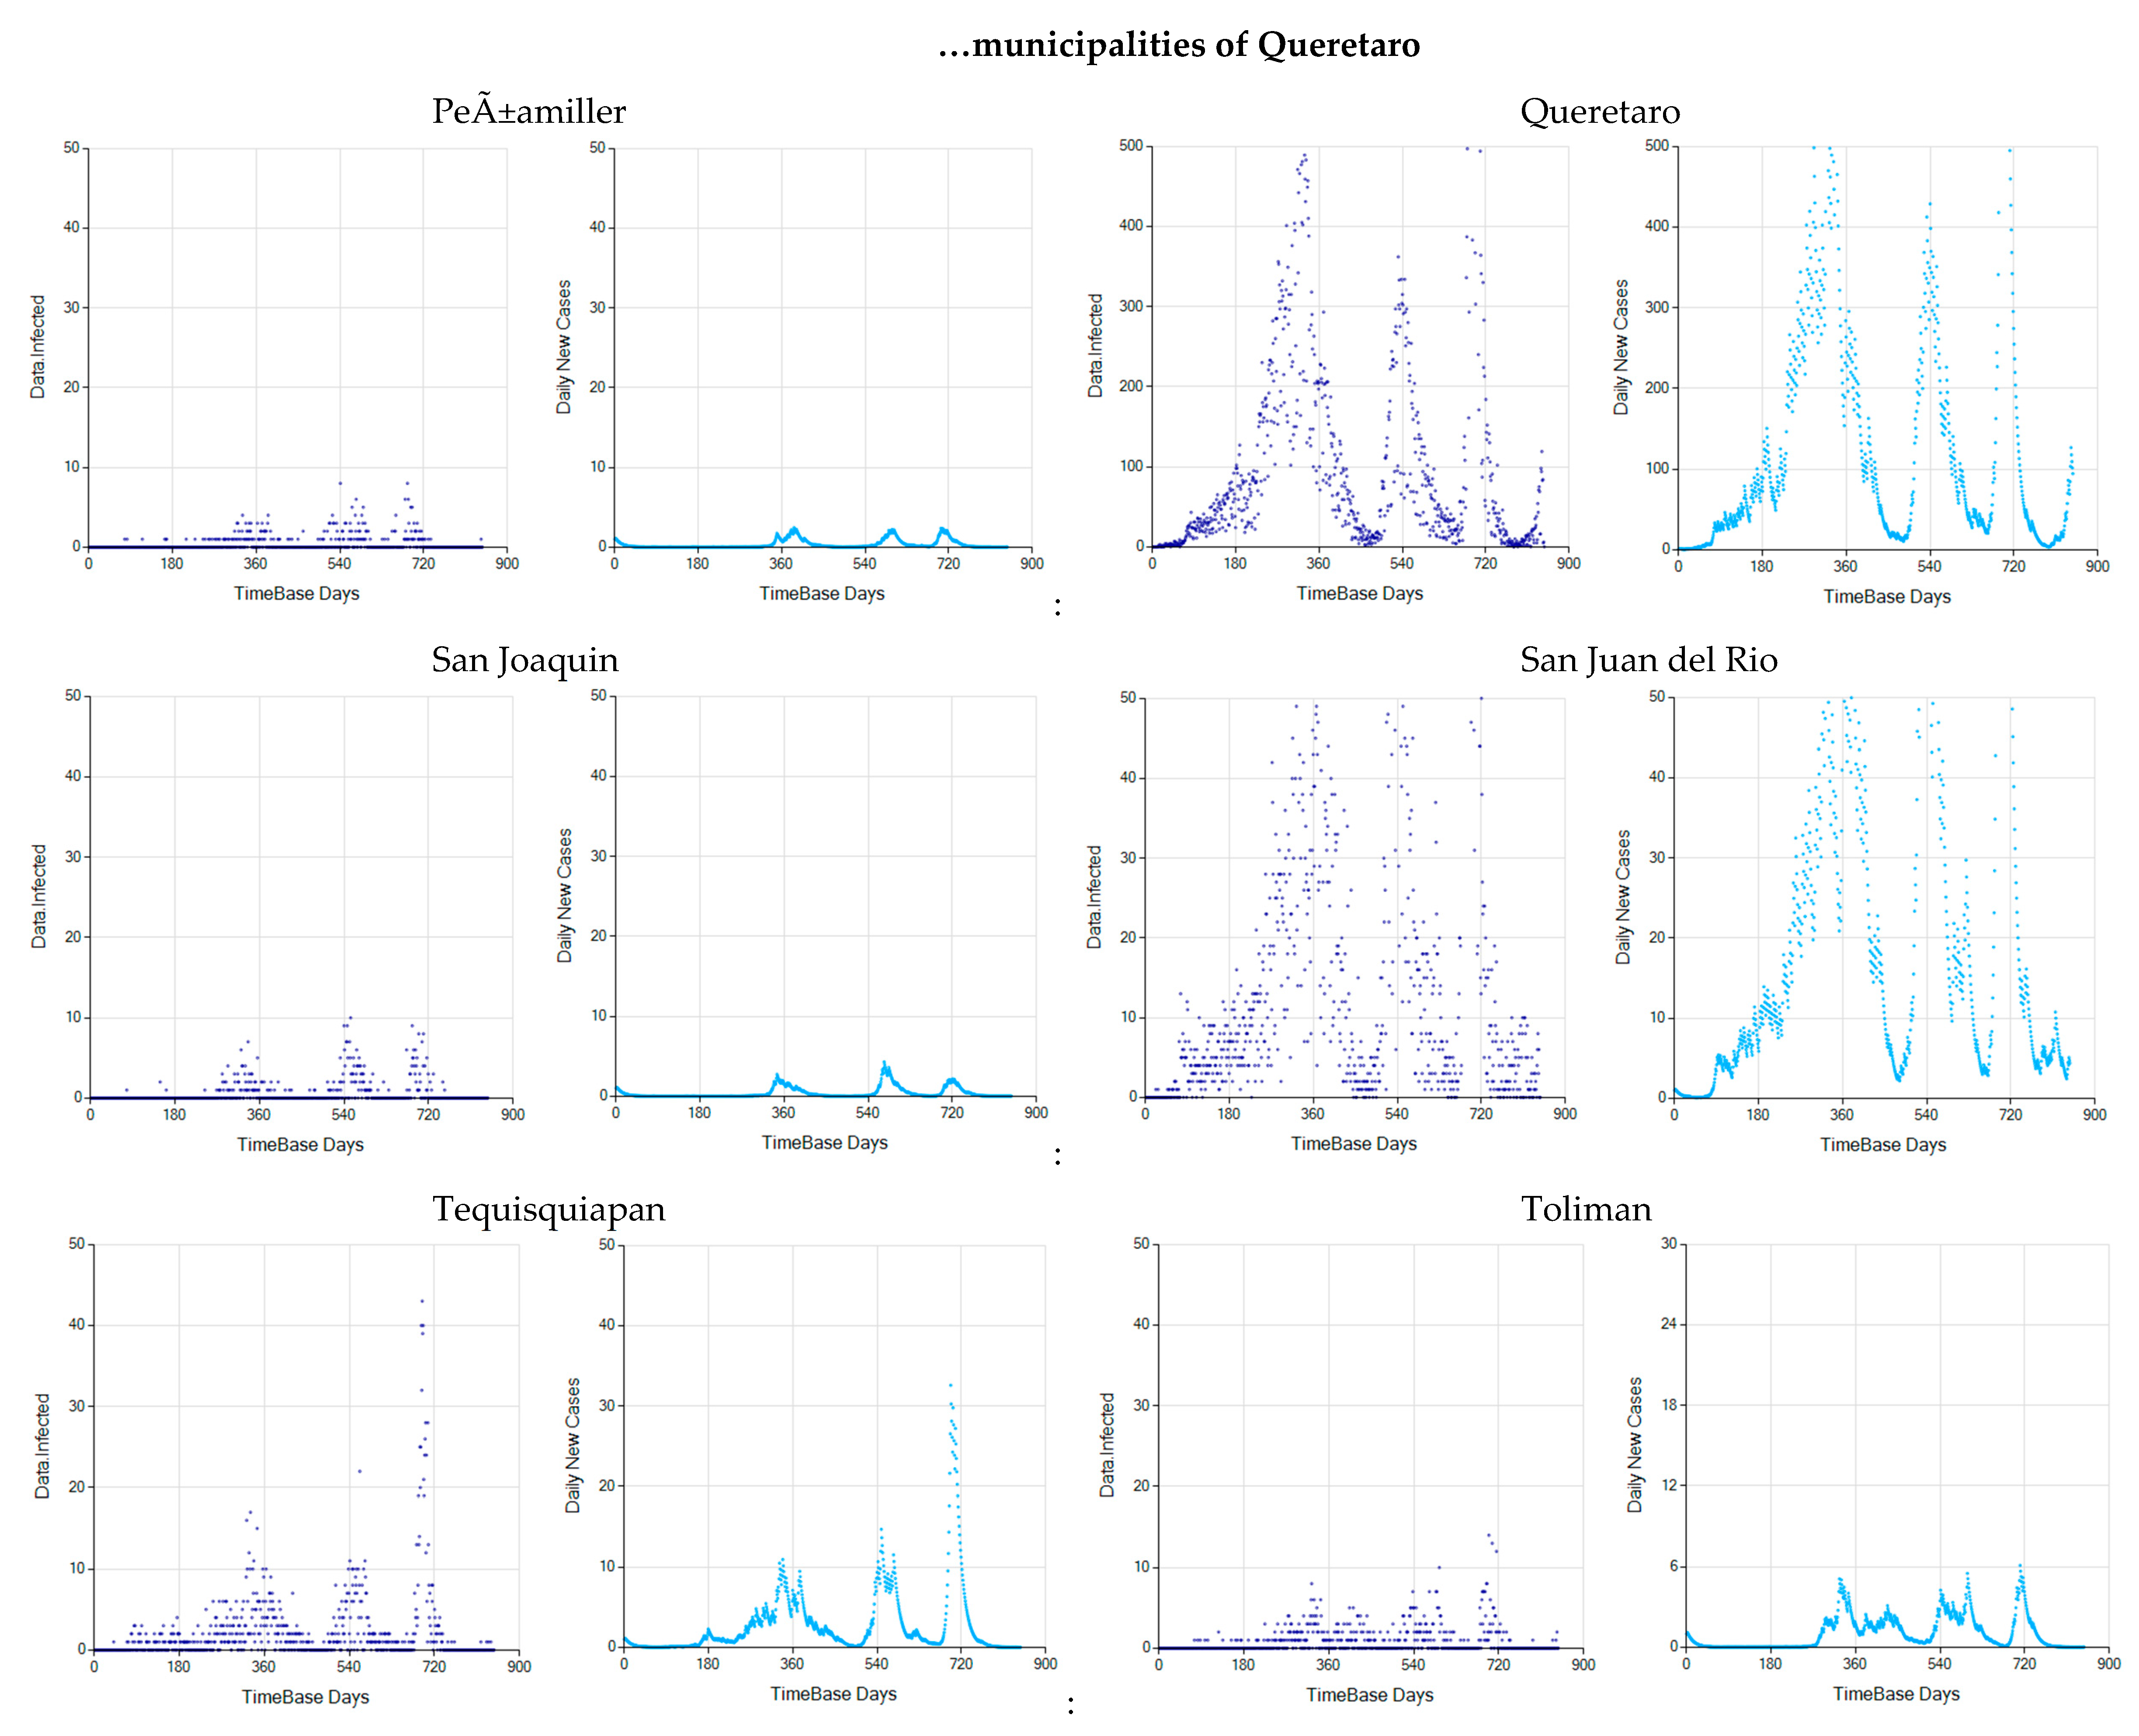
Appendix C. Graphs of Daily New Infected Individuals

Appendix D. Daily New Infected Model Computed at Different Scales


References
- Kermack, W.; McKendrick, A. Contributions to the mathematical theory of epidemics—I. Bull. Math. Biol. 1991, 53, 33–55. [Google Scholar] [CrossRef]
- Planas, D.; Veyer, D.; Baidaliuk, A.; Staropoli, I.; Guivel-Benhassine, F.; Rajah, M.M.; Planchais, C.; Porrot, F.; Robillard, N.; Puech, J.; et al. Reduced sensitivity of SARS-CoV-2 variant Delta to antibody neutralization. Nature 2021, 596, 276–280. [Google Scholar] [CrossRef] [PubMed]
- Sofonea, M.T.; Roquebert, B.; Foulongne, V.; Morquin, D.; Verdurme, L.; Trombert-Paolantoni, S.; Roussel, M.; Bonetti, J.-C.; Zerah, J.; Haim-Boukobza, S.; et al. Analyzing and Modeling the Spread of SARS-CoV-2 Omicron Lineages BA.1 and BA.2, France, September 2021–February 2022. Emerg. Infect. Dis. 2022, 28, 1355–1365. [Google Scholar] [CrossRef] [PubMed]
- Fourati, S.; Gautier, G.; Chovelon, M.; Soulier, A.; N’Debi, M.; Demontant, V.; Kennel, C.; Rodriguez, C.; Pawlotsky, J.-M. Persistent SARS-CoV-2 Alpha Variant Infection in Immunosuppressed Patient, France, February 2022. Emerg. Infect. Dis. 2022, 28, 1512–1515. [Google Scholar] [CrossRef]
- Pulliam, J.R.C.; van Schalkwyk, C.; Govender, N.; von Gottberg, A.; Cohen, C.; Groome, M.J.; Dushoff, J.; Mlisana, K.; Moultrie, H. Increased risk of SARS-CoV-2 reinfection associated with emergence of Omicron in South Africa. Science 2022, 376, eabn4947. [Google Scholar] [CrossRef]
- Silverman, R.A.; Ceci, A.; Cohen, A.; Helmick, M.; Short, E.; Bordwine, P.; Friedlander, M.J.; Finkielstein, C.V. Vaccine Effectiveness during Outbreak of COVID-19 Alpha (B.1.1.7) Variant in Men’s Correctional Facility, United States. Emerg. Infect. Dis. 2022, 28, 1313–1320. [Google Scholar] [CrossRef]
- Matsumura, Y.; Nagao, M.; Yamamoto, M.; Tsuchido, Y.; Noguchi, T.; Shinohara, K.; Yukawa, S.; Inoue, H.; Ikeda, T. Transmissibility of SARS-CoV-2 B.1.1.214 and Alpha Variants during 4 COVID-19 Waves, Kyoto, Japan, January 2020–June 2021. Emerg. Infect. Dis. 2022, 28, 1569. [Google Scholar] [CrossRef]
- Khateeb, D.; Gabrieli, T.; Sofer, B.; Hattar, A.; Cordela, S.; Chaouat, A.; Spivak, I.; Lejbkowicz, I.; Almog, R.; Mandelboim, M.; et al. SARS-CoV-2 variants with reduced infectivity and varied sensitivity to the BNT162b2 vaccine are developed during the course of infection. PLOS Pathog. 2022, 18, e1010242. [Google Scholar] [CrossRef]
- Menendez, J. Elementary Time Delay Dynamics of COVID-19 disease. medRxiv 2020. [Google Scholar] [CrossRef]
- Ebraheem, H.K.; Alkhateeb, N.; Badran, H.; Sultan, E. Delayed Dynamics of SIR Model for COVID-19. Open J. Model. Simul. 2021, 09, 146–158. [Google Scholar] [CrossRef]
- Hale, T.; Angrist, N.; Hale, A.J.; Kira, B.; Majumdar, S.; Petherick, A.; Phillips, T.; Sridhar, D.; Thompson, R.N.; Webster, S.; et al. Government responses and COVID-19 deaths: Global evidence across multiple pandemic waves. PLoS ONE 2021, 16, e0253116. [Google Scholar] [CrossRef] [PubMed]
- University of Oxford. OXFORD COVID-19 Government Response Stringency Index. Available online: https://data.humdata.org/dataset/oxford-covid-19-government-response-tracker (accessed on 30 May 2022).
- Rypdal, K.; Bianchi, F.M.; Rypdal, M. Intervention Fatigue is the Primary Cause of Strong Secondary Waves in the COVID-19 Pandemic. Int. J. Environ. Res. Public Health 2020, 17, 9592. [Google Scholar] [CrossRef] [PubMed]
- Rypdal, K. The Tipping Effect of Delayed Interventions on the Evolution of COVID-19 Incidence. Int. J. Environ. Res. Public Health 2021, 18, 4484. [Google Scholar] [CrossRef]
- Febres, G.L. Assessing the Impact of Social Activity Permissiveness on the COVID-19 Infection Curve of Several Countries. arXiv 2021, arXiv:2106.04085v2. [Google Scholar]
- Kiselev Ilya, R.; Kolpakov, F.I.A. A Delay Differential Equation approach to model the COVID-19 pandemic. medRxiv 2021. [Google Scholar] [CrossRef]
- HDX. Center for Humanitarian Data. Available online: https://data.humdata.org/dataset/novel-coronavirus-2019-ncov-cases (accessed on 1 July 2022).
- Lux, T.M.; Marchesi, M. Scaling and criticality in a stochastic multi-agent model of a financial market. Nature 1999, 397, 498–500. [Google Scholar] [CrossRef]
- Borland, L. Exploring the dynamics of financial markets: From stock prices to strategy returns. Chaos Solitons Fractals 2016, 88, 59–74. [Google Scholar] [CrossRef]
- Total COVID-19 Tests. Comparisons across Countries are Affected by Differences in Testing Policies and Reporting Methods. Available online: https://ourworldindata.org/grapher/full-list-total-tests-for-covid-19 (accessed on 30 May 2022).
- COVID-19 Dashboard by the Center for Systems Science and Engineering (CSSE) at Johns Hopkins University (JHU). Available online: https://coronavirus.jhu.edu/map.html (accessed on 30 May 2022).
- Febres, G.L. Dynamic Adjustment of SIR Model with the Social Permissiveness: An Actual Measure of the Infection Rate. arXiv 2021, arXiv:2106.04085. [Google Scholar]
- COVID-19 México. Available online: https://datos.covid-19.conacyt.mx/#DOView (accessed on 30 May 2022).
- Febres, G.L. Basis to Develop a Platform for Multiple-Scale Complex Systems Modeling and Visualization: MoNet. arXiv 2017, arXiv:1701.04064. [Google Scholar]
- Bukhari, Q.; Jameel, Y.; Massaro, J.M.; D’Agostino, R.B.; Khan, S. Periodic Oscillations in Daily Reported Infections and Deaths for Coronavirus Disease 2019. JAMA Netw. Open 2020, 3, e2017521. [Google Scholar] [CrossRef]
- Pavlíček, T.; Rehak, P.; Král, P. Oscillatory Dynamics in Infectivity and Death Rates of COVID-19. mSystems 2020, 5, e00700-20. [Google Scholar] [CrossRef] [PubMed]
- Bergman, A.; Sella, Y.; Agre, P.; Casadevall, A. Oscillations in U.S. COVID-19 Incidence and Mortality Data Reflect Diagnostic and Reporting Factors. mSystems 2020, 5, e00544-20. [Google Scholar] [CrossRef] [PubMed]




Publisher’s Note: MDPI stays neutral with regard to jurisdictional claims in published maps and institutional affiliations. |
© 2022 by the authors. Licensee MDPI, Basel, Switzerland. This article is an open access article distributed under the terms and conditions of the Creative Commons Attribution (CC BY) license (https://creativecommons.org/licenses/by/4.0/).
Share and Cite
Febres, G.L.; Gershenson, C. A Deterministic–Statistical Hybrid Forecast Model: The Future of the COVID-19 Contagious Process in Several Regions of Mexico. Systems 2022, 10, 138. https://doi.org/10.3390/systems10050138
Febres GL, Gershenson C. A Deterministic–Statistical Hybrid Forecast Model: The Future of the COVID-19 Contagious Process in Several Regions of Mexico. Systems. 2022; 10(5):138. https://doi.org/10.3390/systems10050138
Chicago/Turabian StyleFebres, Gerardo L., and Carlos Gershenson. 2022. "A Deterministic–Statistical Hybrid Forecast Model: The Future of the COVID-19 Contagious Process in Several Regions of Mexico" Systems 10, no. 5: 138. https://doi.org/10.3390/systems10050138
APA StyleFebres, G. L., & Gershenson, C. (2022). A Deterministic–Statistical Hybrid Forecast Model: The Future of the COVID-19 Contagious Process in Several Regions of Mexico. Systems, 10(5), 138. https://doi.org/10.3390/systems10050138


