Article

Investment Suitability Assessment Based on B&R Symbiotic System Theory: Location Choice of China’s OFDI

School of Business, Hunan University of Science and Technology, Xiangtan 411201, China
*
Author to whom correspondence should be addressed.
Systems 2022, 10(6), 195; https://doi.org/10.3390/systems10060195
Submission received: 3 September 2022 / Revised: 17 October 2022 / Accepted: 20 October 2022 / Published: 22 October 2022
(This article belongs to the Section Systems Practice in Social Science)

Abstract

:
Achieving mutualistic symbiosis is the core concept of China’s promotion of the Belt and Road Initiative (BRI). Therefore, how to guide China’s OFDI location decision-making in the Belt and Road (B&R) countries from the perspective of mutualistic symbiosis is of great significance. This paper constructs the B&R symbiotic system based on symbiotic system theory, to establish the investment suitability index from three dimensions: stability, coordination, and sustainability, then uses the entropy weight, TOPSIS, and GIS method to assess and analyze the investment suitability index of 60 major countries in B&R’s six economic corridors. The findings indicate that Russia, India, Indonesia, Thailand, Singapore, Vietnam, and Malaysia have the highest investment suitability and are China’s most favorable OFDI destinations for achieving mutualistic symbiosis. Conversely, Syria, Lebanon, Jordon, and Yemen have the lowest investment suitability. Based on these results, policymakers can formulate more scientific and reasonable policies to guide China’s OFDI to make location decisions in B&R countries with high investment suitability, so as to promote the high-quality and sustainable development of B&R construction. However, due to data acquisition and technical reasons, this study does not analyze investment suitability from time trends. The analysis of investment suitability from more B&R countries or different types of industries is an important direction for further research in the future.

1. Introduction

1.1. Background

After the global financial crisis, the world economy has entered into a long and increasingly serious downturn, and the backlash of anti-globalization populism has hit the global economy and trade [1,2]. In this context, the Chinese government has actively explored new ways of trade cooperation and expanded the space for international development. In 2013, China’s president, Xi Jinping, proposed the Belt and Road Initiative (BRI), which established a network of various investments in infrastructure, energy, and mining to link China with Eurasian countries [3,4]. As an important international public good, the BRI not only helps to promote China’s outward foreign direct investment (OFDI), but also helps to promote international cooperation and development, provides a blueprint of a strong integration of China into the world economy, and represents the commitment of the Chinese government to a more open economy [5]. In recent years, the China’s OFDI has increased at a rapid pace, according to China’s Belt and Road Trade and Investment Development Report, world investment activity in 2020 shrank by nearly 25% year-on-year, while China’s direct investment flow to Belt and Road (B&R) countries was USD 22.54 billion, a year-on-year increase of 20.6%. The status of B&R countries in China’s OFDI pattern has steadily increased, especially in the context of the COVID-19 pandemic, anti-globalization, and frequent rise of protectionism; the contrarian growth data fully demonstrates the strong vitality of the BRI and the huge potential of China’s cooperation with B&R countries.
According to the official document published by the Chinese Government in 2015, “Vision and Actions on Jointly Building Silk Road Economic Belt and 21st Century Maritime Silk Road,” the core concept of BRI is the mutualistic symbiosis [6]. The BRI aims to build a community with a shared future for mankind with complementary advantages, win-win cooperation, and common development [7]. Fundamentally, mutualistic symbiosis is already an objective requirement of the Chinese government to promote high-quality and sustainable development of the BRI; to implement the win-win of BRI well, symbiotic cooperation is essential. Therefore, as an important part of the B&R construction, China’s OFDI in B&R countries needs to fully consider the mutualistic symbiosis relationship between China and B&R countries when making decisions on location choice. However, since the traditional foreign direct investment theory does not have enough explanatory power for this, the high-quality construction of the B&R needs to find new theoretical support. Additionally, at present, few empirical studies have attempted to investigate investment suitability from the perspective of mutualistic symbiosis to make reasonable location choices. As a result, studying the location choice of China’s OFDI in B&R countries from the perspective of mutualistic symbiosis is an important practical problem that needs to be solved urgently to build a community with a shared future for mankind and promote the high-quality development of the BRI.

1.2. Literature Review

1.2.1. Research on China’s OFDI Location Choice in B&R Countries

With the continuous advancement of the BRI, academic circles have conducted extensive discussions on issues related to investment between China and B&R countries [3,6,8], and the location choice has been a hot issue for numerous scholars [4,9,10,11,12,13,14,15,16,17,18,19,20,21,22,23]. At present, the research on the location choice of China’s OFDI in B&R countries can be roughly divided into two aspects.
The first aspect is the research on the influencing factors of China’s OFDI location choice in B&R countries. Previous literature believes that the host country’s economic level [11], technological level [21], environmental regulation [10,12,13,14], resource endowment [17,18,19,20], government policy [9], and political system [14,17,22] are key factors that affect China’s OFDI location choice in B&R countries. For example, Pan et al. found that the favorable institutional environment and strong market demand of host countries have a positive influence on China’s OFDI [14]. Liu et al. confirmed that Chinese firms tended to invest in green projects when the host countries had better political environments, natural resource endowments, and higher energy efficiencies, but lower carbon dioxide intensities, less developed energy structures, technologies, and infrastructures [17]. Bashir et al. extended the research into OFDI from emerging economies by integrating a locational advantage perspective- and institution-based view to empirically analyze the interactive effect of resource endowment in a host economy and how institutional regulations impact the location choice of investors from emerging economies [23]. In addition, the research showed that the agglomeration effect can affect the location choice of China’s OFDI in B&R countries. Firms were found to follow China’s other firms and invest in host countries where China’s previous OFDI was concentrated, and were found to avoid countries that had large non-Chinese investment in general [4].
The second aspect is the research on China’s OFDI location choice in B&R countries with risk assessment. As China’s OFDI spans across countries and regions featuring a diverse range of religions, cultures, economies, and legal systems, this diversity will more likely bear high and unexpected investment risks for Chinese enterprises, such as political, economic, environmental, financial, and social risks [12,14,15,16]. Some scholars have studied and assessed the risk of China’s OFDI in detail for various risk categories and industries. Sun et al. found a strong positive correlation between political risk and China’s total investments. They confirmed that it would be necessary for China to invest in B&R countries with low or even negligible political risks [15]. Duan et al. have put forward a fuzzy integrated evaluation model for energy investment risk based on entropy weight, conducting an integrated assessment of the energy investment risk of B&R countries. The study found that Pakistan, Kazakhstan, and Russia are the most ideal choices for China’s energy investment balancing resource potential and investment environment [16]. To reasonably assess overseas investment risk of coal-fired power plants in B&R countries, Yuan et al. established an evaluation criteria system with eight dimensions which consists of a total of 39 criteria; the findings indicated that among these evaluated nations, Singapore has the lowest risk for China’s coal-fired power plants investment, followed by New Zealand and Thailand [24]. Wu et al. constructed an evaluation system based on the ANP framework covering 32 risk factors including technical, political, economic, resource, social, and environmental risks. The study found that political risk, economic risk, and resources risk have the greatest impact on the location choice of renewable energy [25]. Hashemizadeh et al. used the TODIM method to identify investment risk factors for renewable energy in B&R countries and classified them into five categories: economic, technological, environmental, social, and political [26].

1.2.2. Application of Symbiosis in Cooperation between China and B&R Countries

The concept of “symbiosis” originated from the field of ecological microorganisms, which was used to describe the living state of populations. It was first proposed by the German mycologist Anton de Bary in 1879. Symbiosis refers to different species living together, which is an extended physical connection between one or more members of different species [27,28]. Symbiosis is a cooperative behavior adopted by organisms in nature to improve the survival probability. It is a relatively common ecological phenomenon and an important way of biological evolution. Symbiosis not only exists in the biological world, but also widely exists in the human social system [29]. With the development of symbiosis theory, the study of symbiosis has been extended to ecological, social, and economic fields. Some scholars have tried to explore the law of economic development from biological phenomena, used symbiotic ideas and theories to guide economic work, and used symbiotic methods to solve economic problems, and have achieved good results [30,31].
Over the past few years, some scholars have used the new research perspective, method, and framework of symbiosis theory to explore the issues of cooperation between China and B&R countries. The symbiosis theory in population ecology is to describe the extended material connection between one or more members of different species, and it is highly adaptable to solve the problem of cooperation in the construction of B&R in Northeast Asia [32]. Yu and Luo treated B&R countries as multiple distinct biological groups, using the symbiosis theory to study the energy cooperation of the BRI [33]. Zhang and Liang pointed out that the complementarity of B&R countries in the industrial chain is the basic premise of production capacity cooperation, and different countries use their respective advantages in technology, capital, resources, and other aspects to carry out cooperation, so as to form a mutually beneficial and win-win symbiotic relationship [34]. In summary, the symbiosis theory has a good application and adaptability in cooperation fields such as production capacity, energy, region, and politics, and can be used as a new research perspective and framework to analyze international cooperation issues systematically and comprehensively.

1.3. Objectives and Contributions

By reviewing the previous literature, we noticed that the academic community has conducted extensive research on the location choice of China’s OFDI in B&R countries, and a small number of scholars have begun to use the symbiosis theory to analyze the issues related to B&R regional cooperation from different perspectives. However, the previous literature lacks research on applying the symbiosis theory to analyze the investment location choice of B&R countries. Therefore, in the context of promoting the high-quality development of the BRI and building a community with a shared future for mankind, the previous literature has obvious limitations. It is worth mentioning that the theoretical analysis framework of the symbiotic system can make up for the deficiencies of the existing research to a certain extent. The symbiosis theory believes that a symbiotic relationship and a symbiotic environment can effectively reflect influencing factors other than the symbiotic units, making it possible to take the bilateral relations between China and B&R countries into comprehensive consideration. Overall, how to analyze the location choice of investment from the perspective of symbiosis is an important practical problem that needs to be solved urgently to promote the high-quality and sustainable development of the BRI.
For the reasons above, this paper highlights the use of symbiotic systems theory as a theoretical framework in China’s OFDI location choice for B&R countries. The main objectives of this research are as follows: First, establishing an investment suitability assessment framework based on three elements of the symbiotic system, namely the symbiotic units, the symbiotic relationship, and the symbiotic environment. Second, using the entropy method and TOPSIS to comprehensively evaluate the investment suitability of the B&R countries to obtain more accurate and reliable results. Finally, combining the assessment results and GIS map to make effective suggestions for investment location choice. The results of this study can be used to make effective policies. The main contributions of this paper are as follows.
First, this study provides a new insight into the location choice of China’s OFDI in B&R countries from the perspective of mutualistic symbiosis. Mutualistic symbiosis of BRI is important for our increased understanding of China’s OFDI in B&R countries. How to guide China’s OFDI with mutual benefit and symbiosis as the core is the key content of China’s promotion of complementary advantages and win-win cooperation in B&R construction. Therefore, this paper not only provides an empirical basis for Chinese policymakers to formulate mutual-benefit and win-win guiding policies for investment between China and B&R countries, but also further expands the interpretation and application of the location choice theory of international investment under the conditions of mutualistic symbiosis.
Second, this is the first study to establish an investment suitability assessment framework based on the symbiotic system. Few pieces of previous literature have studied the location choice of foreign investment from the perspective of mutualistic symbiosis, and most of the current research is on the investment risk assessment of the host country’s political, economic, environment, and other aspects [12,15,16,24,26,35]. This study emphasizes the consideration of the symbiotic relationship between the host country and the home country in the investment suitability evaluation system, which makes up for the lack of consideration in previous studies.
Third, this study should make an important contribution to the field of international foreign investment, international industrial cooperation, etc. This paper constructs an analytical framework for cooperation between China and B&R countries by establishing the B&R symbiotic system, and establishes an investment suitability assessment system on this basis. The investment suitability index assessment framework can not only be applied to the research on investment location decision-making between China and the B&R countries, but also can be extended to the research on investment location choice between other countries or regions. In addition, the B&R symbiotic system analytical framework for international cooperation can also be used to guide energy cooperation and production cooperation of BRI countries.
The remainder of this paper is organized as follows: Section 2 constructs the B&R symbiotic system, proposes the concept of investment suitability, and describes the assessment framework. Section 3 introduces materials and methods. Section 4 provides the results and discussion. Section 5 provides the conclusions and implications.

2. Theoretical Framework

2.1. Construction of B&R Symbiotic System

Generally speaking, a symbiotic system refers to the relationship between symbiotic units in a certain symbiotic environment according to a certain symbiotic pattern, that is, the three elements of symbiosis include symbiotic units, the symbiotic relationship, and the symbiotic environment [36]. A symbiotic system as a theoretical tool to study the interaction and interdependence of individuals to achieve system evolution and optimization, emphasizes that system evolution should follow the basic principles of complementary advantages, resource sharing, and mutual benefit and win-win, to attain a continuous and mutually beneficial state of symbiosis. It has important reference significance for China’s OFDI in B&R countries. Therefore, within the analysis framework of a symbiotic system, China’s OFDI in B&R countries can be regarded as a symbiotic system composed of symbiotic units, symbiotic relationships, and a symbiotic environment through symbiotic interfaces [6,36]: this study calls it the B&R symbiotic system. We will further explain the three elements of B&R symbiotic system.
Symbiotic units refer to the basic energy production and exchange units that constitute a symbiotic system, which is the basic material condition for the formation of the symbiotic system. For example, in the symbiotic system of fungi and plants, plants (eukaryotic plants and prokaryotic cyanobacteria) and fungi (bacteria and fungi) are symbiotic units; in a family symbiotic system, each family member is a symbiotic unit, while in a community symbiotic system, the family becomes the symbiotic unit. In a corporate symbiotic system, every corporate employee is a symbiotic unit, and in the overall enterprise system, employees, equipment, capital, etc., are symbiotic units. Therefore, the symbiotic units in the B&R symbiotic system refer to China and all other countries along B&R.
A symbiotic relationship refers to the mode in which symbiotic units interact or combine with each other. It not only reflects the pattern of interaction between symbiotic units, but also reflects the intensity of the interaction and reflects the material information and energy exchange relationship between symbiotic units. In terms of behavior, a symbiotic relationship includes parasitic relationships, favorable symbiotic relationships, and mutual benefit symbiotic relationships. In terms of organization, there are various states such as point symbiosis, intermittent symbiosis, continuous symbiosis, and integrated symbiosis. In the B&R symbiotic system, symbiotic relationships can be divided into technical relations, industrial relations, cultural relations, political relations, and market relations in terms of specific manifestations.
A symbiotic environment refers to the exogenous conditions for the existence and development of a symbiotic relationship; that is, the sum of all factors other than the symbiotic unit. For example, fungi that coexist with plants have a soil environment or a water environment, plants have an atmospheric environment and other environments composed of animals and plants, family symbiotes correspond to social environments, and enterprise symbiotes correspond to market environments and social environments. Symbiotic relationships often exist in multiple environments, and the impact of different types of environments on symbiotic relationships is also different. Therefore, the symbiotic environment in the B&R symbiotic system refers to a socio-economic-natural composite system [37].

2.2. Theoretical Connotation of Investment Suitability

The concept of suitability is widely used in habitat [38,39], land-use [40,41], environment [42,43], climate [44], and other fields. Broadly defined, suitability analysis aims at identifying the most appropriate spatial pattern for future uses according to specific requirements, preferences, or predictors of some activity. In this study, investment suitability refers to a comprehensive reflection of the host country’s ability to attract foreign investment, and it also reflects the symbiotic relationship with the home country of mutual cooperation, mutual coordination, and mutual promotion. The stronger the investment suitability, the stronger the coordination and complementation between the symbiotic units, the greater the symbiotic effect, and the more symbiotic energy generated, and vice versa. As a result, the strength of investment suitability is consistent with the size of the symbiotic effect. Accordingly, in the context of promoting the high-quality development of the BRI, the strength of investment suitability is an important reference for China to choose the OFDI location in B&R countries.
According to the theory of symbiotic system evolution, the essence of the B&R symbiotic system is to generate symbiotic energy, and the goal of evolution is to achieve a symmetrical and mutually beneficial equilibrium. Further explanation is that in a certain regional space, by optimizing the allocation of resource elements and improving the efficiency of the flow and transformation of production factors, it is possible to achieve the coordination of the three and produce better economic, social, and environmental benefits, forming a “ 1 + 1 + 1 > 3 ” effect and thus promoting the high-quality and sustainable development of B&R regional cooperation. Consequently, within the framework of B&R symbiotic system theoretical analysis, the essence of investment suitability is the amount of symbiotic energy generated, which is a necessary condition for the existence and evolution of a symbiotic system, reflecting the system’s ability to survive and add value. The symbiotic energy is determined by a variety of factors, and its relationship can be expressed as:
E e = f e u , r , e
In Equation (1) above, E e , u , r , and e represent symbiotic energy, symbiotic unit, symbiotic relationship, and symbiotic environment. The existence of the symbiotic energy function reflects the essence of the interaction between the symbiotic units, which makes the symbiotic system produce a new energy based on the division of labor and complementation of the symbiotic interface. According to the symbiotic energy formula, the factors that affect the investment suitability mainly include three aspects: firstly, the symbiotic unit, which is the material basis for the symbiotic system to generate symbiotic energy, and determines the upper limit of the symbiotic energy increase; secondly, the symbiotic relationship, which is the internal driving force for the symbiotic system to generate symbiotic energy, which can affect the amount and speed of the symbiotic energy increase; and thirdly, the symbiotic environment, which is the external driving force for the symbiotic system to generate symbiotic energy, and is an important exogenous variable for the symbiotic system to operate in a healthy manner and to continuously generate symbiotic energy.

2.3. Assessment Framework for Suitability Index

To facilitate the analysis, this paper defines the investment suitability index to measure the amount of symbiotic energy generated by China’s OFDI in the host country. According to the symbiotic energy formula in Equation (1), the assessment of the symbiotic suitability index needs to consider three dimensions: symbiotic unit, symbiotic relationship, and symbiotic environment, which represent stability, coordination, and sustainability. This paper defines the three dimensions as the stability index, coordination index, and sustainability index, respectively. The specific indicators used for evaluating investment suitability are presented in Table 1.

2.3.1. Stability Index

The stability index reflects the suitability of the symbiotic unit, and measures the quantity, quality, structure, and other attributes of the host country’s internal infrastructure, resources, and labor. This paper considers the following three dimensions: infrastructure level, resource potential, and workforce level. A total of 14 stability indicators have been selected.
The infrastructure level of the host country is an important factor influencing the location choice of OFDI. Multinational enterprises prefer locations where infrastructure is available and developed [45]. The infrastructure level is a set of properties and characteristics of the local infrastructure. This paper measures the infrastructure performance of the host country from four aspects: transportation, communication, internet, and electricity.
The natural resource potential of a host country is an essential aspect to consider when determining the value of the investment, B&R countries’ resource potential, and in particular, the fact that their renewable resources serve to enhance their investment potential [35]. One of the main purposes of China’s OFDI in B&R countries is to seek natural resources, so assessing the investment suitability needs to consider the resource potential of the host country. This study included five indicators to assess the inherent resource potential, including forest area, agricultural land, fuel exports, renewable energy consumption, and total renewable inland freshwater resources.
Workforce level is an important factor influencing investment decisions [46,47]. For example, labor-intensive manufacturing investment focuses on labor scale and labor costs in the host country, while technology-intensive manufacturing investment focuses on the education level of labor and the number of R&D researchers. In this study, assessing workforce level involves the following indicators: total labor force, labor force with basic education, R&D researchers, and total wage earners.

2.3.2. Coordination Index

The coordination index reflects the adaptability of the symbiotic relationship and measures the bilateral relationship between the host country and the home country, including the interaction and cooperation in industry, technology, market, culture, and politics.
Industrial relations are mainly manifested in two aspects: industrial complementarity and industrial cooperation [6]. The international division of labor needs to rely on large-scale intermediate goods trade to achieve the optimal allocation of production factors. This paper uses the total trade volume in intermediate goods as a measure of industrial complementarity. In addition, overseas cooperation parks are an important platform for promoting industrial cooperation, so this paper also uses the number of overseas industrial cooperation parks as a measure of industrial cooperation.
Technology complementarity and scientific research cooperation are the concrete manifestations of technology relations [6]. This paper uses bilateral high-tech products’ import and export trade volumes and the number of co-authored papers as the measurement indicators of technology complementarity and scientific research cooperation, respectively.
Market relationships between the host country and the home country are mainly reflected in market sharing and trade dependence [6]. The total volume of import and export trade and the total trade volume as a percentage of global trade can effectively reflect the level of bilateral market sharing and trade dependence. The larger the number, the closer the market relationship between the two countries; correspondingly, the greater the coordination.
Cultural relationships are an important factor affecting China’s OFDI in B&R countries [48,49]. Cultural exchanges not only increase the host country’s recognition of the corporate culture of the home country, but also promote the behavior of multinational enterprises to conform to the cultural characteristics of the host country, thereby alleviating the adverse impact of international investment protection caused by cultural differences on multinational enterprises. This paper uses the number of Confucius institutes and the number of international students in China as indicators of cultural relations between China and B&R countries.
A good political relationship between the host country and the home country can effectively reduce investment risks [50]. A frequent exchange of visits by heads of government is an important signal of good relations between the two countries, which will help drive the investment of enterprises in the home country and promote the improvement of the success rate of investments. In addition, the signing of international sister cities is conducive to promoting economic cooperation between sister cities, increasing the information symmetry and trust between the two parties, and reducing the risk of bilateral investment and the contract cost of cross-border investment. This paper uses the number of visits by heads of government and the number of sister cities to measure the political relationship between the home country and the host country.

2.3.3. Sustainability Index

The sustainability index reflects the suitability of the symbiotic environment, and measures the degree of adaptation with the external environment and the effect of interaction.
The degree of development of the economic system is an important consideration for attracting foreign investment [51]. The strength of the economic system provides a long-term security and productive environment for foreign investment. If a country has a better economic system, then the overall risk of investment in that country is reduced. For instance, a country with a strong economy should guarantee a more reliable investment than a country with a weak economy. This paper uses GDP growth rate, per capital GDP, industrial value added, and inflows of foreign direct investment to measure the host country’s economic system.
The social system of the host country directly affects the overseas operation risks of multinational enterprises. A stable social system can provide a safe development environment for the operation of multinational enterprises, so that the assets of the enterprises will be protected from a turbulent political situation and war, as well as the impact of a volatile economy and destruction; these are the basic guarantees for the survival of multinational enterprises [14,52]. This study included five indicators to assess the social system, including total population, total public expenditure on education, government effectiveness, regulatory quality, and the control of corruption.
A stable environmental system of a host country can positively influence the foreign investment activities of Chinese enterprises [35]. However, biodiversity loss, greenhouse gas emissions, and air pollution require the attention of enterprises engaged in overseas investment projects. This paper considers the following environmental system indicators: species of mammals under threat, CO2 emissions, particulate emission damage, and PM2.5 air pollution.

3. Materials and Methods
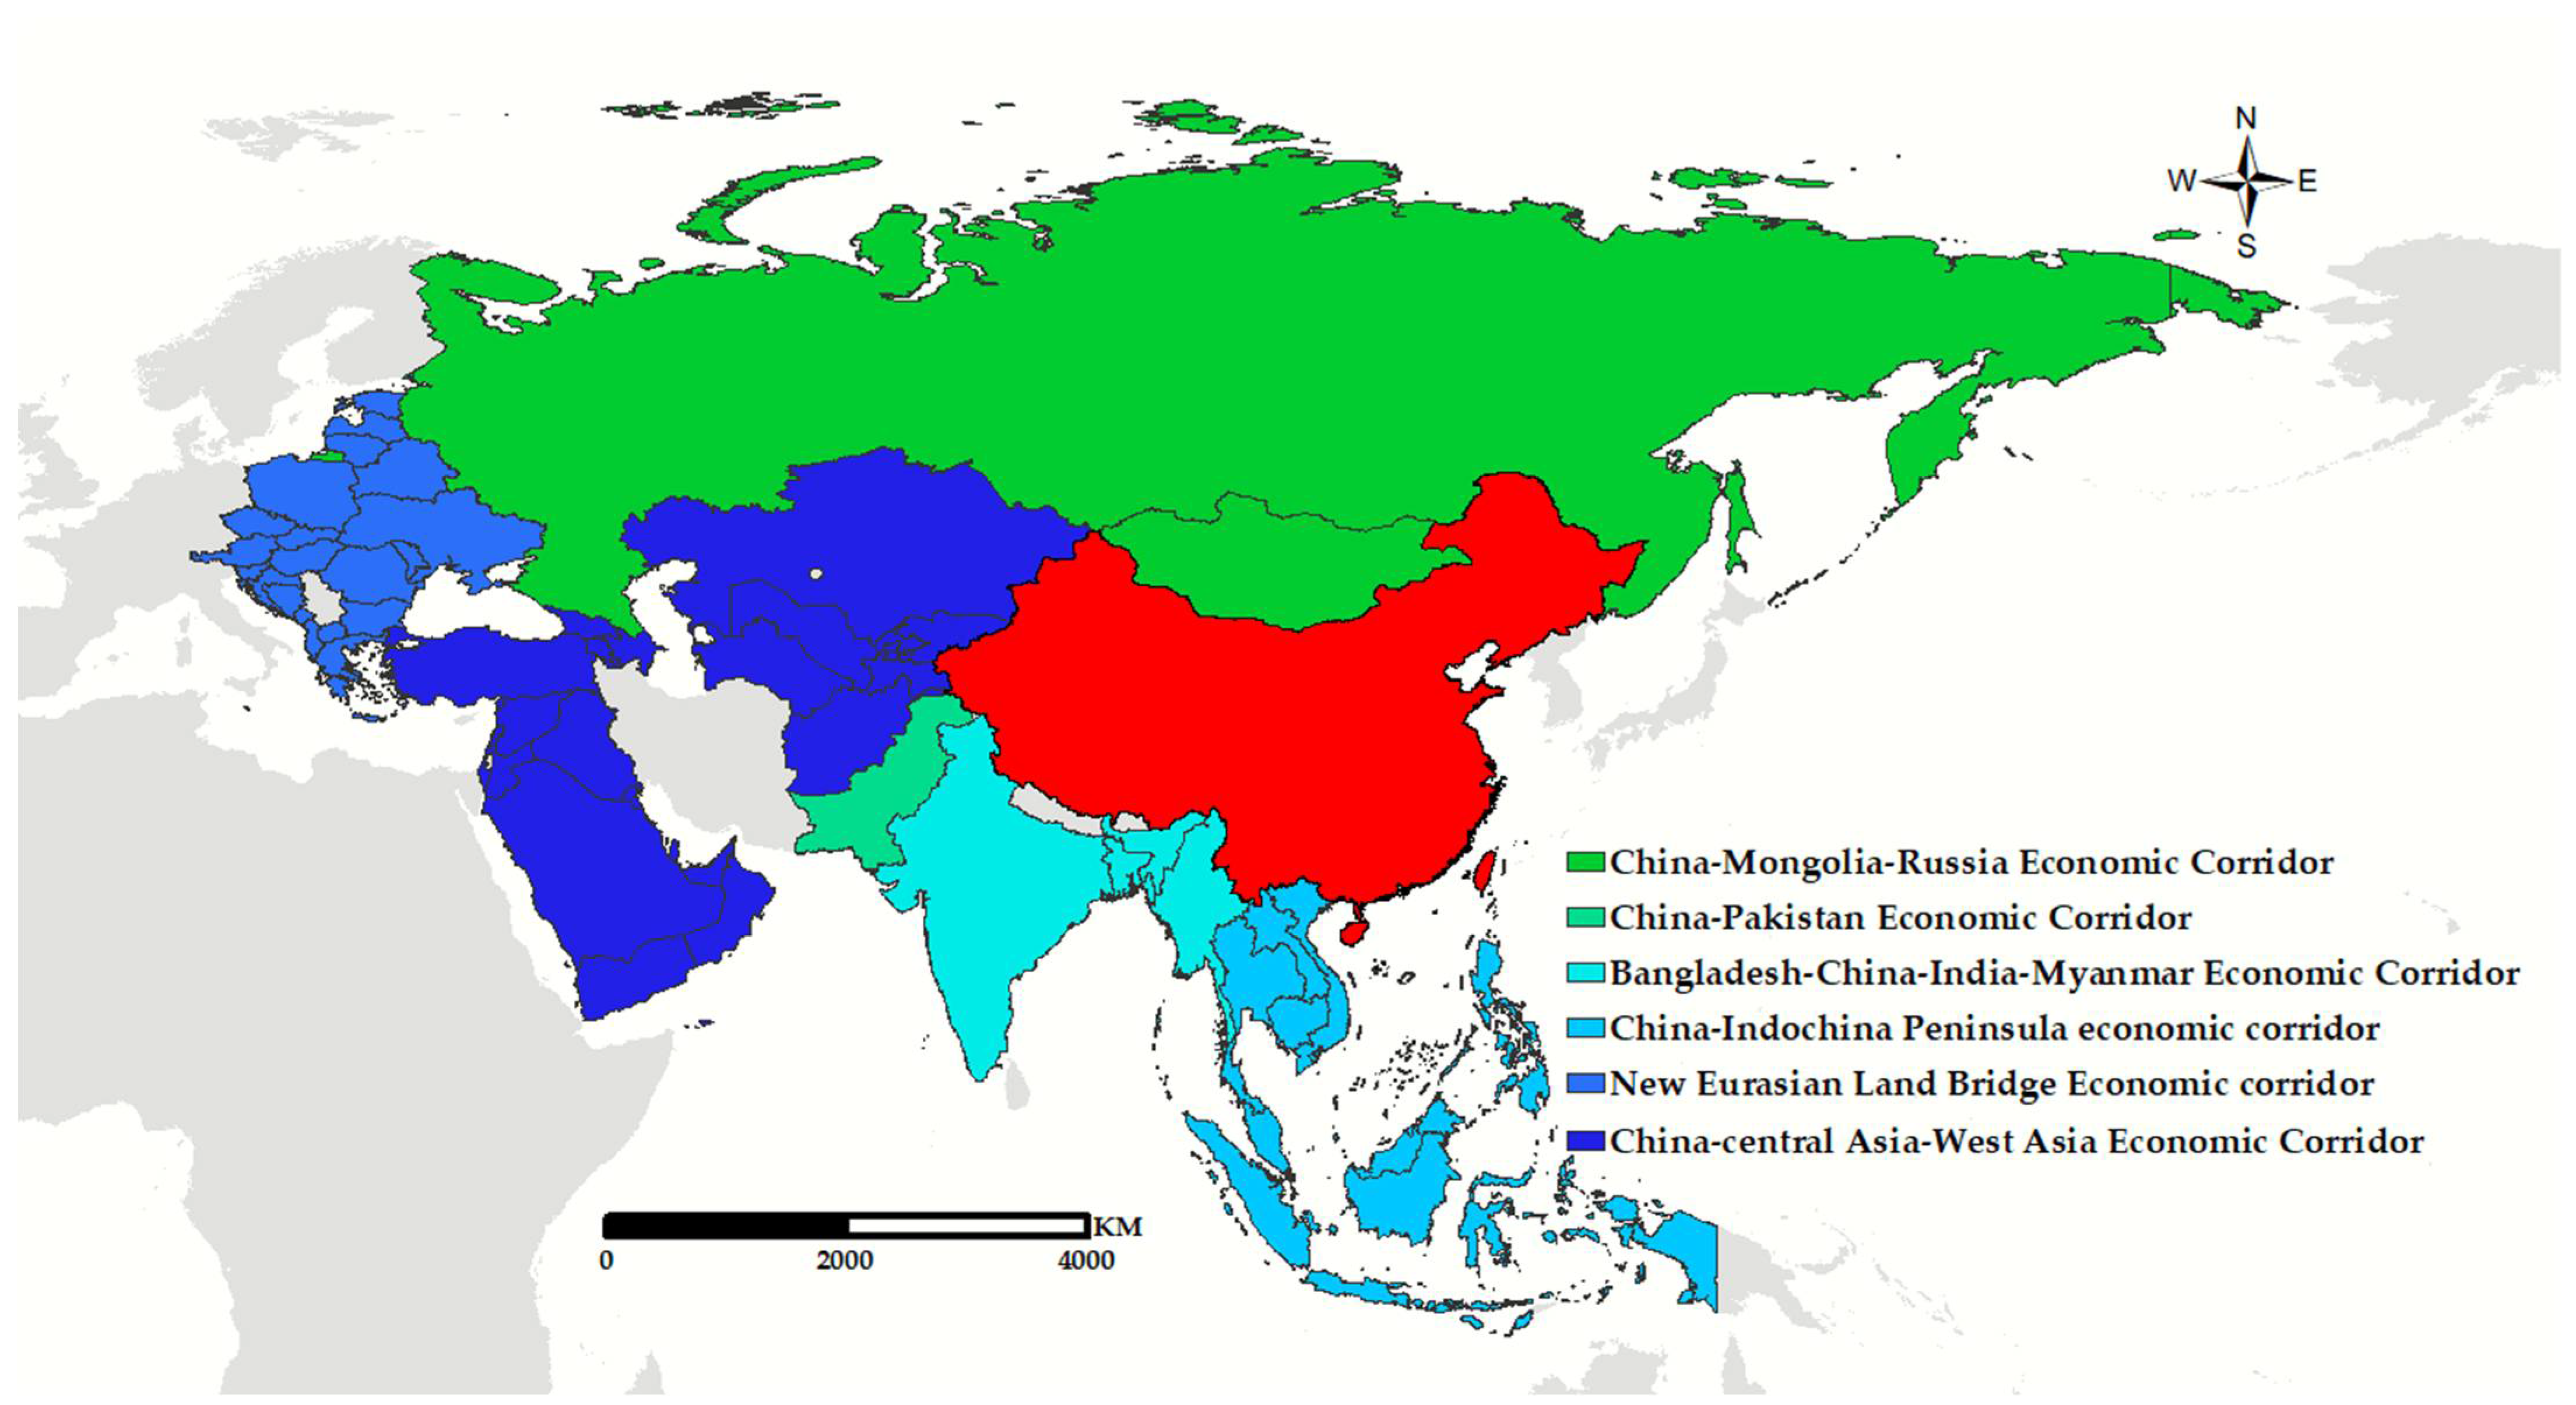
3.1. Study Area

As the strategic pillars of the BRI, the six major economic corridors make up the important framework of the regional economic cooperation network (Figure 1). Therefore, this paper takes 60 major countries in six major economic corridors as research objects (Table 2), to evaluate and analyze the investment suitability of B&R countries.

3.2. Data Sources

The data required for the study are mainly derived from 9 datasets, including WDI, UNCD, WGI, the official website of the Ministry of Commerce of China, the official website of the Ministry of Foreign Affairs of China, the China International Friendship Cities Federation, the Web of Science Core Collection, Confucius Institute Annual Development Report, and Concise Statistics of International Students in China. Upon checking the required indicators, some statistics are unavailable for individual countries. These data have been estimated from the average of the regions where they are located. Furthermore, to avoid the impact of COVID-19 on some indicators, we used pre-2020 data for our assessment, such as the number of visits by heads of government, GDP growth rate, inflows of foreign direct investment, etc. All the indicators used for the assessment of stability, coordination, sustainability data sources, and years are given in Table 1.

3.3. Assessment Analysis

After data acquisition, we standardized all indicators and estimated the indicator weights by using the entropy weight method. Finally, we applied the TOPSIS method to assess the performance scores and rank outcomes of each B&R country. The precise narratives of each aspect are developed in the subsequent sections.

3.3.1. Indicator Standardization

Generally, the orientation and the units of the indicators are not the same. The purpose of standardization is to avoid the influence of different criterion performance value ranges but retain the relative performance of the alternative among the group. Hence, to reliably solve the indicators, the following approach was adopted for data standardization.
If the x i j is the benefit indicator (larger values are considered more valuable), then the attribute value of the jth indicator in the ith alternative can be converted by Equation (2).
x i j = x i j min x 1 j , x 2 j , , x k j max x 1 j , x 2 j , , x k j min x 1 j , x 2 j , , x k j
If the x i j is the cost indicator (smaller values are considered more valuable), then the attribute value of the jth indicator in the ith alternative can be converted by Equation (3).
x i j = max x 1 j , x 2 j , , x k j x i j max x 1 j , x 2 j , , x k j min x 1 j , x 2 j , , x k j
Then we get the standardized decision matrix X:
X = [ x i j ] m × n

3.3.2. Entropy Weight Method

In this section, the criteria weight is set based on the information entropy. The entropy weight method is an objective weighting method that primarily relies on the indicators’ degree of change in the index system. The indicators with a large degree of change have a greater weight [4]. According to the explanation of entropy, we calculated the information entropy as the following equations. First, we calculated the ratio of each indicator under each scheme to measure the variation size of the indicator as Equation (5).
θ i j = x i j / i = 1 m x i j
Second, the entropy value of the indicator jth can be calculated by Equation (6).
E j = 1 ln m i = 1 m θ i j × ln θ i j , ( i = 1 , 2 , , m ; j = 1 , 2 , , n )
where E is the information entropy of the criterion. Note that when θ i j equals 0, then θ i j × ln θ i j is regarded as 0. Finally, the entropy value of the indicator jth can be calculated by Equation (7).
ω j = ( 1 E j ) / ( n j = 1 n E j ) , ( j = 1 , 2 , , n )
According to the standardized decision matrix X = [ x i j ] m × n and the obtained entropy weight ω j , the weighted normalized matrix is calculated by the following formula (Equation (8)):
Y i j = x i j × ω k j ( i = 1 , 2 , , m ; j = 1 , 2 , , n )

3.3.3. TOPSIS Method

The Technique for Order of Preference by Similarity to Ideal Solution (TOPSIS) is presented to rank all alternative solutions according to their closeness to the ideal solution and to find the best alternatives [53]. The main procedure of TOPSIS consists of three steps:
Step 1. Determining the positive ideal solution and the negative ideal solution according to the weighted matrix of indicators value.
Y + = y 1 + , y 2 + , , y n + = ( max y i j | j = J 1 ) , ( min y i j | j = J 2 ) | i = 1 , 2 , , m
Y = y 1 , y 2 , , y n = ( min y i j | j = J 1 ) , ( max y i j | j = J 2 ) | i = 1 , 2 , m
Y + denotes the positive ideal solution; Y denotes the negative ideal solution; J 1 denotes the benefit criterion; and J 2 denotes the cost criterion.
Step 2. Compute the Euclidean distance. The separation of each alternative from the positive and negative ideal solution is given below, respectively.
L i + = i = 1 n ( y i j y j + ) 2 , i = 1 , 2 , , m
L i = i = 1 n ( y i j y j ) 2 , i = 1 , 2 , , m
L i + denotes the distance between y i j and positive ideal solutions; L i denotes the distance between y i j and negative ideal solutions.
Step 3. Calculating the performance score value and ranking the order of alternatives.
P i = L i / ( L i + + L i ) , i = 1 , 2 , , m

4. Results and Discussion

4.1. Stability, Coordination, and Sustainability of B&R Countries

According to Equations (5)–(7), we can calculate the weight values of all indicators. As shown in Figure 2, the weights of stability, coordination, and sustainability are 0.4313, 0.4307, and 0.1381, respectively. From the 11 secondary indicators, the resource potential has the largest weight of 0.1631, indicating that the resource potential has the greatest effect on the investment suitability; the environmental system has the lowest weight of 0.0086, indicating that the environmental system has the least effect on the investment suitability.
This section considers three dimensions of investment suitability, which are stability, coordination, and sustainability. According to the calculation results, the performance scores and ranking results of the 60 major countries in the six economic corridors of B&R are shown in Table 3. This paper will analyze and explain the above three indicators. In this study, we use the mean value of each indicator of the countries in the region as the measure of the six economic corridors of B&R. The stability, coordination, and sustainability indexes of the six economic corridors are shown in Figure 3.

4.1.1. Stability

Stability, or symbiotic unit suitability, is a comprehensive reflection of the infrastructure level, resource potential, and workforce level of B&R countries. From the perspective of the six economic corridors along B&R, according to Figure 3, the stability of the China–Mongolia–Russia Economic Corridor, Bangladesh–China–India–Myanmar Economic Corridor, and China–Indochina Peninsula Economic Corridor is relatively high, while the stability of the China–Pakistan Economic Corridor, New Eurasian Land Bridge Economic Corridor, and China–Central Asia–West Asia Economic Corridor is relatively low.
According to the natural discontinuity classification method (Jenks) in ArcGIS, this paper has divided the stability of 60 B&R countries into three levels, namely low stability, moderate stability, and high stability. Coordination, sustainability, and investment suitability are classified in the same way, which will not be explained below. There are 6 high-stability countries, 30 moderate-stability countries, and 24 low-stability countries when ranking for stability. From the perspective of spatial distribution, the analysis of stability of B&R countries indicates that scores can vary widely within regions. Figure 4 shows that regions in dark purple represent countries with high stability, while regions in light purple exhibit countries with low stability. It is obvious that the stability of countries in Eastern Europe and South Asia is higher, while the stability of countries in Central Asia and West Asia is generally lower. In the China–Indochina Peninsula Economic Corridor, Singapore and Indonesia received high stability scores. Singapore has obvious advantages in terms of infrastructure and workforce, with the most complete electricity infrastructure and internet infrastructure, and a higher proportion of educated and R&D personnel in the workforce. However, due to its small national territorial area, Singapore’s resource endowments are at a disadvantage, especially in terms of agricultural land, renewable energy, and renewable inland freshwater resources. In the New Eurasian Land Bridge Economic Corridor, Lithuania, Portugal, Estonia, and Austria are in the top 10 for stability, while Belarus, Albania, Macedonia, Ukraine, and Moldova are relatively low. Overall, among 60 B&R countries, Russia has the highest stability scores, as they exhibit relatively complete infrastructure construction, an extremely rich resource endowment, and an outstanding labor force level. However, war-torn Syria has the lowest level of stability due to its inadequate infrastructure and low workforce level.

4.1.2. Coordination

Coordination, or symbiotic relationship suitability, is a comprehensive reflection of bilateral relations between China and B&R countries, which includes the connection and cooperation between the two countries in industry, technology, market, culture, and politics. From the perspective of the six economic corridors along B&R, according to Figure 3, the coordination of the China–Mongolia–Russia Economic Corridor, China–Pakistan Economic Corridor, and China–Indochina Peninsula Economic Corridor is relatively high, while the coordination of the New Eurasian Land Bridge Economic Corridor, China–Central Asia–West Asia Economic Corridor, and Bangladesh–China–India–Myanmar Economic Corridor is relatively low.
Based on the coordination score for each B&R country, 8 countries have a strong coordination, 18 countries have a medium coordination, and 34 countries have a weak coordination. Figure 5 shows the investment suitability results under the coordination dimension. Russia, Pakistan, India, and the vast majority of the China–Indochina Peninsula Economic Corridor have the greatest coordination with China, which indicates that countries with a strong coordination with China are mainly concentrated in China’s neighbors. Russia has the highest coordination score, because Russia has the largest number of Sino–Russian cooperative industrial parks and sister cities, and the heads of governments of the two countries also have the most frequent exchanges of visits. In addition, Russia and China are also very closely connected in market, technology, and culture. Saudi Arabia has the highest coordination score with China in the China–Central Asia–West Asia Economic Corridor, which is reflected in the close market cooperation relationship with China. China depends on Saudi Arabia’s oil, and Saudi Arabia needs China’s manufacturing products; in fact, this is one of the most common mutually beneficial symbiotic relationships. Macedonia, Albania, Moldova, Lithuania, and other countries in the New Eurasian Land Bridge Economic Corridor have very weak industrial and technological cooperation with China, and cultural exchanges are also relatively lacking.

4.1.3. Sustainability

Sustainability, or symbiotic environment suitability, is a comprehensive manifestation of the socio-economic-natural complex system of B&R countries, including the economic system, social system, and environmental system. From the perspective of the six economic corridors along B&R, according to Figure 3, the coordination of the Bangladesh–China–India–Myanmar Economic Corridor, China–Pakistan Economic Corridor, and China–Indochina Peninsula Economic Corridor is relatively high, while the coordination of the China–Central Asia–West Asia Economic Corridor, New Eurasian Land Bridge Economic Corridor, and China–Mongolia–Russia Economic Corridor is relatively low.
Figure 6 shows the assessment results on sustainability. There is 1 high-sustainability country, 18 moderate-sustainability countries, and 41 low-sustainability countries. Surprisingly, India has the highest sustainability score and is the only one with high sustainability. According to Table 2, India’s sustainability score is nearly four times that of second-placed Singapore. Further analysis found that in the social system dimension of the sustainability assessment system, the total population indicator has the highest weight, so India with the largest population has the highest sustainability score. However, India’s performance in government efficiency, regulatory quality, and corruption control is poor. In addition, Indonesia, Pakistan, Bangladesh, and Russia ranked after India in terms of total population, and also received relatively high sustainability scores. Singapore, Indonesia, Qatar, Pakistan, United Arab Emirates, Brunei, Hungary, Austria, Kuwait, and other countries belong to moderate sustainability. It is not difficult to find that the distribution of moderate sustainability countries in the six economic corridors is relatively balanced. The sustainability scores of most countries in the China–Central Asia–West Asia Economic Corridor are generally low. Among them, Qatar has the highest particulate emission damage, while Lebanon has the lowest energy efficiency. Unsurprisingly, Yemen, Syria, Afghanistan, and Iraq, which are generally poor in government efficiency, regulatory quality, and corruption control, receive low scores of sustainability as well.

4.2. Investment Suitability of B&R Countries

Investment suitability is a comprehensive reflection of the stability, coordination, and sustainability of B&R countries. Overall, from the perspective of the six economic corridors along B&R, of which the investment suitability is shown in Figure 7, countries with high investment suitability are mainly concentrated in the China–Mongolia–Russia Economic Corridor, Bangladesh–China–India–Myanmar Economic Corridor, and China–Indochina Peninsula Economic Corridor. Conversely, the investment suitability of B&R countries of the China–Pakistan Economic Corridor, China–Central Asia–West Asia Economic Corridor, and the New Eurasian Land Bridge Economic Corridor is relatively low.
As shown in Figure 7 and Figure 8, Russia, India, Indonesia, Thailand, Singapore, Vietnam, and Malaysia (seven countries) have the high investment suitability for China’s OFDI. These B&R countries have an obvious commonality, that is, the coordination with China is very high. These results show that the cooperation between China and the host country in industry, technology, and market, as well as political and cultural exchanges, have a greater impact on the location selection of foreign investment. Russia has the highest stability and coordination ranks among B&R countries, while India has the highest sustainability. Among the 60 major countries in the six economic corridors of the BRI, India is the only country that ranks high in all three dimensions of investment suitability. According to the symbiotic system theory, it shows that China’s OFDI in the above seven countries can generate more symbiotic energy, which is conducive to the realization of a more stable, mutually beneficial, and win-win symbiotic relationship.
Pakistan, Saudi Arabia, Portugal, the Philippines, Lithuania, United Arab Emirates, Estonia, Austria, and 26 other countries have moderate investment suitability. Among these countries, the partnership between China and Pakistan is the only one defined by “all-weather”, which shows the high level of cooperation between the two sides and the high stability of cooperation in a complex and volatile international environment [54]. However, within the analysis framework of the B&R symbiotic system, Pakistan scores in the middle level for sustainability and the lowest level for stability. The reason is that Pakistan’s infrastructure is relatively backward, and its economic system is relatively fragile. What is more important is the political unrest brought about by partisan struggles in Pakistan, the social unrest brought about by sectarian struggles, and the terror brought about by terrorism. Huge insecurity is an important obstacle for Chinese investors to enter Pakistan. In the New Eurasian Land Bridge Economic Corridor, Portugal and Lithuania have high stability scores, but their sustainability and coordination are relatively weak. Iraq, Kuwait, Azerbaijan, Qatar, Brunei, United Arab Emirates, and Saudi Arabia have rich fossil fuel resources and are important candidates for energy investment.
A total of 27 countries, including Syria, Lebanon, Jordan, Yemen, Armenia, Turkmenistan, Moldova, Macedonia, Afghanistan, and Albania, have low investment suitability. Taking Syria, Afghanistan, and Yemen as examples, the transportation infrastructure, communication infrastructure, internet infrastructure, and power infrastructure of these countries are relatively backward, the degree of industrialization is not high, and the government efficiency, regulatory quality, and corruption control ability are weak. In general, China’s OFDI should be cautious about investing in countries with low investment suitability.

4.3. Discussion

The Chinese government has repeatedly advocated for the construction of a new type of international relations and a community with a shared future for mankind. In this context, promoting the development of the BRI with mutual benefits and win-win results has become a hot issue concerned by Chinese academic circles. Therefore, based on symbiotic system theory, this paper conducted a comprehensive assessment system of the investment suitability of 60 major countries in the six economic corridors of B&R and made a location decision for China’s OFDI. From the assessment results, there are 7 high investment suitability countries, 26 moderate investment suitability countries, and 27 low investment suitability countries.
Compared with previous studies, this paper developed an assessment system for investment suitability that covered more comprehensive location choice factors, a total of 37 indicators, involving infrastructure level, resource potential, workforce level, economic system, social system, environmental system, and other influencing factors of the host country. Significantly different from previous studies, this paper also particularly focused on the influence of bilateral relations between the host country and the home country on investment location choice, including industrial relations, technological relations, market relations, cultural relations, and political relations. Many studies have shown that good bilateral relations can effectively reduce investment risks. For example, Confucius Institutes and the exchange of visits by heads of government, as channels for cultural exchanges and China’s political interaction, are conducive to deepening the friendship with the host country, increasing the understanding and mutual trust between the two countries, and thus reducing the overseas investment risk of China’s OFDI [6]. Consequently, this paper indicates that the bilateral relationship between the home country and the host country is an important factor that cannot be ignored in the location choice of investment.
Although the assessment system in this paper considered more dimensions, the indicators used in each dimension were not comprehensive enough, especially in the economic system, social system, and environmental system. Undoubtedly, there will be some differences between the research results of this paper and other research results of China’s OFDI location choice. The reason is that the other studies focused on investment location choice in a specific industry, such as energy [16], renewable energy [25,26], coal-fired power plants [24], and transportation infrastructure [50]. For example, Saudi Arabia, United Arab Emirates, Pakistan, and Kazakhstan were considered the best choices for China’s energy investment in B&R countries [16], but the results of this paper suggested that these countries were the second choice for China’s OFDI. In fact, the deviations of these two conclusions were understandable, mainly due to differences in the research perspective and focus. One is a comprehensive investment location evaluation, and the other is a specific industry location evaluation. Traditional international direct investment theory held that there were four main motives for multinational corporations to enter overseas markets: market-seeking, efficiency-seeking, natural resource-seeking, and technology-seeking. Accordingly, the location advantages of attracting investment with different motivations are reflected in abundant market demand, low labor costs, abundant natural resources, and accumulation of science and technology. Therefore, future research can further select the location based on the different motives of China’s OFDI.

5. Conclusions and Implications

5.1. Conclusions

This paper studied the location choice of China’s OFDI in B&R countries from the perspective of symbiosis. To this end, this paper has constructed the B&R symbiotic system, and put forth the investment suitability index, which is based on the stability index, coordination index, and sustainability index from the three elements of a symbiotic system. Then, we used the TOPSIS method based on entropy weight to develop a comprehensive assessment of investment suitability, which decided on the location of China’s OFDI. In addition, combining the evaluation results and GIS maps, this paper has identified and analyzed the spatial distribution patterns of stability, coordination, sustainability, and investment suitability of B&R countries, prospectively. Finally, based on the investment suitability index, the reasonable and rigorous investment location was selected to achieve BRI mutual benefit and symbiosis. The study concluded that the best location choices for China’s OFDI in B&R countries are Russia, India, Indonesia, Thailand, Singapore, Vietnam, and Malaysia, followed by Pakistan, Saudi Arabia, Portugal, Philippines, Lithuania, United Arab Emirates, Estonia, Austria, and 26 other countries. Countries in which China should invest cautiously include 27 countries, including Syria, Lebanon, Jordan, Yemen, Armenia, Turkmenistan, Moldova, Macedonia, Afghanistan, and Albania. To sum up, the research results of this paper are important and meaningful. The conclusions obtained in this paper not only provide important supports for optimizing the location choices of China’s OFDI in B&R countries to achieve win-win cooperation, but also enrich the theory of location choice for foreign investment from the perspective of mutualistic symbiosis.

5.2. Implications

In order to promote mutualistic symbiosis in China’s OFDI in B&R countries, we propose the following policy recommendations.
First, policymakers should formulate reasonable investment location choice strategies based on the investment suitability index. China’s OFDI in B&R countries should be based on the complementary advantages of production factors and give priority to investment in B&R countries around China. In addition, China should strengthen the investment and construction of infrastructure such as highways, railways, waterways, and aviation in B&R countries, build a relatively complete modern transportation system, and strengthen interconnection with countries along the Belt and Road.
Second, it is necessary for China to further deepen the concept of a community with a shared future for mankind, and continuously strengthen the symbiotic relationship and improve the symbiotic environment with B&R countries. China’s OFDI should deeply explore and utilize the complementarity of production factors with B&R countries, actively carry out industrial division and cooperation based on complementary advantages, and transform the complementarity of bilateral production factors into mutual assistance for development, to achieve sound development and benefit all parties, thus forming a more closely connected and stable, mutually beneficial, and win-win symbiotic relationship.
Third, China’s OFDI in B&R countries should also focus on strengthening technical cooperation, industrial cooperation, and market cooperation, such as establishing technical cooperation alliances to build a close technical cooperation network, establishing industrial cooperation parks to stimulate industrial cooperation momentum, and establishing regional free trade zones to expand the potential of market cooperation. In addition, it should actively carry out partnership diplomacy, establish cultural exchange platforms, and other activities to improve the symbiotic environment by promoting political mutual trust and cultural exchanges.

5.3. Limitations

Although the major objective of this study has been accomplished, we also would like to mention limitations existing in our research work, which would spur further research in this area. First, this paper only studied 60 B&R countries from the perspective of six economic corridors of B&R. According to the data of China’s B&R official website, more than 130 countries have signed the BRI cooperation agreement with China. Therefore, we suggest evaluating the investment suitability of more B&R countries in future research, so as to obtain more comprehensive suggestions on China’s OFDI location choices in B&R countries.
Second, this study did not review the investment suitability between China and B&R countries from different types of industries. We suggest analyzing the investment suitability of different factor-intensive industries in future studies, including resource-intensive industries, labor-intensive industries, capital-intensive industries, and technology-intensive industries, so as to provide a more concrete empirical basis for the location choice of China’s OFDI in B&R countries.
Third, as the data of some indicators are no longer updated, access to research data is limited. This study only assessed the investment suitability of B&R countries from a single time dimension. Therefore, if more complete indicator data can be obtained in the future, we suggest that future research should assess and analyze investment suitability from different time dimensions, so as to observe the time trend of investment suitability or use the mean value as the basis for the investment location choice, which can effectively increase the robustness and reliability of the assessment results.

Author Contributions

Conceptualization, Y.Y. and Y.L.; methodology, Y.Y.; software, Y.Y.; validation, Y.Y.; formal analysis, Y.Y.; investigation, Y.Y.; resources, Y.Y.; data curation, Y.Y.; writing—original draft preparation, Y.Y. and Y.L.; writing—review and editing, Y.Y.; visualization, Y.Y.; supervision, Y.Y.; project administration, Y.L.; funding acquisition, Y.L. All authors have read and agreed to the published version of the manuscript.

Funding

This research was funded by the National Social Science Foundation of China (17ZDA046).

Institutional Review Board Statement

Not applicable.

Informed Consent Statement

Not applicable.

Data Availability Statement

The data presented in this study are available on request from the corresponding author.

Acknowledgments

The authors are particularly grateful to all researchers for providing data support for this study.

Conflicts of Interest

The authors declare no conflict of interest.

References

  1. Butzbach, O.; Fuller, D.B.; Schnyder, G. Manufacturing discontent: National institutions, multinational firm strategies, and anti-globalization backlash in advanced economies. Glob. Strategy J. 2020, 10, 67–93. [Google Scholar] [CrossRef]
  2. Dür, A.; Eckhardt, J.; Poletti, A. Global value chains, the anti-globalization backlash, and EU trade policy: A research agenda. J. Eur. Public Policy 2020, 27, 944–956. [Google Scholar] [CrossRef]
  3. Liao, H.; Yang, L.; Dai, S.; Van Assche, A. Outward FDI, industrial structure upgrading and domestic employment: Empirical evidence from the Chinese economy and the belt and road initiative. J. Asian Econ. 2021, 74, 101303. [Google Scholar] [CrossRef]
  4. Liu, H.; Jiang, J.; Zhang, L.; Chen, X. OFDI agglomeration and Chinese firm location decisions under the “Belt and Road” initiative. Sustainability 2018, 10, 4060. [Google Scholar] [CrossRef] [Green Version]
  5. Du, J.; Zhang, Y. Does one belt one road initiative promote Chinese overseas direct investment? China Econ. Rev. 2018, 47, 189–205. [Google Scholar] [CrossRef]
  6. Liu, Y.; Yin, Y.; Zeng, X. Mutualism Effect of China’s Industrial Transfer to the Belt and Road Countries: Based on the Perspective of Bilateral Value Chain Upgrade. Econ. Geogr. 2020, 40, 136–146. [Google Scholar]
  7. Lin, Y.; Li, P.; Feng, Z.; Yang, Y.; You, Z.; Zhu, F. Climate Suitability Assessment of Human Settlements for Regions along the Belt and Road. Chin. Geogr. Sci. 2021, 31, 996–1010. [Google Scholar] [CrossRef]
  8. Huang, M.-X.; Li, S.-Y. The analysis of the impact of the Belt and Road initiative on the green development of participating countries. Sci. Total Environ. 2020, 722, 137869. [Google Scholar] [CrossRef]
  9. De Beule, F.; Zhang, H. The impact of government policy on Chinese investment locations: An analysis of the Belt and Road policy announcement, host-country agreement, and sentiment. J. Int. Bus. Policy 2022, 5, 194–217. [Google Scholar] [CrossRef]
  10. Wang, X.; Zhang, C.; Zhang, Z. Pollution haven or porter? The impact of environmental regulation on location choices of pollution-intensive firms in China. J. Environ. Manag. 2019, 248, 109248. [Google Scholar] [CrossRef]
  11. Liang, Y.; Zhou, Z.; Liu, Y. Location choices of Chinese enterprises in Southeast Asia: The role of overseas Chinese networks. J. Geogr. Sci. 2019, 29, 1396–1410. [Google Scholar] [CrossRef]
  12. Huang, Y. Environmental risks and opportunities for countries along the Belt and Road: Location choice of China’s investment. J. Clean. Prod. 2019, 211, 14–26. [Google Scholar] [CrossRef]
  13. Shen, J.; Wei, Y.D.; Yang, Z. The impact of environmental regulations on the location of pollution-intensive industries in China. J. Clean. Prod. 2017, 148, 785–794. [Google Scholar] [CrossRef]
  14. Pan, L.; Feng, Q.; Li, J.; Wang, L. Determinants of China’s OFDI Location Choices: A Comparison Study Between BRI Countries and Non-BRI Countries. J. Syst. Sci. Inf. 2022, 10, 1–18. [Google Scholar] [CrossRef]
  15. Sun, X.; Gao, J.; Liu, B.; Wang, Z. Big data-based assessment of political risk along the belt and road. Sustainability 2021, 13, 3935. [Google Scholar] [CrossRef]
  16. Duan, F.; Ji, Q.; Liu, B.-Y.; Fan, Y. Energy investment risk assessment for nations along China’s Belt & Road Initiative. J. Clean. Prod. 2018, 170, 535–547. [Google Scholar]
  17. Liu, H.; Wang, Y.; Jiang, J.; Wu, P. How green is the “Belt and Road Initiative”?—Evidence from Chinese OFDI in the energy sector. Energy Policy 2020, 145, 111709. [Google Scholar] [CrossRef]
  18. Cheng, S.; Qi, S. The potential for China’s outward foreign direct investment and its determinants: A comparative study of carbon-intensive and non-carbon-intensive sectors along the Belt and Road. J. Environ. Manag. 2021, 282, 111960. [Google Scholar] [CrossRef]
  19. Kunrong, S.; Gang, J. China’s belt and road initiative and large-scale outbound investment. China Political Econ. 2018, 2, 219–240. [Google Scholar] [CrossRef] [Green Version]
  20. Wang, Y. Research on the Location Choice of Chinese Enterprises’ Overseas Investment under the Motivation for Seeking natural resources in Host Country. In Proceedings of the E3S Web of Conferences; 2020; p. 01001. [Google Scholar]
  21. Razzaq, A.; An, H.; Delpachitra, S. Does technology gap increase FDI spillovers on productivity growth? Evidence from Chinese outward FDI in Belt and Road host countries. Technol. Forecast. Soc. Change 2021, 172, 121050. [Google Scholar] [CrossRef]
  22. Sutherland, D.; Anderson, J.; Bailey, N.; Alon, I. Policy, institutional fragility, and Chinese outward foreign direct investment: An empirical examination of the Belt and Road Initiative. J. Int. Bus. Policy 2020, 3, 249–272. [Google Scholar] [CrossRef]
  23. Bashir, M.F.; Ma, B.; Shahzad, L.; Liu, B.; Ruan, Q. China’s quest for economic dominance and energy consumption: Can Asian economies provide natural resources for the success of One Belt One Road? Manag. Decis. Econ. 2021, 42, 570–587. [Google Scholar] [CrossRef]
  24. Yuan, J.; Li, X.; Xu, C.; Zhao, C.; Liu, Y. Investment risk assessment of coal-fired power plants in countries along the Belt and Road initiative based on ANP-Entropy-TODIM method. Energy 2019, 176, 623–640. [Google Scholar] [CrossRef]
  25. Wu, Y.; Wang, J.; Ji, S.; Song, Z. Renewable energy investment risk assessment for nations along China’s Belt & Road Initiative: An ANP-cloud model method. Energy 2020, 190, 116381. [Google Scholar]
  26. Hashemizadeh, A.; Ju, Y.; Bamakan, S.M.H.; Le, H.P. Renewable energy investment risk assessment in belt and road initiative countries under uncertainty conditions. Energy 2021, 214, 118923. [Google Scholar] [CrossRef]
  27. Adams, D.G. Symbiotic interactions. In The Ecology of Cyanobacteria; Springer: Berlin/Heidelberg, Germany, 2000; pp. 523–561. [Google Scholar]
  28. Ahmdajina, V. Symbiosis: An Introduction to Biological Association; University Press of New England: Lebanon, NH, USA, 1986. [Google Scholar]
  29. Hu, S. A Theory of Social Symbiosis, 2nd ed.; Fudan University Press: Shanghai, China, 2006; pp. 5–22. [Google Scholar]
  30. Sun, Q.; Wang, C.; Zhou, Y.; Zuo, L.; Tang, J. Dominant platform capability, symbiotic strategy and the construction of “Internet + WEEE collection” business ecosystem: A comparative study of two typical cases in China. J. Clean. Prod. 2020, 254, 120074. [Google Scholar] [CrossRef]
  31. Yoon, C.; Moon, S.; Lee, H. Symbiotic Relationships in Business Ecosystem: A Systematic Literature Review. Sustainability 2022, 14, 2252. [Google Scholar] [CrossRef]
  32. Yi, B.; Zhang, J. Study on Cooperative Symbiotic System of the“One Belt and One Road” in Northeast Asia. Northeast. Asia Forum 2015, 22, 65–74. [Google Scholar]
  33. Yu, X.; Luo, X. “The Belt and Road” Energy Symbiosis Cooperation: Framework Analysis and Promotion Path. Gansu Soc. Sci. 2021, 40, 198–206. [Google Scholar] [CrossRef]
  34. Zhang, H.; Liang, S. Model Analysis and Mechanism Construction of International Production Capacity Cooperation from the Perspective of Symbiosis Theory: Taking China-Kazakhstan Production Capacity Cooperation as an Example. Macroeconomics 2015, 35, 121–128. [Google Scholar]
  35. Hussain, J.; Zhou, K.; Guo, S.; Khan, A. Investment risk and natural resource potential in “Belt & Road Initiative” countries: A multi-criteria decision-making approach. Sci. Total Environ. 2020, 723, 137981. [Google Scholar] [PubMed]
  36. Yuan, C. Symbiosis Theory—On Small-Scale Economy. People’s Publ. House Beijing 1998, 55, 150–152. [Google Scholar]
  37. Han, Z.; Ma, H. Adaptability Assessment and Analysis of Temporal and Spatial Differences of Water-Energy-Food System in Yangtze River Delta in China. Sustainability 2021, 13, 13543. [Google Scholar] [CrossRef]
  38. Hirzel, A.H.; Le Lay, G. Habitat suitability modelling and niche theory. J. Appl. Ecol. 2008, 45, 1372–1381. [Google Scholar] [CrossRef]
  39. Hirzel, A.H.; Le Lay, G.; Helfer, V.; Randin, C.; Guisan, A. Evaluating the ability of habitat suitability models to predict species presences. Ecol. Model. 2006, 199, 142–152. [Google Scholar] [CrossRef]
  40. Malczewski, J. GIS-based land-use suitability analysis: A critical overview. Prog. Plan. 2004, 62, 3–65. [Google Scholar] [CrossRef]
  41. Collins, M.G.; Steiner, F.R.; Rushman, M.J. Land-use suitability analysis in the United States: Historical development and promising technological achievements. Environ. Manag. 2001, 28, 611–621. [Google Scholar] [CrossRef]
  42. VanDerWal, J.; Shoo, L.P.; Johnson, C.N.; Williams, S.E. Abundance and the environmental niche: Environmental suitability estimated from niche models predicts the upper limit of local abundance. Am. Nat. 2009, 174, 282–291. [Google Scholar] [CrossRef] [Green Version]
  43. Messina, J.P.; Kraemer, M.U.; Brady, O.J.; Pigott, D.M.; Shearer, F.M.; Weiss, D.J.; Golding, N.; Ruktanonchai, C.W.; Gething, P.W.; Cohn, E. Mapping global environmental suitability for Zika virus. Elife 2016, 5, e15272. [Google Scholar] [CrossRef]
  44. Irimia, L.M.; Patriche, C.V.; Roșca, B. Climate change impact on climate suitability for wine production in Romania. Theor. Appl. Climatol. 2018, 133, 1–14. [Google Scholar] [CrossRef]
  45. Boudier-Bensebaa, F. Agglomeration economies and location choice: Foreign direct investment in Hungary 1. Econ. Transit. 2005, 13, 605–628. [Google Scholar] [CrossRef]
  46. Coskun, R. Determinants of direct foreign investment in Turkey. Eur. Bus. Rev. 2001, 13, 221–227. [Google Scholar] [CrossRef]
  47. Raluca, D.A.; Alecsandru, S.V. Main determinants of Foreign Direct Investments in Romania-A quantitative view of the regional characteristics involved in the investment strategies of foreign companies. Procedia Soc. Behav. Sci. 2012, 58, 1193–1203. [Google Scholar] [CrossRef] [Green Version]
  48. Mohsin, A.; Lei, H.; Tushar, H.; Hossain, S.F.A.; Hossain, M.E.; Sume, A.H. Cultural and institutional distance of China’s outward foreign direct investment toward the “Belt and Road” countries. Chin. Econ. 2021, 54, 176–194. [Google Scholar] [CrossRef]
  49. Li, J.; Liu, B.; Qian, G. The belt and road initiative, cultural friction and ethnicity: Their effects on the export performance of SMEs in China. J. World Bus. 2019, 54, 350–359. [Google Scholar] [CrossRef]
  50. Chen, Y.; Chao, Y.; Liu, W.; Tao, K.; Lian, P. Make friends, not money: How Chinese enterprises select transport infrastructure investment locations along the Belt and Road. Transp. Policy 2021, 101, 119–132. [Google Scholar] [CrossRef]
  51. Liu, H.Y.; Tang, Y.K.; Chen, X.L.; Poznanska, J. The determinants of Chinese outward FDI in countries along “One Belt One Road”. Emerg. Mark. Financ. Trade 2017, 53, 1374–1387. [Google Scholar] [CrossRef]
  52. Warsame, A.S. The Location Choice of Foreign Direct Investment and Economic Development in Africa. Int. J. Econ. Financ. 2021, 13, 1–69. [Google Scholar] [CrossRef]
  53. Hwang, C.-L.; Yoon, K. Methods for multiple attribute decision making. In Multiple Attribute Decision Making; Springer: Berlin/Heidelberg, Germany, 1981; pp. 58–191. [Google Scholar]
  54. Ahmed, Z.S. Impact of the China–Pakistan Economic Corridor on nation-building in Pakistan. J. Contemp. China 2019, 28, 400–414. [Google Scholar] [CrossRef]
Figure 1. Regional map of the six economic corridors of B&R.
Systems 10 00195 g001
Figure 2. The weights of the investment suitability index evaluation system.
Systems 10 00195 g002
Figure 3. Stability, coordination, and sustainability of the six economic corridors of B&R.
Systems 10 00195 g003
Figure 4. Stability of B&R countries.
Systems 10 00195 g004
Figure 5. Coordination of B&R countries.
Systems 10 00195 g005
Figure 6. Sustainability of B&R countries.
Systems 10 00195 g006
Figure 7. Investment suitability of B&R countries.
Systems 10 00195 g007
Figure 8. Investment suitability, stability, coordination, and sustainability of 60 B&R countries.
Systems 10 00195 g008
Table 1. Summary of all dimensions and indicators within the system of investment suitability.
AspectDimensionIndicatorsSourceSign
Symbiotic unit
(Stability)
Infrastructure levelElectricity rate (percentage of population)2020 1+
Mobile cellular subscriptions (per 100 people)2020 1+
Air traffic, global departures of registered carriers2020 1+
Number of internet security servers (per million people)2020 1+
Electricity generated from renewable sources, excluding hydropower (percentage of total electricity generation)2015 1+
Resource potentialForest area (percentage of land area)2020 1+
Agricultural land (percentage of land area)2018 1+
Fuel exports (percentage of commodity exports)2020 1+
Renewable energy consumption (percentage of total final energy consumption)2019 1+
Total renewable inland freshwater resources (billion cubic metres)2018 1+
Workforce level Total labor force2021 1+
Labor force with basic education (percentage of working-age population with basic education) 2018 1+
R&D researchers (per million)2020 1+
Total wage earners (percentage of total employment)2019 1+
Symbiotic relationship
(Coordination)
Industrial relationsTotal trade volume in intermediate goods2019 2+
Number of industrial cooperation park2020 3+
Technical relationsHigh-tech products import and export volume2019 2+
Number of co-authored papers2021 4+
Market relationsTotal volume of import and export trade2019 2+
Total trade volume as a percentage of global trade2019 2+
Cultural relationsNumber of Confucius institutes2018 5+
Number of international students in China2018 6+
Political relationsNumber of visits by heads of government2018 7+
Number of sister cities2020 8+
Symbiotic environment
(Sustainability)
Economic systemGDP growth rate2019 1+
Per capital GDP2019 1+
Industrial value added (percentage of GDP)2019 1+
Inflows of foreign direct investment2019 1+
Social systemTotal population2021 1+
Total public expenditure on education (percentage of GDP)2021 1+
Government effectiveness2020 9+
Regulatory quality2020 9+
Control of corruption2020 9+
Environmental systemSpecies of mammals under threat2018 1-
CO2 emissions (metric tons per capita)2019 1-
Particulate emission damage (percentage of GNI)2020 1-
PM2.5 air pollution, mean annual exposure (micrograms per cubic meter)2017 1-
Note: 1 refers to World Development Indicators (WDI); 2 refers to the UN Comtrade Database (UNCD); 3 refers to the official website of the Ministry of Commerce of China; 4 refers to the Web of Science Core Collection; 5 refers to the Confucius Institute Annual Development Report; 6 refers to the Concise Statistics of International Students in China; 7 refers to the official website of the Ministry of Foreign Affairs of China; 8 refers to the China International Friendship Cities Federation; 9 refers to Worldwide Governance Indicators (WGI). “+” means benefit indicator (a larger value is considered more valuable); “-” means cost indicator (a smaller value is considered more valuable).
Table 2. The BRI six major economic corridors.
RegionCountry
China–Pakistan Economic Corridor (CPEC)Pakistan (1 country)
China–Mongolia–Russia Economic Corridor (CMREC)Mongolia, Russia (2 countries)
Bangladesh–China–India–Myanmar Economic Corridor (BCIMEC)Bangladesh, India, Myanmar (3 countries)
China–Indochina Peninsula Economic Corridor (CIPEC)Brunei, Cambodia, Indonesia, Laos, Malaysia, Philippines, Singapore, Vietnam, Thailand (9 countries)
China–Central Asia–West Asia Economic Corridor (CCAWAEC)Afghanistan, Georgia, Armenia, Azerbaijan, Bahrain, Iraq, Israel, Kazakhstan, Jordan, Kuwait, Kyrgyzstan, Lebanon, Oman, Qatar, Saudi Arabia, Syria, Turkey, Turkmenistan, Uzbekistan, Tajikistan, United Arab Emirates (UAE), Yemen (22 countries)
New Eurasian Land Bridge Economic Corridor (NELBEC)Albania, Austria, Bosnia and Herzegovina, Bulgaria, Belarus, Croatia, Czech Republic, Estonia, Greece, Hungary, Latvia, Lithuania, Malta, Moldova, Montenegro, Poland, Portugal, Romania, Serbia, Slovakia, Slovenia, Ukraine, Macedonia (23 countries)
Data sources: Authors according to the official website of China’s Belt and Road Initiative.
Table 3. Score and rank for 60 countries in six economic corridors along B&R.
RegionCountryStabilityCoordinationSustainability
ScoreRankScoreRankScoreRank
CMRECRussia[0.506] 1 [0.694] 1 0.137 12
Mongolia0.109 42 0.141 16 0.092 36
CPECPakistan0.117 39 0.346 8 0.166 5
BCIMECIndia0.478 2 0.470 4 [0.821] 1
Bangladesh0.113 41 0.133 18 0.134 13
Myanmar0.186 23 0.125 21 0.082 45
CIPECSingapore0.358 3 0.378 7 0.208 2
Indonesia0.318 4 0.408 6 0.199 3
Brunei0.223 12 0.028 45 0.155 8
Malaysia0.172 28 0.441 5 0.111 25
Vietnam0.172 27 0.492 3 0.110 26
Philippines0.190 22 0.261 9 0.109 27
Thailand0.178 25 0.492 2 0.095 33
Cambodia0.137 36 0.150 15 0.068 53
Laos0.148 33 0.183 11 0.065 54
NELBECHungary0.182 24 0.109 24 0.159 7
Austria0.244 8 0.090 27 0.150 9
Estonia0.262 7 0.023 46 0.131 15
Malta0.114 40 0.020 51 0.123 16
Slovenia0.194 20 0.034 44 0.123 17
Czech0.173 26 0.167 14 0.120 18
Poland0.214 16 0.127 20 0.120 19
Portugal0.298 6 0.068 34 0.116 20
Lithuania0.299 5 0.018 53 0.113 23
Latvia0.199 18 0.037 43 0.107 28
Slovakia0.148 34 0.041 42 0.106 29
Croatia0.148 32 0.018 52 0.097 31
Romania0.166 29 0.109 25 0.096 32
Greece0.208 17 0.076 32 0.092 35
Serbia0.140 35 0.052 37 0.091 37
Bulgaria0.161 30 0.064 35 0.090 38
Belarus0.093 45 0.117 22 0.087 39
Moldova0.074 50 0.011 54 0.086 41
Ukraine0.080 48 0.084 30 0.086 42
Montenegro0.123 38 0.020 50 0.080 46
Albania0.085 46 0.007 59 0.077 49
Macedonia0.085 47 [0.006] 60 0.071 52
Bosnia and Herzegovina0.097 43 0.011 55 0.063 55
CCAWAECQatar0.224 11 0.047 40 0.184 4
United Arab Emirates0.221 13 0.171 12 0.163 6
Kuwait0.229 10 0.079 31 0.146 10
Saudi Arabia0.191 21 0.260 10 0.145 11
Israel0.057 54 0.090 28 0.132 14
Bahrain0.132 37 0.011 56 0.114 21
Oman0.194 19 0.085 29 0.114 22
Turkey0.215 14 0.129 19 0.113 24
Georgia0.094 44 0.045 41 0.097 30
Uzbekistan0.049 57 0.097 26 0.093 34
Iraq0.234 9 0.110 23 0.087 40
Kazakhstan0.161 31 0.167 13 0.086 43
Tajikistan0.078 49 0.072 33 0.082 44
Azerbaijan0.214 15 0.023 47 0.077 47
Jordan0.047 59 0.021 49 0.077 48
Armenia0.062 53 0.022 48 0.076 50
Kyrgyzstan0.067 52 0.139 17 0.076 51
Afghanistan0.071 51 0.056 36 0.062 56
Turkmenistan0.055 55 0.048 39 0.061 57
Lebanon0.048 58 0.010 57 0.055 58
Yemen[0.035] 60 0.051 38 0.055 59
Syria0.050 56 0.010 58 [0.030] 60
Publisher’s Note: MDPI stays neutral with regard to jurisdictional claims in published maps and institutional affiliations.

