1. Introduction
Big Tech corporations have become increasingly powerful organizations in various media, communications, and information areas. They have branched out into multitudes of different service and product areas. Amazon, for instance, started out in e-commerce selling books and has since then expanded into a wide variety of different areas, including audiovisual media, and has lately, in March 2022, acquired the MGM movie studio. Other Big Tech corporations have also expanded into large numbers of business areas. Apple, for example, developed a health app, which is, indeed, an app and, therefore, a piece of software. However, it takes Apple into an area of societal activities that it hitherto has had no experience with.
In the business literature, the most commonly used explanatory frameworks for analyzing the power and growth of Big Tech corporations are related to combinations of demand-side economies of scale based on network effects [
1,
2,
3], transaction cost economics [
4,
5,
6], and the use of big data on users [
7,
8]. These frameworks constitute very strong foundations for understanding how Big Tech corporations have become some of the strongest and most powerful corporations of our time, and at least the most valuable. Formerly, two-sided or multi-sided businesses have, indeed, existed, but only in niche areas and as niche activities. However, with digitalization, such business models have become the basis not only for strong and powerful corporations but also for the fastest-growing corporations during the past two decades.
However, demand-side economies of scale and transaction costs only partly explain the development paths of Big Tech corporations. These theories and analytical frameworks explain the extraordinary growth of the individual business areas of the corporations, but they do not explain the increasing scope of business areas in which they operate. For this purpose, an approach referring to economies of scope is needed. However, as with economies of scale, where network effects turn the issue ‘upside down’, focusing primarily on the demand side and not on the supply side, the same approach can be applied to economies of scope [
9]. While economies of scope mostly focus on the supply side, discussing how different business areas can utilize common company resources and capabilities and can leverage synergies between different business areas, demand-side economies of scope seem to be important for the expansion of Big Tech corporations, as the synergies between different product and service areas on the demand side are drivers for the buying and use patterns of users, and as data on users not only form the basis for developing and marketing new products and services, but are intrinsic parts of their business approaches.
The research question addressed in this paper is how economies of scope, driven by the demand side, contribute to the strength of successful Big Tech corporations. This, all the more so, as most of the regulatory initiatives that are presently taken in the EU, as well as the US, primarily focus on scope aspects of the companies to be regulated—as with the Digital Markets Act (DMA) in the EU (2020/0374(COD)) and, for example, the American Innovation and Choice Online Act (S.2992) and the Platform Competition and Opportunity Act (H.R.3826) in the US. These acts are concerned with access of alternative suppliers of services to the platforms of the Big Tech corporations, so that the Big Tech corporations are not the only service providers taking advantage of the broad scope of services and applications that can be offered on the basis of such platforms. In spite of the great importance of scale economies, it is seldom the scale of dominant companies which is regulated; it is primarily the scope.
More specifically, the paper analyzes the business models and activities of the five Big Tech corporations often formerly called GAFAM—Google, Apple, Facebook, Amazon, and Microsoft—now, with the changed corporation names of Google (Alphabet), as well as Facebook (Meta), they could be called MAAAM (Microsoft, Apple, Amazon, Alphabet, and Meta), following their age as corporations chronologically.
First, there is a presentation of the concept of demand-side economies of scope. This is followed by descriptions of the MAAAM corporations. After this, there is an analysis section examining the concept of demand-side economies of scope in light of the company case descriptions. Finally, conclusions are drawn.
2. Methodology
The methodological approach of the paper is to discuss how theories on scope economies [
10,
11,
12] can be developed into being applied from a demand-side perspective. Case analyses of the MAAAM corporations are used to examine whether a demand-side economies of scope approach can be helpful in understanding the strength of these companies. The empirical evidence presented in the case analyses is drawn from publicly available web sites and news articles. The expected result of the paper is an additional theoretical aspect of understanding the business models of successful Big Tech corporations—demand-side economies of scope, in addition to demand-side economies of scale and transaction cost economics.
3. Demand-Side Economies of Scope
Just as with economies of scale, economies of scope have traditionally been dealt with from a supply-side point of view. Ever since Adam Smith [
13] (1994—first published in 1776), it has been general knowledge in economics that with divisions of labor and large production sites there can be cost savings per produced unit with an increasing scale of production—with certain limitations, depending on the industrial sectors in question and the development stage of a company. Economies of scope, meaning that there are costs savings per produced unit as an effect of using the same production facilities and capabilities for the production of different products and services, have never obtained the same degree of attention in economics as economies of scale.
The antecedent to the concept of economies of scope was the ‘multi-product firm’ concept. The multi-product firm concept was first discussed at length by [
14], who referred to the limited number of previous and less extensive examinations of the issue by, e.g., [
15]. Weldon [
14] started out by stating that ‘very little has been written on the multi-product firm’. In 1961, Pfouts [
16] elaborated further on the concept of the multi-product firm. However, the first contributions to the economies of scope concept were developed by Panzar and Willig [
10,
11] and Teece [
12]. The 1975 paper by Panzar and Willig [
10], entitled
Economies of scale and economies of scope in multi-output production, was an initial attempt at developing the scope concept, in addition to the scale concept. However, the scope concept was still much attached to the previous discussions on multi-output and multi-product firms. It was Teece [
12] who, in his paper on
Economies of scope and the scope of the enterprise, first unfolded the concept of scope economies to encompass not only the production costs of joint production of different products, but also the transaction cost elements that could be part of the equation. Panzar and Willig [
11], in their paper on
Economies of scope, included the input from Teece [
12] and canonized the definition of economies of scope, which is the presently accepted definition.
In the 1981 paper, Panzar and Willig [
11] write in the introduction to the paper: ‘There are economies of scope where it is less costly to combine two or more product lines in one firm than to produce them separately’. In the conclusion, after having discussed various contributions to the topic, including Teece [
12], they add: ‘When the multiproduct cost function summarizes both the production and organizational costs of operating a firm, economies of scope is the precise condition required for the emergence of multiproduct firms in a competitive environment’.
This definition, however, views economies of scope entirely from the supply side. It is the potential cost savings on the supply side in terms of production costs and transaction costs which are at stake. The implications of the demand side for scope economies are not considered, and this is what this paper aims at examining.
In 2010, Henten and Godoe [
9], in a paper entitled
Demand side economies of scope in bundled communication services, discussed the idea of demand-side economies of scope in relation to bundled services such as triple and quadruple play. However, this paper was not the first to examine the concept of demand-side economies of scope. In a paper from 2004, Mueller [
17] briefly touched upon the issue of demand-side economies of scope. In this paper, he differentiates between ‘subject-side economics’ (demand-side) and ‘organization-side economics’ (supply-side). In connection with ‘subject-side economics’, he mentions demand-side economies of scope and explains that the topic of network externalities sometimes is mislabeled as demand-side economies of scale, while it really is about demand-side economies of scope, he says. Mueller [
17] first developed this idea in his book from 1997 on
Universal Service, and, in the 2004 paper, Mueller [
18] mentions that he is in line with Economides and White [
19] on this. The idea is that, when more subscribers are added to a communication network—in this case, telephony—the utility for existing subscribers increases, as they get access to a new service, namely, calling or being called by a new subscriber. The keyword here is ‘new service’, meaning that a new product is added to the service they already get. This is why Mueller understands this as scope and not scale. Most people, however, understand this as economies of scale, as it is essentially the same service. In this paper, we side with this view and limit the concept of economies of scope to situations where essentially different products are produced and consumed.
If this understanding of demand-side economies of scope is accepted—namely, that there are advantages, induced by the demand side, in terms of savings on production and/or transaction costs per produced unit of production as an effect of using the same production facilities and capabilities for the production of different goods and services—then, the question is raised: What can such demand-side effects actually be?
First of all, it should be remembered that we are dealing with an interaction between those producing and those consuming and, therefore, there are feedback mechanisms between the supply and demand side. However, if we start with the mechanisms that have their point of departure on the demand side, the primary drivers are one-stop shopping, lowering search costs, and enhanced complementarity between related products and, therefore, convenience for users [
20,
21]. Companies can build on such mechanisms by bundling products and by tying in customers to bundles. Products that are bundled increase switching costs for users when switching to other products or bundles and then there are the implications of brands [
22]. All these mechanisms are related to the demand side, and to the extent that they lead to increased consumption of the products made by specific companies, they may lead to advantages of both scale and scope on the supply side.
There is thus a positive feedback mechanism between the demand and the supply side. There is a virtuous cycle so that a demand-side effect may lead to a positive mechanism on the supply side, which may translate into a further demand-side effect. An important question is where the limitations to such positive feedback mechanisms and virtuous cycles are. This goes back to the discussions on multi-product firms, on the effects of specialization, and the more recent discussions on ambidexterity [
23,
24]. The ambidexterity literature tells us that businesses may have difficulties in operating in different market circumstances at the same time, and that specialization may be the answer to such difficulties. The limits to the advantages of scope economies are related to the advantages of specialization. Scale is supported by specialization, while specialization may be a barrier to scope.
A dimension that needs to be taken into consideration is the economies of scope on the horizontal level and the vertical level, respectively [
25,
26]. On the horizontal level, the issue is the extent to which there are scope advantages in producing and consuming different products where the joint production facilities and capabilities do not matter to the end user—as, for instance, with different kinds of audiovisual contents that are unrelated for the user. On the vertical level, the issue is the extent to which there are scope advantages in producing and consuming products where the production facilities and capabilities do matter to the end user—as, for instance, with Internet connectivity and content provision.
There is a strong case to be made that the new digital economy, to a large extent, is supported by scope economies—not primarily because of the possible scope advantages in offering network services bundled with content services, as mentioned above. In most cases, there are degrees of specialization with respect to network and content provision. The strength of the case also emanates from the use of data resources that are personal, as well as not attached to persons. The Big Tech corporations benefit extensively from all the ‘big data’ that they collect and process. The information that results from such collection and processing can be used in many related product areas, but also areas that seem relatively unconnected.
Data on users are extracted either voluntarily or, most often, automatically when users are interacting with digital services. These data are of essential value to potentially all industries and most certainly to the so-called Big Tech companies. This means that these industries are entirely dependent on their users in terms of input to their production. As in the case of demand-side economies of scale, where the number of users is an important part of the value of the product, the dependence on data input from users is the basis for the variety of products that companies offer. This is the reason why it can be argued that demand-side economies of scope constitute an essential mechanism in the digital economy.
4. Company Cases
In this section, five company cases are examined: Microsoft, Apple, Amazon, Alphabet (Google), and Meta (Facebook). These are the largest and most valuable US-based Big Tech companies. We could also have chosen to include China-based companies such as Alibaba and Tencent, as they operate in much the same manner as the US equivalents, which is also why there is no need to include these companies here, as they do not differ substantially from the US-based companies from the point of view of this paper. Furthermore, the five US-based companies cover different kinds of activities and business areas and, therefore, illustrate the variety of businesses which can be subsumed under the term Big Tech.
The focus of the analyses of the five companies is on the scope of their activities and what this means to the companies. The company cases consist of brief intros to the companies in question, the development of the scope of their activities, and a discussion of the importance of demand-side factors that contribute to the scoping of the companies. As can be seen from the previous theory section, there are basically two different categories of overall demand-side factors. One set of factors has to do with the bundling of services and products and the convenience and complementarity that this offers to users and the tying in that companies apply. Another set of factors is concerned with the data that the companies acquire regarding their users and how this helps the companies in providing a wide range of products and services.
The empirical material used for the analyses is based on news articles and information on the activities of the companies found on the web. A common source of information for four of the companies is the
Investigation of competition in the digital markets by the majority staff of the Subcommittee on Antitrust, Commercial and Administrative Law of the Committee on the Judiciary of the US House of Representatives [
27]. Microsoft was not subject to examination by this committee, and the empirical material regarding Microsoft comes from other publicly available sources. Information on acquisitions is from Wikipedia, where updated and detailed information on mergers and acquisitions for all five companies is available.
4.1. Microsoft
By March 2022, Microsoft was the world’s third most valuable company, with a market capitalization of 2.1 trillion USD, according to Investopedia [
28]. The revenue during the previous 12 months was 185 billion USD [
28].
The factual historical information in the following is primarily based on the Wikipedia page on Microsoft [
29] (2022) and the Britannica [
30] equivalent. Microsoft was established in 1975, primarily based on an interpreter for the BASIC programming language. In 1980, Microsoft launched its first operating system, and the subsequent MS-DOS system became its first huge market success. MS-DOS became the operating system for IBM PC clones at the time, and in companion with IBM, Microsoft developed a similar operating system for IBM. In contrast to Apple, which developed hardware, as well as software, Microsoft stayed on the software side and has mostly done so ever since, with only a few exceptions, one of which basically failed, namely, the Windows Phone, developed on the basis of the take-over of Nokia’s mobile device business, and one of which was successful, being the Xbox gaming machines.
In 1985, Microsoft launched Windows, which was a graphical development of MS-DOS. In 1990, the Microsoft Office suite was taken to market, which marked the extension of the scope of Microsoft products, founded on a bundling strategy. Based on Windows, the Office suite included the word-processing program Word and the spreadsheet Excel and clearly illustrated the strength of such a bundling strategy, almost entirely outcompeting the hitherto dominant word-processing program WordPerfect.
When the World Wide Web was launched in 1989 and became a global success in the mid-1990s with the Netscape browser, Microsoft was fast at adapting to the new circumstances for IT companies. The new operating system, Windows 95, became bundled with a web browser, Internet Explorer, and the web portal MSN, giving access to a range of Internet services and applications. Once again, this bundling strategy proved successful, as Internet Explorer quickly became the dominant web browser. However, the bundling strategy also became the object of public intervention in order to prevent anti-competitive behavior and the tying in of users. In the US, the Department of Justice, for instance, filed a motion to disallow the bundling of Internet Explorer with Windows, and later, the EU required Microsoft to produce versions of Windows without the Microsoft Media Player.
In the mobile Internet field, which really took off following 2007 with the iPhone by Apple, Microsoft has never been very successful. Microsoft developed its own Windows Phone operating system and took the chance of establishing an alliance with Nokia in 2011 when it turned out that Nokia on its own was not able to follow up on its astonishing success from the years before the iPhone and App Store. However, this alliance and the subsequent take-over of Nokia’s device area was not successful either.
Since its start, it has been the software area where Microsoft has been the most successful and has maintained its role as one of the most prominent IT companies in the world. Currently, Office 365 is the trademark for a subscription-based arrangement, where bundles of Microsoft products are offered. This now also includes the Microsoft Teams platform, integrating video meetings, file sharing, etc. Such videoconference platforms have lately become an important part of the product portfolio of different companies, with Zoom dominating the world market, but with Teams increasing its market share. A natural extension of the software focus of Microsoft has also been cloud computing, where Microsoft Azure is the second largest cloud computing service in the world, with currently app. 20% of the world market, only surpassed by Amazon Web Services [
31]. Driven by increasing data demand, Microsoft has, furthermore, taken a more active role in the undersea infrastructure market. The company has invested in a handful of subsea cable infrastructures globally.
Microsoft has, during its lifetime, branched out into various fields, which its activities regarding acquisitions document [
32]. It was only after the initial public offering (IPO) in 1986 that Microsoft started its acquisitions. The largest acquisitions in terms of value have been Vision (drawing software, 2000), Navision (business software, 2002), aQuantive (digital marketing, 2007), Skype (telecommunications, 2007), Yammer (social networking, 2012), Nokia mobile phones (mobile phones, 2013), Mojang (video games, 2014), LinkedIn (professional social networking, 2016), GitHub (software development, 2018), ZeniMax Media (video games, 2020), Nuance Communications (speech synthesis and speech recognition, 2021), and Activision Blizzard (video games, 2022). All in all, Microsoft has made more than 225 acquisitions during its lifetime. The emphasis has been on software development, and on video games since the release of Xbox in 2001. Lately, social networking has also become an important part of the company, especially with the acquisition of LinkedIn.
Microsoft also has stakes in other companies [
32]. The profile of these stakes is not very different from the acquisitions, but investments in telecommunications and cable television around the turn of the century and the later investments in undersea cables do stand out. As has been indicated, Microsoft has, since the release of the first Office suite, relied strategically upon a strategy of bundling and tying in users. This is how they have been building scope, based on demand-side economics. Data on their users have, furthermore, come to play an increasing role, especially with the growing emphasis on social networking.
4.2. Apple
By March 2022, Apple was the world’s most valuable company, with a market capitalization of 2.6 trillion USD [
28]. In terms of revenue, it was the world’s third largest, with a revenue during the previous 12 months of 378 billion USD [
28].
The basic historical facts in the following are based primarily on Wikipedia [
33,
34] and the
Investigation of competition in the digital markets by the Subcommittee on Antitrust, Commercial and Administrative Law of the Committee on the Judiciary of the US House of Representatives [
27]. Apple was founded in 1976, with its first product being the Apple 1 personal computer. For the next many years, Apple concentrated on its personal computers, both hardware and software. As opposed to most other personal computer brands at the time, Apple developed its own computer hardware, as well as software, comprising operating system, as well as specialized software tools, and created a ‘walled garden’ of Apple computer products, while other computer brands started basing their products on what came to be known as Wintel (Windows operating system and Intel processors).
This walled garden approach lost ground to the Wintel-based companies during the 1990s and Apple ran into serious economic problems. As a reaction, Apple started expanding its range of products, first with iMac and iPod and then with iPhone and iPad—and, just as importantly, with the App Store, which was launched in 2008. This added an entirely new business model setup for Apple, as the App Store is a platform where independent developers of applications can sell their apps to app users. Still, the App Store is a more closed environment than Android Market—now Google Play—as Apple wishes to have some control over the apps being sold on the App Store. The strategy of retaining control has thus continued. While most other mobile device brands use the common Android operating system and Google Play as their app market, Apple has its own operating system, iOS, and its own App Store.
For the past 10–15 years, the scope of products sold by Apple has grown considerably. The minimalist strategy that Apple followed for many years ended and has been followed by a strategy of expanding into a larger variety of products. Many of the products are different versions of the same line of products, but on the Apple Wiki apple.fandon.com website [
35], 19 products are mentioned under the current hardware category, 7 operating systems are listed, 28 under the category of current software and services, and the largest category is current accessories and peripherals, with 74 products. In addition, even higher numbers of products are listed as discontinued.
Statista publishes statistics on the shares of Apple’s revenues by product categories divided up into five categories: iPhone; Mac; iPad; wearables, home, and accessories; and services. The statistics show that, during the past decade, iPhone has continuously provided the largest share of revenues, fluctuating from app. 40% to app. 70%, but on average at a level between 50 to 60%. The revenues from Mac sales have decreased slightly from app. 15 to 10%, and iPad sales have decreased more considerably from app. 20 to less than 10%. The growth areas are wearables, home, and accessories, going from app. 5 to 10%, and services, going from app. 10 to 20%. This shows that it is the iPhone area that constitutes the largest revenue area for Apple by far, and that iPhone is the keystone for Apple. However, it also shows that the services category is the most important growth area for Apple.
Another way of looking at the scope of the company is the number of acquisitions that Apple has made during the past years. In the US House of Representatives report from 2020 [
27] and on the Wikipedia
List of mergers and acquisitions by Apple [
36], the companies acquired since 1998 until August 2021 are listed. The Wikipedia list includes 123 companies, which corresponds to 4–5 acquisitions per year, and it should be mentioned that the list is probably longer, as Apple does not necessarily publish its acquisitions unless they are mentioned elsewhere. The product categories acquired are almost entirely within software and services. With respect to investments, undersea cable infrastructure has become an activity for Apple, as well as for the other Big Tech companies. With Ireland being an important stepping stone into the European market, Apple has invested in infrastructure between the US and Ireland.
Although Apple has thus spread into a variety of product types, Apple is the company among the five biggest US-based Big Tech companies that has, to the largest degree, limited its scope to product categories in the vicinity of its core hardware products—first and foremost, the iPhone—and the App Store. Every time an iPhone is sold, a whole ecosystem of services and applications is at the fingertips of the user. One cannot start using an iPhone, an iPad, or a Mac without deciding whether one wants to use a whole range of services and applications that one is confronted with when starting up. There is a very high degree of bundling of products and these products are also tied to one another so that some of the convenience for users is lost if not using the bundle of services and applications offered.
Bundling is thus an essential strategy for Apple. The other main type of mechanism to build demand-side economies of scope is, however, also highly important, namely, the collection and processing of user data for the purpose of developing a deeper knowledge on their users, making it possible to deliver packages of services and applications to users that tie the users into the ecosystem of Apple products.
4.3. Amazon
Amazon is currently the world’s fifth most valuable company, with a market capitalization of 1.5 trillion USD [
28]. In 2021, Amazon’s revenue was app. 470 billion USD [
28].
Amazon.com, Inc. was founded in 1994 as an online marketplace for books. The company has ever since expanded into an array of products and services, including general e-commerce, consumer electronics (Kindle e-reader, Fire tablets, Fire TVs, Echo devices), development and production of media content, book publishing, and logistics.
The primary sources of revenue come from retail sales (through online and physical stores). Other sources include third-party seller services (the commissions and related fulfilment and shipping fees), subscription services (fees associated with Amazon Prime memberships and access to content, including audiobooks, digital video, e-books, digital music), AWS, which is the world’s biggest cloud infrastructure service provider (global sales of computing, storage, database, and other service offerings for start-ups, enterprises, government agencies, and academic institutions), and other sources (sales of advertising services) [
37].
Amazon has enlarged its cross-category product/services offerings and delivery channels through a series of acquisitions. Since 1998, Amazon has acquired more than 100 companies. The acquisition of Audible in 2008 allowed Amazon to offer online audiobooks and podcast services. The acquisition of Zappos in 2009 gave access to many different types of products, such as shoes, clothing, handbags, and other accessories. Amazon extended the offerings of baby products, including clothes, car seats, strollers, and toys, by acquiring Quidsi (Diapers.com) in 2010. Since 2011, Amazon has begun to invest in technology start-ups to develop and improve Amazon Echo and expand its AWS division. Amazon’s biggest acquisition of Whole Foods Market Inc. in 2017 allowed it to expand its online business to the brick-and-mortar Food and Beverage, Grocery, and Organic Food market, with 460 stores in the US, Canada, and the UK. In 2018, Amazon acquired Ring LLC, a home security and smart home company. The most recent acquisition of the film and television studio Metro-Goldwyn-Mayer (MGM) added more than 4000 film titles and 17,000 TV episodes to the Amazon Prime catalogue.
These acquisitions show that Amazon is moving deeper into several sectors, similarly to other Tech Giants. However, what is unique in Amazon’s business development is its extremely broad selection of products, the vast investments in brick-and-mortar stores, a shipping infrastructure, and a submarine cable infrastructure. Until now, the company has been involved in five such cable projects [
38]. Amazon’s infrastructure also consists of planes, semi-trucks, vans, trailers, and drones [
39].
Amazon customers are offered the Prime Membership programs. They can choose from over 15 million items that are available for free one-day delivery with no minimum purchase in the US [
39]. Moreover, certain brands are only available on Amazon. Amazon uses Amazon Prime and other programs to lock customers into the Amazon ecosystem of shopping, streaming of movies, music, gaming, reading (unlimited access to books, magazines on any devices), sharing services, and shipping.
With its expansion of activities, Amazon has also gained access to a large group of customers and access to valuable customer data about online and offline customers’ behavior. Access to customer data allows the company to increase the cross-selling of its products among its various business lines. In addition, Amazon has access to third-party seller data and uses it to identify and replicate the most profitable products on its marketplace. In November 2020, the European Commission opened the antitrust investigation into Amazon’s use of third-party seller data to help develop its own private-label goods.
Amazon’s strategy to build a strong ecosystem of devices and services for its Alexa platform generates additional insight into user behavior, which is used to inform and nudge users to buy new Amazon products. Customers have access to the wide array of Alexa-enabled devices (also third-party devices), due to the fact that Amazon does not charge third-party manufacturers for access to its integration services. As of 2020 [
40], over 100,000 devices support interaction with Amazon Alexa. Amazon has been the leading vendor in the global smart speaker market since 2016. In 2021, Amazon had a share of the market of 26.4%. Amazon’s closest competitor in this market is Google, with a 2021 market share of 20.5% [
41].
4.4. Alphabet (Google)
Alphabet (Google) is the fourth most valuable company, with a market capitalization of 1.7 trillion USD [
28]. In 2021, Alphabet’s revenue amounted to app. 257 billion USD [
28].
Google Inc. was founded in 1998 as an online search company. Since 2004, Google has extended its activities to a variety of other lines of business. Presently, Google is a subsidiary of Alphabet Inc. holding company and offers more than 80 products and services worldwide. The largest business is Google, which is reported in two segments: Google Services and Google Cloud [
42].
Google Services’ core products and platforms include ads, Android, Chrome, hardware, Gmail, Google Drive, Google Maps, Google Photos, Google Play, Search, and YouTube [
42]. The main source of revenue is still advertisements. Other sources of revenue are generated from Google Play (sales of apps, in-app purchases, and sales of digital content), hardware sales (e.g., Google Pixel, Fitbit charge, Chromecast with Google TV, Google Nest Cams and Nest Doorbell, and other devices), and YouTube (Premium and TV subscriptions). Google Cloud business generates revenue from the Google Cloud Platform (infrastructure, platform and services, licensing, service fees and subscriptions) and Google Workspace (collaboration tools for enterprises). In order to support the rapid growth of cloud services, Alphabet is heavily investing in infrastructure under the sea. Presently, the company is the largest owner and investor in submarine cable networks worldwide. In total, Alphabet has invested in 20 subsea cable projects around the world [
43,
44].
Alphabet (Google) started its acquisitions in 2001. Until now, Alphabet has acquired more than 240 businesses. The most influential acquisitions are Android (2005), YouTube (2006), DoubleClick (2007), AdMob (2009), Motorola Mobility (2011), and Waze (2013). Alphabet business activities focus on both platforms and hardware. Those acquisitions have allowed Alphabet to build a large ecosystem of complementary services and products around the Google Search business. The Android operating system is available for license by third-party device manufacturers. It represents a different approach from Apple iOS, which is unavailable to other device manufacturers. All Google-supported devices have pre-installed Google Search, Google Play Store, and some of the most popular Google Services, such as the mapping service, Google Maps, the web browser, Chrome, as well as Gmail and YouTube. Google Search is set as the default search engine even on Apple devices. The Google Search engine is also tied closely to Google’s own Shopping Services/platform. All Google Search results favor Google’s own shopping services over services offered by competitors.
In 2018, the European Commission found evidence that, when an app is pre-installed on devices, it is used more than on devices where users must download it. The EC stated that more than 95% of all searches were made via Google Search on Android devices. On the other hand, on Windows Mobile devices, where Google Search and Chrome are not pre-installed, less than 25% of all searches were made via Google Search [
45]. In the same report, the European Commission concluded that Google has engaged in two instances of illegal tying: first, the tying of the Google Search app, and second, the tying of the Google Chrome browser [
45].
All those integrations of Google products and services tie users to Google platforms due to the ease of accessing them, a better deal offering, and good digital experiences across Google platforms. Through its universal sign-in account service and a large number of complementary products, services, and devices, Alphabet has managed to convince users to use services offered within their business ecosystem to a large extent. Moreover, if Android device users want to switch to another OS, they lose their data, contacts, and apps.
Alphabet is not only using its offering to tie app users but also app developers and cloud computing customers. For example, app developers have to use a core set of features from the Google Map Platform, and they are not allowed to use any component of the Google Maps core Services with mapping services provided by non-Google companies [
46]. Moreover, developers need to have a Google Cloud account to have an API key to access Google Maps.
Another important aspect of Google’s activities is the collection and use of data. Google’s integration across markets allowed the company to capture increasing amounts of data. Google Android services are available on mobile phones, tablets, personal computers, TVs, smart watches, and other devices. Using Google services requires having a Google account, which means that the user profile exists on all Google platforms. Through the extension of online services, Alphabet can gain a broader picture of its users. This knowledge can be used to improve and expand its existing offerings.
4.5. Meta (Facebook)
Meta Platform, Inc. (Facebook Inc.), as of March 2022, has a market capitalization of app. 545 billion USD [
28]. This makes Meta the world’s ninth most valuable company [
28]. The annual revenue for 2021 was app. 118 billion USD [
28]. Presently, Meta is the largest social networking platform in the world.
Facebook was launched in February 2004. At first, only Harvard University students had access to the social network service. Since then, Facebook has acquired over 3.6 billion [
47] active users who use one or more of Facebook’s Family of Apps every month, and more than 200 million businesses use Facebook’s tools to reach customers. In October 2021, Facebook Inc. changed its corporate name to Meta Platform, Inc.
Facebook’s core services are completely free and supported by ads. Users can create their profiles, upload pictures, videos, and connect with other users across platforms and devices without paying for them. Meta substantially generates all of its revenue from advertising by displaying ad products on Facebook, Instagram, Messenger, and third-party affiliated websites or mobile applications.
Since 2004, the company has expanded far beyond its social networking platform. Services that are provided by Meta Platform, Inc. are Facebook, Instagram, Messenger, and WhatsApp, which are referred to by Meta as a Family of Apps, and Reality Labs. The company is also investing in subsea cable projects. So far, Meta is involved in two submarine cable investments and plans to invest in eight new submarine cables, which will be ready for service at the latest in 2025 [
48].
Meta’s Family of Apps was positioned at the forefront of the most popular social networking apps globally in 2021 [
49]. Meta offerings include messenger services, photo and video sharing, augmented reality, and many other apps and services. The Family of Apps enables people to connect and communicate with friends, family, groups, and businesses, as well as to share and discover new content and common interest. All services are available through multiple devices such as mobile devices, personal computers, and others.
Reality Labs is a part of the company dedicated to augmented and virtual reality. It was established on 25 August 2020, and includes augmented, virtual reality, and Metaverse-related hardware, software, and content. In October 2021, the company announced that Reality Labs would begin to report its revenue separately from Facebook’s Family of Apps [
50]. The main focus of the Reality Labs division is the development of the Metaverse and augmented reality products, such as AR glasses and AI-powered software that track and respond to user activity. In 2021, Reality Labs reported losses of 10 billion USD. Zuckerberg explained that the company is investing in finding its next stage of growth: “…we’re focused on the foundational hardware and software required to build an immersive, embodied internet that enables better digital social experiences than anything that exists today” [
51].
Facebook’s core activities related to social networking services have progressed towards a so-called de facto monopoly position over time. The growth of Facebook has been run by a strong network effect and lock-in mechanism based on very deep emotional ties among the participants. Since 2012, mergers and acquisitions have been key to growing Meta businesses. To date, the company has acquired nearly 100 companies. The main mergers and acquisitions of the company focused on: (1) popular companies within social networking and messaging services, of which the largest acquisitions have been, e.g., WhatsApp, Instagram, Face.com; (2) hardware and virtual reality companies, such as Oculus Virtual Reality, CTRL-labs, BigBox VR, Lemnis Technologies, Scape Technologies [
52], etc., which are integrated with Reality Labs; (3) niche software companies; and recently (4) blockchain, e.g., Chainspace.
In the case of Facebook, horizontal mergers and acquisitions are clearly represented by the acquisitions of WhatsApp and Instagram. From the demand-side economies of scope perspective, those acquisitions increased the utility users can get from Facebook services. From simple connecting with friends, family, and communities of people to sharing photos and videos and calling each other for free.
The Facebook Platform has been designed in a way that makes it possible to connect the different applications to Facebook’s social graph. At first, Facebook offered social networking possibilities mainly with friends and family. Later, Facebook introduced a more extensive social graph, which allows its users to network with distant/weak social ties as well. Features on the Platform, such as Groups, Events, Local pages, Messages, Wall, Likes and reactions, facilitate networking among people that share the same passion or between different communities. Facebook’s family of products is the perfect example of product offerings that attract and keep users on the platform. Presently, beyond social interaction services, Meta offers Facebook shops (2015), Facebook Marketplace (launched 2016), and Facebook dating (2019). Facebook has also introduced services aimed at entertainment, e.g., Watch, Feeds, Facebook gaming (2018).
Bundling of products and services is also visible in Meta’s new business activities related to virtual and augmented reality. The new virtual reality products (Oculus Quest 2 Virtual Reality Headset, Smart glasses) and platform (Horizon Worlds social VR platform) have been increasingly integrated with the Facebook social networking platform. The Metaverse brings additional convenience to users by enabling sharing immersive experiences with colleagues, friends, and family beyond 2D screens. Even though it was stated that everybody can use the Oculus products with only an Oculus account, in reality, without a Facebook account, users do not have access to any social features such as sharing gaming skills and scores.
Through social networking, content-oriented services, and the new virtual reality products, Meta has been able to tie in its users to the platform by offering differentiated services and a wide-ranging social experience. The integration of a broad range of products/services/applications on one platform makes it easier for users to have access and increase their satisfaction.
5. Analysis
The five companies described in the previous section differ in various ways. A few simple facts are listed in
Table 1, and, in the following, we analyze their differences, as well as their similarities.
Microsoft and Apple are the two oldest of the five companies, founded in 1975 and 1976, respectively. They are not among the oldest IT companies as such but are from a period in time where computers reached residential users as personal computers. Amazon, on the other hand, dates to the beginning of the web and the dot-com bubble in the 1990s. Amazon barely survived the dot-com crash in 1999–2001 but has become one of the world’s absolute biggest and strongest IT companies. This also applies to Google (later to be renamed Alphabet), which was inaugurated in 1998, and which also survived the crash. The last of the five companies, Meta, was established as Facebook in 2004. In contrast to the three first-mentioned companies, neither Google nor Facebook had a well-established business model when they were started up. They first built up a large base of users and later started making money on advertisements and knowledge on their users. The results have been amazingly successful, with Google (Alphabet) and Facebook (Meta) totally dominating the online advertisements market around the world.
In fact, the five companies that are often lumped together as the five US-based Big Tech companies differ in many ways and do not represent a sector, which also—as pointed out by [
53]—creates various problems in terms of regulation. As de Streel and Larouche [
53] explain, the specific kinds of regulations that are presently being rolled out in the EU with the Digital Markets Act (DMA) are neither traditional competition regulation nor sector-specific regulations. The same applies to the US. However, the companies also have a number of commonalities. They all have been able to build strong elements of demand-side economies of scale, based on network effects, both single-sided and cross-sided. They have also built important aspects of demand-side economies of scope in the shape of bundling of services and products and assembling knowledge on their users. Furthermore, all companies have been very apt at constantly renewing themselves by continuously updating their core products and services and adding new product and service areas. They all have a high degree of ambidexterity as a core element in their strategy.
In
Table 1, it is indicated that investments in R&D for all five companies have sky-rocketed during the past decade. This especially applies to Amazon, which has gone from app. 2.9 billion USD of annual R&D investment in 2011 to app. 56 billion USD in 2021. With respect to investments in general, investments in undersea cables have become very important for all five companies. The Big Tech companies do not want to be too dependent on the arrangements of traditional telecom operators for international connectivity. In order to connect their server parks around the world, these companies invest heavily in undersea cables in particular. In the case of Meta, having capacity on networks to service their many end users in Africa is also important. Meta is currently involved in building the undersea cable 2Africa together with network operators. These investments of the Big Tech companies indicate that, though the focus for most of them is on software, services, and applications, they invest in network infrastructure when necessary. The scope of their activities thus develops into physical infrastructures.
Table 1 and the case descriptions also indicate that the five companies all have extensive acquisition strategies. However, a supposition saying that, over time, companies, when they become big, rely more on acquisitions than on in-house development of new products and services [
54], is not supported by the data on these five companies. In addition, there can clearly be differences in the strategic approaches of the companies in this regard, including over time. However, from the data on acquisitions and on R&D investments, it is not obvious that the focus consistently varies between the companies.
The five companies analyzed obviously differ with respect to scope (and scale) in different ways.
Table 2 presents seven dimensions related to the scope of companies. The scope of products and services offered is not equally broad. Apple, for instance, is more focused than Amazon. Furthermore, scope can vary with respect to being primarily horizontal and/or vertical. Microsoft, for example, has to a large extent stayed away from the hardware side and concentrated on software, except for a few instances, as opposed to Apple. The importance of Multi-Sided Platforms (MSPs) as central elements in their business strategies also differs. Amazon, Google, and Facebook started as two- or multi-sided platforms, while Microsoft and Apple have added these kinds of platform elements at a later stage, with LinkedIn in the case of Microsoft, which is still a sideline service area for Microsoft, and with the App Store, which has become a central part of the overall business strategy for Apple.
This also implies that the centrality of demand-side economies of scale and demand-side economies of scope varies between the companies. Demand-side economies of scale was initially not as important for Apple before the App Store as it was, all the while, for Amazon, Google, and Facebook, as well as for Microsoft and its Office products. Another important element that, for instance, Gawer [
55] has discussed is the transaction and/or innovation character of platforms. The Amazon.com Online Stores and Google Store are clearly transaction platforms. The same applies to the App Store and Google Play in the application markets. Apple iOS, Google Android, and Amazon Web Services, on the other hand, are innovation platforms, which also applies to Microsoft Windows. Finally, that the most important elements in a demand-side economies of scope strategy are bundling and tying in and the use of data on users may also differ. However, this is more in the specific manners in which these strategies are used. Bundling, as well as the use of data on users, play a central role for all five companies.
6. Discussion
The concept of the scope of companies is closely related to discussions on the boundaries of companies. In a seminal paper from 2021, Gawer [
55] analyzes the boundaries of digital platforms with respect to the interplay of firm scope, platform sides, and digital interfaces. The purpose is to enhance the understanding of how the boundaries of companies develop when taking the interplay between known research areas (firm scope, platform sides, and digital interfaces) into consideration, i.e., how can results from these research areas be used for extending our knowledge on the boundaries of firms—what determines the boundaries of firms? This is a topic that has been extensively researched by the transaction cost economics tradition (building on Coase [
56] and Williamson, e.g., [
57]), but also in the tradition of research into the resources and capabilities of companies (building on, e.g., Barney [
58]), as Gawer [
55]) emphasizes. In addition, as we have seen in the theory part of the present paper, the issue of transaction costs, at an early stage, entered the research on scope economies with the contribution by Teece [
12].
However, the focus of the paper by Gawer [
55] is on the boundaries of companies, while the focus of the present paper is on the basis for scope economies. This means that our focus is on the mechanisms facilitating scope, so to say, internally, and not on the boundaries nor how the companies in question cooperate with other companies belonging to the same ecosystem of companies. The two different foci, however, complement one another and should both be part of research on scope and boundaries, which was an important point made by Teece [
12] in his paper on
Economies of scope and the scope of the enterprise. Among the many good observations that Gawer [
55] makes is that asset specificity in the IT area is relatively lower than asset specificity in many other production areas.
Computers are general-purpose technologies and software can be combined in innumerable ways. This is a strong basis for economies of scope, as new products and services can be combined with and build on existing hardware and software platforms. Whether this necessarily leads to extending the boundaries of individual companies or whether it leads to improved possibilities for cooperation between independent companies is an issue for empirical investigation and for concrete case studies. Insourcing or outsourcing is not only determined by whether it is technologically possible, and transaction costs, therefore, could be lower. It is also determined by the aim of building market power and the aim of appropriating the value added created by insourced activities.
The basic tenet of the present paper is that there are two main aspects of demand-driven/demand-side economies of scope, namely, bundling/tying and the use of data on users. The bundling aspect is easily understood and was already analyzed by Henten and Godoe [
9] in 2010 with respect to triple and quadruple play offered by telecom companies (Internet access, telephony, IPTV, as well as mobile in the case of quadruple play). What drives scope in such cases is the complementarity and possible interoperability, and at any rate, convenience, for the users. Obviously, this ‘convenience’ can be ‘assisted’ by tying in customers to packages of products and services on the part of companies. Yet, it is the user side that drives the scope.
When one looks at the use of data on users, the issue is different. In this case, data are either voluntarily given by users or extracted from the users with or without their knowledge and consent. This knowledge is essential for improving and customizing existing services and products of the companies and for adding new service and product areas. In fact, knowledge on users has always been important for all companies; however, previously, this has mainly been background knowledge for developing and selling services and products. Today, data and knowledge on users are intrinsic parts of delivering the experience that services and products stage. The user side provides an essential input to development and production.
As in the case of demand-side economies of scale, there is obviously a relationship between the demand side and the supply side. Even though the mechanism that drives scale in the case of positive externalities in connection to network effects is on the demand-side, the hardware and software facilities on the supply side have to be provided in order to accommodate for the demand-side effect. The same applies to demand-side economies of scope. To the extent that the demand-side factors of bundling and data on users drive the scope of production, it is necessary to build scope on the supply side.
The fact that we have demand-side effects regarding scale, as well as scope, does not mean that the two kinds of mechanisms work in the same manner and with the same effects. Demand-side economies of scale, except for the cases where different companies work on the basis of technologies and standards, which are the same for all these different companies, potentially lead to winner-takes-all markets. Users agglomerate around one (or a few) technologies and companies in order to reap the benefits of network externalities. This does not, in the same manner, apply to demand-side economies of scope. In principle, the bundling effect works for individual users. There can easily be companies competing side-by-side on the basis of bundling strategies. With respect to the use of user data, this is different. If we only deal with strict customization, knowledge on the individual user could be sufficient. However, it is the combination of big data on many users and knowledge on the individual users which constitutes the basis for customizing, upgrading, and developing or incorporating new services and products.
For the companies to develop into gigantic tech corporations, it is thus the combination of scale and scope economies that creates this development track. This is clearly seen in the case of the Big Tech companies dealt with in this paper. They all combine elements of scale and scope economies driven by the demand side. This does not, however, mean that scale and scope always work well together and strengthen one another. There can be instances where emphasis is on scale and not scope. Facebook, for example, put all emphasis on building scale at the beginning. A scope strategy could easily have taken attention away from the prime activity of building scale. While scope can thus stand in the way for scale, the opposite is hardly the case. Though there can be instances and periods in time where companies do not wish to develop scale, in the long run, almost all companies strive for some level of scale. However, the calibration of scale and scope is an important strategic factor to take into consideration.
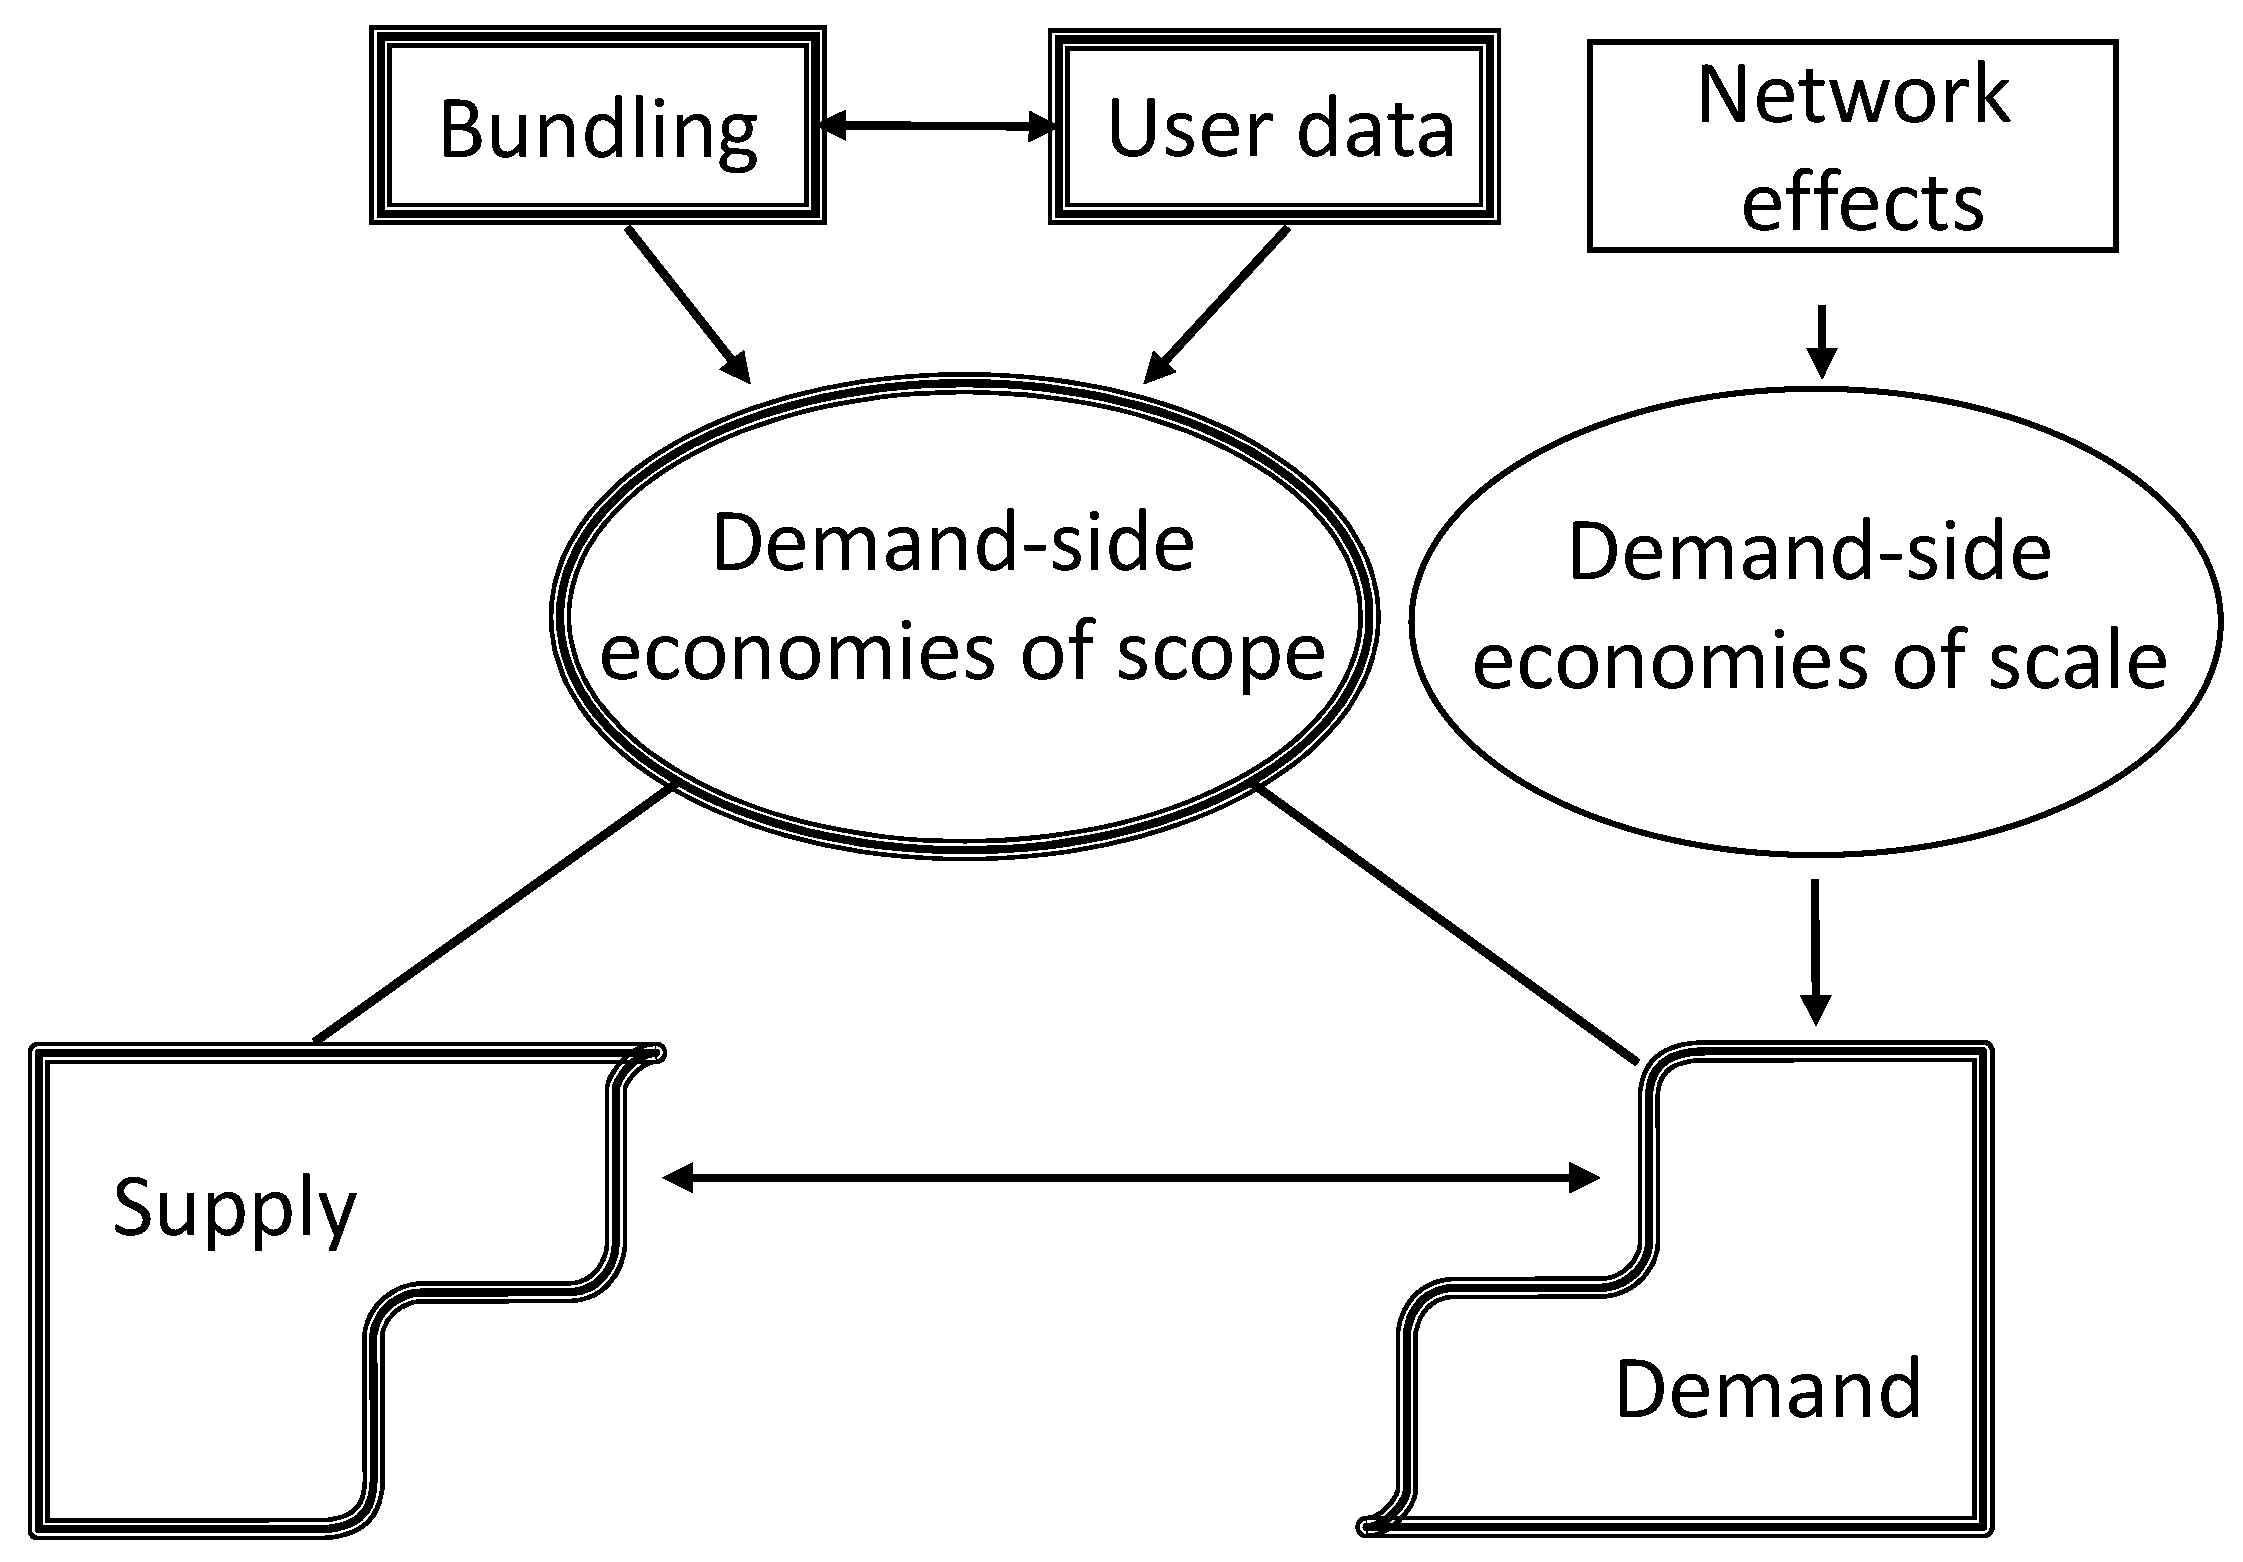
An important issue, when analyzing demand-side economies of scale and demand-side economies of scope, is whether these two aspects are somehow parallel (see
Figure 1). In the sense that demand-side factors are important in both instances, there are similarities. However, there are also considerable differences. While demand-side economies of scale, based on network effects expanding the value of companies providing services and contributing to potential growth, are founded on the increased value to the users, with growing numbers of users and the relationships between these users, the bundling effect creating demand-side economies of scope is related to the individual user.
Yet another issue is data on users. In this case, companies acquire data on their users that can be utilized for customizing and upgrading existing services and products and for establishing new lines of production, as the user data can be utilized for different services and products. It is the combination of big data on many users and the knowledge on the individual user that facilitates this. Furthermore, these kinds of data can be used for tying in customers. Tying in is not only a question of forcing users to buy bundles of services and products. Knowledge on users can also be utilized for tying in customers, as the knowledge that companies have on their users facilitates customization and the creation of special relationships between companies and their users.
A basic difference between demand-side economies of scale and demand-side economies of scope is thus that demand-side economies of scale based on network effects could be said to work independently of the supply side. The increasing utility to the users and, therefore, the potential growing number of users develop as long as there is capacity on the network. Demand-side economies of scope, on the other hand, require interaction between the demand and the supply side. Bundling requires that the company provides the different services to be bundled, and use of data requires that the company takes advantage of these potentials. One could say that that demand-side economies of scale are based on an interaction between users on the demand side, while demand-side economies of scope are based on interaction between the demand and the supply side.
7. Conclusions
The overall purpose of the present paper is to attract attention to the issue of economies of scope for platform research. Hitherto, most attention has been on network effects and demand-side economies of scale, on the role of platforms in lowering transaction costs for the different sides of the platforms, and on the importance of big data. The latter point on data, however, has seldom been related to economies of scope, but has mainly been used to explain how separate service and product areas have been developed, applying user data.
In a sense, scope economies have been living a ‘shadow existence’, while all emphasis has been on demand-side economies of scale. Indeed, the importance of demand-side economies of scale can hardly be over-emphasized, but economies of scope are also essential for the impressive growth of Big Tech corporations. Indirectly, this has been accepted for a long time, as most regulatory interventions are aimed at the scope aspects of the corporations in question. There is thus a mismatch between the economic analyses of Big Tech corporations and the regulatory provisions being developed.
While scale economics has for a longer while been giving much attention to direct and indirect network effects, including two- and multi-sided markets/platforms, and has thus been emphasizing the demand side more than the supply side, this has not been the case with scope economics. Here, practically no interest has been on the demand side. Therefore, the primary aim of the present paper is to introduce the importance of the demand-side factors in the economies of scope related to Big Tech corporations.
There are two general areas driving demand-side economies of scope that are dealt with in the paper. One is concerned with bundling of services and products, and the other one with the acquisition and processing of data on users and their activities using digital services and applications. In the paper, six additional dimensions related to the scope of companies and their strategies are discussed, namely:
Focused vs. diversified
Horizontal and/or vertical
Scale and/or scope
Transaction and/or innovation platforms
Centrality of MSPs
M&A and/or in-house development
All these dimensions are important for the implications of scope economies for companies. A limitation of the paper is that these dimensions need to be further analyzed in order to better understand the scope of companies. Furthermore, in future research, the differences and similarities between demand-side economies of scale and economies of scope must be further examined. The prime purpose of the present paper has been to attract attention to the overall topic of economies of scope driven by the demand side. In addition, empirical research into M&As and in-house service and product development of Big Tech and other platform companies and the role of economies of scope, including demand-side economies of scope, need to be further developed. Moreover, an important line of research is how regulation of Big Tech develops and how analyses of demand-side economies of scope can contribute to improving regulatory measures.


