Abstract
China’s rapid technological growth and aggressive globalization policies have led to an increasing interest in Chinese patents abroad. This study uses strategic emerging industries (SEIs) that are important for the future development of the world as examples and constructs a novel dataset of Chinese SEI patents abroad (1993–2017) to explore the spatiotemporal evolution and determinants of the geography of these patents. Our results show that the number of Chinese SEI patents abroad is growing rapidly, and the new-generation information technology industry is increasingly dominating, accounting for approximately 50% of all SEI patents abroad. Chinese SEI patents abroad are highly concentrated in the United States, Western Europe, and East Asia, and their influence is gradually spreading from African countries to developed countries. The host country’s intellectual property rights (IPR) protection level, technology market size and imitation risk have significant positive effects on Chinese SEI patents abroad, while the host country’s high-tech product market size and competition risk have negative effects on Chinese patents abroad. The conclusions provide new information for understanding Chinese patents abroad activities and the motivation of China’s technology globalization and provide evidence from an emerging country for research of the international diffusion of technology innovation.
1. Introduction
The world has experienced an unprecedented internationalization of economic activity during the last three decades [1,2]. The increasingly integrated global economy is boosting the globalization of firms’ technological activities, which also calls on innovators to make new decisions about what, where, and how to expand their technologies on a global scale [3,4]. As an important way for technological inventors to protect their interests on a global scale, patents abroad have become an important part of discussing national technological development in the context of globalization. According to the World Intellectual Property Organization (WIPO), from 1995 to 2021, the number of international patent applications through the WIPO Patent Cooperation Treaty (PCT) system increased from 40,005 to 274,890 [5]. The rapid growth of the number of international patent applications is closely related to the globalization and regionalization of patent protection and technology diffusion. In 1883, the Paris Convention for the Protection of Industrial Property was signed in France. It was the earliest international convention on intellectual property in the world and started the globalization of patent protection [6]. At the end of the 20th century, in order to better promote the global spread of technology and economic development, the WIPO was established, and its promotion of the Patent Cooperation Treaty greatly simplified the foreign patent application process and promoted the internationalization of technology. At the same time, the European Patent Convention, the Lusaka Agreement and other regional treaties also play an important role in the process of regionalization of patent protection. The TRIPs agreement under the Uruguay round further links the protection of intellectual property rights with trade. Developed countries hope to expand their markets through patents abroad [7], and developing countries hope to use patents abroad to improve their technological innovation level and international competitiveness [8].
Patents abroad have been given growing attention in economic geography [2,4] and policy studies [9]. Many studies have focused on the motivations of international patent extensions [10,11,12], however, these studies have mainly focused on developed countries, and less attention has been paid to the overseas patenting behavior of developing countries. The main reason for this phenomenon is that current technological innovation, especially in high-technology industries, is still dominated by developed countries. However, in recent years, developing countries, represented by China, have achieved phenomenal growth in the economic and technological fields, and they have made great achievements in building their capacity for science and technology and indigenous innovation [13,14]. The number of PCT patent applications in China increased from 103 in 1995 to 69,576 in 2021, and China surpassed the United States in 2019 to become the country with the largest number of PCT patent applications. With the rapid development of China, scholars are increasingly focusing on its performance in the globalization of science and technology [15,16,17]. On the one hand, the geography of Chinese patents abroad reflects the trend of China’s technological globalization. As one of the fastest growing countries in science and technology in recent years, it is important to explore the dynamics of Chinese patents abroad activities to understand the new trends in the diffusion of global technological innovation. On the other hand, Dang et al. (2019) pointed out that the strategies regarding patents abroad may differ for different countries [18]. Taking China as an example, it can verify whether the existing research conclusions based on developed countries are equally applicable to developing countries, and it can also supplement the existing theories according to China’s conclusions. It is of great significance to expand and enrich the current mainstream theory. Therefore, in the wave of globalization, especially in the context of China’s vigorous promotion of independent innovation, what is the trend of Chinese patents abroad? What is the geography of Chinese patents abroad and what factors influence the geography of Chinese patents abroad? Are these conclusions the same as those based on studies in developed countries? These issues are very attractive research topics at present [8].
This paper attempts to answer these questions by analyzing the patents abroad of China’s strategic emerging industries (SEIs) from 1993 to 2017. SEIs are crucial in guiding the future development of the economy and society. They are the commanding elevation competed for among major countries in the world in new rounds of economic and technical development [19]. The Chinese government has identified nine major industries as SEIs: the new-generation information technology industry, the bioindustry, the high-end equipment manufacturing industry, the new material industry, the new energy industry, the intelligent and new energy vehicle industry, the energy conservation and environmental protection industry, the digital creative industry, and related services. The development of these industries is a core part of China’s state-led catch-up strategy [20]. In this paper: (1) We propose a way to more accurately portray Chinese SEI patents abroad activities and analyze the temporal and spatial characteristics of Chinese SEI patents abroad from 1993 to 2017, providing new information for understanding the dynamics of China’s international technology diffusion. (2) We use the negative binomial regression model to explore the determinants of the geography of Chinese patents abroad as a way to analyze the motivations for China’s international technology diffusion, providing emerging country-based evidence for the study of international technology diffusion.
The rest of this paper proceeds as follows: Section 2 reviews the available literature on patents abroad. Section 3 introduces the data and methods used in the study. Section 4 presents the results of the analysis of the temporal and spatial characteristics of Chinese SEI patents abroad. Section 5 discusses the determinants of the geography of Chinese SEI patents abroad. Finally, the main conclusions are provided in Section 6.
2. Literature Review and Hypotheses
2.1. Patents Abroad, Innovation Capacity and Technology Globalization Strategy
Patents abroad are the product of technological globalization [21], usually referring to applicants patenting their inventions in foreign countries (i.e., outside their own country) [11]. Because the cost of patents abroad is higher than that of domestic patents, patents applied for in foreign countries often have higher quality and higher expected benefits. Some inventions have no economic value, and consequently, the patentees would never attempt to obtain a patent abroad [1,9]. Therefore, patents abroad are generally considered to represent a more accurate measure of the excellence of a national technological system [22]. They are a better indicator of a country’s innovation capacity than domestic patents, especially from an international comparative perspective [23,24,25].
In the context of globalization, patents abroad can also reflect the direction of the technology diffusion and technology globalization strategic information of enterprises to some extent [26,27,28]. Eaton and Kortum (1996) pointed out that when applicants seek patent protection where they are, it means that is where they want the innovative technology to be used [29]. Thus, because foreign patenting is not undertaken carelessly, we believe that it may convey considerable information about patterns of technology diffusion. Dechezlepretre et al. (2011) argued that if an invention is patented in a host country, it means that the invention will be commercially exploited in the host country, for example, to protect the home country’s exports of products to or investments in production in the host country or to collect royalties and licensing fees [30]. This process is closely related to international technology diffusion and technology globalization. On the other hand, patenting in any additional country leads to further costs; therefore, firms do not patent their inventions in every country but rather choose the most applicable locations [31]. This selection process includes evaluating the potential economic value of the patent, planning the international development of the enterprise, forecasting technological development in overseas markets and other factors. Hence, the decision to patent abroad takes on a strategic character rather than the character of a simple short-run decision [1,32,33,34].
2.2. Determinants of Patents Abroad
The explosive growth of patents abroad has attracted the attention of economics and innovation scholars [1,29,35]. Revealing the motives for cross-border patenting behavior has always been the key research objective in the field of international patenting, where market coverage and competitive threats are the two dominant hypotheses [36,37]. The market coverage hypotheses suggest that with the globalization of technology, the demand for trade or investment between the home and the host countries is expanding, which increases the risk of exposing home country intellectual property rights to potential imitators. At the same time, the demand for advanced technology in host countries is increasing along with their own development; thus, the propensity of home countries to apply for patents in host markets is increasing. A large amount of the literature relates to the decision to seek international patent extensions with increasing market size in host countries, as the commercial exploitation of patented technologies in host countries is a major motivation of foreign inventors [3,29,38,39]. The size of a market indicates to a considerable extent the potential for exploiting a firm’s knowledge resources in that market [40]. Bosworth (1980) studied U.S. patents abroad and found that the size of the host market facilitates U.S. patents abroad [41]. Using European countries as an example, Dachs and Pyka (2010) found that cross-border patents between two countries increase with the absolute market size of the host country [10]. Using the case of Swedish firms patenting abroad, Maurseth and Svensson (2014) found that the propensity of firms to apply for international patent protection increases with the host market size indicator [7]. However, the conclusions of previous studies are based mainly on developed countries, which are often in the high-value-added part of the global value chain, and advanced technology gives them a competitive advantage overseas; therefore, the size of the host market has a catalytic effect on overseas patents for these countries. As China is a developing country and “world factory” [42], its exported high-tech products are still mainly assembled and processed, and the comparative advantage of its high-tech product exports is still based on cheap labor rather than core technology. Thus, it is still in the low-value-added segment of the global value chain in the field of high-tech industries [43]. Therefore, when the size of the product market in the host country increases, it may encourage China to attempt to capture the market with labor-intensive products, while negatively affecting overseas patents. In addition, in previous studies, the main focus has been on the size of the host country’s commodity market, and less attention has been paid to the technology market. Paci et al. (1997) found that guaranteeing the payment of royalties from the granting of production licenses is the factor that affects firms’ decisions to protect their inventions abroad [22]. Royalties and license fees have become increasingly important sources of international income [1]. Licensing technology to a host company in the form of royalties not only generates revenue for the patent holder but also promotes the widespread use of the technology. Therefore, inventors will have a greater propensity to file patents in countries with larger technology markets. Based on the previous discussion of the market size in the host country, we propose the following two hypotheses:
Hypothesis 1:
The larger the market for goods in a host country, the less inclined China is to obtain patents in that country.
Hypothesis 2:
The larger the market for technology in a host country, the more inclined China is to obtain patents in that country.
The competitive threat hypothesis holds that strategic motives to block the entry of potential competition or to gain other strategically advantageous positions increase the propensity of home countries to file patents in the host country. On the one hand, numerous studies have pointed out that a key aim of patenting is to impede other agents in a destination country, particularly local competitors, from imitating the new technology [1,29,31]. There are large differences in the level of technological innovation among different host countries, and the higher the technological level of the host countries, the stronger the imitation ability. Therefore, many scholars point out that with the improvement of the technological level of the host country, the tendency of the home country to apply for patents in the host country will also increase [12]. Yuan and Li (2021) use the battery electric vehicle industry as an example to find that the innovation capability of the host country is an important driver of technology diffusion [44]. Cai (2020) believe that foreign patent applications in China are related to its capacity for technology innovation [45]. Second, since a similar technological base implies higher absorptive capacity and higher potential for imitation [46], it is reasonable to believe that patent applications are more likely to arise between countries with similar technologies. For this reason, some studies have also considered technology gaps between countries [4]. Archontakis and Varsakelis (2011) adopted the gravity model to analyze the patents of the United States in the 27 countries of the European Union and found that a smaller technological gap between the source country and the destination country indicates that the destination country has a greater ability to absorb the knowledge created in the source country [11]. Therefore, the risk of imitation increases, which motivates the registration of patents in the destination country. Sharma et al. (2022) studied cross-country patenting activity in 36 countries from 2001 to 2015 and found that a high technological gap between host and home countries reduces the inflow of patents to host countries [47]. On the other hand, another key aim of patenting is to protect the home country’s market share in the host country, i.e., to prevent exports from other countries to the host country [31]. Faust and Schedl (1983) assumed that it would be necessary for industrialized countries to secure their market shares abroad against their main competitors by patenting [35]. Huang and Jacob (2014) concluded that the important driver of quadic patenting is the extent of foreign penetration into the host market [34]. Cai et al. (2020) found that foreign patent applications in China depend on the market decisions of competitor countries [45]. Based on the above analysis, we make the following assumptions:
Hypothesis 3:
The stronger the imitation ability of the host country, the greater the tendency for China to obtain patents in that country.
Hypothesis 4:
The more competition with China there is in the host market, the greater the propensity for China to obtain patents in that country.
In addition, the level of intellectual property rights (IPR) protection in the host country is considered to be an important determinant of patents abroad activity in the home country [48,49,50]. Huang and Jacob (2014) confirmed the positive effect of a strong IPR regime on patenting by analyzing a dataset containing 38 countries [34]. Yang and Kuo (2008) found that countries with stronger IPR protection offer a legal environment that can increase, ceteris paribus, foreign inventors’ propensity to patent and seek shelter from imitation, which results in a greater number of issued patents, particularly in countries where a strong imitative threat exists [51]. Ivus et al. (2017) analyzed U.S. multinational firms and found that a strengthening of patent protection in the host country increases firms’ overseas patent applications and technology transfers [52]. It is therefore reasonable to assume that the level of IPR protection in the host country is an important factor in attracting Chinese patents abroad. Based on the above analysis, we make the following assumption:
Hypothesis 5:
The higher the level of IPR protection in the host country, the greater the propensity for China to obtain patents in that country.
3. Methods and Data Resources
3.1. Phase Division with Sequential Clustering Method
In this paper, we examine the geography of China’s patents abroad by SEIs from 1993 to 2017. Referring to relevant research, we use the sequential clustering method to further divide the period 2003–2017 into several phases based on the annual physical features of the patents abroad data [53,54]. Then, we analyze the frequency of patents abroad and their spatial distribution in different stages. The sequential clustering method is essential to ensure the continuity of the clustering results. The idea of this method is to regard each of the ordered samples as an independent cluster and to merge two clusters if they have the least increase in within-cluster variance. The algorithm of this method is described as follows:
where is the number of years, is the industrial sector, is the number of patents for industrial sector in year in cluster , is the mean value in cluster , and is the total within-cluster dispersion for the cluster.
Then, adjacent clusters and are merged, and the rise of dispersion cluster is calculated:
Clusters and are verged with the lowest value of until all clusters are grouped together.
3.2. Variables and Empirical Model
3.2.1. Dependent Variable
The dependent variable in the analysis is the count of granted SEI patents abroad obtained by China from 1993 to 2017. Based on previous research experience, we use patents granted rather than patent applications for several reasons. First, a count of patent applications would overestimate the level of innovation. For example, the patents granted rates of the world’s top five IP offices range from 50 to 80%, and many patent applications are rejected because they lack novelty or fail to meet other requirements [55]. Second, the count of patents granted has a higher private value than the count of those that are withdrawn or refused [40]. On the one hand, the search and examination procedures must confirm that the invention is novel with respect to the state of the art, industrially applicable and inventive. On the other hand, the exclusive exploitation of the invention induces a potentially higher return. Finally, granted patents abroad information allows us to know where the inventor would most like the patent to be used [56]. In addition, there is a lengthy administrative procedure for granting patents. We calculate the number of patents per year on the basis of the time when a patent is applied for rather than the time it is granted because it is the date closest to the invention date [22].
3.2.2. Independent Variable
This study focuses on the drivers of the geography of Chinese SEI patents abroad. Drawing on existing studies, we select variables to test our hypothesis in terms of both the individual characteristics of the host country and linkages between the two countries [11,49,57]. To test hypotheses 1 and 2, we select two variables from the individual characteristics of the host country, technology market size (tms) and product market size (pms), to study the impact of the host country market size on Chinese overseas patents. The technology market scale is represented by the import and export of intellectual property in the destination country, and the product market scale is represented by the import and export of high-tech products in the destination country. We choose the IPR protection level (IPR) of the host country as an independent variable affecting the spatial distribution of Chinese patents abroad to test hypothesis 3. We also incorporate the opening level of the destination country (open) [58], which is calculated based on the proportion of imports and exports to GDP. Then, we add indicators of country classifications (class) by the World Bank (1 = low income, 2 = lower-middle income, 3 = upper-middle income, 4 = high income), which is an ordered categorical variable. Generally, high-income countries tend to have stronger purchasing power and higher technological levels, which will attract other countries to apply for patents [41].
In terms of the connection between countries, we choose the technological proximity (techpro) between China and the host country as an indicator of imitation risk to test Hypothesis 3. The calculation formula is as follows [59]:
where is a vector representing the distribution of 89 technology categories for country in year . We use the share of China’s high-tech industry exports in the host country’s high-tech industry imports to indicate the degree of market competition (markf) in the host country and thus test Hypothesis 4. In addition, we use the distance between the capitals of the two countries to represent the geographic distance (dist) in millions of meters.
3.2.3. Empirical Model
The dependent variable is a strictly non-negative count variable, which suggests that both the negative binomial model and the Poisson model are preferable to linear regression models because they explicitly account for the non-negativity and discreteness of the dependent variable [34]. However, our dependent variables display considerable dispersion, and a likelihood ratio test confirms the violation of the equidispersion assumption. Therefore, we employ the negative binomial model, and standard errors are adjusted for the clustering of observations by country. According to the results of the Hausman test, we choose the fixed effects model. The model can be written as follows:
where is the individual fixed effect of country , which does not change over time; is the time fixed effect; and is the random error term of the model.
3.3. Data Resources and Processing
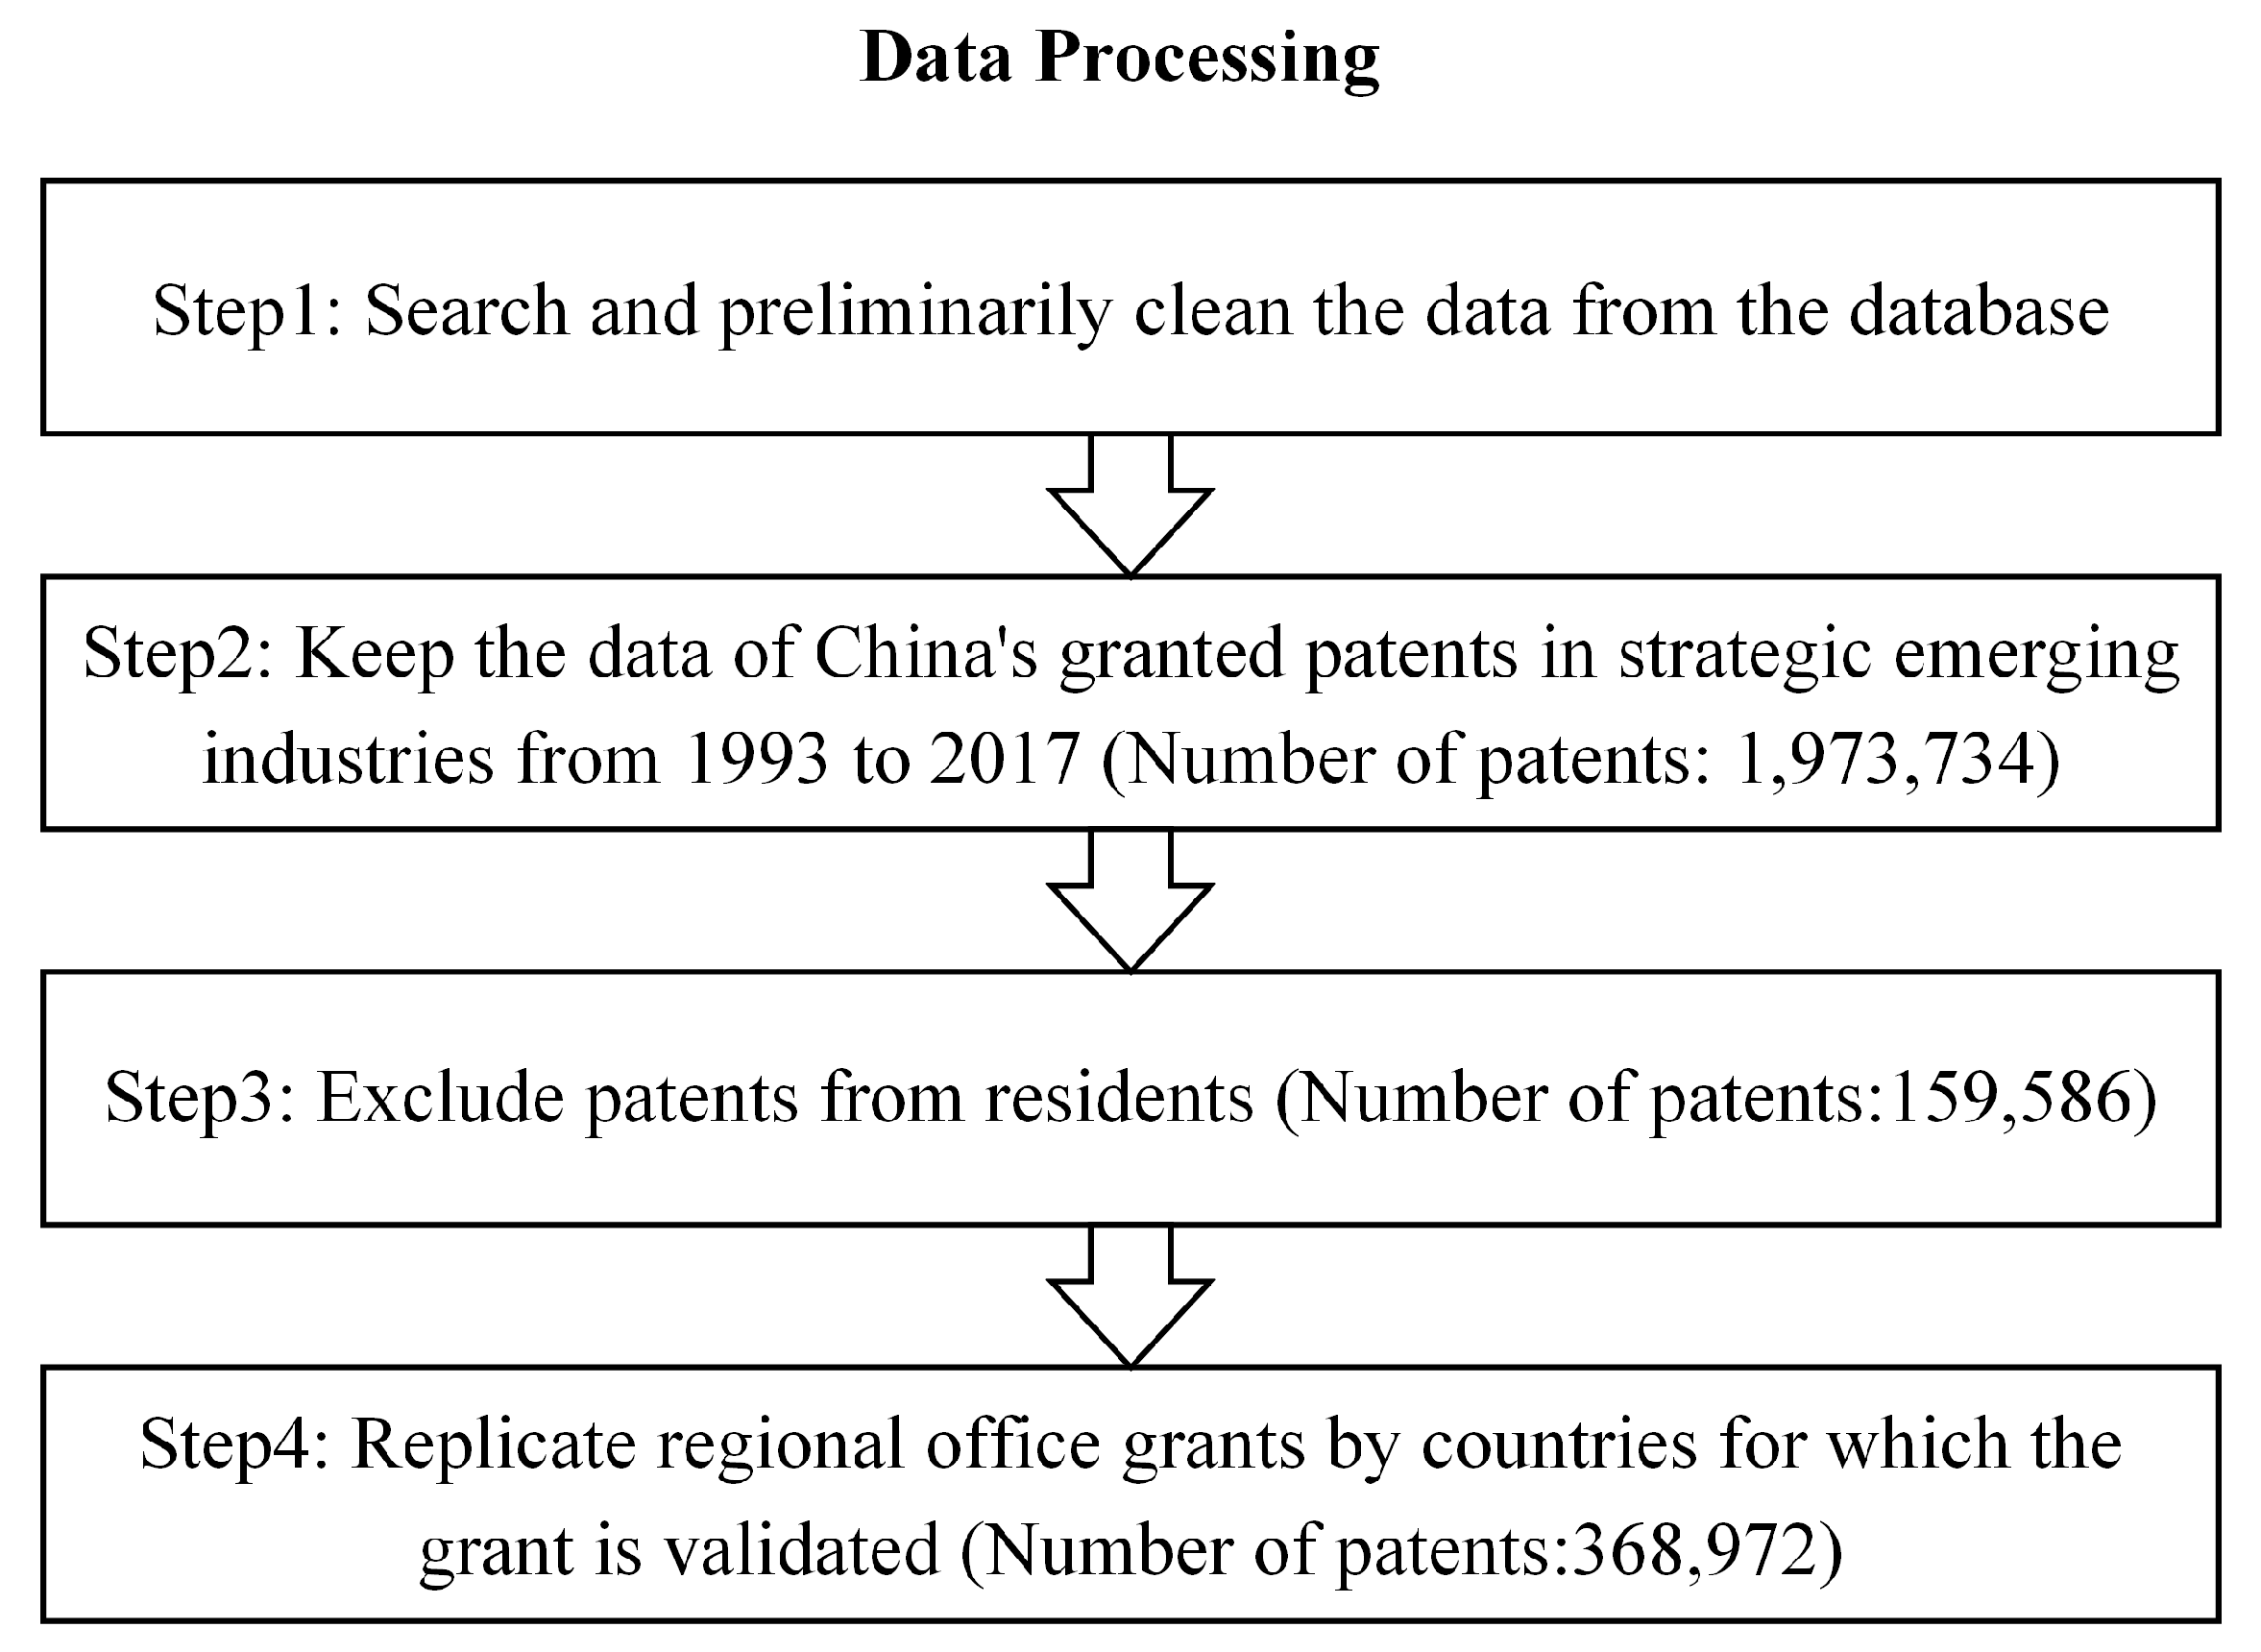
In this study, we construct a new dataset of Chinese SEI patents abroad through data mining and text recognition techniques. First, we use the Relationship Table of Strategic Emerging Industry Classification and International Patent Classification (2021) (Trial) published by CNIPA to obtain the granted SEI patents from the Lens patent database. This database is one of the most comprehensive and authoritative patent databases available and contains over 142.5 million global patent records; it is also an important source of support for many academic researchers [60,61,62]. Second, we search for the patent numbers of some patents with missing country information at the European Patent Office (EPO) or national patent offices to supplement the country information. We also determine the country of origin based on the first applicant [63] and subsequently extract all patent information for those for which the first applicant has a China address. To date, 1973.4 thousand SEI patents by China from 1993 to 2017 were obtained, including 159.6 thousand patents abroad (Figure 1).
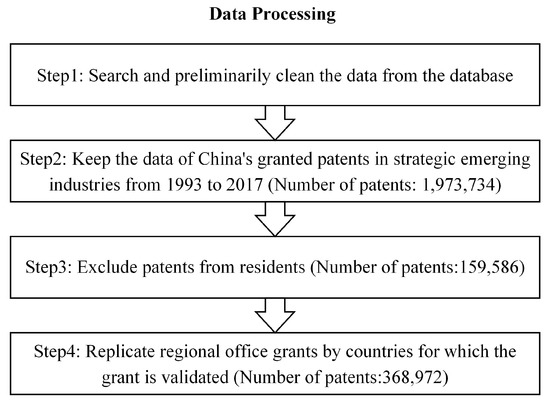
Figure 1.
China’s strategic emerging industry patents processing.
Due to the difficulty of determining the country of validity of a patent, regional offices such as the EPO have been removed from some previous studies [2,3]. However, this approach leads to the underestimation of the patenting activity of European countries and patenting activity in other countries at the EPO. To compensate for this deficiency, we use information on legal events in the Espacenet database and original documents of patents granted by other regional offices (e.g., African Regional Intellectual Property Organization (ARIPO)) to determine in which countries patents granted by regional patent offices are in force. Thus, we can obtain more comprehensive information on Chinese SEI overseas patents. It is important to note that in this study, the patent information of China does not include the data of Hong Kong, Macao, and Taiwan.
In this study, IPR is expressed by the Legal System and Property Rights index in the Economic Freedom of the World database. The tsm data come from the WTO bilateral trade in services database. The pms and markf data come from the UN Comtrade Database. According to the revision of the high-technology sector and product classification by Hatzichronoglou (1997) [64], we obtain the import and export data of high-tech products in each country obtained. The open and class data come from the World Bank Database, and the dist data come from CEPII. The number of PCT patent applications in host countries comes from the WIPO database.
4. Spatiotemporal Evolution of Chinese SEI Patents Abroad
4.1. Characteristics of the Surge of Chinese SEI Patents Abroad
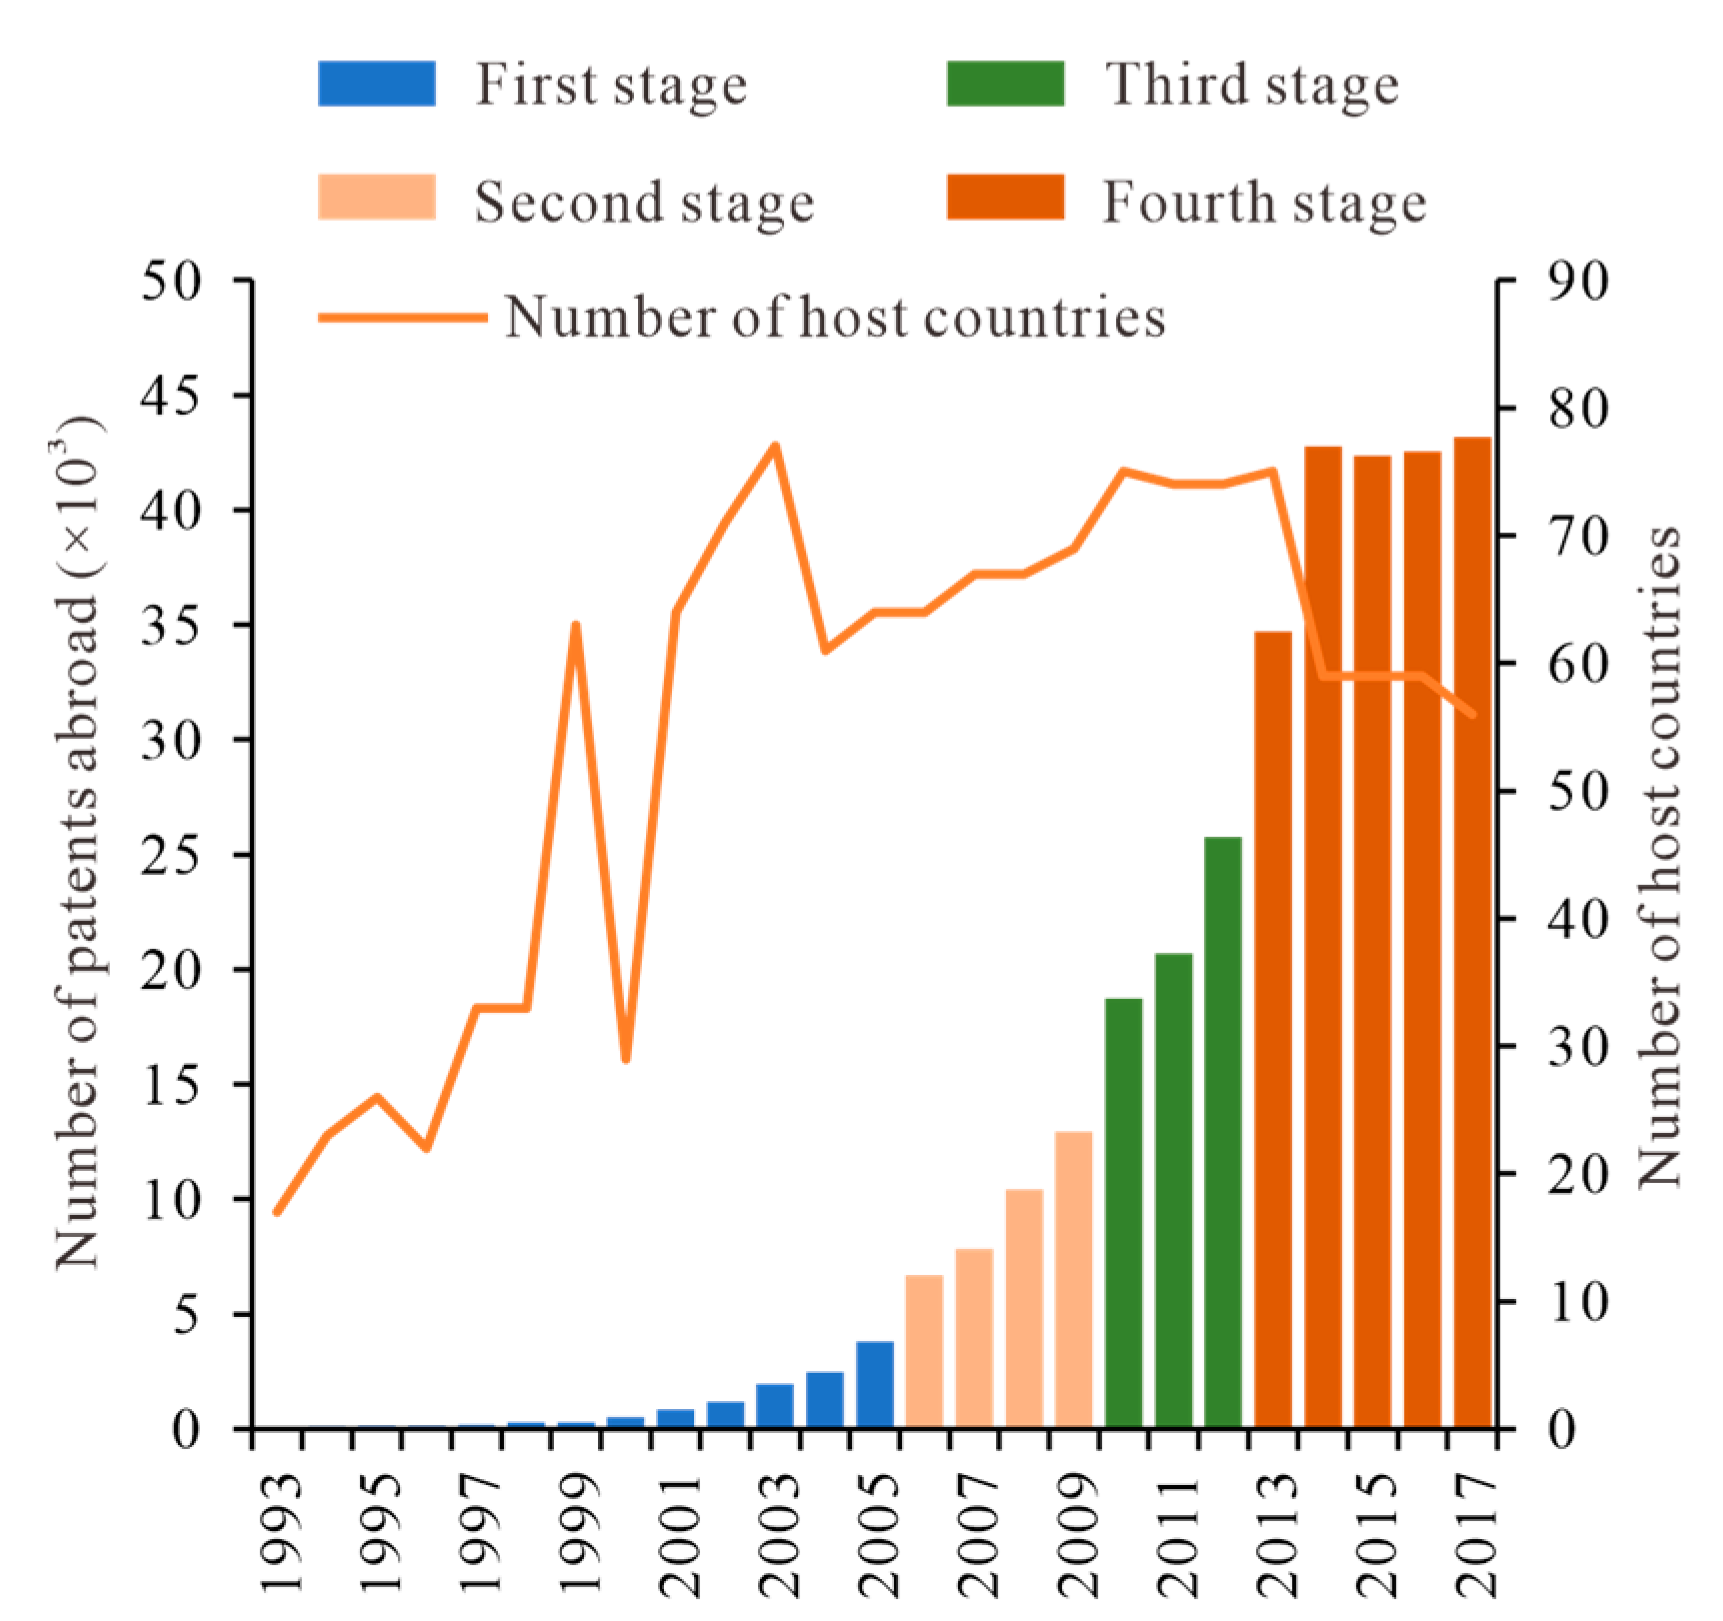
Since the beginning of the 21st century, China has actively integrated into the wave of scientific and technological globalization, and both the number of SEI patents abroad in China and the number of destination countries have increased significantly. In particular, the number of SEI patents abroad is growing exponentially. The development process of Chinese SEI patents abroad from 1993 to 2017 was classified into four stages by the sequential clustering method: 1993–2005, 2006–2009, 2010–2012, and 2013–2017. In the first stage (1993–2005), the number of SEI patents abroad in China was generally low (Figure 2). From 2000 to 2005, China’s 10th Five-Year Plan was in force. During this period, China began to advocate the combination of technology introduction and independent innovation and to prioritize the development of high-tech industries. Under the support and guidance of this policy, the number of Chinese SEI overseas patents increased, and international technological competitiveness improved significantly compared with the early 1990s. During this period, the number of destination countries for China’s SEI patents fluctuated greatly, possibly because China was in the early stage of patents abroad market exploration. The second and third stages were periods of rapid growth in the number of Chinese SEI patents abroad; the average annual growth rate in the second stage was 35.72%. The number of host countries also increased steadily during this period. In the fourth stage (2013–2017), the number of Chinese SEI patents abroad was historically high, but the growth rate slowed. Additionally, the number of destination countries decreased, reflecting the concentration of Chinese patents abroad in a few countries.
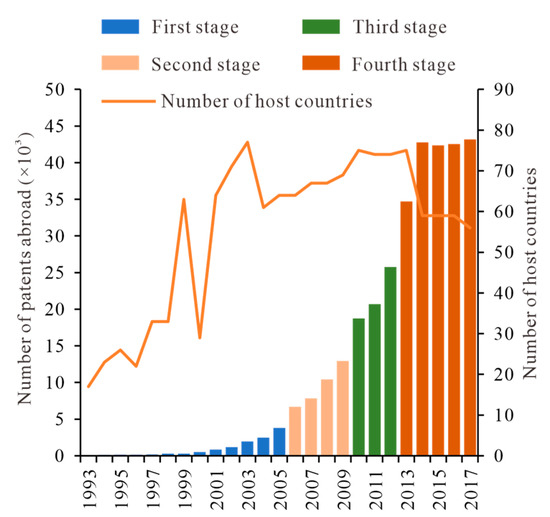
Figure 2.
Changes in Chinese SEI patents abroad and host countries, 1993–2017.
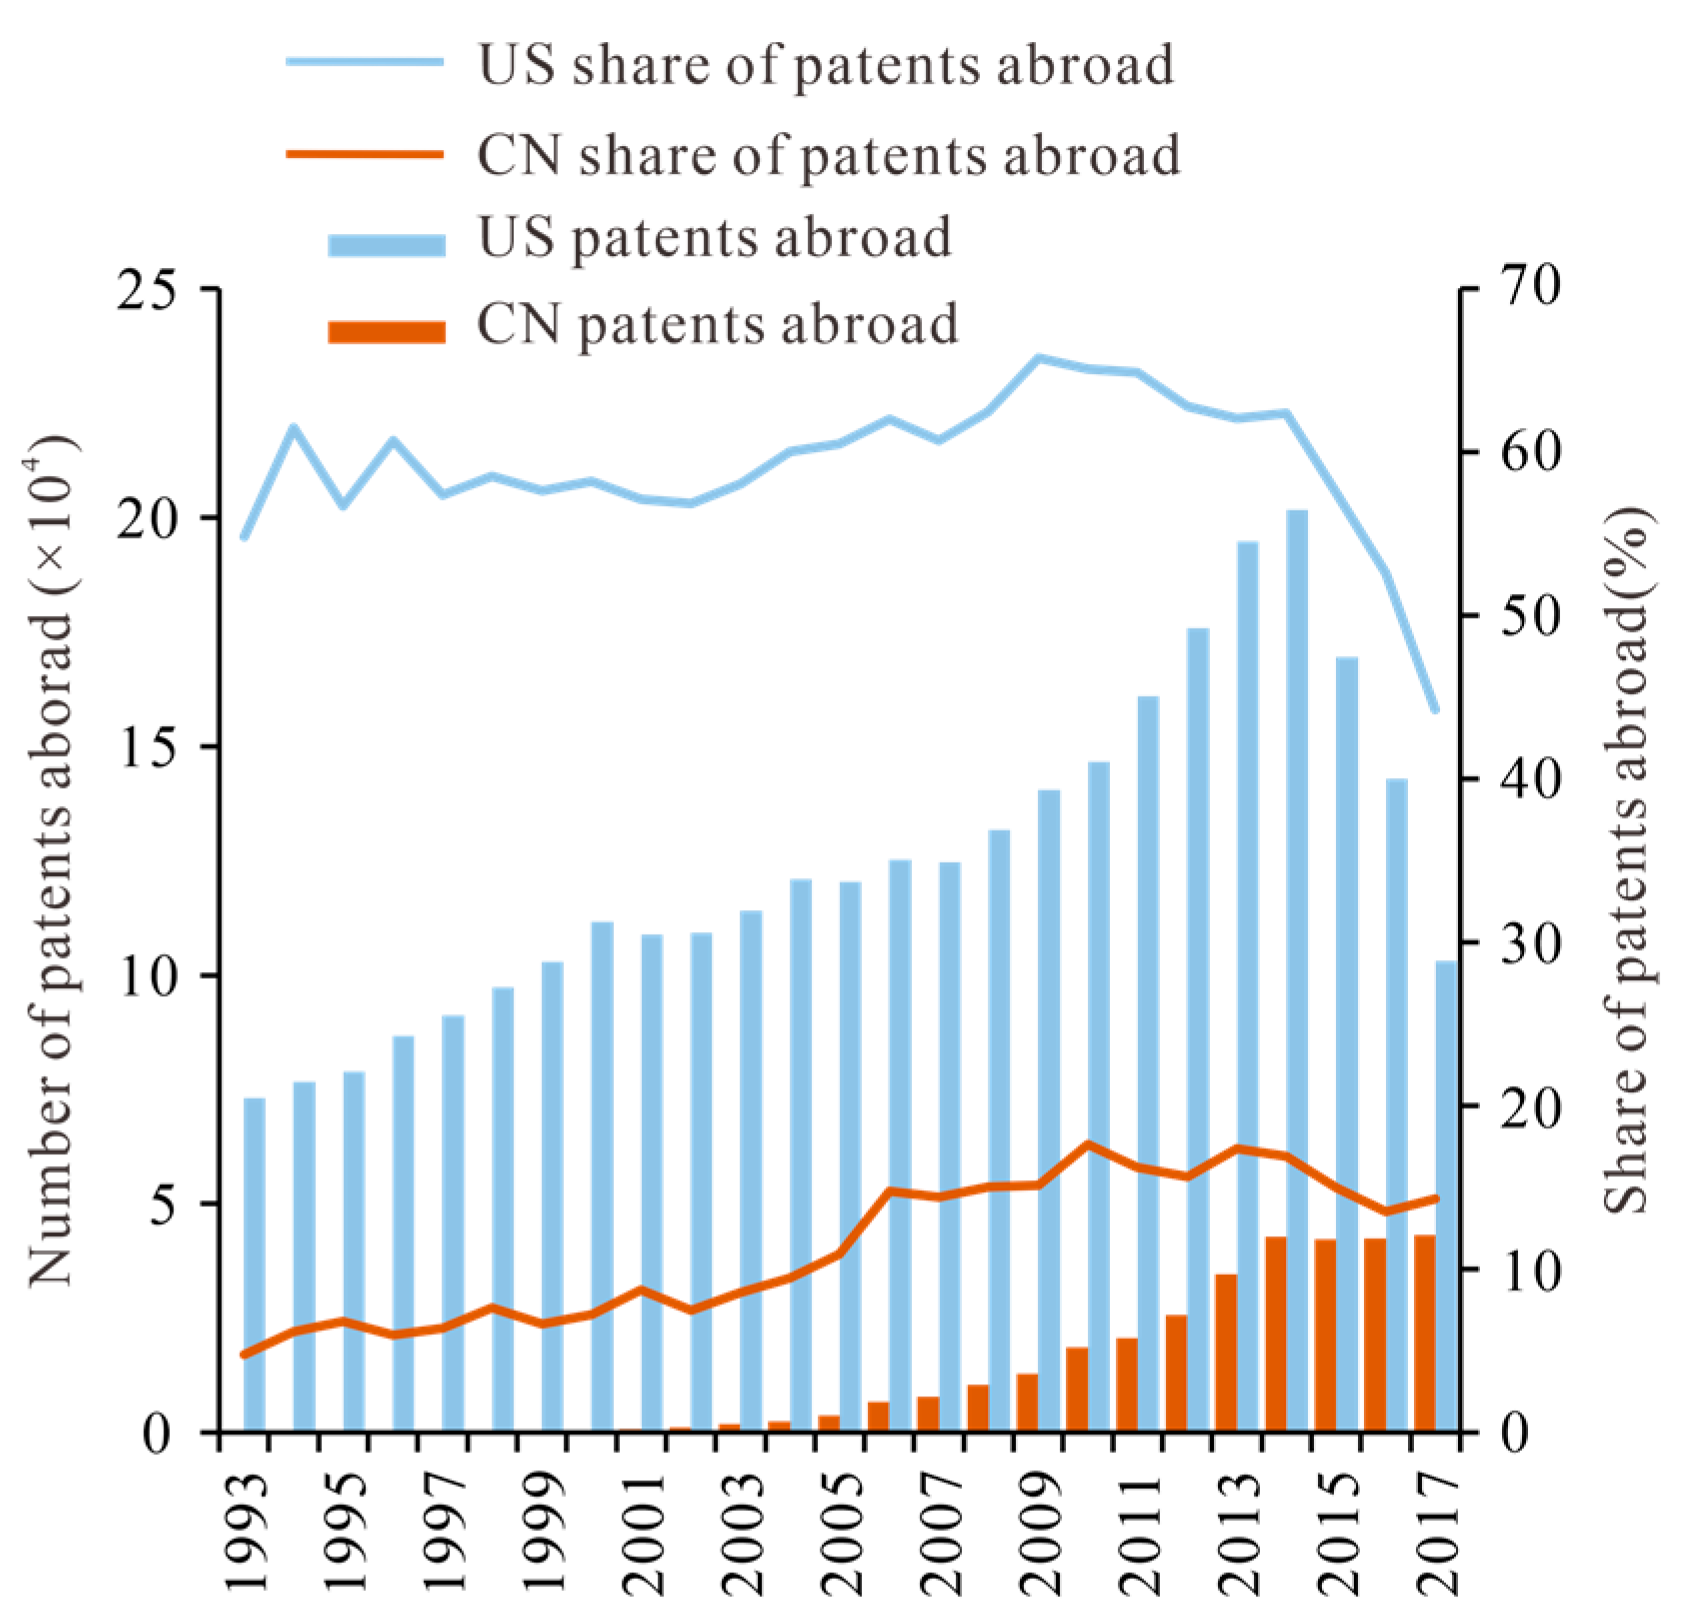
Despite the rapid improvement in technological innovation in China’s SEIs from 1993 to 2017, there is still a large gap compared to the United States, which has the largest number of SEI patents abroad (Figure 3). The number of Chinese patents abroad accounts for less than 20% of the total SEI patents, which is much lower than the figure for the United States. This indicates that China’s SEI patents are mainly in the domestic market, and there is still much room to improve the international competitiveness of Chinese SEI technologies.
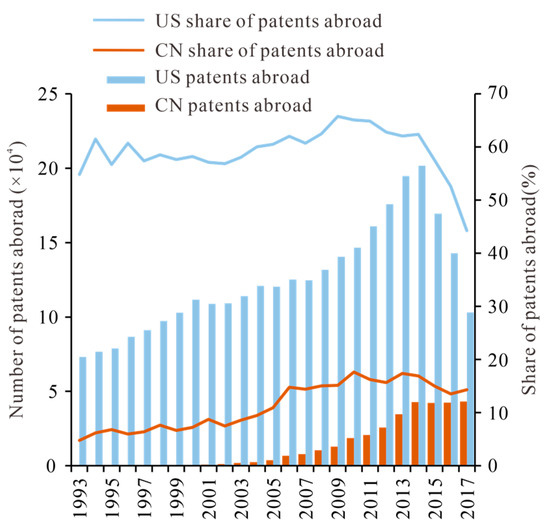
Figure 3.
Changes in the number and share of SEI patents abroad, 1993–2017.
4.2. Characteristics of the Industry of Chinese SEI Patents Abroad
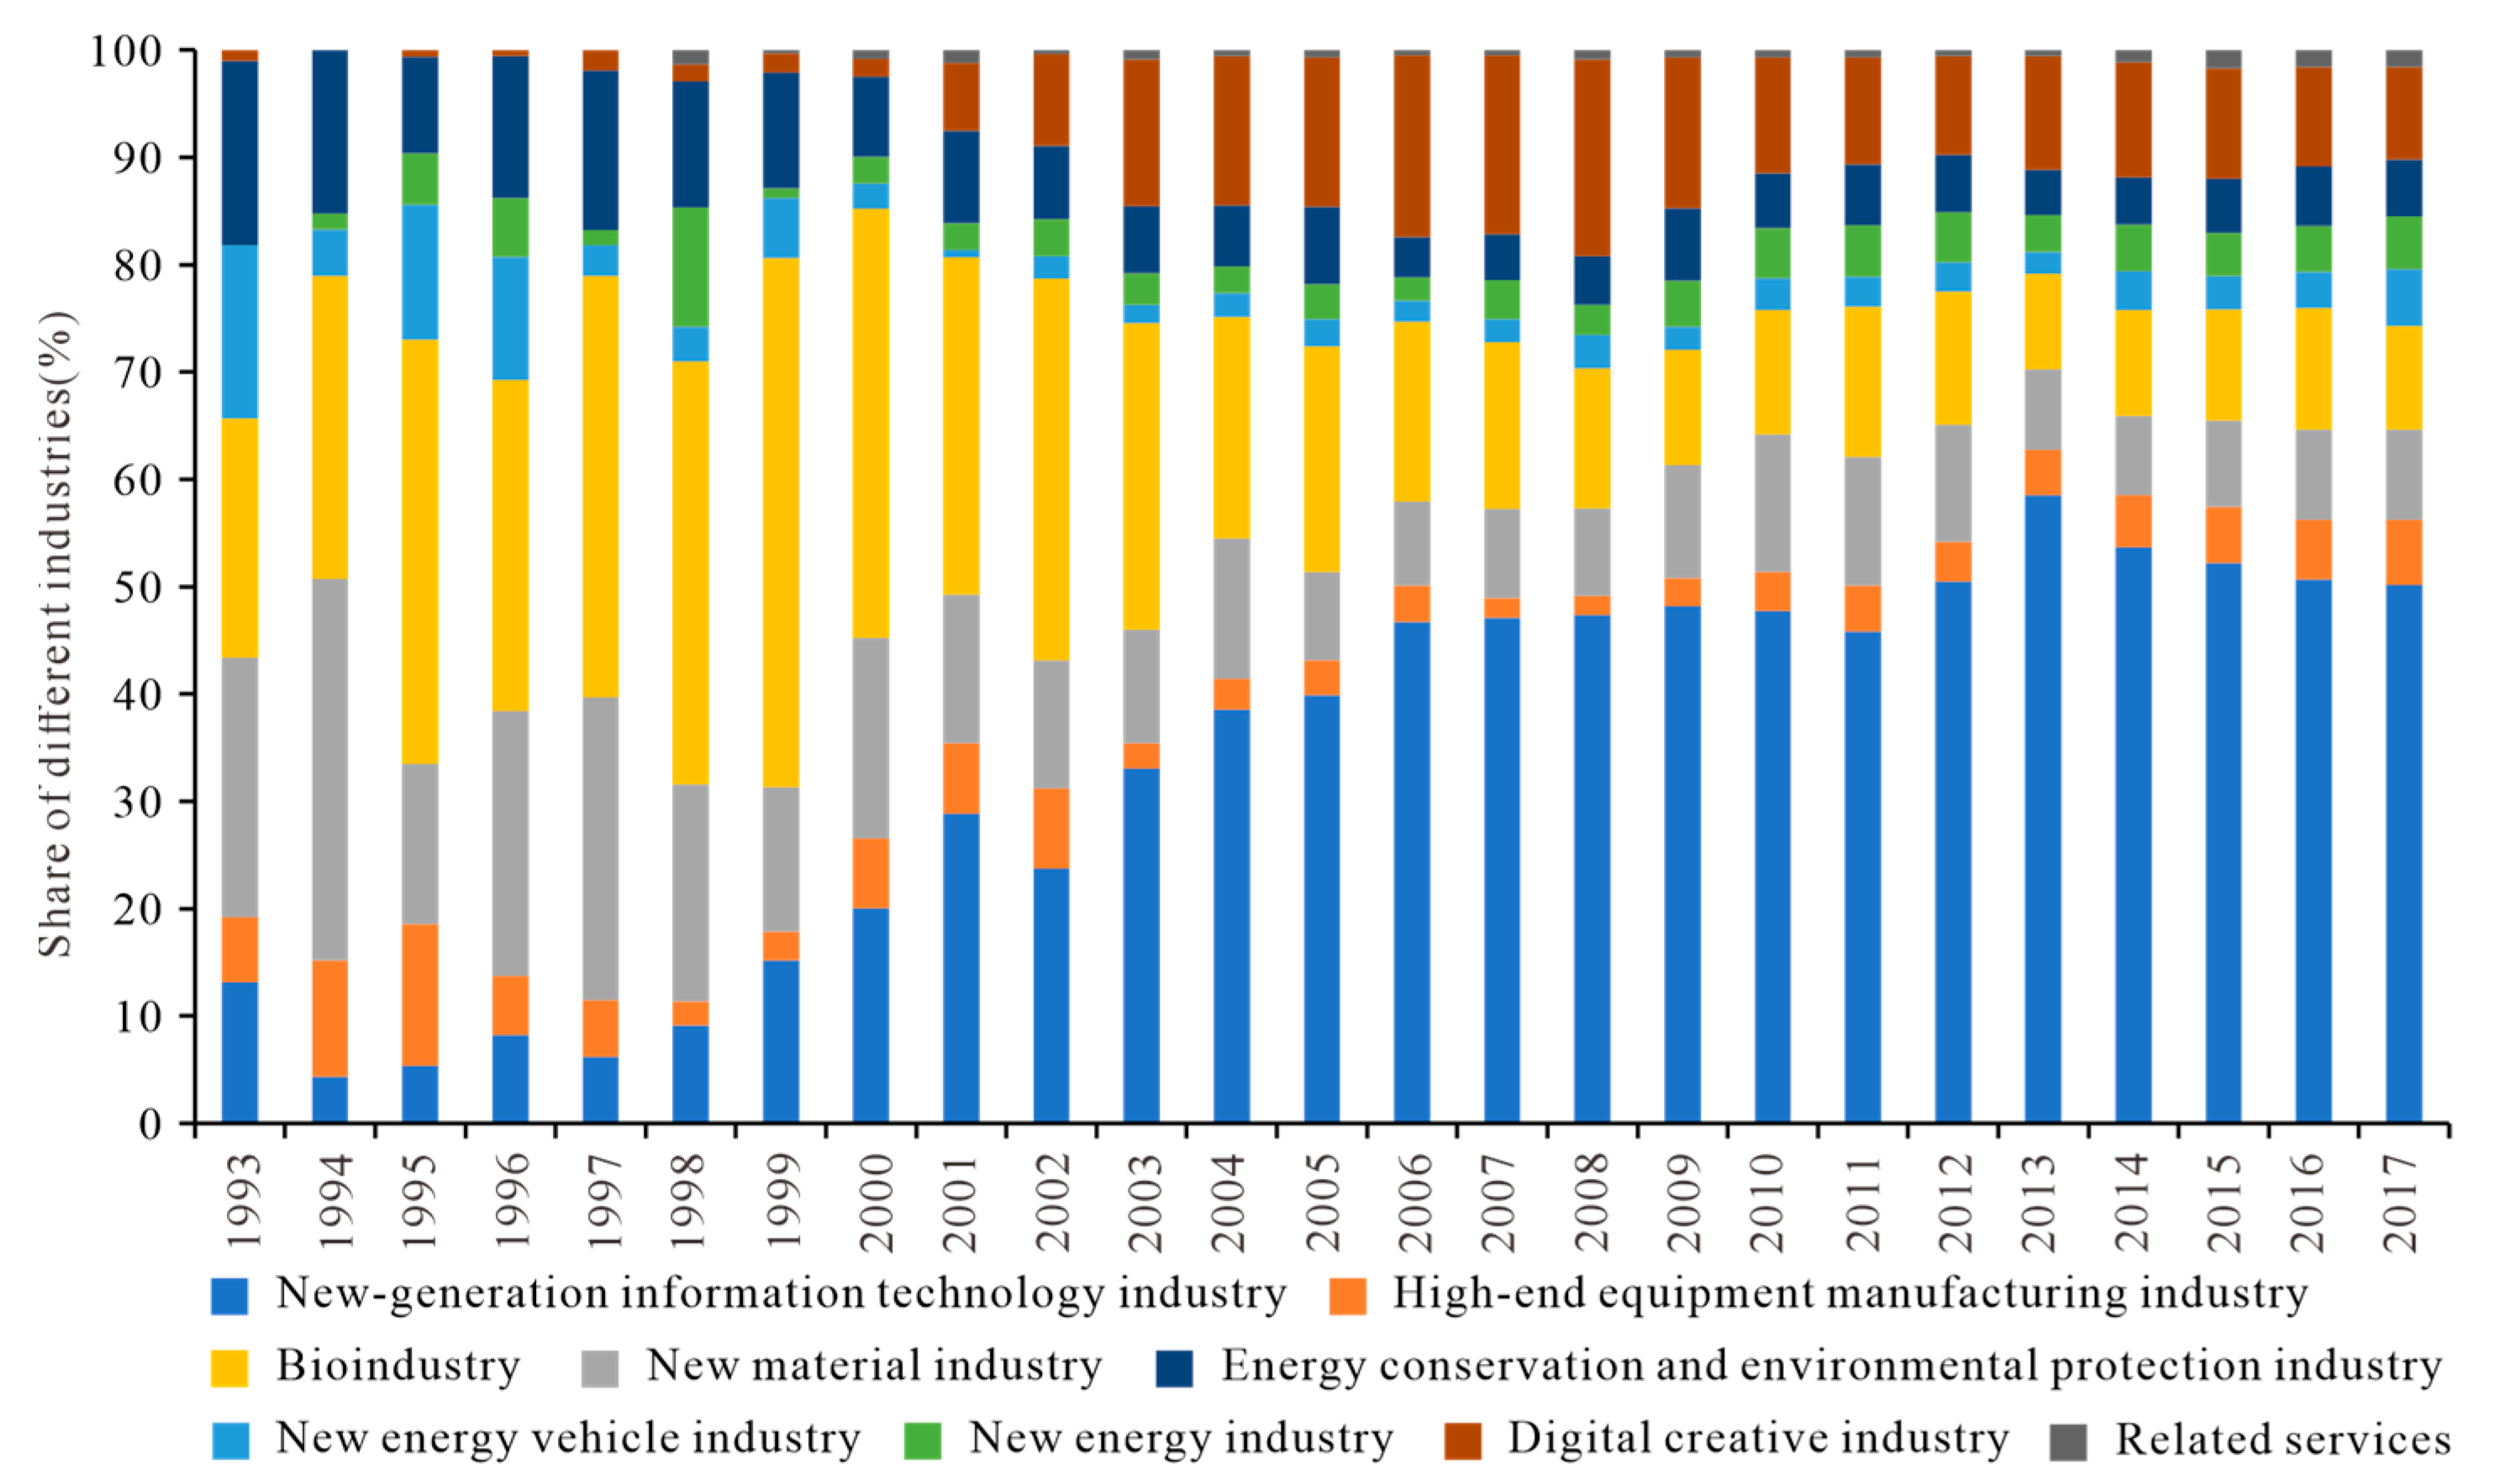
From the perspective of the industrial structure of SEI patents abroad, the new-generation information technology industry has developed most rapidly, accounting for approximately 50% of SEI patents abroad, gradually replacing the bioindustry as the most important part of SEI patents abroad. Before 2003, the patents abroad of the bioindustry and the new material industry were the two parts with the largest number of Chinese SEI patents abroad (Figure 4). Since 2003, the patents abroad of the new-generation information technology industry have grown rapidly, from 786 in 2003 to 27,469 in 2017, with an average annual growth rate of approximately 28.90%. The rapid growth of patents abroad in the new-generation information technology industry has benefited from technology companies such as Huawei, BOE, and ZTE. In the fourth stage (2013–2017), these three companies contributed 79.04% of the new-generation information technology industry patents abroad. This finding shows that Chinese SEI patents abroad, especially those in the new-generation information technology industry, rely heavily on “leading” companies. This is consistent with Eberhardt’s findings that the patent explosion is accounted for by a tiny, highly select group of Chinese companies in the information and communication technology (ICT) equipment industry [13]. The bioindustry, digital creative industry and new material industry are in the second echelon. The growth of patents abroad in other industries is relatively slow, and the development gap among the nine major industries is relatively large.
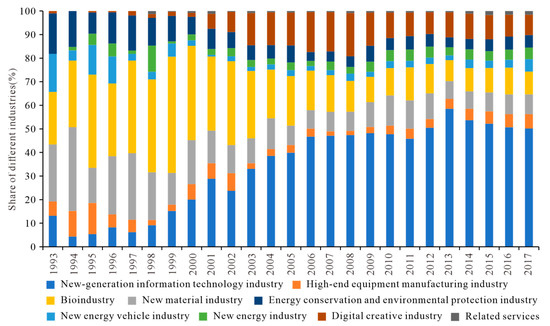
Figure 4.
Changes in share of patents abroad in nine industries, 1993–2017.
4.3. Geography of Chinese SEI Patents Abroad
4.3.1. Geography of Chinese SEI Patent Host Countries
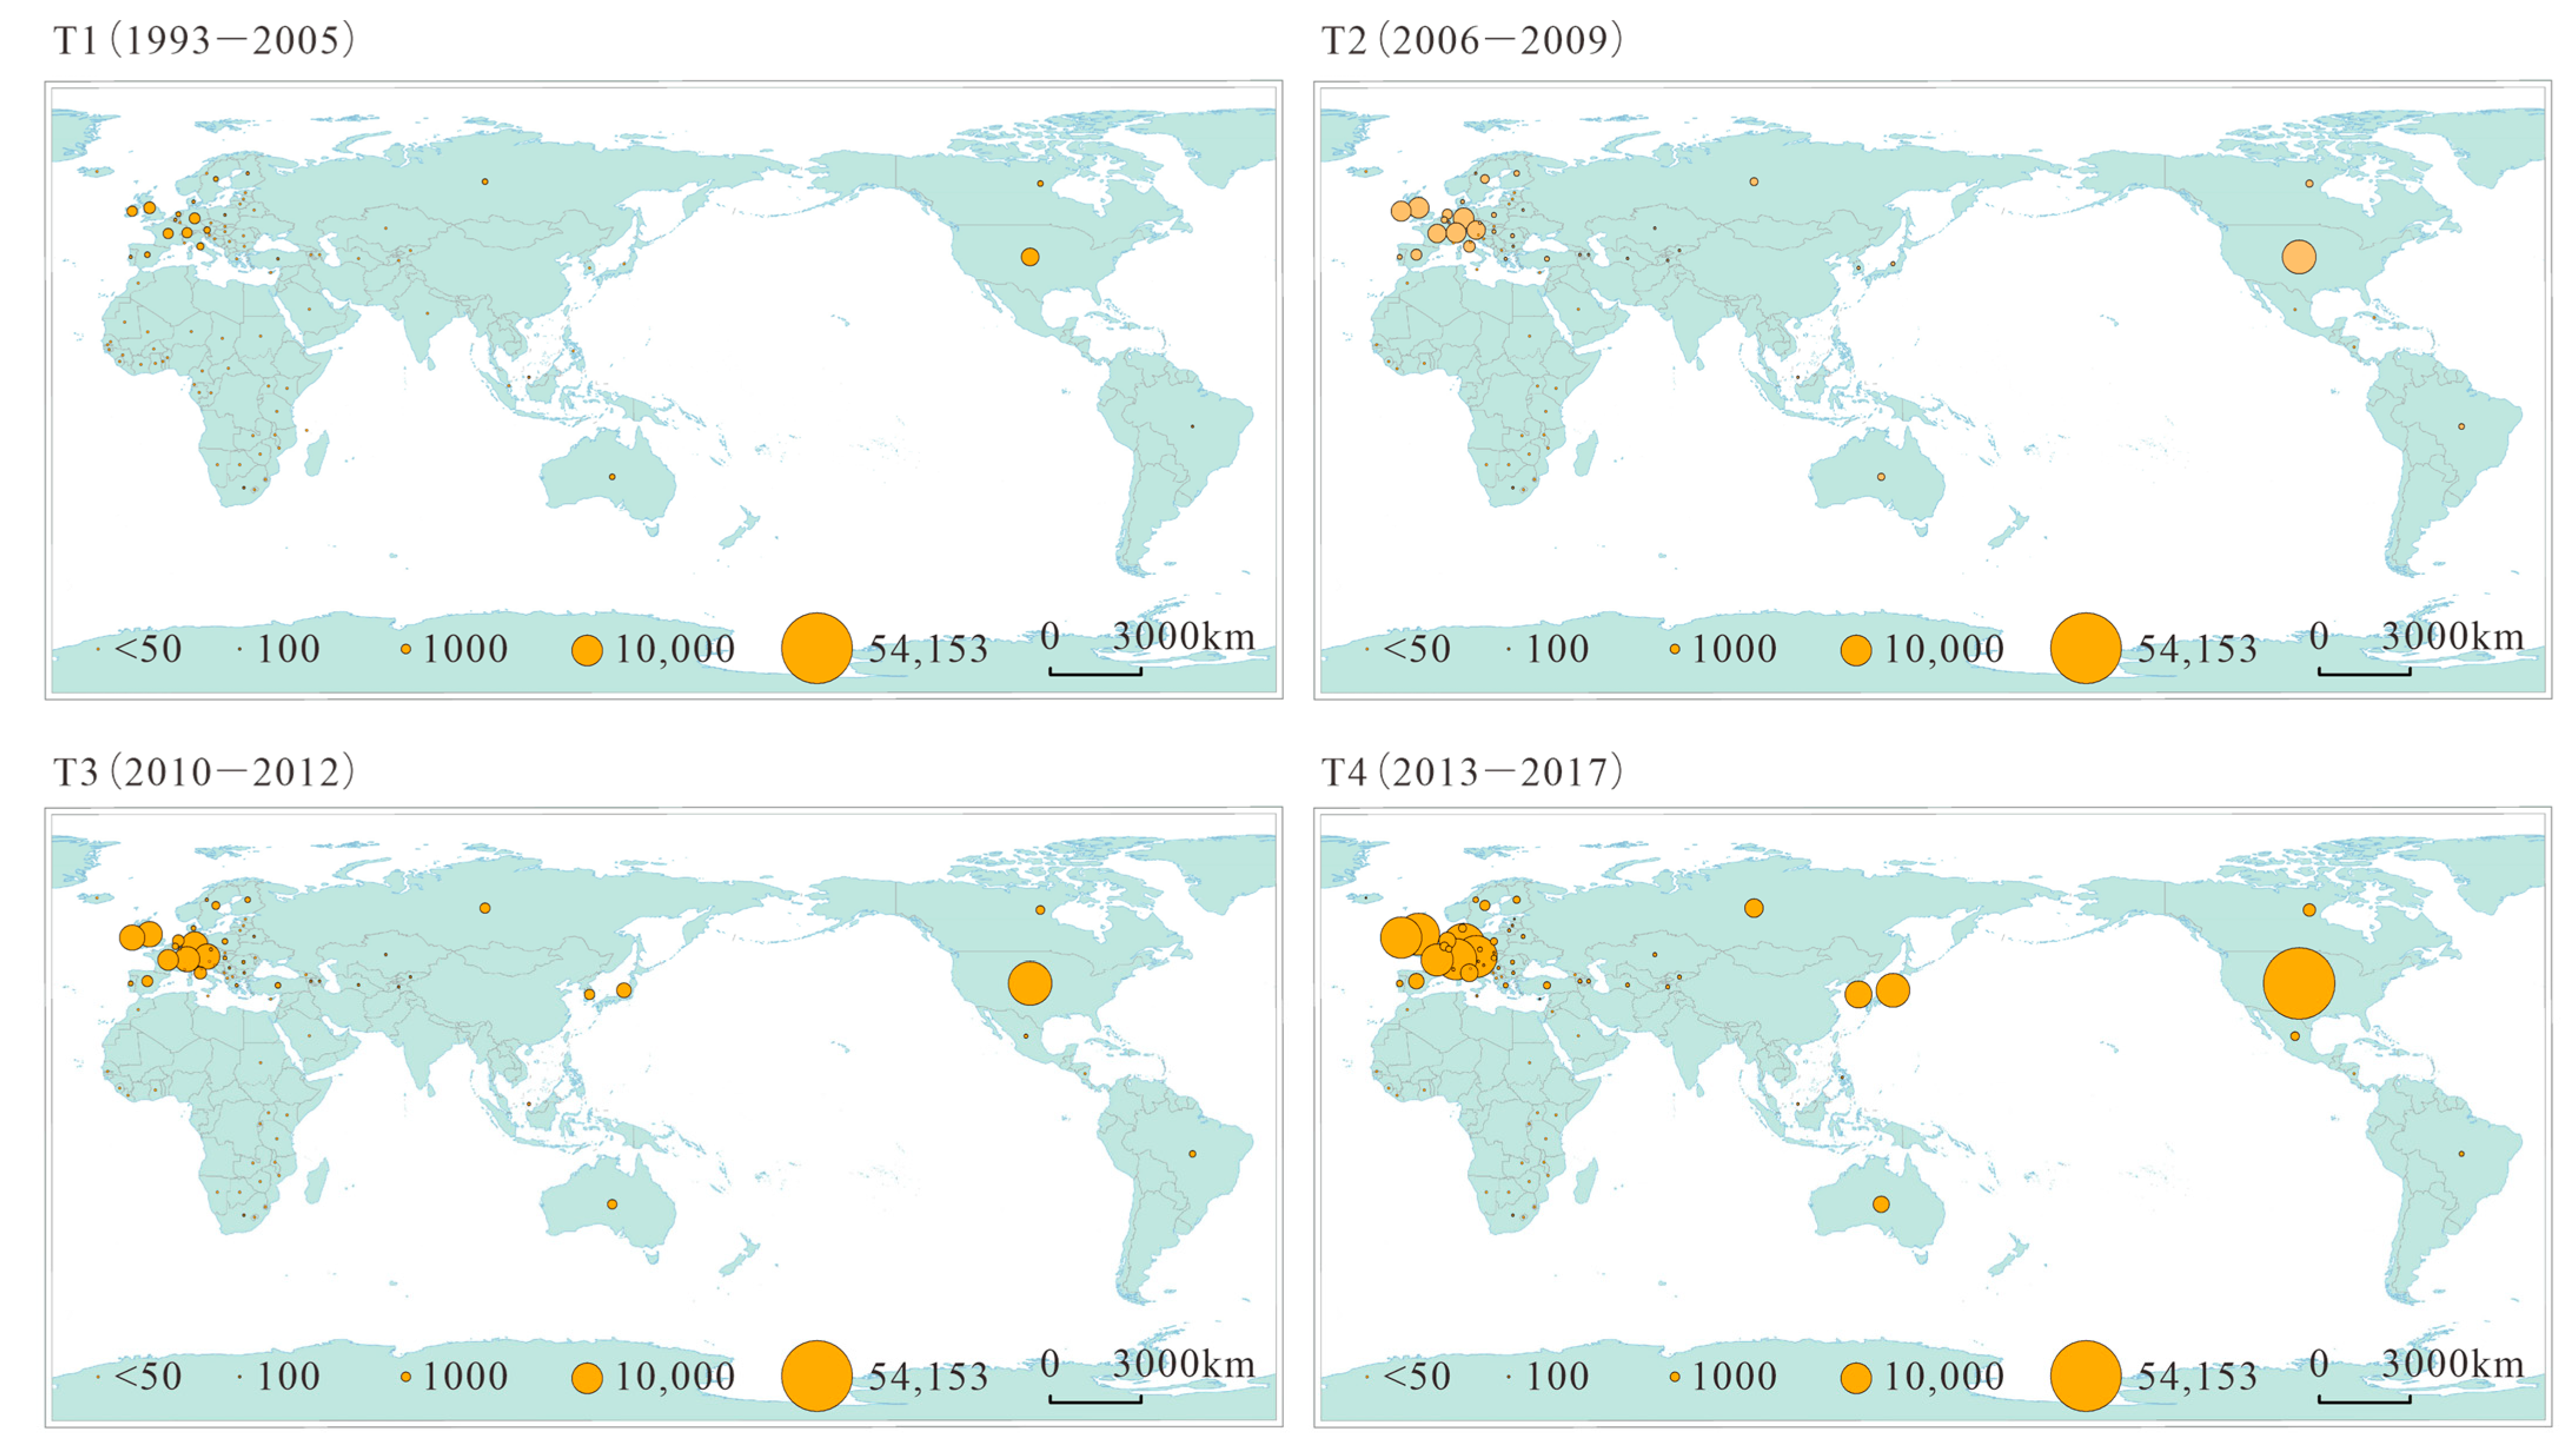
From 1993 to 2017, the geography of Chinese SEI patents abroad gradually developed from a bipolar structure dominated by the United States and Western Europe to a three-polar structure dominated by the United States, Western Europe and East Asia (Figure 5). In the first stage (1993–2005), Chinese SEI patents abroad were concentrated mainly in the United States, the United Kingdom and Germany, and the number of patents flowing to these three countries accounted for approximately 42.14% of China’s total patents abroad; however, the number of patents abroad in this stage was generally small. Compared with the first stage, the main host region of Chinese SEI patents abroad in the second stage (2006–2009) did not change significantly. The Gini coefficient of China SEI patents abroad in each destination country rose from 0.85 to 0.88, indicating that in this stage, Chinese patents abroad were concentrated mainly in the United States and Western European countries. In the third stage (2010–2012), the number of SEI patents flowing to Japan and South Korea from China increased significantly. In the fourth stage (2013–2017), a three-pole structure with the United States-Western Europe-East Asia as the core was formed. In addition, the Gini coefficient of Chinese overseas patents increased to 0.89, and the imbalance in the distribution of patents abroad further expanded. In general, the geography of Chinese SEI patents abroad shows obvious path dependence characteristics. The United States and Western Europe have been important destinations for Chinese SEI patents abroad, while Japan and Korea became emerging destinations in the last two development stages. The geography of Chinese SEI patents abroad indicates that the United States, Western Europe, East Asia, Russia and Australia are also important markets and technology diffusion destinations for Chinese SEI technologies.
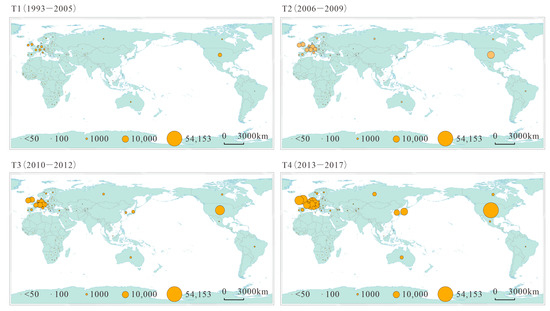
Figure 5.
Geography of Chinese SEI patents abroad.
By examining the fourth stage (2013–2017), we found that the geography of the patents abroad host countries of the nine industries had strong similarity (Figure 6). The United States, Western Europe, Japan and South Korea in East Asia were the common main destinations for overseas patents of the nine major industries. There were only minor differences among different industries in the geography of the main host countries of patents abroad. For example, patents abroad in the new material industry and related services industries were hosted mostly by the United States, Japan, and Germany, while the remaining industries were mostly hosted by the United States, the United Kingdom and Germany. Compared with other industries, the number of host countries for Chinese SEI patents abroad in the new material industry, bioindustry, and high-end equipment manufacturing industry was the largest. Chinese patents abroad in the new material industry, bioindustry and high-end equipment manufacturing industry were also distributed in some African countries, such as South Africa and Morocco.

Figure 6.
Share of the top 10 host countries in the nine industries, 2013–2017.
4.3.2. Geography of China SEI Patents Abroad Share
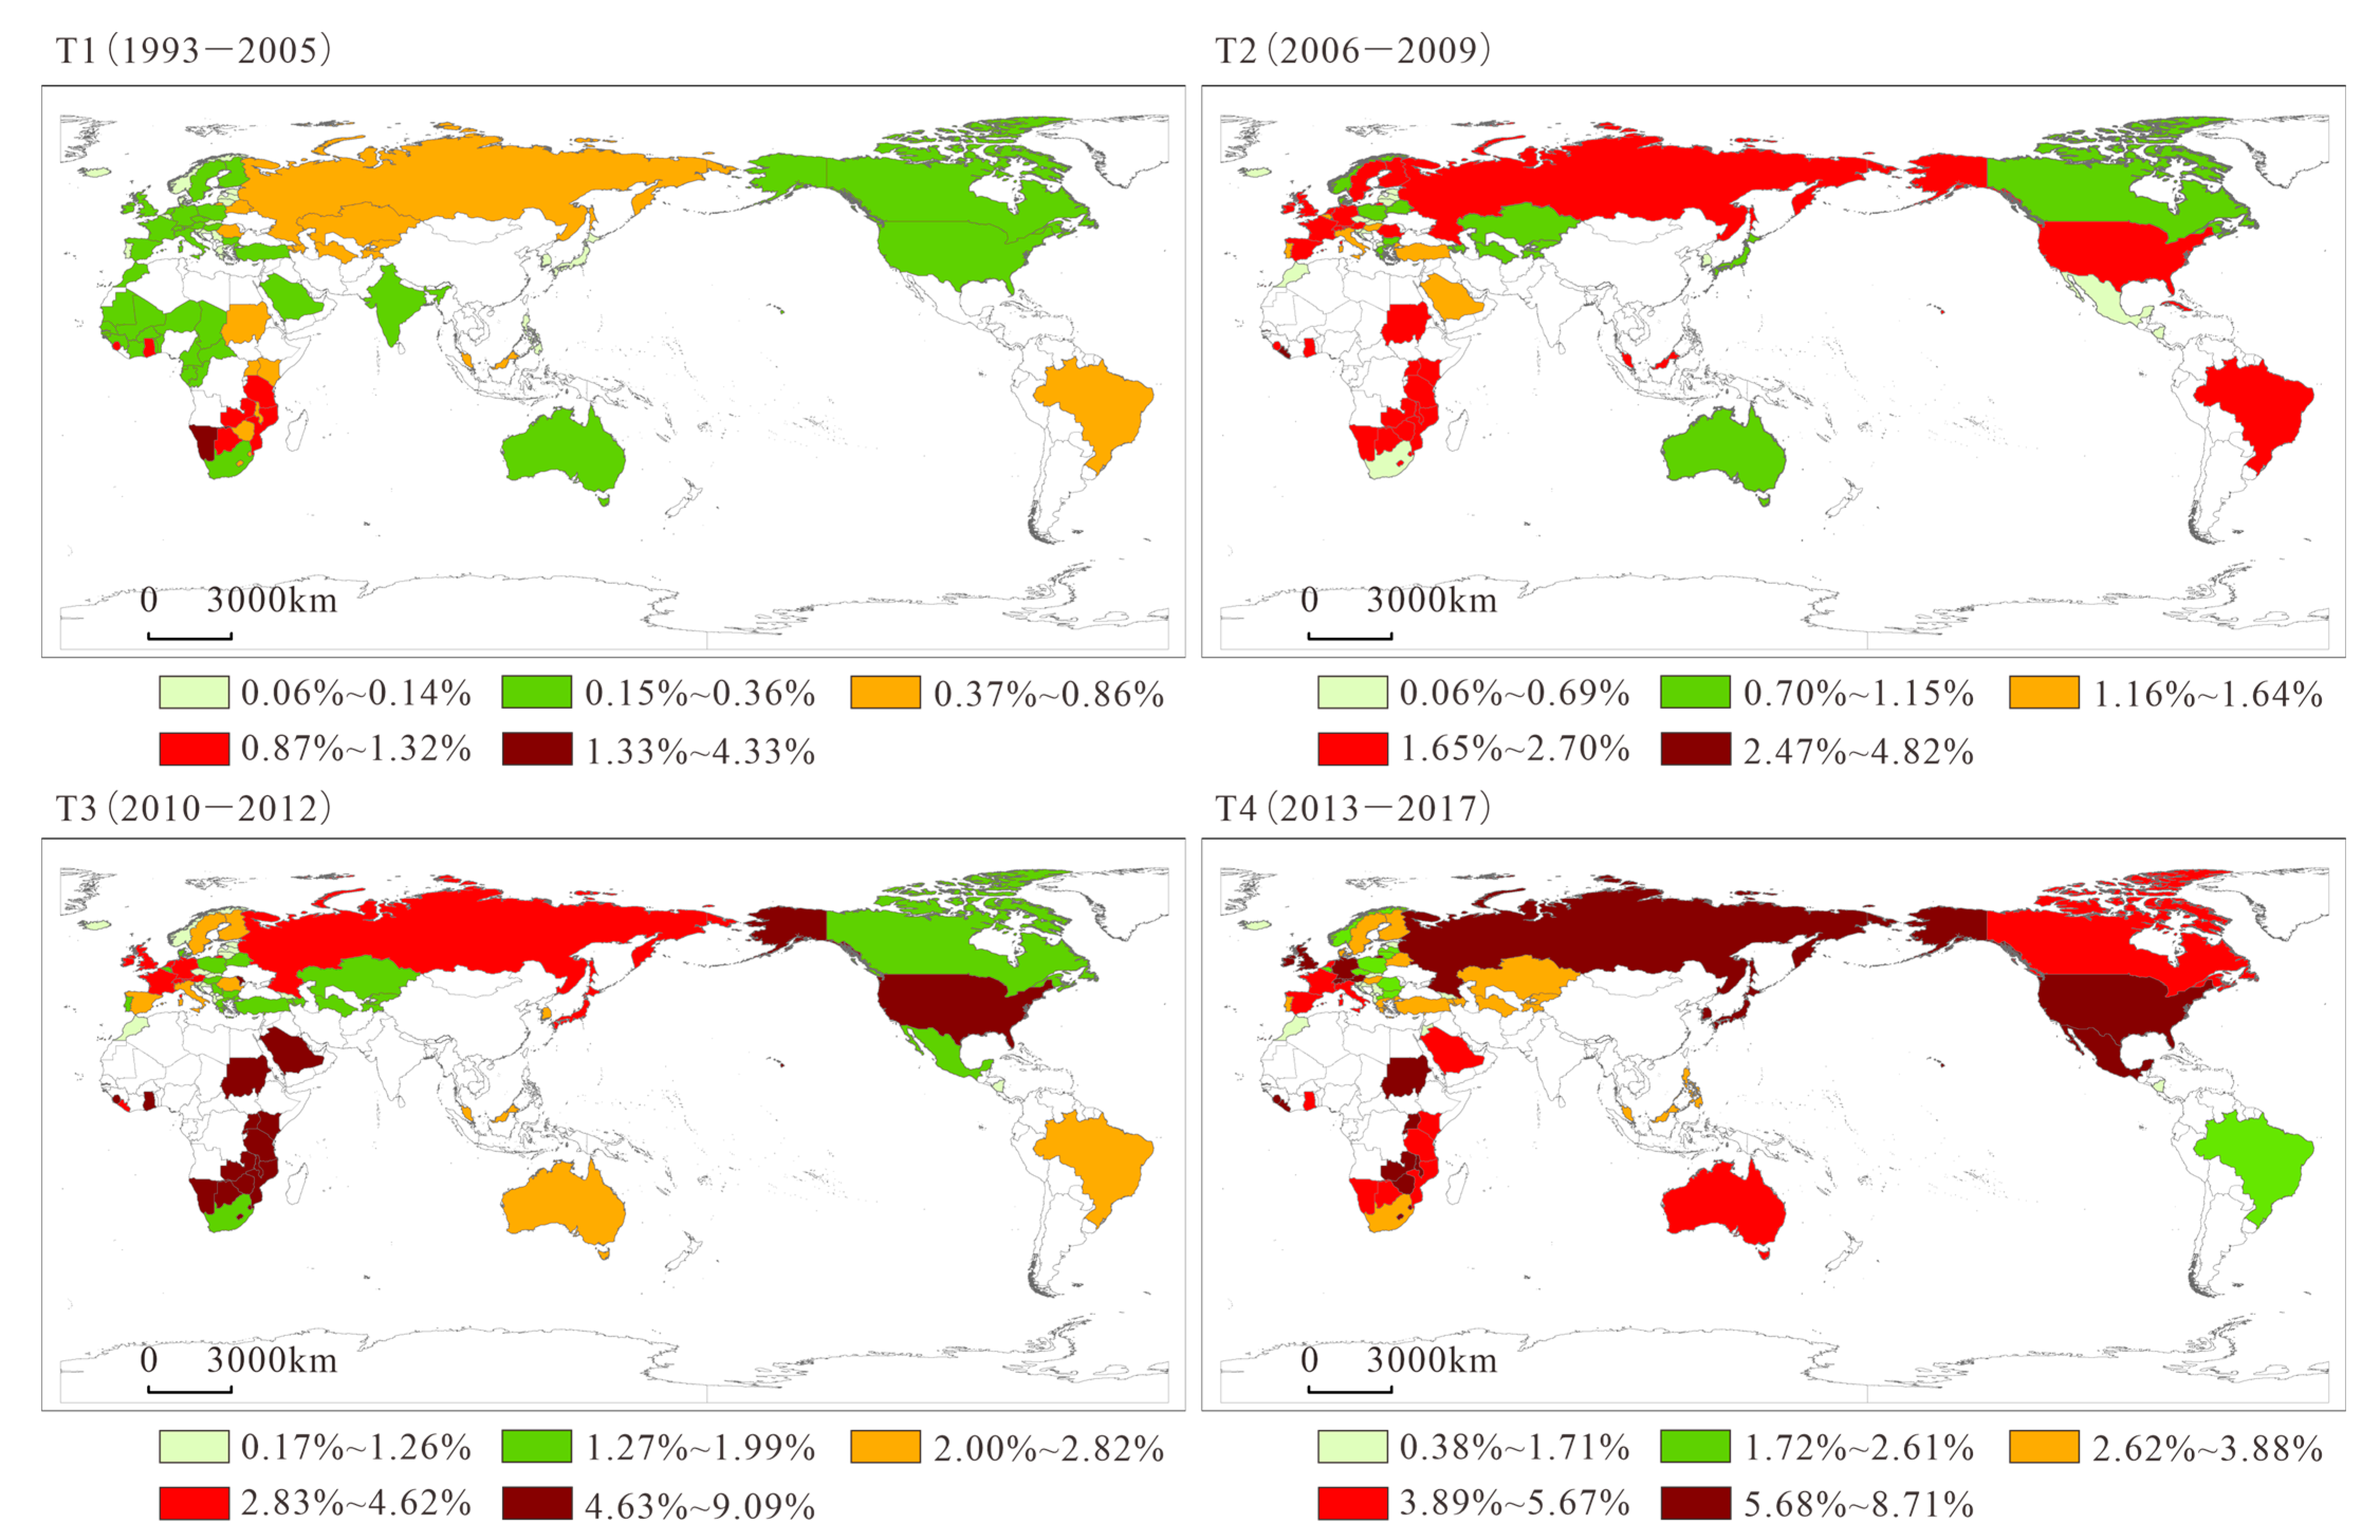
We calculated the ratio of China SEI patents in the host country to the total nonresident SEI patents in the host country to analyze the impact of China’s SEI technology on the host country compared to that of other countries. We used the natural breakpoint method to classify the impact at each stage (Figure 7). From the first stage (1993–2005) to the fourth stage (2013–2017), the influence of Chinese SEI patents abroad increased significantly compared with that of other countries. Geographically and spatially, the influence of Chinese SEI patents abroad is gradually spreading from Africa to traditional technology powerhouses, such as Europe and the United States. In the first stage, Chinese SEI patents abroad accounted for only 0.34%, 0.27%, and 0.12% of nonresident SEI patents in the United States, Germany and Japan, respectively. During the same period, China’s influence in some African countries was relatively high; for example, Chinese SEI patents abroad in Namibia, Tanzania and Botswana accounted for 4.32%, 1.31% and 1.19% of SEI nonresident patents in these countries, respectively. In the fourth stage, the international influence of China SEI patents abroad was significantly enhanced, with the influence being greater in countries such as Russia, the United States and South Korea. Notably, although the international influence of China SEI technologies has been increasing, the proportion of Chinese SEI patents abroad to the total number of SEI nonresident patents in the host country is generally low, at less than 10%. Compared with traditional science and technology powerhouses, such as the United States, Germany, and Japan, there is still a large gap.
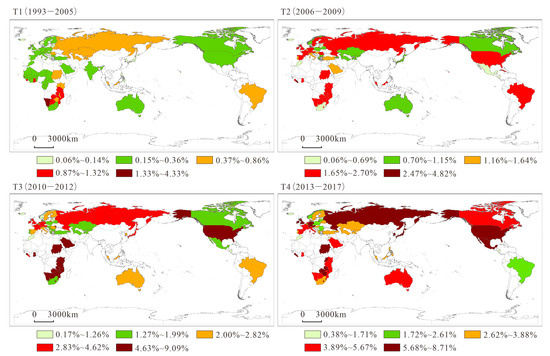
Figure 7.
Geography of Chinese SEI patents abroad as a share of foreign patents in the host country.
5. Determinants of the Geography of Chinese SEI Patents Abroad
Table 1 presents the descriptive statistics of the variables. The mean value of the variance inflation factor is 2.64, and the maximum variance inflation factor value is 4.87, which indicates that multicollinearity is not a significant issue. The results of the determinants of the geography of Chinese SEI patents abroad activity are reported in Table 2. Model 1 is a regression result that includes only the individual characteristics of the host country. Model 2 is a regression result that includes only characteristics of the relationship between China and the host country. Model 3 is the regression result that controls only the individual effect after adding all the influencing factors. Model 4 is the regression result after controlling for individual effects and time effects. According to the analysis of the empirical model section, we base our discussion and conclusion on the panel negative binomial regression model with double fixed effects results.

Table 1.
Descriptive statistics of variables.

Table 2.
Determinants of the geography of Chinese SEI patents abroad activity.
Our regression results indicate that the size of the host country’s high-tech product market has a negative effect on Chinese SEI patents abroad. The possible reason is that China is still in the low value-added segment of the global value chain in the high-tech industry [43], and more than 60% of China’s high- tech exports are still borne by foreign capital [65]. China’s competitive advantage in overseas markets is still cheap labor rather than advanced technology. Therefore, the larger the market for high-tech products in the host country, the lower the propensity of Chinese firms to obtain patents in the host country. This result confirms Hypothesis 1. The coefficient of the technology market size indicator supports Hypothesis 2 in that the scale of the host country’s technology market has a significant role in promoting Chinese SEI patents abroad. Chinese companies are more inclined to apply for patents in countries with larger technology markets, as this will give them a greater chance of capturing potential benefits. The level of IPR protection and openness of the host country have a significant positive impact on the geography of Chinese SEI patents abroad. This finding is consistent with previous research findings [47,57]. A higher level of IPR protection and openness can attract the technology transfer of multinational companies to the local area, thereby increasing the number of non-resident patents in the host country. This result confirms Hypothesis 5. In addition, the development level of the host country has a positive impact on the geographical distribution of Chinese SEI patents abroad. When other conditions are unchanged, the number of patents flowing to high-income countries is significantly greater than the number flowing to low-income countries. The coefficient of the technological similarity index is significantly positive, indicating that the more similar the technological structure of China and the host country, the easier it is and the more likely it is that China will apply for more patents in the host country. This result verifies Hypothesis 3. A similar technical structure increases the risk of imitation by the host country, thereby prompting China to apply for more patents in the host country to protect its interests. This conclusion has been confirmed in previous studies [11,29,47]. The coefficient of market share supports Hypothesis 4, indicating that when China’s market share of high-tech products in the host country decreases, it will prompt China’s patent applications in the host country, and China will use patent applications to fight competitors and ensure its market share. As Faust’s research also argued, it is necessary for industrialized countries to secure their market share abroad by filing patents to protect themselves against major competitors [35]. A comparison of the coefficients of lnpms and markf indicates that the current China SEI overseas patent application strategy is mainly to consolidate the commodity market rather than to expand it. The effect of the geographical distance between countries is statistically ambiguous, possibly due to the spread of internet use [11,37].
To verify the validity of the results in Table 2, we further performed a robustness test. We used two methods to test robustness. In Column 1 of Table 3, we add variables that control the technological level of China (lnhomep) and the host country (lnhostp) to test the robustness of the results. lnhomep is represented by the logarithm of the total number of SEI patents in China and lnhostp is expressed as the logarithm of the number of PCT patent applications in the host country. We found that the improvement of China’s technology level has a significant positive effect on Chinese SEI patents abroad, while the impact of the host country’s technology level is not significant. Thus, our primary results were not affected. In addition, we found that the number of patents abroad with the United States as the host country was the largest among Chinese SEI patents abroad, accounting for approximately 25% of the total number of Chinese SEI patents abroad. Therefore, referring to previous research [66], we excluded U.S. data in a robustness test, and the results of the robustness tests are shown in Model 6. The results are fully consistent with those of the main estimations, suggesting that the results are not driven by the presence of a major host country.

Table 3.
Robustness check.
6. Discussion and Conclusions
In the context of technological globalization, China’s rapidly growing innovation potential has attracted much attention, as these developments are expected to reshape China’s position and influence in the world’s technological innovation system. At the same time, research using China as a case study has important implications for expanding and enriching existing mainstream theory. To advance our understanding of Chinese patents abroad activity, we construct a new dataset of Chinese SEI patents abroad, and our research focuses on the evolution and determinants of the geography of Chinese SEI patents abroad.
Our results reveal that first, in the past three decades, the number of China SEI patents has increased rapidly, and the geographical distribution of Chinese SEI patents abroad has also expanded significantly. Consistent with recent studies, China’s technological innovation level and international competitiveness have significantly improved [67,68]. However, the number of Chinese SEI patents abroad and the ratio of Chinese SEI patents abroad to the total number of patents are much smaller than those of the United States, and the destination countries of overseas patents are still relatively limited. In terms of technology internationalization and international competitiveness in science and technology, there is still a large gap between China and the rest of the world in terms of scientific and technological powers [2,69]. From the perspective of the industrial structure of Chinese SEI patents abroad, the new-generation information technology industry has developed the most rapidly, accounting for approximately 50% of SEI patents abroad. Therefore, it can be said that it is the rapid development of the new-generation information technology industry that has driven the rapid growth of Chinese SEI patents abroad. However, the strong reliance on the new-generation IT industry, especially on leading enterprises [16], also reflects the unevenness and vulnerability of the development of Chinese SEI patents abroad.
Secondly, the United States and Western Europe have long been important technology markets for China. In the last decade, with the rapid development of China’s new-generation information technology industry, the number of Chinese patents in the Japanese and Korean markets has grown significantly. The geography of Chinese SEI patents abroad is highly concentrated in developed countries and major developing countries, such as some of the BRICS countries. Dang (2019) obtained similar findings in his study of the geography of standard-essential patents in East Asian countries [18]. The geography of Chinese patents abroad has a strong similarity across the nine industries. The influence of Chinese SEI patents abroad has gradually spread from African countries to scientific and technological powers in geographical space. However, it should be pointed out that the proportion of Chinese SEI patents abroad to the total SEI non-resident patents of host countries is generally low. Compared to traditional technology powerhouses, China’s technological competitiveness and influence in overseas markets are still weak.
Thirdly, the regression results show that the geography of Chinese SEI patents abroad is closely related to the market factors, competition factors and institutional factors of the host country. Specifically, the level of IPR protection, degree of openness, size of the technology market, and technological similarity with China have a significant positive impact on Chinese SEI patents abroad, and the host country’s high-tech product market size and China’s market share in the host country have a negative impact on Chinese SEI patents abroad. The geographical distance between countries was not significant in this study. Our empirical results support the five previous hypotheses. They also show that the effects of factors such as the risk of imitation in the host country, the level of IPR protection in the host country, and the competitive threat in the host country market on overseas patents in the home country, which were previously derived in studies based on developed countries, are also applicable to developing countries such as China. However, the impact of host country product market size on patents abroad behavior in developed countries differs from that in China. A possible reason is that developed countries expand their overseas markets with technology-intensive products [70], thus, the increase in the size of the host country’s product market is attractive to developed countries’ overseas patents. However, China, as a developing country, is still in the low-value-added segment of the global value chain of high-tech industries [65,70], and its competitive advantage in overseas markets as the world’s factory is still based on cheap labor; therefore, an increase in the market size of the host country does not have an obvious promotional effect on China’s overseas patents.
The possible contributions of this study are mainly as follows: First, we believe that our work provides an idea for a more accurate portrayal of patents abroad activities. In previous studies, researchers have often treated data from regional offices as a whole or excluded them, which may bias the results of studies focusing on host countries. Considering that patent protection is still national [23], we propose that for patents granted by regional offices, we treat the country of the final validity of the patent as the host country and in this way more accurately capture the patents abroad activities of the home country. Second, our work has enriched the literature related to Chinese patents abroad and Chinese technology internationalization strategies. Based on previous studies [16], we focus on the patents abroad activity of SEIs that are important to China’s future technological development. We also further explore the determinants of the geography of Chinese SEI patents abroad. We provide evidence for the technology internationalization strategy of China’s SEIs in terms of market factors, competitive factors, and institutional factors. Additionally, considering that China is still a developing country, our findings on the geography of Chinese patents abroad provide evidence to support theories related to reverse innovation. Third, we believe that our work provides a number of new insights from developing countries into the determinants of the geography of patents abroad, enriching traditional mainstream theory. Previous studies on patents abroad have focused mainly on developed countries [1,11,12]. As developing countries become increasingly prominent in the process of technology globalization, it is necessary to conduct in-depth studies on the patents abroad activity of these countries [71]. Many studies have also pointed out that different countries may have different technology internationalization strategies [18,72]. Our findings provide preliminary evidence that institutional and competitive factors are also important determinants of the geography of patents abroad in developing countries. For developing countries, the size of the technology market in the host country is more attractive to patents abroad than the size of the product market. Our study extends and enriches the mainstream market coverage theory and competitive threat theory.
Some limitations may exist in our study. Since our study uses data from granted patents, which often take a long time from application to grant, it may not capture timely and up-to-date information on Chinese patents abroad activity. Therefore, we need to continuously supplement and update our dataset with the latest information in future studies. Second, in this study, we focus only on the determinants of the geography of patents abroad at the country level, and a firm-level-based study may contain additional interesting information. In future research, we could create a firm-level dataset to explore the heterogeneity in patents abroad activities based on firm-level features. In addition, based on our study of Chinese patents abroad, we found that the size of the host country’s product market may have a different impact on developing countries than on developed countries, so we will try to include more developing country samples in future research to further improve our knowledge of the driving mechanism of patents abroad activity.
Author Contributions
Conceptualization, C.Z., D.D. and W.S.; methodology, C.Z.; software, C.Z.; validation, C.Z., D.D. and W.S.; formal analysis, C.Z.; investigation, C.Z.; resources, C.Z.; data curation, C.Z.; writing—original draft preparation, C.Z.; writing—review and editing, C.Z., D.D. and W.S.; visualization, C.Z.; supervision, D.D.; project administration, D.D.; funding acquisition, D.D. All authors have read and agreed to the published version of the manuscript.
Funding
Major Program of National Social Science Foundation of China (Grant Number 19ZDA087).
Institutional Review Board Statement
The study did not require ethical approval.
Informed Consent Statement
The study did not involve humans.
Data Availability Statement
Not applicable.
Conflicts of Interest
The authors declare no conflict of interest.
References
- Archontakis, F.; Varsakelis, N.C. Patenting abroad: Evidence from OECD countries. Technol. Forecast. Soc. Change 2017, 116, 62–69. [Google Scholar] [CrossRef]
- Yang, W.; Yu, X.; Zhang, B.; Huang, Z. Mapping the landscape of international technology diffusion (1994–2017): Network analysis of transnational patents. J. Technol. Transf. 2019, 46, 138–171. [Google Scholar] [CrossRef]
- Gao, X.; Zhang, Y. What is behind the globalization of technology? Exploring the interplay of multi-level drivers of international patent extension in the solar photovoltaic industry. Renew. Sustain. Energy Rev. 2022, 163, 112510. [Google Scholar] [CrossRef]
- Perkins, R.; Neumayer, E. Transnational spatial dependencies in the geography of non-resident patent filings. J. Econ. Geogr. 2011, 11, 37–60. [Google Scholar] [CrossRef]
- WIPO. WIPO IP PORTAL. Available online: https://www3.wipo.int/ipstats/index.htm (accessed on 13 November 2022).
- Botoy, I.E. From the Paris Convention to the Trips Agreement. J. World Intellect. Prop. 2005, 7, 115–130. [Google Scholar] [CrossRef]
- Maurseth, P.B.; Svensson, R. Micro evidence on international patenting. Econ. Innov. New Technol. 2014, 23, 398–422. [Google Scholar] [CrossRef]
- Willoughby, K.W.; Mullina, N. Reverse innovation, international patenting and economic inertia: Constraints to appropriating the benefits of technological innovation. Technol. Soc. 2021, 67, 101712. [Google Scholar] [CrossRef]
- Basberg, B.L. Patents and the measurement of technological change: A survey of the literature. Res. Policy 1987, 16, 131–141. [Google Scholar] [CrossRef]
- Dachs, B.; Pyka, A. What drives the internationalisation of innovation? Evidence from European patent data. Econ. Innov. New Technol. 2010, 19, 71–86. [Google Scholar] [CrossRef]
- Archontakis, F.; Varsakelis, N.C. US patents abroad: Does gravity matter? J. Technol. Transf. 2010, 36, 404–416. [Google Scholar] [CrossRef]
- Nikzad, R. Canadian worldwide patent activity: An industrial level analysis. World Pat. Inf. 2014, 38, 12–18. [Google Scholar] [CrossRef]
- Eberhardt, M.; Helmers, C.; Yu, Z. Is the Dragon Learning to Fly? An Analysis of the Chinese Patent Explosion; CSAE Working Paper 2011/15; University of Oxford: Oxford, UK, 2011. [Google Scholar]
- Fan, F.; Zhang, K.K.; Dai, S.Z.; Wang, X.L. Decoupling analysis and rebound effect between China’s urban innovation capability and resource consumption. Technol. Anal. Strateg. Manag. 2021, 5, 1–5. [Google Scholar] [CrossRef]
- Nepelski, D.; De Prato, G. International technology sourcing between a developing country and the rest of the world. A case study of China. Technovation 2015, 35, 12–21. [Google Scholar] [CrossRef]
- Wunsch-Vincent, S.; Kashcheeva, M.; Zhou, H. International patenting by Chinese residents: Constructing a database of Chinese foreign-oriented patent families. China Econ. Rev. 2015, 36, 198–219. [Google Scholar] [CrossRef]
- Yang, W.; Yu, X.; Wang, D.; Yang, J.R.; Zhang, B. Spatio-temporal evolution of technology flows in China: Patent licensing networks 2000–2017. J. Technol. Transf. 2021, 46, 1674–1703. [Google Scholar] [CrossRef]
- Dang, J.W.; Kang, B.; Ding, K. International protection of standard essential patents. Technol. Forecast. Soc. Change 2019, 139, 75–86. [Google Scholar] [CrossRef]
- The State Council of the People’s Republic of China. Decision of the State Council on Accelerating the Fostering and Development of Strategic Emerging Industries. 2010. Available online: http://www.gov.cn/zhengce/content/2010-10/18/content_1274.htm (accessed on 5 January 2023).
- Prud’homme, D. Dynamics of China’s provincial-level specialization in strategic emerging industries. Res. Policy 2016, 45, 98–115. [Google Scholar] [CrossRef]
- Erken, H.; Kleijn, M. Location factors of international R&D activities: An econometric approach. Econ. Innov. New Technol. 2010, 19, 203–232. [Google Scholar] [CrossRef]
- Paci, R.; Sassu, A.; Usai, S. International patenting and national technological specialization. Technovation 1997, 17, 25–38. [Google Scholar] [CrossRef]
- Frietsch, R.; Schmoch, U. Transnational patents and international markets. Scientometrics 2010, 82, 185–200. [Google Scholar] [CrossRef]
- Gao, X. International patent inflows and innovative capacity in recipient countries: Evidence from the solar photovoltaics (PV) industry. Energy Sustain. Dev. 2022, 68, 449–456. [Google Scholar] [CrossRef]
- Archambault, E. Methods for using patents in cross-country comparisons. Scientometrics 2002, 54, 15–30. [Google Scholar] [CrossRef]
- Xu, B.; Chiang, E.P. Trade, patents and international technology diffusion. J. Int. Trade Econ. Dev. 2005, 14, 115–135. [Google Scholar] [CrossRef]
- Hafner, K. The pattern of international patenting and technology diffusion. Appl. Econ. 2008, 40, 2819–2837. [Google Scholar] [CrossRef]
- Inkmann, J.; Pohlmeier, W.; Rieci, L.A. Where to patent?: Theory and evidence on international patenting. In Institutional Arrangements for Global Economic Integration; Vosgerau, H.J., Ed.; St. Martin’s Press: New York, NY, USA, 2000. [Google Scholar]
- Eaton, J.; Kortum, S. Trade in ideas patenting and productivity in the OECD. J. Int. Econ. 1996, 40, 251–278. [Google Scholar] [CrossRef]
- Dechezlepretre, A.; Glachant, M.; Hascic, I.; Johnstone, N.; Meniere, Y. Invention and transfer of climate change-mitigation technologies: A global analysis. Rev. Env. Econ. Policy 2011, 5, 109–130. [Google Scholar] [CrossRef]
- Moussa, B.; Varsakelis, N.C. International patenting: An application of network analysis. J. Econ. Asymmetries 2017, 15, 48–55. [Google Scholar] [CrossRef]
- Hussinger, K. Is silence golden? Patents versus secrecy at the firm level. Econ. Innov. New Technol. 2006, 15, 735–752. [Google Scholar] [CrossRef]
- Monk, A.H.B. The emerging market for intellectual property: Drivers, restrainers, and implications. J. Econ. Geogr. 2009, 9, 469–491. [Google Scholar] [CrossRef]
- Huang, C.; Jacob, J. Determinants of quadic patenting: Market access, imitative threat, competition and strength of intellectual property rights. Technol. Forecast. Soc. Change 2014, 85, 4–16. [Google Scholar] [CrossRef]
- Faust, K.; Schedl, H. International patent data: Their utilisation for the analysis of technological developments. World Pat. Inf. 1983, 5, 144–157. [Google Scholar] [CrossRef]
- Hu, A.G. Propensity to patent, competition and China’s foreign patenting surge. Res. Policy 2010, 39, 985–993. [Google Scholar] [CrossRef]
- Ma, D.; Yu, Q.; Li, J.; Ge, M.N. Innovation diffusion enabler or barrier: An investigation of international patenting based on temporal exponential random graph models. Technol. Soc. 2021, 64, 101456. [Google Scholar] [CrossRef]
- Nikzad, R. Transfer of technology to Canadian manufacturing industries through patents. Aust. Econ. Pap. 2012, 51, 210–227. [Google Scholar] [CrossRef]
- Beneito, P.; Rochina-Barrachina, M.; Sanchis, A. International patenting decisions: Empirical evidence with Spanish firms. Econ. Polit-Italy 2018, 35, 579–599. [Google Scholar] [CrossRef]
- Guellec, D.; van Pottelsberghe, B. Applications, grants and the value of patent. Econ. Lett. 2000, 69, 109–114. [Google Scholar] [CrossRef]
- Bosworth, D.L. The transfer of US technology abroad. Res. Policy 1980, 9, 378–388. [Google Scholar] [CrossRef]
- Motohashi, K. Measuring multinationals’ R&D activities in China on the basis of a patent database: Comparing European, Japanese and US firms. China World Econ. 2015, 23, 1–21. [Google Scholar] [CrossRef]
- Sun, Y.T.; Grimes, S. China’s increasing participation in ICT’s global value chain: A firm level analysis. Telecommun. Policy 2016, 40, 210–224. [Google Scholar] [CrossRef]
- Yuan, X.D.; Li, X.T. Mapping the technology diffusion of battery electric vehicle based on patent analysis: A perspective of global innovation systems. Energy 2021, 222, 119897. [Google Scholar] [CrossRef]
- Cai, H.; Sarpong, D.; Tang, X.Y.; Zhao, G.Q. Foreign patents surge and technology spillovers in China (1985–2009): Evidence from the patent and trade markets. Technol. Forecast. Soc. Change 2020, 151, 119784. [Google Scholar] [CrossRef]
- Jucevicius, R.; Jukneviciene, V.; Mikolaityte, J.; Saparniene, D. Assessing the regional innovation system’s absorptive capacity: The approach of a smart region in a small country. Systems 2017, 5, 27. [Google Scholar] [CrossRef]
- Sharma, A.; Sharma, R.; Panda, S. The role of technological capabilities and gap in the cross-country patenting: An empirical investigation. Int. Econ. Econ. Policy 2021, 19, 1–27. [Google Scholar] [CrossRef]
- Branstetter, L.G.; Fisman, R.; Foley, C.F. Do stronger intellectual property rights increase international technology transfer? Empirical evidence from US firm-level panel data. Q. J. Econ. 2006, 121, 321–349. [Google Scholar]
- Smith, P.J. How do foreign patent rights affect U.S. exports, affiliate sales, and licenses? J. Int. Econ. 2001, 55, 411–439. [Google Scholar] [CrossRef]
- Chan, H.P. The determinants of international patenting for nine agricultural biotechnology firms. J. Ind. Econ. 2010, 58, 247–278. [Google Scholar] [CrossRef]
- Yang, C.H.; Kuo, N.F. Trade-related influences, foreign intellectual property rights and outbound international patenting. Res. Policy 2008, 37, 446–459. [Google Scholar] [CrossRef]
- Ivus, O.; Park, W.G.; Saggi, K. Patent protection and the composition of multinational activity: Evidence from US multinational firms. J. Int. Bus. Stud. 2017, 48, 808–836. [Google Scholar] [CrossRef]
- Wang, Y.H.; Song, C.Q.; Sigley, G.; Chen, X.Q.; Yuan, L.H. Using social networks to analyze the spatiotemporal patterns of the rolling stock manufacturing industry for countries in the Belt and Road Initiative. ISPRS Int. J. Geo-Inf. 2020, 9, 431. [Google Scholar] [CrossRef]
- Chen, X.; Yuan, L.; Shen, S.; Liang, X.; Wang, Y.; Wang, X.; Ye, S.; Cheng, C. Analysis of the geo-relationships between China and its neighboring countries. Acta Geogr. Sin. 2019, 74, 1534–1547. [Google Scholar]
- Grafström, J. International knowledge spillovers in the wind power industry: Evidence from the European Union. Econ. Innov. New Technol. 2017, 27, 205–224. [Google Scholar] [CrossRef]
- Eaton, J.; Kortum, S. International technology diffusion: Theory and measurement. Int. Econ. Rev. 1999, 40, 537–570. [Google Scholar] [CrossRef]
- Picci, L. The internationalization of inventive activity: A gravity model using patent data. Res. Policy 2010, 39, 1070–1081. [Google Scholar] [CrossRef]
- Nepelski, D.; De Prato, G. Internationalisation of ICT R&D: A comparative analysis of Asia, the European Union, Japan, United States and the rest of the world. Asian J. Technol. Innov. 2012, 20, 219–238. [Google Scholar] [CrossRef]
- Jaffe, A.B. Characterizing the technological position of firms, with application to quantifying technological opportunity and research spillovers. Res. Policy 1989, 18, 87–97. [Google Scholar] [CrossRef]
- Aboy, M.; Liddicoat, J.; Liddell, K.; Jordan, M.; Crespo, C. After Myriad, what makes a gene patent claim ‘markedly different’ from nature? Nat. Biotechnol. 2017, 35, 820–825. [Google Scholar] [CrossRef]
- Jefferson, O.A.; Jaffe, A.; Ashton, D.; Warren, B.; Koellhofer, D.; Dulleck, U.; Ballagh, A.; Moe, J.; DiCuccio, M.; Ward, K.; et al. Mapping the global influence of published research on industry and innovation. Nat. Biotechnol. 2018, 36, 31–40. [Google Scholar] [CrossRef]
- Lyu, Y.S.; Yin, M.Q.; Xi, F.J.; Hu, X.J. Progress and knowledge transfer from science to technology in the research frontier of CRISPR based on the LDA model. J. Data Inf. Sci. 2022, 7, 1–19. [Google Scholar] [CrossRef]
- WIPO. World Intellectual Property Indicators; WIPO Publication: Geneva, Switzerland, 2011. [Google Scholar]
- Hatzichronoglou, T. Revision of the High-Technology Sector and Product Classification; OECD Publishing: Paris, France, 1997. [Google Scholar]
- Duan, D.; Xia, Q. From the United States to China? A trade perspective to reveal the structure and dynamics of global electronic-telecommunications. Growth Change 2022, 53, 823–847. [Google Scholar] [CrossRef]
- Dechezlepretre, A.; Neumayer, E.; Perkins, R. Environmental regulation and the cross-border diffusion of new technology: Evidence from automobile patents. Res. Policy 2015, 44, 244–257. [Google Scholar] [CrossRef]
- Ma, Z.Z.; Lee, Y.; Chen, C.F.P. Booming or emerging? China’s technological capability and international collaboration in patent activities. Technol. Forecast. Soc. Change 2009, 76, 787–796. [Google Scholar] [CrossRef]
- Hu, M.C.; Mathews, J.A. China’s national innovative capacity. Res. Policy 2008, 37, 1465–1479. [Google Scholar] [CrossRef]
- Lu, H.; Du, D.B.; Qin, X.H. Assessing the dual innovation capability of national innovation system: Empirical evidence from 65 countries. System 2022, 10, 23. [Google Scholar] [CrossRef]
- Liang, Z.; Xue, L. The evolution of China’s IPR system and its impact on the patenting behaviours and strategies of multinationals in China. Int. J. Technol. Manag. 2010, 51, 469–496. [Google Scholar] [CrossRef]
- Wang, Y.; Li-Ying, J. How do the BRIC countries play their roles in the global innovation arena? A study based on USPTO patents during 1990–2009. Scientometrics 2013, 98, 1065–1083. [Google Scholar] [CrossRef]
- Wu, C.-Y. Comparisons of technological innovation capabilities in the solar photovoltaic industries of Taiwan, China, and Korea. Scientometrics 2013, 98, 429–446. [Google Scholar] [CrossRef]
Disclaimer/Publisher’s Note: The statements, opinions and data contained in all publications are solely those of the individual author(s) and contributor(s) and not of MDPI and/or the editor(s). MDPI and/or the editor(s) disclaim responsibility for any injury to people or property resulting from any ideas, methods, instructions or products referred to in the content. |
© 2023 by the authors. Licensee MDPI, Basel, Switzerland. This article is an open access article distributed under the terms and conditions of the Creative Commons Attribution (CC BY) license (https://creativecommons.org/licenses/by/4.0/).

