Abstract
This article aims to provide valuable new insights into organizations implementing Lean Manufacturing (LM) as a continuous improvement strategy, focusing on those which are reducing waste in order to increase their competitiveness. A statistical approach was used to model the causal relationships between LM Critical Success Factors (CSFs) to achieve this goal. We used an instrument which has been previously validated in the transportation equipment manufacturing sector in the Mexican manufacturing industry. The proposed hypotheses were subjected to empirical tests using the Structural Equation Modeling (SEM) technique. The results indicate that Top Management Involvement and Commitment, with Project Leadership as a mediator, contributes indirectly and significantly to the increase in the benefits of LM projects. In addition, it was observed that Customer Focus, Linking Lean to the Suppliers, and Training and Education directly influence the increase in the benefits of LM projects in the sector. These findings offer a frame of reference for manufacturing industries with similar characteristics to the sector in this study who wish to increase their benefits by developing projects using LM methodology.
1. Introduction
Globalization has facilitated the expansion of market prospects for enterprises, intensifying rivalry within the industry and necessitating the exploration of different strategies to enhance products. Furthermore, technological advancements within the industry have created a pressing need for innovation in order to attain a competitive edge [1]. In this context, Lean Manufacturing (LM) practices and the continuous flow of value-added activities can result in improving operational performance and meeting customers’ demands [2].
LM methodology, which has been adopted across various countries and sectors [3], is founded on concepts, practices, tools, and strategies that aim to maximize resource utilization and reduce non-value-adding activities for the customer [4]. By using this methodology, waste, meaning anything that does not contribute to the final product, is reduced, and we seek to eliminate it [5]. LM has established itself as a successful alternative in manufacturing, increasing the efficiency and performance of processes and improving operational management activities in the pursuit of industrial excellence [6]. Combined with Six Sigma, both of these methodologies have become indispensable to maintaining a competitive advantage [7].
Therefore, LM’s central objective is to create an organization with efficient processes and products that meet the customers’ standards regarding quality by optimizing all the available resources [8]. However, despite having access to operations management knowledge and resources, many companies require some help to become Lean Manufacturing, and thus more efficient and world-class, companies [5,8]. Therefore, companies must identify and comprehend the Critical Success Factors (CSFs) in order to implement this methodology effectively [7].
In this sense, the success of initiatives is determined by a series of factors known as CSFs when implementing LM. These CSFs are key activities necessary for managers to achieve their objectives and obtain favorable results, avoiding costly failures in the process [9]. Due to the importance of CSFs, several studies have been conducted to further explore this topic [3] and provide managers with adequate information that allows them to evaluate progress in each area.
Hence, the primary objective of this study is to establish a comprehensive model that explains the correlations between CSFs and their influence on the advantages derived from LM initiatives within the transportation equipment manufacturing industry in Mexico. This sector is of crucial importance for the country since it represents 32% of the manufacturing establishments in Mexico, making it one of the leading employers in the country, absorbing approximately 14% of the labor force and comprising 28% of Mexican exports [10]. In addition, it plays a significant role in national Gross Domestic Product, as it contributes 4% [11].
It is essential to highlight that this manufacturing subsector in Mexico covers a wide range of activities related to the production and assembly of manufactured products, primarily on transportation equipment, such as motor vehicles, industrial machinery, electronic components, and other products related to mobility and transportation [10].
We have aimed to establish the importance of this study in this Introduction. Now, the remainder of this paper is structured as follows: A review of the relevant literature is carried out next, where we also present the development of our research hypotheses. Then, the methodology used for sampling and data collection is detailed, in addition to developing the Structural Equations Model. Finally, the results are presented, a corresponding discussion is created, pertinent conclusions are drawn, the identified limitations are addressed, and possible future work is outlined.
1.1. Literature Review
Many research studies have investigated the factors that contribute to the successful implementation of Lean Manufacturing practices in firms across diverse global contexts [1]. These inquiries encompass a broad spectrum of methodological approaches, spanning theoretical exploration, applied research, and quantitative analysis, all sharing the common objective of elucidating the driving forces, validating existing components, and scrutinizing other pertinent dimensions.
For example, an insightful investigation [8] assessed the extent of the implementation of Lean Manufacturing within the Malaysian automotive industry, culminating in the derivation of a mean level of implementation across five meticulously examined variables. In parallel, the research conducted by [3] focused on the examination of soft practices as pivotal elements in achieving the successful implementation of Lean Manufacturing (LM). This comprehensive analysis assessed the practices intricately tied to the human aspect within the Lean context, employing factor analysis and Structural Equation Modeling.
Moreover, [1] embarked on an exploratory expedition to uncover the Critical Success Factors (CSFs) in the implementation of Lean Manufacturing (LM). This journey involved interviews with upper and middle management in Gujarat, a prominent hub for major automobile factories such as Honda, Ford, Tata, and General Motors; in total, the authors visited 32 automotive companies. The authors used a blended research technique, amalgamating a literature review and case study analysis within two manufacturing enterprises. This research extended its scope to examining the implementation of Lean Six Sigma. It identified five pivotal CSFs, including senior management commitment, training, project prioritization, culture, and change infrastructure.
In addition, an illuminating case study unfolded which focused on an automotive plant in India, where educators and students actively engaged in the Lean systems’ teaching–learning process. This endeavor unveiled effective leadership, project teams, management tools, project management, and senior management commitment as Critical Success Factors, yielding economic gains, developmental benefits, and sustainable competitive advantages [1].
In another realm, one study focused on the degree of the implementation of Lean Manufacturing and other initiatives among 14 automotive manufacturing SMEs in India. Data were meticulously gathered using semi-structured analyses and interviews, ultimately revealing that these companies possessed a profound understanding of Lean concepts, with leadership and organizational culture emerging as pivotal factors for Lean success [3].
Shifting the focus to Lean Six Sigma, Habidin and Yusof [4] embarked on a study to pinpoint the Critical Success Factors to be implemented in the Malaysian automotive industry. This investigation employed factorial and confirmatory analysis, culminating in identifying two paramount factors: leadership and customer focus.
Furthermore, [5] conducted a comprehensive literature review alongside a study of automotive companies engaged in adopting or beginning to implement the Lean system, particularly in India. Using surveys, they discovered several barriers hindering full-fledged Lean development. These obstacles included a lack of management commitment, inadequate Lean planning, resource misallocation, deficiencies in client centricity, insufficient vision and strategy for Lean implementation, suboptimal tool and practice selection, and inadequate employee training in the Lean system.
Finally, it is important to mention that the contribution of our research is based on the continuation and expansion of the study carried out by [12], in which a survey was designed and validated to collect data related to the successful implementation of LM Projects in the transportation equipment manufacturing sector in Mexico. In this study, five fundamental CSFs were identified as key to the success of these projects: Top Management Involvement and Commitment (TMIC), Project Leadership (PL), Training and Education (TE), Customer Focus (CF), and Linking Lean to the Suppliers (LLS). In addition, the associated Benefits (B) were also evaluated as a latent variable. In this study, it was found that the factor which receives the most attention during the development of LM projects is TMIC. However, it is important to note that the previous study did not explore the structural relationships between these CSFs, nor did it measure their direct and indirect effects on the benefits of LM projects. Therefore, the main objective of the present investigation is to use the survey provided by [12] as a starting point to develop and statistically validate a model that elucidates the interactions between the CSFs essential for the successful implementation of LM in the manufacturing sector of transport equipment manufacturing in Mexico. This model provides a numerical representation of how these CSFs relate to and affect each other in LM projects in this particular sector. The results of this research will be of great relevance for those organizations interested in carrying out improvement projects using LM methodology, allowing them to focus their efforts more effectively in order to meet their objective of continuous improvement by providing a solid base for decision making and an evaluation of how to improve the processes in the industry.
1.2. Research Hypothesis
During the comprehensive literature review conducted as part of this study, a total of eight hypotheses (H) were developed:
H1.
Top Management Involvement and Commitment has a direct and positive effect on Project Leadership.
Top management commitment, interdepartmental coordination, and effective leadership in implementing Lean are crucial factors to achieving successful organizational transformation. It is posited that when top management assumes responsibility for coordinating and optimizing all individual departments and operations in the organization [12,13], an environment of trust encourages employee participation in order to achieve organizational goals [14]. Also, project leaders are expected to show evident commitment to implementing the Lean project, generating interest, and communicating changes to all organization members [1]. It is argued that top management commitment, demonstrated through having a clear vision, allocating adequate resources, and strategic leadership, is vital for the successful implementation of Lean initiatives [13]. In this regard, it is believed that managers play a key role in highlighting leadership characteristics such as idealized influence, inspiration, motivation, and intellectual stimulation. These leadership-focused efforts are expected to contribute to the success of Lean Manufacturing practices and the company’s overall performance [15]. In summary, this hypothesis posits that top management commitment, interdepartmental coordination, and effective leadership are the determining factors for achieving successful Lean transformation throughout the organization. These elements are expected to generate trust, motivation, and active employee participation, leading to optimized department operations and improved company performance.
H2:
Top Management Involvement and Commitment has a direct and positive effect on Training and Education.
The investment and commitment of top management in hiring middle management and employees, as well as in implementing Training and Education programs, results in the increased adoption and effective application of Lean methodology in an organization [13]. This investment in infrastructure and skills development is thought to improve the knowledge and capabilities of employees, promoting greater participation and commitment to Lean practices [16]. As a result, organizations that prioritize investment in Training and Education are expected to achieve better results in the implementation of Lean and achieve sustained improvement in their processes and operational performance [17].
H3:
Project Leadership has a direct and positive effect on Training and Education.
A direct correlation exists between the efficacy of leadership in adopting Lean Manufacturing and said leader providing comprehensive training and assistance to employees. In addition, the Training and Education provided by the leader are expected to contribute to improved efficiency when implementing Lean practices and increased employee awareness of operational issues [15]. Also, effective leadership development programs are anticipated to play a crucial role in developing excellent leaders who educate and train employees on the fundamental requirements and concepts of Lean Manufacturing [18].
H4:
Project Leadership has a direct and positive effect on Customer Focus.
Incorporating genuine customer orientation in process design is of utmost importance when applying Lean principles as it is essential for constructing a robust model and striving for excellence in Lean practices [1]. Organizations that adapt and use Lean practices based on perceived requirements for standardization in the marketplace and customer expectations will experience process improvements, such as reduced waste, complexity, and variability, as well as improved customer-centric performance [19]. Within this context, leaders play a pivotal role in instigating transformation, cultivating a culture of excellence, formulating objectives and directives, and crafting a visionary outlook that prioritizes the requirements and anticipations of customers [20].
H5:
Project Leadership has a direct and positive effect on Linking Lean to the Suppliers.
Incorporating Lean supplier management practices into a company’s strategy positively impacts compliance and the quality of raw materials, and ensures that less time is spent on quality inspections [21]. By encouraging suppliers to develop Lean and establishing a strong relationship with them, companies can optimize the pull system and achieve efficient manufacturing and the timely delivery of products to customers. Thus, effective linkage between Lean and suppliers becomes an essential factor for the success of Lean Manufacturing [18].
H6:
Training and Education has a direct positive effect on Benefits.
Individual productivity and the long-term competitiveness and success of organizations are positively affected by the value placed on people and encouraging employees to use their initiative, as well as employee training and empowerment and effective leadership [16]. By providing systematic education that focuses on increasing the mentality of employees, aligning their mission and philosophy with that of the company, and adopting concepts of quality, efficiency, and commitment, organizations can improve their effectiveness and efficiency [16]. In addition, leadership and Lean Manufacturing practices are vital to direct all employees towards a common goal of developing quality products and ensuring that the company they work for survives in an ever-changing business environment [15].
H7:
Linking Lean to the Suppliers has a direct and positive effect on Benefits.
Close coordination and communication with suppliers and the innovation of supplier manufacturing activities to suit plant requirements contribute to the successful implementation of Lean within an organization. By establishing a common goal between organizations and suppliers, waste and cost minimization is achieved [18]. In addition, linking Lean tools with supplier management as a business strategy improves the quality of raw materials, compliance, and reduces the amount of time spent on quality inspections and rework [21]. Consequently, this effective relationship with suppliers positively impacts value chain optimization, inventory reduction, and the ability to produce according to customer requirements [19].
H8:
Customer Focus to the Suppliers has a direct and positive effect on Benefits.
Establishing a customer-centric approach and recognizing the needs of the customer are the fundamental components for effectively implementing Lean principles within a business. Organizations can prioritize the fulfillment of distinct consumer requirements, encompassing aspects such as design, pricing, quality, and reduced lead times, through the implementation of a comprehensive plan rooted in a suitable strategy and a lucid methodology. A robust and enduring commercial rapport is created with customers through the consistent exhibition of product quality that is on par with or surpasses that of other firms within the industry [1]. Also, reliable delivery, shorter lead times, and agile response to demand are achieved by improving processes and reducing waste and complexity, resulting in improved customer-oriented performance and increased customer satisfaction [19]. Consequently, the successful implementation of Lean, based on the customers’ needs and expectations, provides organizations with a competitive advantage by increasing value for their customers compared with their competitors [14].
Based on the information found in the literature, this research proposes and constructs the following hypothetical model (Figure 1).
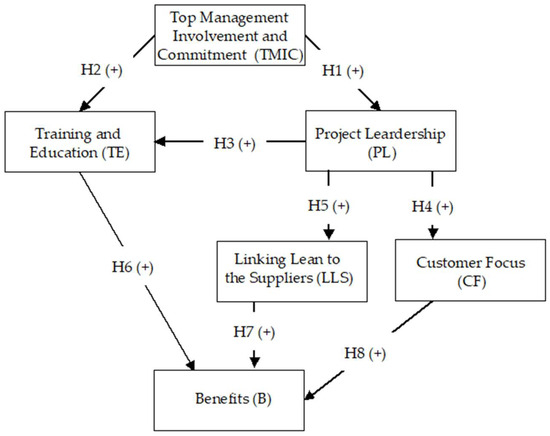
Figure 1.
Hypothetical research model.
2. Materials and Methods
2.1. Collecting and Sampling
For data collection, a 5-stage sampling methodology was followed (Figure 2), as described below:
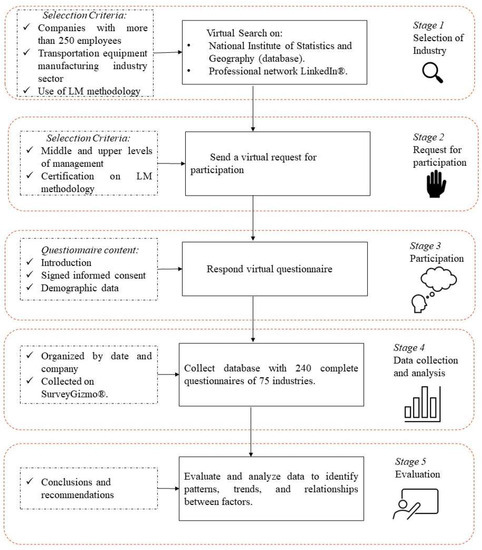
Figure 2.
Sampling methodology for data collection.
Stage 1: Selection of industry. The first stage involved acquiring survey data through the implementation of a cross-sectional study design using virtual tools. The research solely focused on businesses involved in the manufacturing industry located on the northern border of Mexico, which employ more than 250 individuals. Both the National Institute of Statistics and Geography’s database and the professional networking platform LinkedIn® were used to find potential individuals.
Stage 2: Request for participation. The inclusion criteria of the people surveyed were as follows: Participants should be in positions of middle and upper levels of management, including lower-level administrators, project leaders, engineers, supervisors, and executive directors. Also, as a requirement, it was considered whether the respondent had a certification in the implementation of LM methodology; such a certification was validated with the information reported in their public profile on LinkedIn®, and whether they were also actively participating in the implementation of the methodology, specifically oriented towards improvement projects.
Stage 3: Participation. Employees who decided to participate based on their own free will were virtually given the questionnaire to fill out. Data collection occurred virtually using SurveyMonkey®: a message was sent to the selected personnel presenting general information and the objective of the study, in addition to requesting the participant’s informed consent, where it was emphasized to the personnel that their participation was entirely voluntary, anonymous, and confidential. On the other hand, owing to the nature of the study, it was necessary to consider the World Medical Association’s Declaration of Helsinki [22] guidelines. The survey could be completed using computers or smartphones.
Stage 4: Data collection and analysis. Only fully completed surveys were considered; partially completed surveys were discarded by the analyst. A total of 240 valid questionnaires from 75 different industries were collected. The data were collected in a virtual database, organized by date and company. Statistical tools were used to analyze the results of the surveys, and the factors were evaluated.
Stage 5: Evaluation. This consisted of evaluating and analyzing the data to identify patterns, trends, and relationships between the factors, as well as to draw meaningful conclusions.
The data collection methodology employed in this study, along with its validation through the administration of surveys, has been previously utilized by researchers such as Flynn et al. [23] and Malhotra and Grover [24]. Moreover, applying surveys to measure variables using a psychometric approach is a widely accepted practice in social sciences [25].
2.2. Instrument and Measures
For the collection of CSFs, the instrument elaborated by [12] in its Spanish version was used; this instrument demonstrates sufficient validity and statistical reliability, so it is suitable for implementation within the target companies. Its purpose is to assess the impact of Critical Success Factors (CSFs) in developing improvement projects.
The instrument used for the collection is structured as the following four sections: The first section contains the presentation and the objectives of the project. In the second part, the demographic data of both the participant and the company are collected; also in this section, the validation of informed consent is requested, and the participant is free to decline participation if he/she wishes to do so.
In the third part of the instrument, information is collected on the five CSFs in LM projects known as the key factors for any organization: Top Management Involvement and Commitment, which refers to the involvement of Top Management to provide the required training and resources; Training and Education, which refers to the development of a systematic approach to problem solving, providing the necessary tools and knowledge; Project Leadership, which consists of providing guidelines to develop activities that lead to continuous improvement through effective communication and collaboration; Customer Focus, defined as the responsibility of listening to the needs and expectations of the customer, which is the responsibility of the organization, and being able to predict demand; and, finally, Linking Lean to the Suppliers, which consists of seeking to reduce delivery time in each of the stages of the supply chain, spanning the manufacturing of raw materials to the delivery of finished products to the end user [12].
The final section emphasizes the benefits organizations obtain from the implementation of LM projects.
The instrument comprises 31 items divided into 6 constructs, as shown in the results section. The Likert scale was used to collect responses to each item, representing a range of perception in an interval of 5 units ranging from 1 = Never to 5 = Always. The utilization of the five-point Likert scale in this particular study is widely accepted and deemed appropriate for assessing latent variables by means of a collection of interconnected items [26,27].
2.3. Statistical Analysis
A rigorous statistical analysis was conducted to analyze the CSF relationships established in the proposed model. Before developing the Structured Equation Model (SEM), an initial stage of data screening for outliers was carried out using the Mahalanobis distance [28]. To verify compliance with the univariate normality assumptions, kurtosis values were analyzed [29], while multivariate normality was assessed using Mardia’s coefficient [30]. The Variance Inflation Factor (VIF) test was used to verify whether the variables were redundant or mediated the same thing [28].
The current work utilized the exploratory factor analysis developed by De la Vega et al. [12] to validate each of the constructs proposed in the model. A Confirmatory Factor Analysis (CFA) was performed to estimate and validate the measurement model, and the model fit indices were examined [31]. In order to assess the convergent validity of the items, the researchers calculated the Average Variance Extracted (AVE) for each construct. This calculation helps determine whether the items effectively measure a particular construct [31]. Cronbach’s alpha coefficient was employed to assess a construct’s inter-item reliability [32].
The measurement model under consideration was assessed by applying Structural Equation Modeling (SEM), utilizing the Maximum Likelihood Estimation (MLE) method. Both the global index and fit indices, categorized into three classifications, were employed to assess the adequacy of the data in relation to the suggested model. The initial criterion that was computed was the relative chi-square, which was obtained by dividing the chi-square value by the degrees of freedom. This criterion is used to assess the level of discrepancy in the model, mainly when dealing with large sample sizes. The study examined various fit indices across three categories: absolute fit indices, incremental fit indices, and parsimony fit indices. The Root Mean Square Error of Approximation (RMSEA) was assessed in the category of absolute fit indices. The category of incremental fit indices included the Comparative Fit Index (CFI), the Tucker–Lewis Index (TLI), and the Incremental Fit Index (IFI). Lastly, the parsimony fit indices category considered the Parsimony Ratio (PRATIO), the Adjusted Goodness-of-Fit Index (AGFI), and the Parsimony Normalized Fit Index (PNFI) [32,33]. It is advisable to employ a minimum of two categories of model fit criteria to evaluate model fit [31].
In addition to the fit indices, the results of the model allowed us to estimate the direction and magnitude of the variables, along with significant relationships, through assessing the direct, indirect, and total effects among the variables. The proposed model was ultimately validated by the utilization of the Expected Cross-Validation Index (ECVI) approach [28].
Statistical analysis was conducted using the IBM SPSS® Statistics program, specifically version 23 of the 64-bit edition. Additionally, the Analysis of Moment Structures (AMOSs) was employed as a supplementary package.
3. Results
3.1. Statistical Analysis of the Sample and the Instrument
A total of 1580 surveys were sent to the target sector, of which we received 240 complete questionnaires. Table 1 shows the profile of the participants: more than half (85%) were men, and only 15% were women. The aerospace equipment and cars and trucks subsectors were the most represented, with 17.5% participation, while the bodies and trailers subsector represented only 12% of participation. Regarding the experience that the participants had in the development of Lean projects, 40% of them already had at least 2 years of experience and up to 5 years of experience in the management of this methodology. Regarding their position in the company, those involved in product and process engineering and product design participated the most, with 20% and 15% participation, respectively.

Table 1.
Descriptive statistics of the sample.
Table 2 shows the statistics of the constructs that make up the administered questionnaire. In the case of the TMIC construct, there is a tendency towards high scores, meaning the participants consider that there is “almost always or always” participation and commitment from top management to develop projects aimed at obtaining improvements.
Table 2.
Statistical of instrument.
In the aspect of Project Leadership, again, a clear trend is shown towards a tendency for high scores; however, it is interesting to note that in the item “Explains rules and expectations to the work group”, the mode is a unit below the other items. Regarding the TE construct, the item “Training is available for members of this team when we need it” received the lowest score (mode 4); however, when concerning the others, it is still above three points, which indicates that training is almost always provided to team members. Customer Focus is the dimension with the lowest scores concerning the mode, which could be seen as an opportunity for improvement. For the LLS dimension, the item “Suppliers are involved in LM projects” presented the lowest scores with respect to the mean and mode. And, finally, for the benefits construct, the mean and mode results clearly show that people agree that companies benefit when implementing improvement projects using LM methodology.
3.2. Data Screening
The first filter eliminated incomplete or partially answered surveys, after which 7 outliers were detected and eliminated, leaving 233 data for subsequent analysis.
The absolute values of kurtosis were employed to evaluate the univariate normality. Leptokurtic frequency distributions exhibited a spectrum of values ranging from 0.016 to 1.944, while the observed platykurtic frequency distribution exhibited a range of values spanning from −1.052 to −0.001. The analysis of the sample data did not reveal any instances of high kurtosis, defined as a value exceeding three [29].
The Mardia coefficient was utilized in the evaluation of multivariate normality. This procedure involves comparing the Mardia coefficient derived from SPSS AMOS using the study data to a value derived from the formula p(p + 2), where p is the number of observable variables in the model. The calculated value is anticipated to exceed the aforementioned threshold. Considering the 31 variables included in the model, the calculated value is 1023, greater than that obtained in the Amos program, which was 157.648, so this condition is met.
The VIF values observed in this study varied from 2.003 to 5.022. These findings indicate that all VIF values were below the threshold of 10, suggesting the absence of multicollinearity issues in the dataset [28].
3.3. Factor Analysis
The best way to validate the results is to adopt a confirmatory perspective and evaluate the reproducibility of the outcomes [31]. With the sample obtained from the transportation industry sector in Mexico, a Confirmatory Factor Analysis was developed to validate the proposed model, which includes the Critical Success Factors in LM projects, as well as their benefits, characterized through the following variables: TMIC, PL, TE, CF, LLS, and B. The results showed that the model adequately represents the considered constructs since compliance with an adequate fit is observed in the following goodness-of-fit indices [28]: a significant χ2/df = 1.682 with 415 degrees of freedom, RSMEA = 0.053, GFI = 0.849, TLI = 0.941, CFI = 0.948, PRATIO = 0.892, and PNFI = 0.786.
The results of the convergent validity are displayed in Table 3, where it is possible to observe that all of the constructs demonstrated satisfactory convergence, as indicated by their AVE values exceeding 0.5 [31]. The AVE values found on the main diagonal were greater than the estimated squared correlations. This observation proves that each construct possesses distinct characteristics and effectively examines the phenomenon, thus supporting discriminant validity.
Table 3.
Results of the construct validity analysis.
Cronbach’s Alpha presented the following values for each construct: TMIC = 0.890, PL = 0.929, TE = 0.900, CF = 0.850, LLS = 0.832, and B = 0.857, considering good results to be higher than the minimum accepted of 0.70 [31].
3.4. Structural Equations Model (SEM)
After validating the measurement model, the proposed structural model was evaluated on a solid theoretical basis to test the hypothetical relationships between the Critical Success Factors and their benefits. It is essential to note that all postulated relationships have a positive impact, meaning that an increase in the independent variable would correspondingly result in an increase in the dependent variable. Figure 3 presents the initial structural equation model that has been proposed. Each path within the figure represents the relationship between the various constructs that have been hypothesized. The standardized estimates of these paths have been tested for significance at a confidence level of 95%.
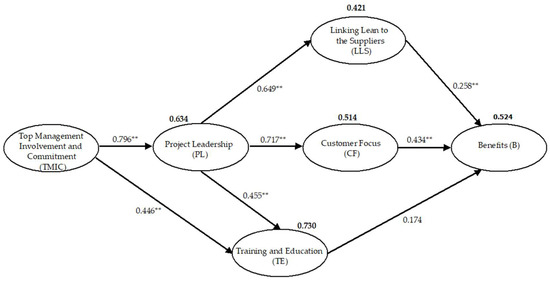
Figure 3.
Initial structural equation model with standardized regression weights. Variability is represented by the numbers in bold. Statistical significance at ** p < 0.01.
The study’s findings show that the relationships indicated in the hypothetical model are supported by the results of the structural model, as depicted in Figure 3.
The independent variable TMIC showed the strongest relationship of the whole model towards the variable PL (H1), while other strong relationships could also be observed from PL with three of the other variables, namely TE, CF, and LLS. Furthermore, profits were positively impacted by LLS, CF, and, at a moderate level, TE, as opposed to LLS and CF.
Due to the sensitivity of the chi-square estimation to sample size, a total of eight goodness-of-fit indices were employed across three categories to assess the adequacy of the proposed model, as depicted in Table 4.
Table 4.
SEM model fit measures.
Table 5 presents the results of the estimations. For the present investigation, most of the hypotheses were accepted; the positive relationship of TMIC with PL was the most representative due to its high estimation value, while the relationship of TE to B was the lowest in the model.
Table 5.
Hypothesis testing results.
In order to propose a final structural equation model describing the relationships among the significant variables, the positive relationship initially hypothesized between TE and B variables was removed as it did not yield statistical significance. Figure 4 depicts the final model containing only the significant variables, while Table 4 presents their fit indices.
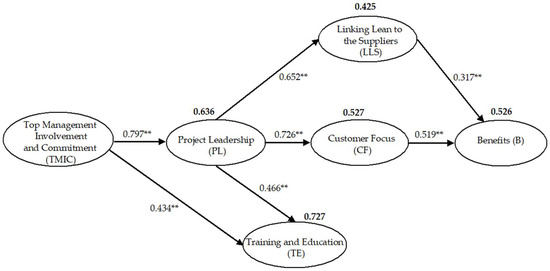
Figure 4.
Final structural equation model with standardized regression weights. Variability is represented by the numbers in bold. Statistical significance at ** p < 0.01.
The direct, indirect, and total effects of the final structural equation model are presented in Table 6. Customer Focus is indirectly influenced by TMIC as well as by PL, which explains 52% of its variability. TE, despite being directly influenced by TMIC, is also indirectly influenced, having PL as a mediator, and these relationships explain 72% of its variability. In the case of Benefits, it was possible to observe the indirect influence of TMIC and PL, which influenced 52% of the variability of B.
Table 6.
Effects decomposition of final structural equation model.
3.5. Validation of the Final Model
The validation of the proposed model was carried out through the Expected Cross-Validation Index (ECVI). In the present investigation, We considered dividing the total sample into groups identified as Groups A and B, with 116 data each. The results with the values of the cross-validation indices with a confidence interval of 90% for each of the samples were as follows: ECVI (A) = 7.229, with a confidence interval [6.643 to 7.885] and ECVI (B) = 7.228, with a confidence interval [6.642 to 7.882]. As can be seen, the ECVI (A) and ECVI (B) values, as well as their confidence intervals, are very similar in samples A and B, thus confirming the validity of the proposed model.
4. Discussion
The findings of the proposed model show that in the manufacturing industries of the transport equipment manufacturing sector, there is a strong and direct relationship between the involvement and commitment factor of senior management towards the project leadership; this means that executives, managers, and senior managers have invested time and resources to train employees and middle managers in leadership skills. In their study, Zhang et al. [37] mention that for a company to provide sufficient training to its employees and middle managers, it depends to a large extent on the skills of the upper management level. Additionally, in their study, Zala et al. [38] mention that senior management must provide active leadership to all departments. Senior management must promote the importance of and show commitment towards implementing improvement projects such as Lean Manufacturing for the benefit of the entire organization. Mathiyazhagan et al. [39] mention that the vision of senior management is essential since it drives the process of leadership and the implementation of Lean practices in industries. On the other hand, Nguyen & Chinh [1] mention that the leader is responsible for the success of the implementation of Lean since they encourage employees to be involved in change and the benefits that are therefore generated.
Top Management Involvement and Commitment has a direct and indirect effect, through Project Leaders, on Training and Education. Managers invest resources such as time, training, space for staff training, and coaching programs, while project leaders encourage employee involvement by guiding them and making them feel like part of the team. Previous research, such as that conducted by Abu et al. [40], mentions that lack of time, manpower, and financial resources are the main challenges towards enforcing the Training and Education needed to implement Lean Manufacturing.
Another factor that was found in this model within manufacturing companies is that the involvement and commitment factor of senior management has an indirect effect on Customer Focus and supplier focus. This is due to the fact that through intermediate managers, which is a form of leadership, it is possible to promote actions to design new strategies to find new suppliers that adapt to the rapid changes in the organization and always seek to satisfy the demands and needs of customers through a well-developed production plan without leaving aside the fulfillment of the requirements of the quality of the product and/or service. Nguyen & Chinh [1] mention that a company makes a strategic production plan in order to satisfy all customer orders. On the other hand, Zala et al. [38] concluded in their study that Customer Focus refers to feedback and regular meetings with customers, and that satisfying customers is of great importance in order to remain within a competitive environment.
It was also found that Top Management Involvement and Commitment has an indirect effect on Benefits. All actions and decisions taken by top management affect the bottom line, so a high level of top management involvement can be considered a competitive advantage for organizations over their competitors [39]. On the other hand, it is difficult to implement Lean if there is no top management support and involvement [40]. As was found in the research conducted by [41], we understand how important commitment from top and middle management is in the implementation of LM; without fully understanding the philosophy, there is no efficient way to implement adequate planning, which results in an environment of apathy among lower-level workers, the incapacity to fully provide and please clients, and, with a matter of importance, ease the economical advance of other companies in the same industrial sector.
Regarding Project Leadership, this was observed to have a direct effect with Training and Education. Leaders and senior managers must be trained in and convinced of the practices of Lean methodology; this way, projects are executed using these practices, and the optimal results that Lean offers will be achieved. As mentioned in his study, [1] expressed that leaders must understand the Lean philosophy in order to manage a Lean project efficiently. Moreover, from the point of view of leadership, training in Lean should be managed for the project participants so that its implementation is successful, since the rest of the team are the ones that will actually be executing the practice. In addition to providing training through course management, before implementing a Lean project, a company needs to determine the level of understanding of, and confidence that their leaders have in, Lean [1]. They are also the leaders who empower and motivate workers to make decisions. Through the leader, the motivation of employees is promoted to implement Lean practices at all levels within the company. Sureerattanan et al. [15], in their study, state that the leader is responsible for communicating the objectives and achievements of the project as it is being carried out; it is through leadership that employees are trained to make decisions and solve problems.
On the other hand, other significant relationships were found in the transportation equipment manufacturing sector. A direct effect of Project Leadership on Customer Focus was observed. It was found that leadership promotes actions to complete project objectives, including achieving levels of quality that meet the customer’s specific requirements. This implies that the product or service must have specific characteristics and be free of defects so that the customer is willing to pay for it [20].
The results of the study also showed Project Leadership to have an indirect effect on Benefits. In recent years, the Lean methodology has proven its effectiveness in improving the performance of manufacturing companies, increasing their productivity, reducing costs, and increasing profits, and, therefore, their competitiveness. The implementation of Lean Manufacturing is strengthened when the leader of a company creates a work atmosphere which is based on communication and motivation. These companies can survive economic fluctuations and improve their performance and profitability if the leader maintains Lean practices with motivated and inspired employees [15].
Additionally, Training and Education were shown to have a direct effect on profits, even though the initial hypothesis was rejected. Therefore, having a solid training program on Lean implementation that increases employees’ skills, abilities, and decision-making capabilities is conducive to increased quality, reduced costs, improved lead times, greater flexibility, better use of resources, increased productivity, and reduced inventory [3].
Finally, Customer Focus also has a direct effect on Benefits. To become a high-quality, competitive company, it is necessary to demonstrate that product and service quality is on par with the competition. Meeting customer expectations is one of the most important objectives of any company, and using Lean practices in accordance with customer requirements improves processes, reduces costs, and ensures process variability [1,19].
5. Conclusions
Organizations must have a corporate vision and an innovation mindset that allows them to define the direction in which they want to take their business to generate higher profits and benefits for their employees. To achieve this, it is necessary to carry out improvement projects, such as implementing Lean Manufacturing, by forming interdisciplinary teams with strong leadership and a skilled team that is involved in and successfully executes the necessary activities to achieve the project’s objectives.
The model proposed in this study seeks to guide management on how companies should focus their efforts to implement Lean Manufacturing in the transportation equipment manufacturing industry. Manufacturing companies in Mexico, within this sector, can successfully implement Lean Manufacturing methodology if managers are directly involved in these projects, ensuring that the necessary resources, such as training, coaching, and training of project leaders, are provided by top management. It is also important to consider in this model the importance of understanding the customers’ needs and requirements, as well as having a program or list of suppliers that adopt the same philosophy and way of working.
6. Limitations and Future Work
The following are the key restrictions of this investigation: The study is, first and foremost, cross-sectional in nature and regional in breadth. The data utilized to validate the structural model were derived from a representative sample of the research population, namely the Mexican manufacturing industry, and collected at a specific period. As a suggestion for future work, longitudinal research on the same phenomenon (LM implementation and benefits in the Transportation Equipment Manufacturing Industry) would be relevant to compare the behavior of the relationships between LM CSFs over time. Second, we propose replicating the study in different geographical areas and other industrial sectors within Mexican manufacturing businesses to explore whether cultural- and context-related factors influence model outputs. Finally, based on the researchers’ knowledge or experience, it may be fascinating to incorporate some additional variables and hypothetical linkages into the structural model.
Author Contributions
Conceptualization, M.D.l.V. and Y.B.-L.; Formal analysis, M.D.l.V.; Investigation, Y.B.-L.; Methodology, S.M.-V. and Y.B.-L.; Supervision, D.T.; Validation, J.L.-R. and D.T.; Writing—original draft, M.D.l.V. and S.M.-V.; Writing—review & editing, J.L.-R. and E.A.C.-M. All authors have read and agreed to the published version of the manuscript.
Funding
This research was supported by Grant 351/3277 from the Universidad Autónoma de Baja California.
Data Availability Statement
The data presented in this study are available on request from the corresponding author.
Conflicts of Interest
The authors declare no conflict of interest.
References
- Nguyen, N.T.D.; Chinh, N.Q. Exploring critical factors for successfully implementing lean manufacturing at manufacturing companies in Vietnam. Int. J. Qual. Res. 2017, 11, 437–456. [Google Scholar] [CrossRef]
- Knol, W.H.; Slomp, J.; Schouteten, R.L.J.; Lauche, K. Implementing lean practices in manufacturing SMEs: Testing ‘critical success factors’ using Necessary Condition Analysis. Int. J. Prod. Res. 2018, 56, 3955–3973. [Google Scholar] [CrossRef]
- Hernandez-Matias, J.C.; Ocampo, J.R.; Hidalgo, A.; Vizan, A. Lean manufacturing and operational performance: Interrelationships between human-related lean practices. J. Manuf. Technol. Manag. 2020, 31, 217–235. [Google Scholar] [CrossRef]
- Čiarnienė, R.; Vienažindienė, M. An Empirical Study of Lean Concept Manifestation. Procedia Soc. Behav. Sci. 2015, 207, 225–233. [Google Scholar] [CrossRef]
- Rahman, N.A.A.A.; Sharif, S.M.; Esa, M.M. Lean Manufacturing Case Study with Kanban System Implementation. Procedia Econ. Financ. 2013, 7, 174–180. [Google Scholar] [CrossRef]
- Shrafat, F.D.; Ismail, M. Structural equation modeling of lean manufacturing practices in a developing country context. J. Manuf. Technol. Manag. 2019, 30, 122–145. [Google Scholar] [CrossRef]
- Alhuraish, I.; Robledo, C.; Kobi, A. A comparative exploration of lean manufacturing and six sigma in terms of their critical success factors. J. Clean. Prod. 2017, 164, 325–337. [Google Scholar] [CrossRef]
- Nordin, N.; Md Deros, B.; Abd Wahab, D. A Survey on Lean Manufacturing Implementation in Malaysian Automotive Industry. Int. J. Automot. Mech. Eng. 2010, 1, 374–380. Available online: http://ijimt.org/papers/68-M457.pdf (accessed on 10 February 2023).
- Netland, T.H. Critical success factors for implementing lean production: The effect of contingencies. Int. J. Prod. Res. 2016, 54, 2433–2448. [Google Scholar] [CrossRef]
- INEGI. Censos Económicos 2019. Available online: https://www.inegi.org.mx/programas/ce/2019/#Informacion_general (accessed on 9 March 2021).
- Industria Nacional de Autopartes, A.C. Perspectives of the Automotive Industry in Mexico. Available online: https://ina.com.mx/wp-content/uploads/2022/07/Folleto-INA.pdf (accessed on 3 March 2023).
- De La Vega, M.; Baez-Lopez, Y.; Limon-Romero, J.; Tlapa, D.; Flores, D.-L.; Rodríguez, M.I.; Maldonado-Macías, A.A. Lean Manufacturing Critical Success Factors for the Transportation Equipment Manufacturing Industry in Mexico. IEEE Access 2020, 8, 168534–168545. [Google Scholar] [CrossRef]
- Alefari, M.; Salonitis, K.; Xu, Y. The Role of Leadership in Implementing Lean Manufacturing. Procedia CIRP 2017, 63, 756–761. [Google Scholar] [CrossRef]
- Carlo Amora, V.M.; Berlin Juanzon, J.P. A Framework of Critical Success Factors and Success Criteria for Structural Works of a Mixed-Use Building Construction Project. Civ. Engin. 2022, 10, 267–279. [Google Scholar] [CrossRef]
- Sureerattanan, C.; Napompech, K.; Panjakhajornsak, V. Model of Leadership and the Effect of Lean Manufacturing Practices on Firm Performance in Thailand’s Auto Parts Industry. Res. J. Bus. Manag. 2014, 8, 104–117. [Google Scholar] [CrossRef][Green Version]
- Ozkeser, B. Impact of training on employee motivation in human resources management. Procedia Comput. Sci. 2019, 158, 802–810. [Google Scholar] [CrossRef]
- Silva, B.B.; Mergulhão, R.C.; Favoretto, C.; Mendes, G.H.S. Critical success factors of Six Sigma implementations in companies in Brazil. Int. J. Lean Six Sigma 2019, 10, 143–160. [Google Scholar] [CrossRef]
- Alhuraish, I.; Robledo, C.; Kobi, A. Key Success Factors of Implementing Lean Manufacturing and Six Sigma. In Proceedings of the 17th Toulon-Verona International Conference, Excellence in Services, University in Liverpool, Liverpool, UK, 28–29 August 2014. [Google Scholar]
- Van Assen, M.F. Lean, process improvement and customer-focused performance. The moderating effect of perceived organisational context. Total. Qual. Manag. Bus. Excell. 2021, 32, 57–75. [Google Scholar] [CrossRef]
- Santamaria-Peraza, R.; Mejias-Acosta, A. Leadership as a critical success factor for SME management. Reflections for discussion. Ind. Eng. 2020, 38, 97–111. [Google Scholar] [CrossRef]
- Bevilacqua, M.; Ciarapica, F.E. De Sanctis, I. Lean practices implementation and their relationships with operational responsiveness and company performance: An Italian study. Int. J. Prod. Res. 2016, 55, 769–794. [Google Scholar] [CrossRef]
- World Medical Association. Declaration of Helsinki—Ethical Principles for Medical Research Involving Human Subjects. 2017. Available online: https://www.wma.net/es/policies-post/declaracion-de-helsinki-de-la-amm-principios-eticos-para-las-investigaciones-medicas-en-seres-humanos/ (accessed on 16 August 2019).
- Flynn, B.B.; Sakakibara, S.; Schroeder, R.G.; Bates, K.A.; Flynn, E.J. Empirical research methods in operations management. J. Oper. Manag. 1990, 9, 250–284. [Google Scholar] [CrossRef]
- Malhotra, M.K.; Grover, V. An assessment of survey research in POM: From constructs to theory. Jour. Oper. Manag. 1998, 16, 407–425. [Google Scholar] [CrossRef]
- Price, L.R. Psychometric Methods: Theory into Practice; Guilford Press: New York, NY, USA, 2017. [Google Scholar]
- Maciel-Monteon, M.; Limon-Romero, J.; Gastelum-Acosta, C.; Tlapa, D.; Baez-Lopez, Y.; Solano-Lamphar, H.A. Measuring Critical Success Factors for Six Sigma in Higher Education Institutions: Development and Validation of a Surveying Instrument. IEEE Access 2020, 8, 1813–1823. [Google Scholar] [CrossRef]
- Carpita, M.; Manisera, M. Constructing indicators of unobservable variables from parallel measurements. Electron. J. Appl. Statist. Anal. 2012, 5, 320–326. [Google Scholar] [CrossRef]
- Kline, R.B. Principles and Practice of Structural Equation Modeling, 4th ed.; The Guilford Press: New York, NY, USA, 2016. [Google Scholar]
- DeCarlo, L.T. On the meaning and use of kurtosis. Psychol. Methods 1997, 2, 292–307. [Google Scholar] [CrossRef]
- Mardia, K.V. Measures of multivariate skewness and kurtosis with applications. Biometrika 1970, 57, 519–530. [Google Scholar] [CrossRef]
- Hair, J.F.; Black, W.C.; Babin, B.J.; Anderson, R.E. Multivariate Data Analysis, 7th ed.; Pearson: New York, NY, USA, 2014. [Google Scholar] [CrossRef]
- Cronbach, L.J. Coefficient alpha and the internal structure of tests. Psychometrika 1951, 16, 297–334. [Google Scholar] [CrossRef]
- Schumacker, R.E.; Lomax, R.G. A Beginner’s Guide to Structural Equation Modeling, 4th ed.; Taylor & Francis: New York, NY, USA; London, UK, 2016. [Google Scholar] [CrossRef]
- Bollen, K.A. A new incremental fit index for general structural equation models. Sociol. Methods. Res. 1989, 17, 303–316. [Google Scholar] [CrossRef]
- Browne, M.; Cudeck, R. Alternative Ways of Assessing Model Fit. In Testing Structural Equation Model; Bollen, K.A., Long, J.S., Eds.; Sage: Newbury Park, CA, USA, 1993. [Google Scholar]
- Mulaik, S.A.; James, L.R.; Van Alstine, J.; Bennett, N.; Lind, S.; Stilwell, D.C. Evaluation of goodness-of-fit indices for structural equation models. Psychol. Bull. 1989, 105, 430–445. [Google Scholar] [CrossRef]
- Zhang, L.; Narkhede, B.E.; Chaple, A.P. Evaluating lean manufacturing barriers: An interpretive process. J. Manuf. Technol. Manag. 2017, 28, 1086–1114. [Google Scholar] [CrossRef]
- Zala, S.; Gohil, A.; Dave, K.; Patel, V. Critical success factors and impending factors for implementing change methods in small and medium scale automobile manufacturing plants. Mater. Today Proc. 2020, 33, 4501–4508. [Google Scholar] [CrossRef]
- Mathiyazhagan, K.; Gnanavelbabu, A.; Kumar, N.N.; Agarwal, V. A framework for implementing sustainable lean manufacturing in the electrical and electronics component manufacturing industry: An emerging economies country perspective. J. Clean. Prod. 2021, 334, 130169. [Google Scholar] [CrossRef]
- Abu, F.; Gholami, H.; Mat Saman, M.; Zakuan, N.; Streimikiene, D. The implementation of lean manufacturing in the furniture industry: A review and analysis on the motives, barriers, challenges, and the applications. J. Clean. Prod. 2019, 234, 660–680. [Google Scholar] [CrossRef]
- Tiwari, R.K.; Tiwari, J.K. Prioritization of barriers to Lean Implementation in Indian Automotive Small & Medium Size enterprises. Manag. Prod. Eng. Rev. 2018, 9, 69–79. [Google Scholar] [CrossRef]


Disclaimer/Publisher’s Note: The statements, opinions and data contained in all publications are solely those of the individual author(s) and contributor(s) and not of MDPI and/or the editor(s). MDPI and/or the editor(s) disclaim responsibility for any injury to people or property resulting from any ideas, methods, instructions or products referred to in the content. |
© 2023 by the authors. Licensee MDPI, Basel, Switzerland. This article is an open access article distributed under the terms and conditions of the Creative Commons Attribution (CC BY) license (https://creativecommons.org/licenses/by/4.0/).