Article

A Study on the Drivers of Carbon Emissions in China’s Power Industry Based on an Improved PDA Method

School of Management, Shanghai University of Electric Power, Shanghai 201306, China
*
Author to whom correspondence should be addressed.
Systems 2023, 11(10), 495; https://doi.org/10.3390/systems11100495
Submission received: 22 August 2023 / Revised: 16 September 2023 / Accepted: 25 September 2023 / Published: 28 September 2023

Abstract

:
The power industry is a major source of carbon emissions in China. In order to better explore the driving factors of carbon emissions in China’s power industry and assist the Chinese government in formulating emission reduction strategies for the power industry, this study applies the improved production-theoretical decomposition analysis (PDA) method to analyze the carbon emission drivers of China’s power industry. This study investigates the impact of energy intensity, per capita GDP, population density, power generation structure, and environmental climate on carbon emissions in China’s power industry in 30 provinces from 2005 to 2020. It was found that the carbon emission ratios of the power sector in all provinces and cities are basically greater than 1, which indicates that carbon emissions in most of the power sectors in the country are still increasing as of 2020. Overall, the effects of potential thermal fuel carbon emission efficiency, potential thermal energy consumption efficiency, the carbon emission efficiency of thermal power generation, economic scale, population density, and annual rainfall change are mostly greater than 1 and will promote the growth of carbon emissions in the power sector. Moreover, the effects of thermal power generation energy efficiency technology, thermal power generation emission reduction technology, power generation structure, and power generation per unit GDP are mostly less than 1 and will inhibit the growth of carbon emissions in the power sector. However, each of these drivers does not have the same degree of influence and impact effect for each province and city. Based on the research results, some policy recommendations are proposed.

1. Introduction

As the greenhouse effect intensifies, countries around the world are becoming aware of the impact of carbon emissions due to energy consumption on the long-term development of natural ecosystems and economic systems, and reducing carbon emissions due to energy consumption is an urgent issue to be addressed [1,2]. Since 2006, China has become the world’s largest emitter of CO2, facing severe environmental and political pressures. The power industry in China, as a high-energy-consumption sector, accounts for over 40% of carbon emissions generated by energy consumption. Despite the increasing use of renewable energy in recent years, fossil fuels still accounted for over 65% of China’s total electricity generation in 2022 [3,4]. Additionally, resource reserves, power generation structures, and ecological environments vary among different provinces and cities in China [5]. This results in significant differences among power generation industries in various provinces and cities. Therefore, it is necessary to analyze the driving factors of carbon emissions in the power industry to further assist the government in developing more targeted emission reduction policies for the power industry.
In order to address the increasingly severe greenhouse effect problem, existing research has been conducted to study the drivers of carbon emissions via the use of decomposition analysis [6,7,8]. Decomposition analysis can directly or indirectly decompose carbon emissions changes into factors, such as energy intensity and economic activity, to explore the impact of these drivers [9,10,11]. Currently, widely used decomposition analysis methods are mainly divided into three categories: structural decomposition analysis (SDA), index decomposition analysis (IDA), and production-theoretical decomposition analysis (PDA).
The SDA method is based on the input–output theory and can analyze the impact of different industries on overall performance changes [12]. SDA can analyze structural effects from consumption and demand dimensions [13,14,15], but data collection is difficult. IDA and PDA methods simplify the difficulty of data collection via panel data analysis. IDA is commonly used to assess environment-related issues [16,17]. The Logarithmic Mean Divisia Index (LMDI) is a commonly used method within IDA because it can better handle residual problems and zero-value issues compared to other methods [18,19,20]. However, IDA methods have difficulty measuring the impact of technological differences in different regions. PDA methods can solve this problem well.
The PDA method is superior to the above two methods because it combines the distance function, data envelopment analysis (DEA), and production technology to better measure the impact of technological differences. PDA was first applied to the energy field by Zhou and Ang [21], who decomposed carbon emissions for OECD (Organization for Economic Co-operation and Development) countries and explored the impact of seven factors, including technological progress, carbon emissions, and the technical efficiency of energy conservation on carbon emissions. Some researchers have proposed extended PDA methods for provinces [22], regions [23], cities [24], and sector sizes [25].
Many researchers have devoted themselves to improving the PDA method. These improvements mainly focus on two important components of the PDA model, namely the DEA method and decomposition process. From the perspective of the DEA method, Zhang et al. [26] extended the efficiency measurement of the distance function to multiple input and output variables. Wang [27] studied the substitution effect between inputs using PDA. Wang et al. [28] combined the meta-frontier approach with the PDA model to solve the heterogeneity among decision-making units (DMUs). However, the decomposition process in these studies still followed traditional decomposition modes. In terms of improving the decomposition process in the PDA model, Liu et al. [29] proposed that changes in undesirable outputs, such as CO2 emissions, are usually explained by the multiplication of efficiency scores and relevant factors. Some scholars have extended PDA to a joint decomposition model, which combines PDA and LMDI methods to explore the contribution of drivers of carbon emissions [30,31,32,33]. However, most studies have not considered the impact of climate and environmental factors, and few studies have conducted specific analyses based on industry characteristics.
In summary, previous studies have investigated the improvement and application of PDA methods from different perspectives, and their characteristics are summarized as follows. Firstly, most studies have focused their improvements on only one aspect of the PDA method, lacking research on the simultaneous improvement of the DEA method and the decomposition process. Therefore, it is necessary to combine existing research to improve both the DEA method and the decomposition process simultaneously. Secondly, most studies have not taken into account the characteristics of industry carbon emissions. For example, in the thermal power generation sector, detailed factors related to the production process should be considered. This means that they have ignored industry-specific differences in the decomposition process.
Therefore, based on previous studies, we propose a PDA model that simultaneously improves the DEA model and the decomposition process to explore the driving factors of carbon emissions in China’s power industry. Compared with existing research, the main contributions of this study are as follows: (1) Based on existing research, the DEA method and decomposition process of the PDA model are simultaneously improved. The model can simultaneously analyze the technological factors that affect carbon emissions among different regions. It can also incorporate economic factors and climate factors into the decomposition factors, quantifying the impact of technology and other factors on carbon emissions. (2) Industry-specific characteristics are often key factors that affect carbon emissions in the industry. In studying China’s power industry, factors that are characteristic of the industry, such as coal-fired power generation and total power generation, should be included in the decomposition process. (3) This study uses panel data from 2005 to 2020 for 30 provinces, making the research results more reliable and practical. The results can better provide suggestions and strategies for carbon emission reduction policies in China’s power industry.
The remainder of this paper is organized as follows. Section 2 introduces the PDA model and data sources. Section 3 discusses the decomposition results. Section 4 compares the research results with similar findings from other studies and highlights future research directions as well as the limitations of this study. Section 5 presents conclusions and suggestions.

2. Materials and Methods

2.1. Methods

2.1.1. Environmental Production Technology

The current mainstream method of measuring carbon emissions in the power industry uses the emission factor method, which multiplies various fuels with their carbon emission factors and oxidation rates to obtain carbon emissions; thus, this study only focuses on the production process of power generation, which is the source of almost all carbon emissions in the power industry. Build an input-output production technology model for energy, labor, capital, thermal power generation, and carbon emissions [34]. The inputs to the production model are divided into energy input F, labor, and capital. Labor is measured using the number of people employed in thermal power generation in each province, L, and capital is measured using the installed capacity of the thermal power industry, G. The output is the desired output of thermal electricity E versus the non-desired output of carbon emissions CO2e relative to thermal power generation in each province. Its mathematical formula (Formula (1)) is as follows:
T = { ( F , L , G , E , CO 2 e ) : ( F , L , G ) c a n   p r o d u c e ( E , CO 2 e ) }
We consider the fact that the input and output of the actual production process cease, and the reduction in carbon emissions is not free. According to the research of Shephard [35] and Färe [36], the stability of the zero value and weak disposability need to be considered in the joint production process, and an environmental production technology model of the thermal power industry with constant returns to scale (CRS) is constructed. The mathematical form is expressed as follows:
T = { ( F , L , G , E , C ) : j λ j F j F j λ j L j L j λ j G j G j λ j E j E j λ j CO 2 e j = CO 2 e λ j 0 , j = 1 , , N
λ denotes the intensity variable. j (j = 1, 2, 3, …, N) represents various regions in China. The technical efficiency measurement method for environmental production technology models typically adopts basic DEA models and their variants and directional distance functions to solve technical efficiency. Drawing on the research of Shuang Zhang [33], DEA models are constructed to solve the technical efficiency of environmental production technology:
max β = β 0 s . t . { j λ j F j F 0 β 0 F 0 j λ j L j L 0 δ 0 L 0 j λ j G j G 0 ϕ 0 G 0 j λ j E j E 0 + γ 0 E 0 j λ j CO 2 e j = CO 2 e 0 θ 0 CO 2 e 0 λ j , β 0 , δ 0 , ϕ 0 , γ 0 , θ 0 0 , j = 1 , , N
max θ = θ 0 s . t . { j λ j F j F 0 β 0 F 0 j λ j L j L 0 δ 0 L 0 j λ j G j G 0 ϕ 0 G 0 j λ j E j E 0 + γ 0 E 0 j λ j CO 2 e j = CO 2 e 0 θ 0 CO 2 e 0 λ j , β 0 , δ 0 , ϕ 0 , γ 0 , θ 0 0 , j = 1 , , N
The 0 here denotes the calculated decision unit and represents the distance from the frontier plane using the input and output slack of β0·F0, δ0·L0, φ0·G0, γ0·E0, θ0·CO2e0, β0, δ0, φ0, γ0, and θ0. Models (3) and (4) take the objective functions of minimum thermal energy use efficiency and minimum carbon emission technologies. The higher the value of the β0 and θ0 parameters, the lower the level of energy use efficiency and carbon emission technology of the evaluated decision unit, indicating that it is far from the ideal frontier. If the slackness is zero, the decision unit being evaluated has the highest level of energy use efficiency or emission technology on the frontier side of the model’s calculation. According to Farrell’s [37] theory, the distance functions for thermal energy inputs and carbon emissions are shown in Equations (5) and (6) as follows:
E E i = 1 β i = 1 D E , i
C E i = 1 θ i = 1 D C , i
Here, EEi and CEi are the thermal energy consumption rate and thermal fuel carbon emission efficiency, respectively. Their practical significance describes the ratio of the ideal thermal power energy input and emissions to the actual energy input and emissions. DE,i and DC,i represent the distance functions of the two. As shown in Formulas (4)–(7) and (4)–(8), the relationship between the two efficiency values and the distance function is that the efficiency values are reciprocal to their respective distance functions, and the sum of the relaxation parameters corresponding to their respective inputs or outputs equals 1. By calculating the efficiency values, the distance function can be obtained for the subsequent decomposition calculation process.

2.1.2. LMDI Model

The LMDI model of carbon emissions is based on the Kaya Constant Equation [38], which is also one of the methods for measuring carbon emissions, and it is based on the following equation:
CO 2 e = CO 2 e E × E Y × Y P × P
In Equation (7), CO2e represents carbon emissions, E represents energy consumption, Y is the economic output, P represents population size, CO2e/E represents energy carbon intensity, E/Y represents energy consumption per unit of national economy produced, and Y/P represents GDP per capita. Carbon emissions from the power sector are also influenced by the amount of electricity generated and the climate environment, so the carbon emissions from China’s power sector can be further decomposed as shown below:
CO 2 e i = CO 2 e i E i × E i T i × T i G i × G i Y i × Y i P i × P i A i × A i R i × R i
CO2ei represents the carbon emissions of province i; Ei represents the consumption of energy used for thermal power generation in province i; Ti represents the amount of thermal power generated in province i; Gi represents the total amount of electricity generated in province i; Yi represents the economic gross product of province i and Y represents the national economic gross product; Pi represents the number of permanent residents in province i; Ai represents the area of province i; Ri represents the annual rainfall in province i. Considering the right-hand side of Equation (9) as the product of different factors, one can split the total carbon emissions of the power sector in different provinces into eight factors, namely the carbon emission efficiency of thermal fuels (CO2ei/Ei), thermal energy consumption efficiency (Ei/Ti), thermal power generation ratio (Ti/Gi), electricity generation per unit of GDP (Gi/Yi), gross domestic product per capita (Yi/Pi), population density (Pi/Ai), inverse of rainfall per unit area (Ai/Ri), and annual rainfall (Ri). Thus, the above equation can be expressed as follows:
CO 2 e i = C I i × T C E i × G S i × P I i × E A i × P O P i × A R i × R i
The LMDI decomposition is divided into two forms of decomposition, additive and multiplicative, where the multiplicative form is suitable for reflecting the degree of influence of the drivers, while the additive form can more obviously quantify the amount of influence of the drivers [38]. The model developed in this study is focused on exploring the degree of influence of each carbon emission driver, so the LMDI multiplier form was chosen to calculate the drivers of carbon emission change for base year 0 and target year t.
DCO 2 e = CO 2 e t CO 2 e 0 = D C I × D T C E × D G S × D P I × D E A × D P O P × D A R × D R
The factors in the above equation are calculated as follows:
D X = exp { w i ln ( X i t / X i 0 ) }
where X is, in order, the carbon emission efficiency of thermal fuels (CI), thermal energy consumption efficiency (TCE), thermal power generation ratio (GS), power generation per unit of economic output (PI), gross output per capita (EA), population density (POP) inverse of rainfall per unit area (AR), and annual rainfall (R), and wi in the equation denotes the weight of carbon emissions in each province, which is given by the following formula:
w i = L ( CO 2 e i t , CO 2 e i 0 ) / L ( CO 2 e t , CO 2 e 0 )
where CO2ei denotes national carbon emissions, for which their value should be equal to the sum of the carbon emissions of each province, and the L function is a logarithmic function for which its functional expression is of the form described by Equation (13):
L ( a , b ) = { a b ln a ln b , a b a , a = b

2.1.3. Production Theory Decomposition Method Based on LMDI

The distance function is introduced on the basis of the LMDI decomposition model to further decompose CI and TCE. As the distance function exists, two different frontiers for the study’s start and end can be evaluated for the efficiency of the model. According to Wang [39], the geometric mean can be used as the technical benchmark for reference. This leads to the following formulas:
C I i 0 = CO 2 e i 0 / ( D C , i 0 ( 0 ) × D C , i t ( 0 ) ) 1 / 2 E i × ( D C , i 0 ( 0 ) × D C , i t ( 0 ) ) 1 / 2 = P E F i 0 × ( D C , i 0 ( 0 ) × D C , i 0 ( 0 ) ) 1 / 2
T C E i 0 = E i 0 / ( D C , i 0 ( 0 ) × D C , i t ( 0 ) ) 1 / 2 T i × ( D C , i 0 ( 0 ) × D C , i t ( 0 ) ) 1 / 2 = P E I i 0 × ( D C , i 0 ( 0 ) × D C , i t ( 0 ) ) 1 / 2
C I i t = CO 2 e i t / ( D C , i 0 ( t ) × D C , i t ( t ) ) 1 / 2 E i × ( D C , i 0 ( t ) × D C , i t ( t ) ) 1 / 2 = P E F i t × ( D C , i 0 ( t ) × D C , i 0 ( t ) ) 1 / 2
T C E i t = E i t / ( D C , i 0 ( t ) × D C , i t ( t ) ) 1 / 2 T i × ( D C , i 0 ( t ) × D C , i t ( t ) ) 1 / 2 = P E I i t × ( D C , i 0 ( t ) × D C , i t ( t ) ) 1 / 2
PEF is the potential thermal fuel efficiency and represents the level of thermal fuel efficiency that would be expected if the decision-making unit in the thermal power sector obtains the optimal exclusion efficiency by eliminating the inefficient portion of carbon emissions. PCI is the potential thermal energy consumption efficiency and represents the desired level of thermal energy intensity when the decision-making unit in the thermal power sector is optimized by eliminating the inefficient portion of energy. The times outside the distance function brackets are the years that make up the frontier surface of the model, and the times inside the brackets indicate the years of the decision units to be evaluated.
CO 2 e i t CO 2 e i 0 = P E F i t × P E I i t P E F i 0 × P E I i 0 × ( D C , i 0 ( t ) × D C , i t ( t ) ) 1 / 2 ( D C , i 0 ( 0 ) × D C , i t ( 0 ) ) 1 / 2 × ( D E , i 0 ( t ) × D E , i t ( t ) ) 1 / 2 ( D E , i 0 ( 0 ) × D E , i t ( 0 ) ) 1 / 2 × G S i t × P I i t × E A i t × P O P i t × A R i t × R i t G S i 0 × P I i 0 × E A i 0 × P O P i 0 × A R i 0 × R i 0
The resulting change in carbon emissions from the power sector is split into nine impact factors, which are expressed in the form shown in Equation (19):
CO 2 e t CO 2 e 0 = D P E F × D P C I × D c p × D e p × D g s × D p i × D p o p × D a r × D r
The impact factor of the multiplicative effect in Equation (19), when the value of the impact factor is greater than 1, indicates that the change in this factor between the beginning of the study period and the end of the study period has contributed to the increase in carbon emissions in the power sector. When the value is less than 1, changes in this factor have a dampening effect on carbon emissions from the power sector. When the value is exactly 1, it indicates that emissions are not affected by changes in this factor. According to the theory of Färe [26], it is possible to split Dcp and Dep in detail into the effects of efficiency and technological change in the form shown in Equations (20) and (21):
D c p = D c e × D c t e c h = exp [ w j ln C E i 0 C E i t ] × exp [ w i ln ( D C , i 0 ( 0 ) × D C , i 0 ( t ) ) 1 / 2 ( D C , i t ( 0 ) × D C , i t ( t ) ) 1 / 2 ]
D e p = D e e × D e t e c h = exp [ w i ln E E i 0 E E i t ] × exp [ w i ln ( D E , i 0 ( 0 ) × D E , i 0 ( t ) ) 1 / 2 ( D E , i t ( 0 ) × D E , i t ( t ) ) 1 / 2 ]
Dce is the contribution of changes in the carbon efficiency of thermal fuels to changes in carbon emissions. If the decision unit in the thermal power sector has a better energy consumption efficiency at the end of the study period than at the beginning, its calculation is less than one, indicating that the optimization of thermal power carbon efficiency has a dampening effect on the rise in carbon emissions. Dctech denotes the effect of changes in thermal power abatement technology on changes in carbon release. Dee denotes the effect of changes in energy efficiency relative to thermal power. If the energy efficiency of the decision unit in the thermal power sector is higher at the end of the study period than at the beginning, the corresponding value is less than one, indicating that an increase in energy efficiency in the thermal power sector can lead to a reduction in carbon emissions. Detech reflects the impact of changes in thermal power energy efficiency technologies on changes in emissions.
Energy and emission efficiency in the thermal power sector and changes in energy efficiency and abatement technologies are quantified using the decomposition process described above. Therefore, the following equation can be used to rewrite the proportion of carbon emitted by the power sector from the beginning to the end of the study period:
CO 2 e i t CO 2 e i 0 = D P E F × D P E I × D c e × D c t e c h × D e e × D e t e c h × D G S × D P I × D E A × D P O P × D A R × D R

2.2. Data Description

At the 2009 Copenhagen World Climate Conference and the 2014 US-China Joint Statement on Climate Change, China pledged to achieve a significant reduction in carbon emissions intensity by 2030 compared to 2005 levels [15]. It can be observed that 2005 was a very important year for China to achieve the double carbon target, so 2005 was chosen as the starting year for this study. In addition, due to the limitations of rainfall data collection in each province, data were collected up until 2020, so the 2005–2020 period was chosen as the study period. The study’s area comprised 30 provinces in the statistical area of the China Energy Statistics Yearbook, i.e., all other provinces and municipalities excluding the administrative autonomous regions of Taiwan, Hong Kong, Macao, and Tibet.
According to the research methodology proposed in this study, three types of data are required to study the drivers of carbon emissions in the power sector: power sector-related data, provincial macrodata, and power sector carbon emissions data.
(1)
Data related to the power industry: The electricity industry data required for the DEA method’s input–output include coal-fired power generation energy consumption, coal-fired power generation output, total power generation output, coal-fired power generation industry installed capacity, and coal-fired power generation industry employment. Thermal power generation, total power generation, and thermal energy consumption data are all derived from the Energy Statistics Yearbook, where thermal energy consumption data are summed by converting various fuels used in thermal power generation into standard coal volumes. The number of people employed in thermal power generation is mainly derived from provincial statistical yearbooks and the installed capacity of the thermal power industry, which is taken from the Electricity Statistical Yearbook. The descriptive statistics of input and output variables are shown in Table 1 below.
(2)
Macrodata by province: The macrodata for each province include the gross regional product, the area of each province and municipality, the number of people in each province, and the annual rainfall of each province and municipality. Gross regional product is from the China Statistical Yearbook, and the area of each region is from the official website of the Central People’s Government of the People’s Republic of China. Population figures for each province were taken from provincial and municipal statistical yearbooks. Annual rainfall data are generated by processing the China daily ground climate dataset, where the annual provincial rainfall is the sum of the annual rainfall of each urban area in the province.
(3)
Data on carbon emissions from the power sector: The carbon emissions from the power sector calculated in this study are mainly derived from direct carbon emissions from the combustion of fuels for thermal power generation without considering indirect carbon emissions from other inputs. The calculation method is “activity data × emission factor × oxidation rate × global warming potential parameter”. Activity data comprise the fuel consumption used for thermal power generation from the Energy Statistics Yearbook, and the emission factor and oxidation rate are shown in Table A1. The potential global warming parameters for carbon dioxide, methane, and nitric oxides are 1, 21, and 310, respectively [33].

3. Results

3.1. National Power Sector Carbon Emission Ratio Decomposition Results

Figure 1 shows the results of the multiplicative decomposition of the carbon emission ratio for the power sector from 2005 to 2020. Red is the driving factor for promoting carbon emissions in the power industry, and blue is the driving factor for suppressing carbon emissions in the power industry. The national carbon emissions ratio of 2.09 indicates that China’s power sector carbon emissions have increased by a factor of 1.09 over the study period. Its emission ratio is the result of a combination of 12 factors, of which potential thermal fuel efficiency (PEF), potential thermal energy consumption efficiency (PEI), thermal power’s emission efficiency (CE), GDP per capita (EA), population density (POP), rainfall per unit area (1/AR), and annual rainfall variability (R) increase carbon emissions in the power sector, with the GDP per capita being the number one driver of growth in the power sector, acting much more effectively than the other drivers. This suggests that economic development is the main factor contributing to the growth of carbon emissions in China’s power sector, while potential drivers such as thermal energy efficiency and thermal emission efficiency have a relatively small contributing effect. Thermal power emission technology (CTECH), thermal power energy efficiency (EE), thermal power energy conservation technology (ETECH), power supply mix (GS), and power generation per unit of GDP (PI) have had a dampening effect on carbon emissions in China’s power sector. One of the main emission reduction drivers is the thermal power sector emissions technology. In the long run, the improvement of thermal power emission technology has a clear effect on carbon emission reduction in the power industry.

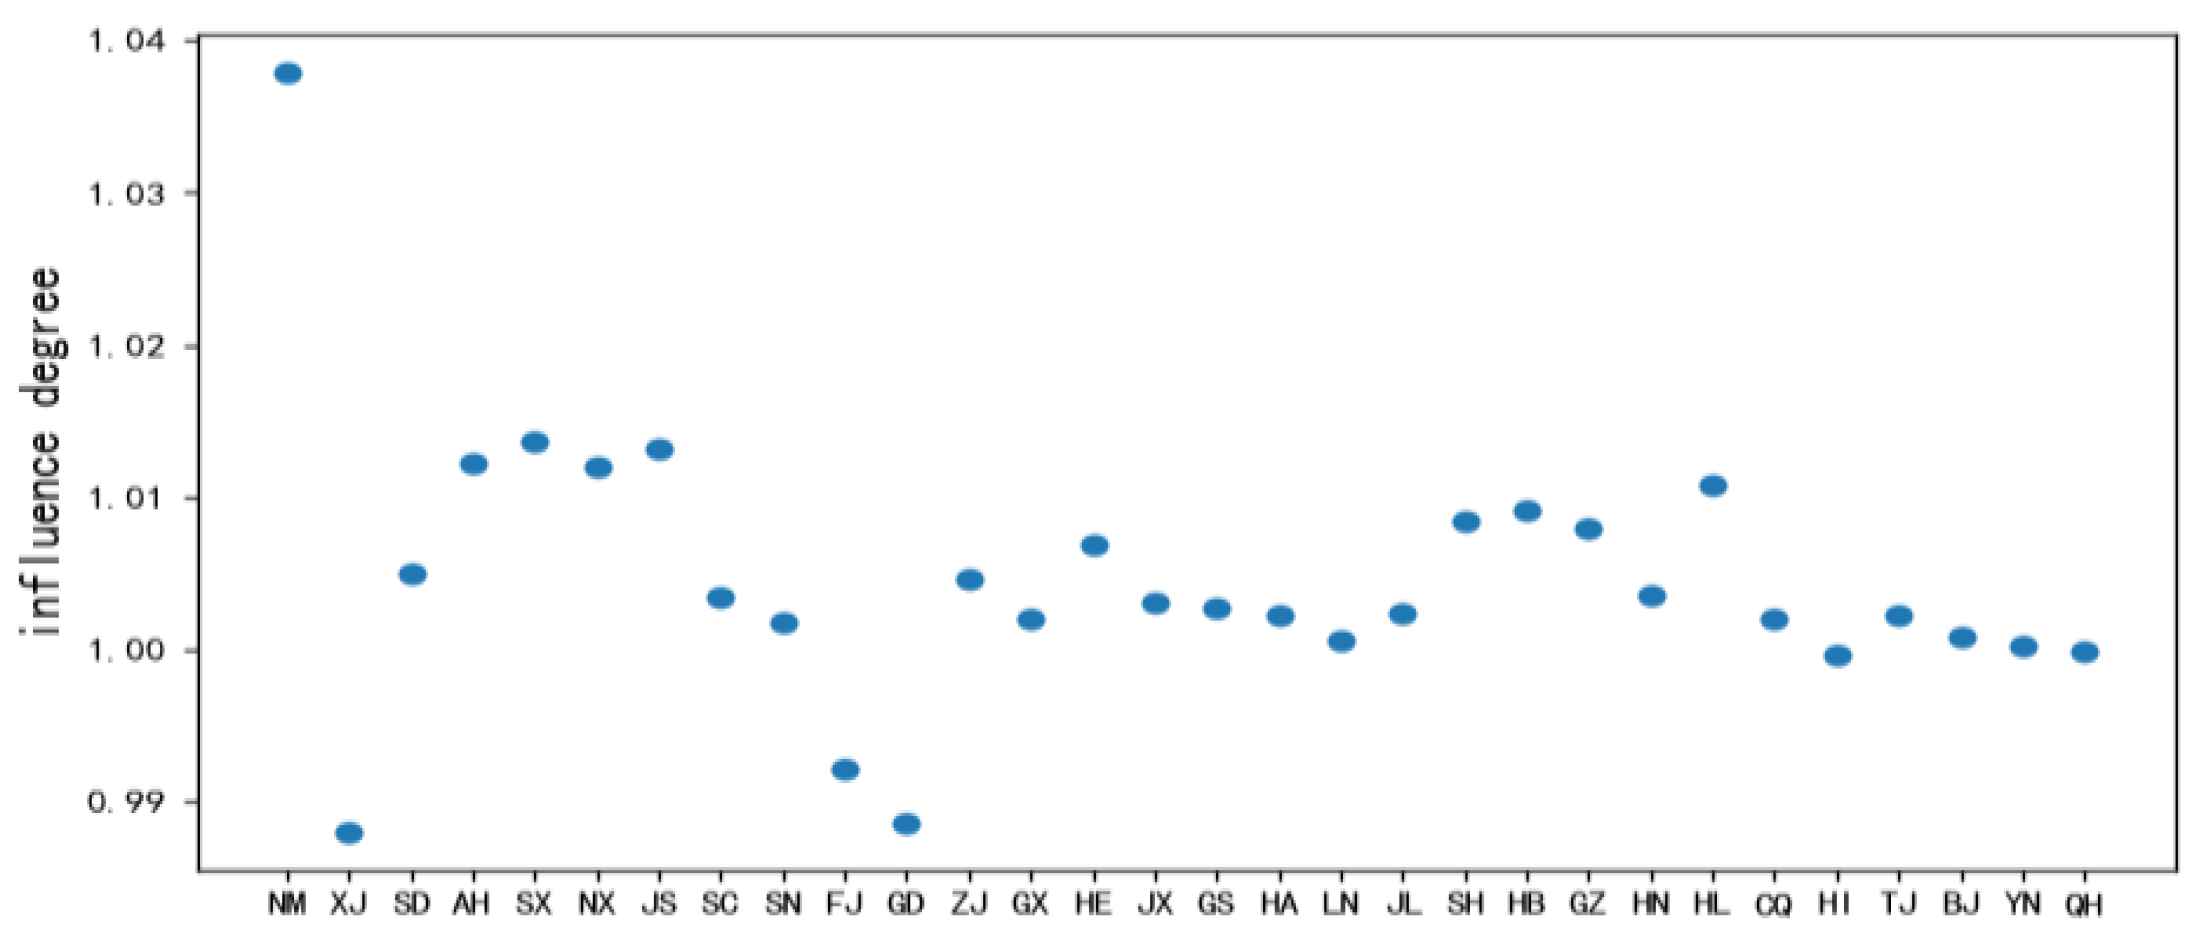
3.2. Results of the Decomposition of Carbon Emission Ratios in Different Provinces

Figure 2 shows that carbon emissions from the power sector are still increasing in most of the country’s provinces. The definitions of the abbreviations for provinces in the figure are detailed in Appendix A Table A2. It can be clearly seen that Inner Mongolia has the largest carbon emission ratio, and this is mainly because Inner Mongolia, as a current major power generation province, undertakes the role of supplying electricity to other provinces; moreover, the significant increase in power generation has driven the growth of carbon emissions in the power sector. The provinces with the next highest carbon emission ratios are Xinjiang and Shandong. Xinjiang and Inner Mongolia are also large power transmission provinces, and Xinjiang’s economic development level is lower than other provinces; for example, thermal power plant equipment is slower to update. Shandong is second only to Guangdong; the province’s own electricity consumption mostly relies on its own thermal power generation, but compared to Guangdong Province, Shandong Province’s economic level is lower, and the unit of GDP power generation is lower. Beijing and Shanghai have made the best progress in reducing carbon emissions in the power sector among all provinces and cities. The reduction in carbon emissions in the power sector in Beijing and Shanghai was achieved on the one hand by relying mainly on imports from other provinces, which reduced the pressure on power generation. On the other hand, the carbon emissions reduction was achieved by implementing policies, such as the establishment of subsidies for energy conservation and emission reduction in Beijing and the release of the 14th Five-Year Plan for energy conservation and emission reduction in Shanghai with the intention of improving energy efficiency and pollutant control.
Figure 3 presents the results of the decomposition of the 12 factors for each province for the 2005–2020 period. It is easy to see that the GDP per capita is the main influence that contributes to the growth of carbon emissions in the vast majority of provinces. This result is particularly true for regions such as Inner Mongolia and Shandong, as the increase in power generation is closely related to the level of economic development, a result that is also consistent with the results shown in Figure 2.
Thermal power emission reduction factors, thermal power energy efficiency technologies, and the drivers of electricity generation per unit of GDP act as disincentives for carbon emissions in almost all provinces. The abatement curbs are most pronounced for thermal power reduction technologies and the per unit of GDP generated, but the magnitude of the impact on individual provinces depends largely on the level of technology in different provinces. Population density drivers are the most representative of the effect on regional emissions due to changes in population movements by province. Figure 3 shows that adjusting the power supply mix is also crucial to reducing emissions from the power industry in each province as changes in the power supply mix also have a dampening effect on the growth of carbon emissions from the power industry in most national provinces.

3.3. Efficiency and Technology Impact Factors

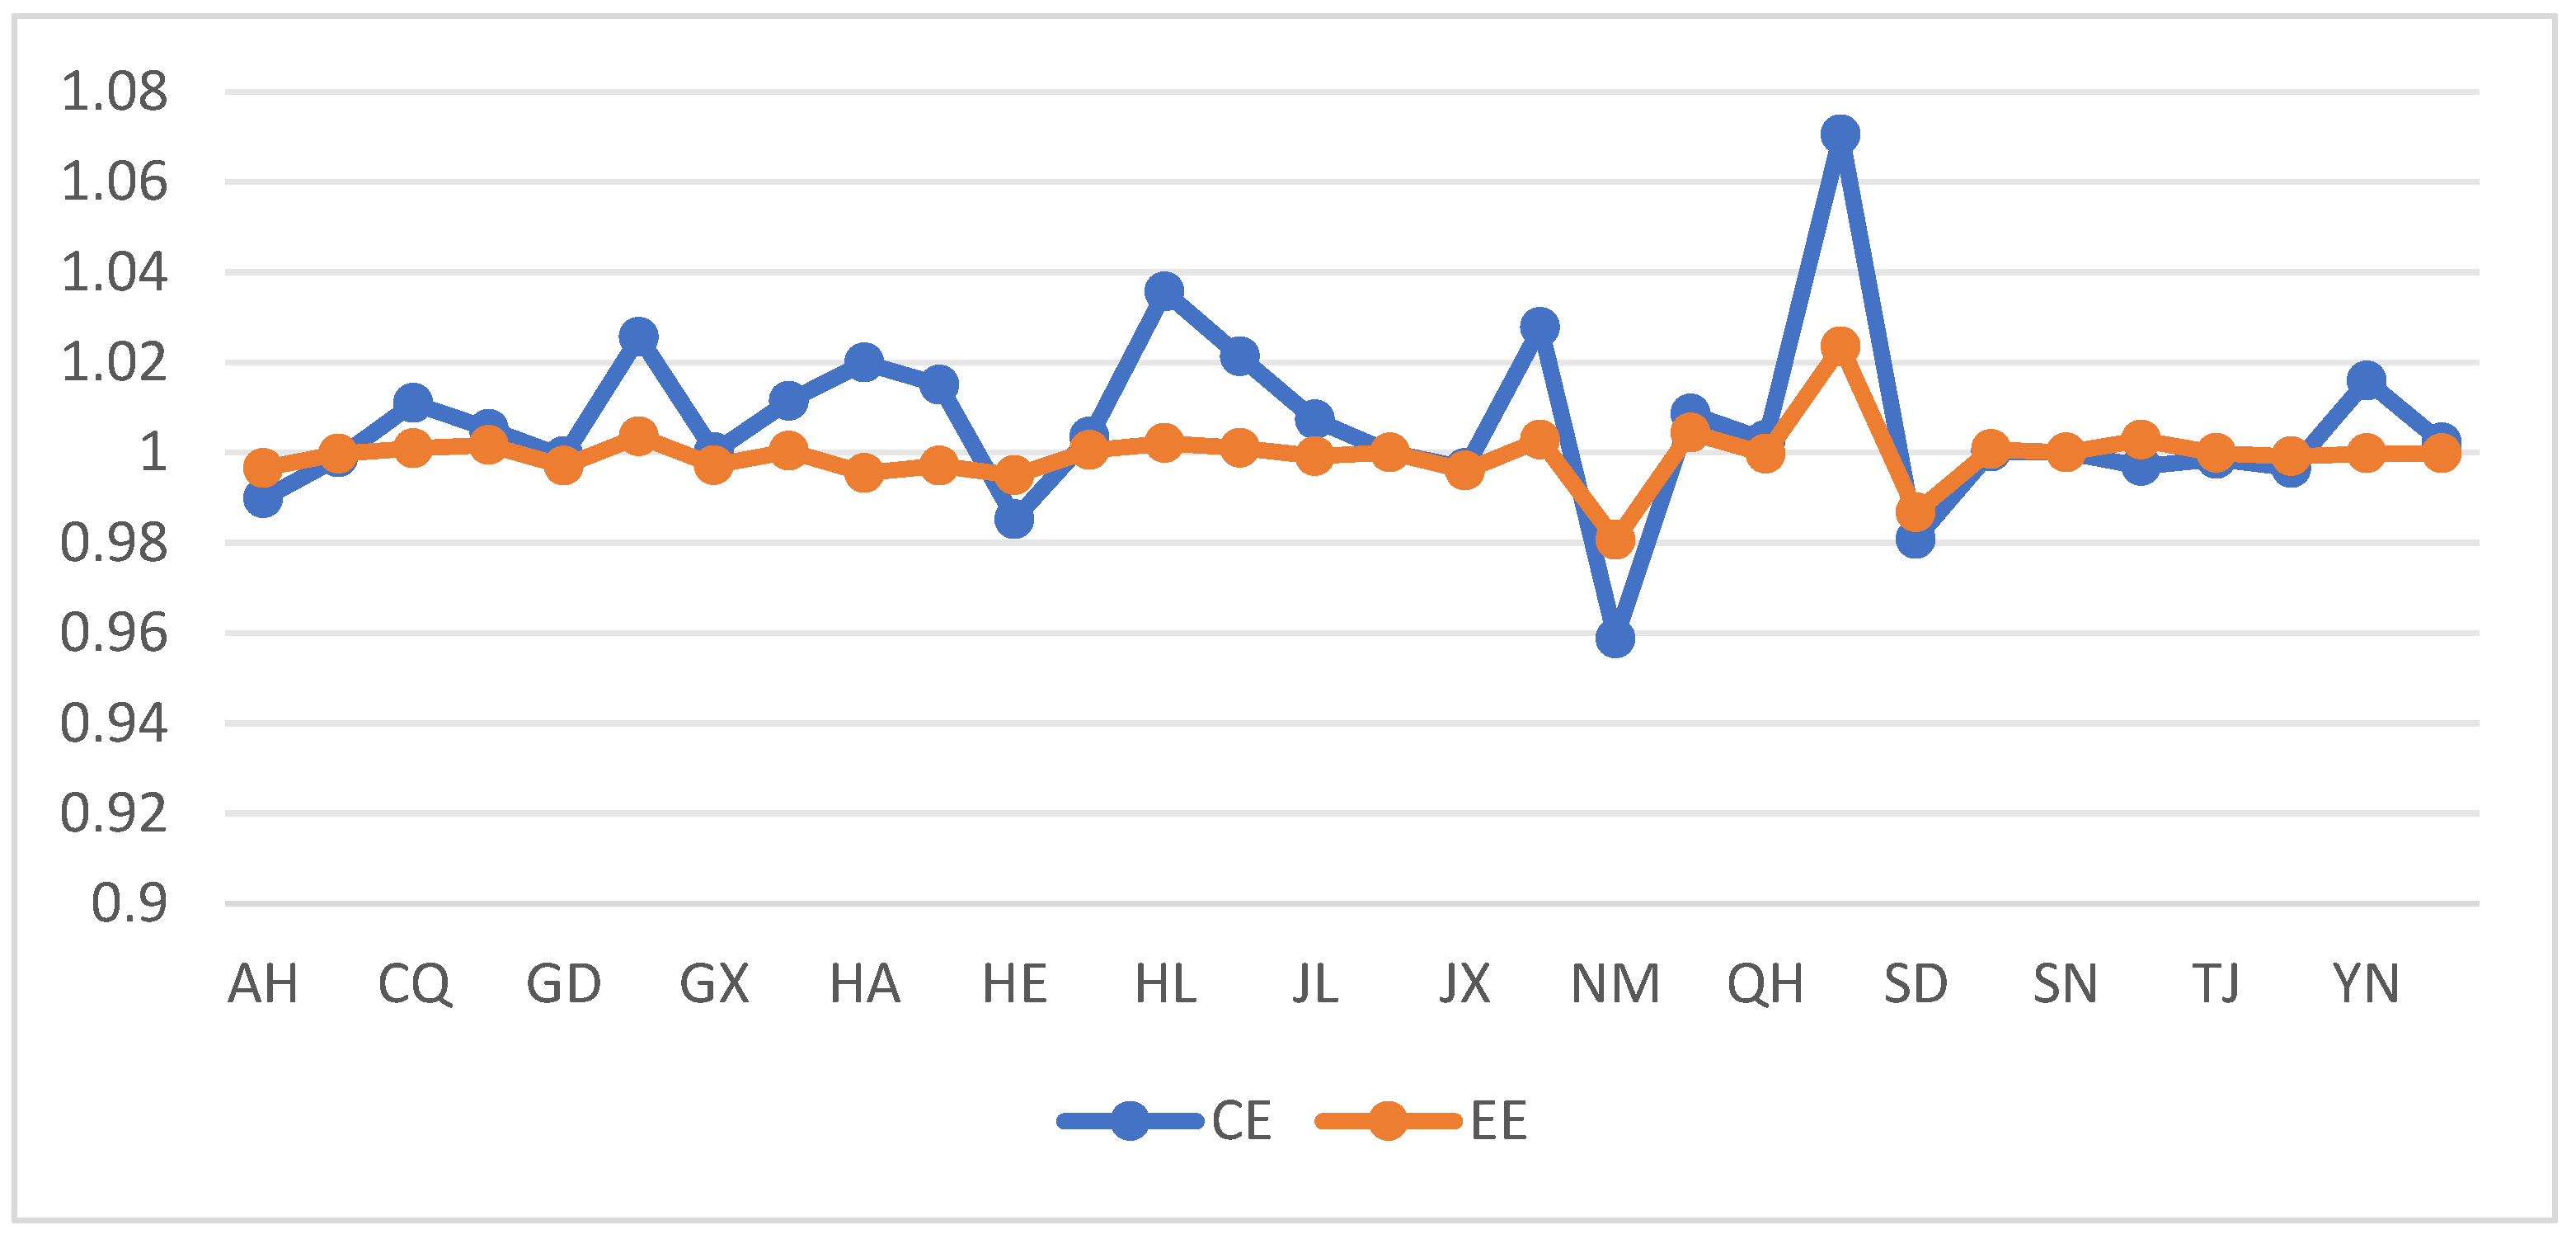
3.3.1. Thermal Power Energy and Emission Efficiency Factors

Thermal energy efficiency and thermal emission efficiency are efficiency-related factors that decompose the distance function of the production relationship’s calculation. Due to the regional heterogeneity of the provinces, the impact of thermal energy efficiency and thermal emissions efficiency varies from province to province. As shown in Figure 4, factors influencing the efficiency of thermal power emissions contributed to carbon emissions in some provinces during the study period. By looking at the two graphs, it can be seen that despite the different levels of influence, the two factors play a role in promoting carbon emissions in the thermal power sector in Sichuan, Ningxia, Gansu, and Liaoning. As a major hydroelectric power province, Sichuan Province has not paid much attention to the operation of thermal power companies in the context of “prioritising hydropower”, and most thermal power companies in Sichuan are small and lack powerful units; moreover, they are vulnerable to fluctuations in coal prices. Ningxia and Gansu provinces have a lower level of economic development and are less well equipped than other provinces with respect to upgrading equipment and installing energy-saving and emission reduction devices for thermal power units. Both Liaoning and Heilongjiang provinces were once old industrial bases and now face a surplus of thermal power units due to their declining economies. Although the three northeastern provinces have made great efforts to develop new energy generation, their abandonment of wind and light is a more serious problem, resulting in their low thermal power efficiency. In contrast, Shandong and Inner Mongolia, as China’s major power generation provinces with large thermal power units and frequently updated equipment, have achieved substantial improvements in their thermal power energy efficiency and emission efficiency, which has played a significant role in curbing carbon emissions from the thermal power industry.

3.3.2. Technical Factors for Energy Saving and Emission Reduction in Thermal Power

Thermal energy efficiency and thermal emission efficiency are technically relevant factors for decomposing the distance function of the production relationship’s calculation. As shown in Figure 5, both of these factors significantly inhibit the growth of carbon emissions in China’s provinces. the significant inhibiting effect on emission reduction is mainly observed in some major power generation provinces, and this is due to the relatively long research period and the greater improvement in carbon emission reduction technology in China’s thermal power industry, with corresponding energy-saving and emission reduction technologies, such as ultra-supercritical thermal power units, clean coal technology, and carbon capture and storage technology, being effectively utilized. Overall, energy-saving and emission reduction technologies have the greatest impact on emission reduction in major power generation provinces but not in Shanghai and Beijing, which are more advanced in science and technology. This is because of the small amount of thermal power generation in Beijing and Shanghai on the one hand and their high technological starting point on the other hand. Despite the long research period, the overall technological advancement for the thermal power industry in Beijing and Shanghai has not been significant.

3.4. Other Influencing Factors

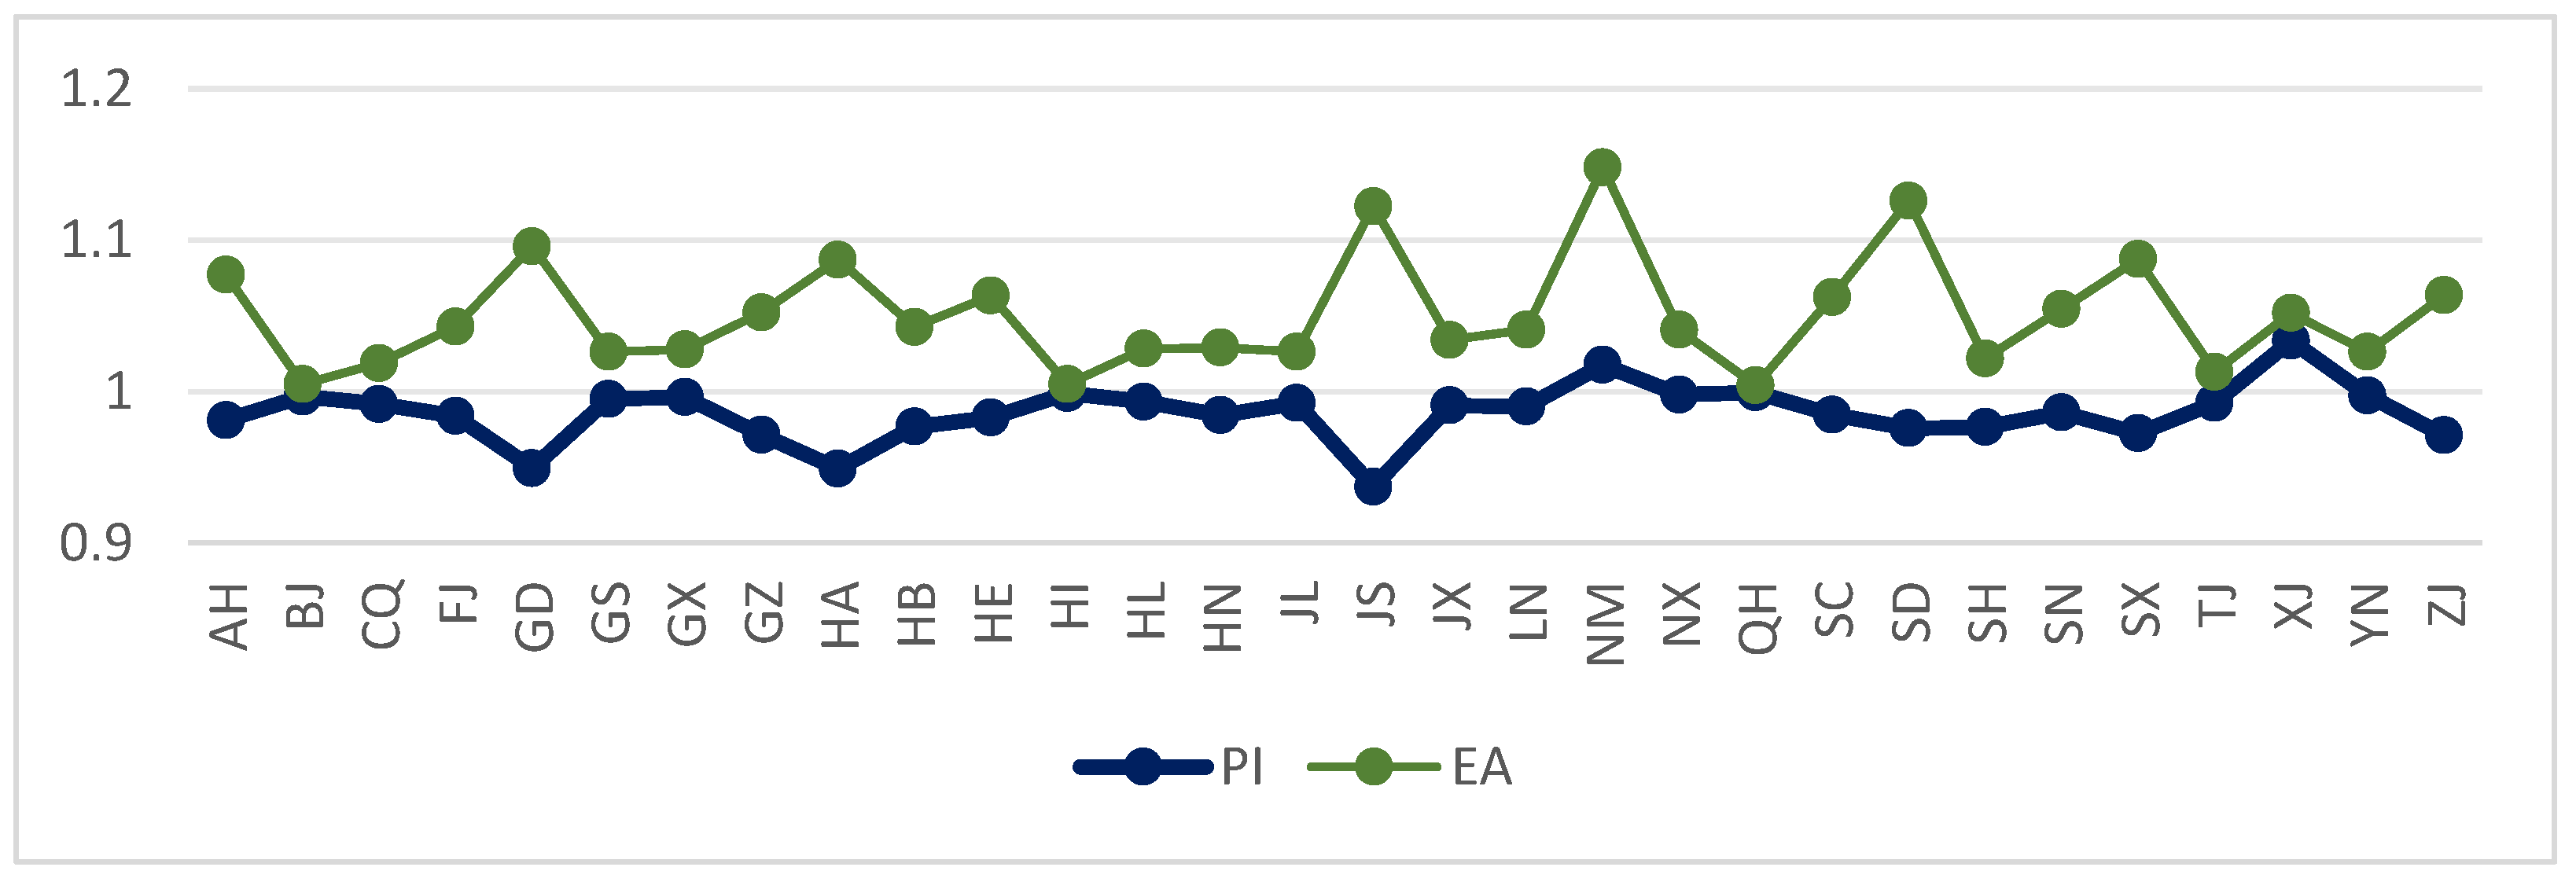
3.4.1. Potential Drivers in the Thermal Power Sector

The production theory decomposition analysis method is able to separate not only the efficiency and technical driver decomposition but also the potential drivers in thermal power generation, namely the potential thermal energy driver and the potential thermal fuel emission driver. Both of these factors are obtained by removing non-efficiency factors that allow the thermal sector to reach an optimal level of production technology and are a potential driver of the thermal sector. The results of the national decomposition show that potential thermal fuel emission drivers have the effect of promoting carbon emissions in China’s power sector. Due to the high cost of oil and gas power generation, replacing coal products for thermal power generation is difficult, and despite China’s active promotion of energy transition policies, coal-fired power generation, which has a high carbon emission factor, still dominates thermal power generation with the rapid increase in electricity demands during the study period. Although there are drivers for carbon emissions in the power sector, the effect is very small. Although China attaches great importance to the relevant energy efficiency laws and regulations and has implemented measures to shut down small thermal power units, the implementation of shutting down small thermal power units in some provinces has been slow due to the economic level, and there has not yet been a major breakthrough in energy efficiency technology for high-power thermal power units.
Unlike the national perspective, as shown in Figure 6, the potential thermal energy driver has a significant contributing effect on carbon emissions from the power sector in Inner Mongolia, while the potential thermal fuel emission driver has a dampening effect on carbon emissions from the power sector in Sichuan Province. Inner Mongolia, as the province with the largest power generation capacity in the country, has seen rapid growth in power generation, increasing its energy consumption levels, while Sichuan, as a major hydroelectric power generation province, has achieved the effective restructuring of its power generation during the study period and has actively promoted a policy of closing small thermal power units, effectively achieving a reduction in thermal power fuel emissions.

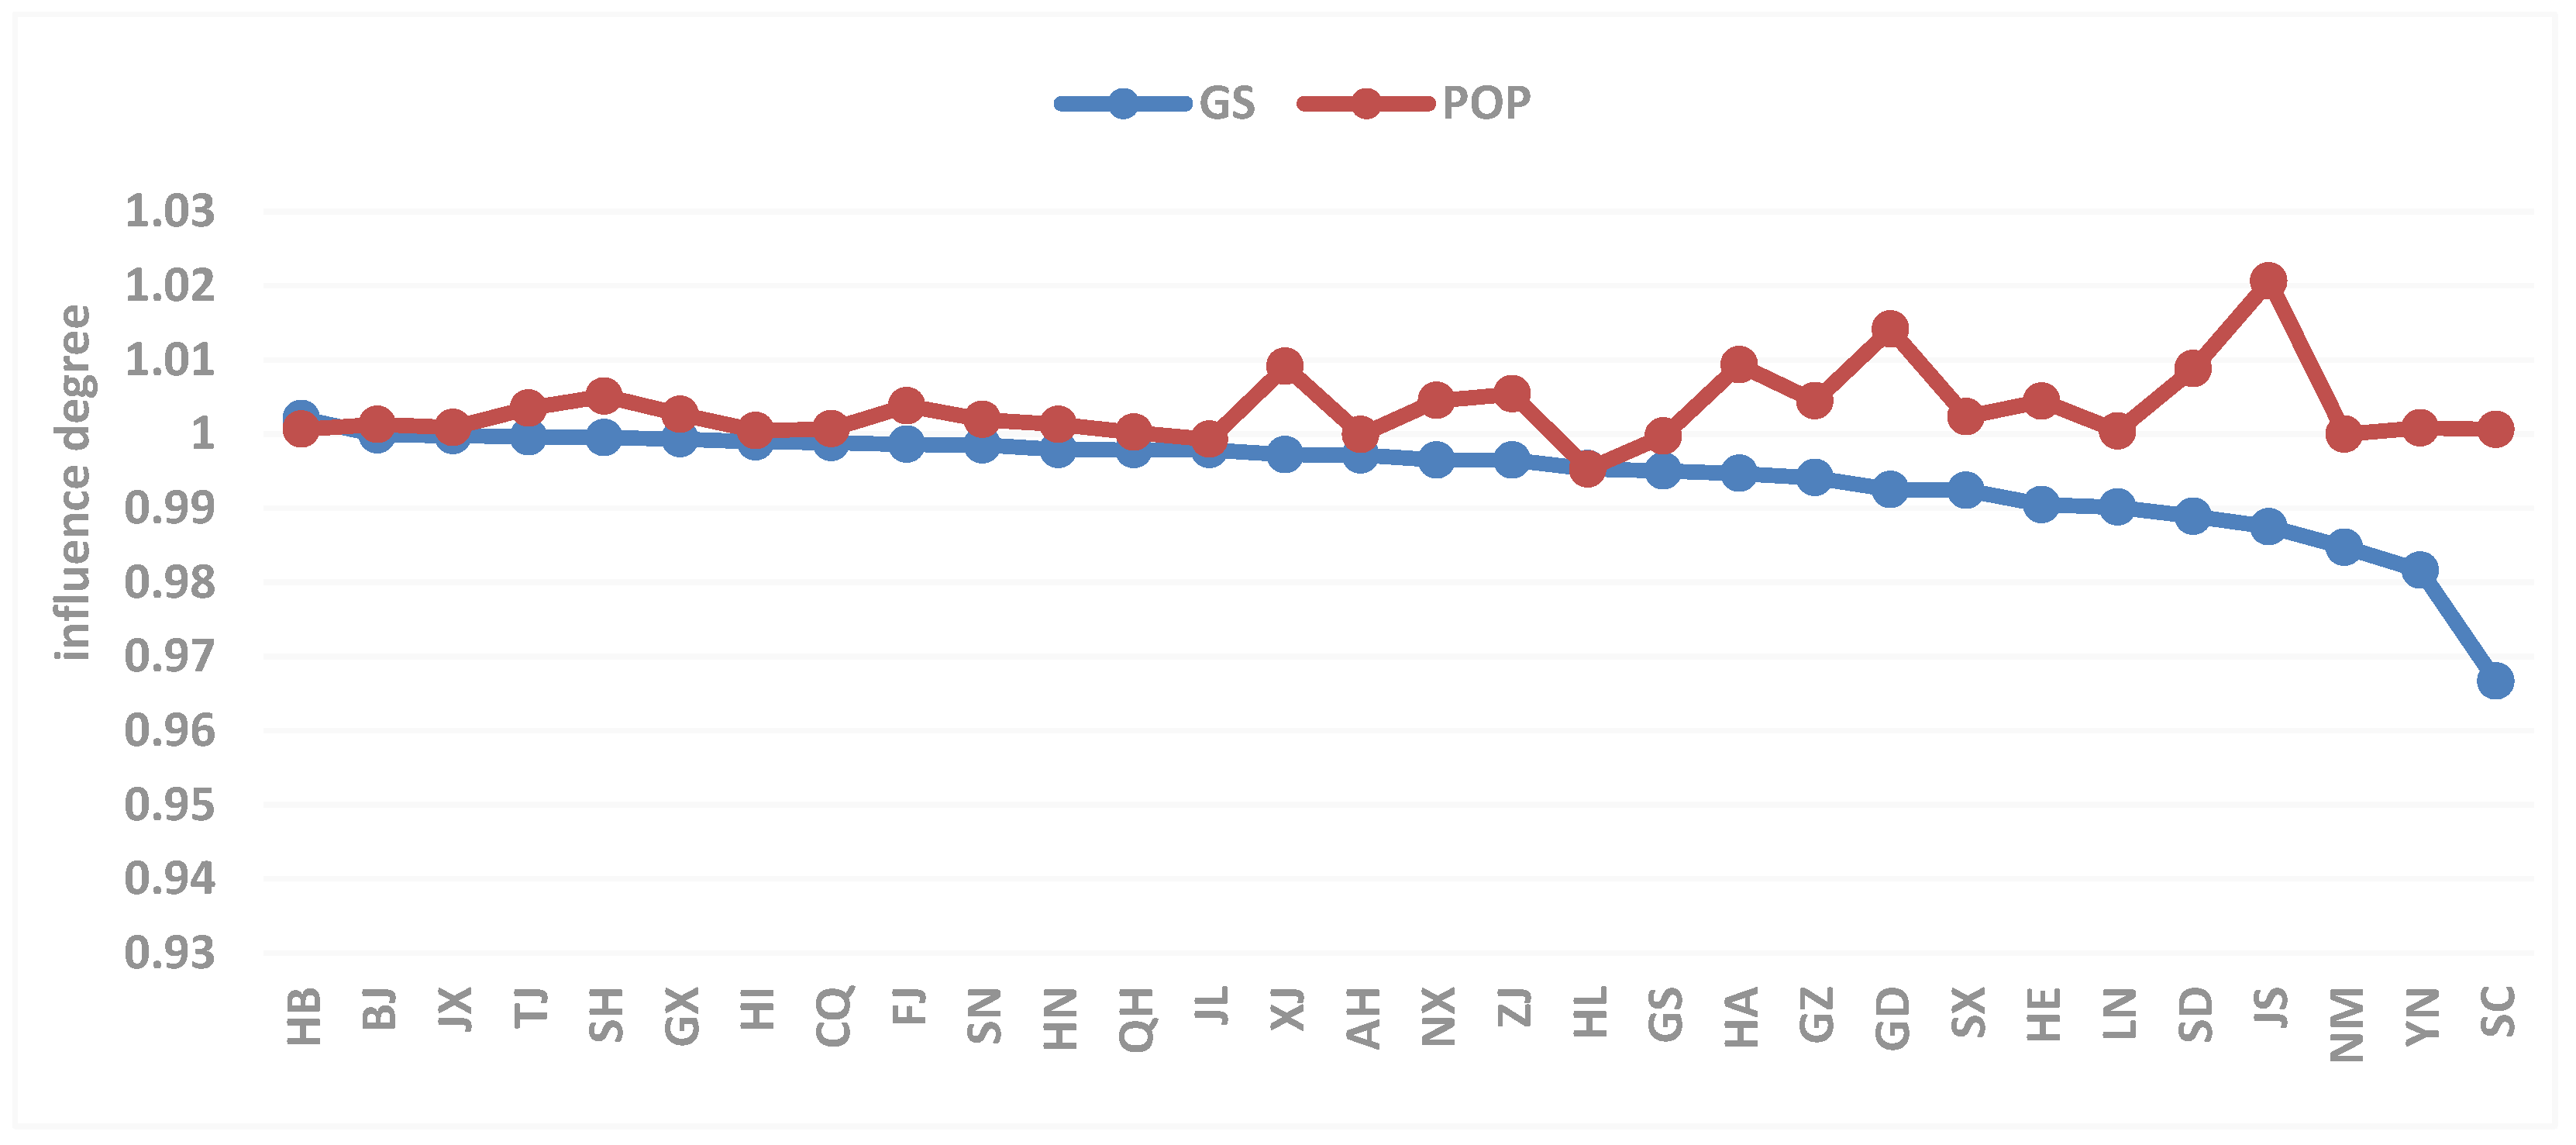
3.4.2. Power Generation Mix and Population Density Drivers

Generation mix and population density drivers are also included in the production theory decomposition analysis model. The generation mix is the share of different forms of power generation in the total generation capacity of each province, and its drivers reflect the development of renewable energy. In China, as a whole, China has been advocating renewable energy generation and has been reducing the share of thermal power generation in the generation mix, which has had an effective curbing effect on carbon emissions in China’s power sector. Population density drivers reflect the impact of population growth on the country as a whole, while for provinces and municipalities, they also reflect the effect of population movement.
From a provincial perspective, as shown in Figure 7, the generation mix acts as a disincentive relative to the growth of carbon emissions from the power sector in most provinces and municipalities. The provinces that have played a greater role in curbing this are Sichuan, Yunnan, and Inner Mongolia. Sichuan and Yunnan, which have abundant water resources and fully exploit hydroelectricity for power supply, have continued to advance the share of hydroelectricity in the provinces’ total electricity generation during the study period, and they have relied heavily on hydroelectricity for improvements in their generation mix. Inner Mongolia is rich in wind and solar energy resources, and the improvement in power generation structures during the study period benefited from wind and solar power. Population density drivers contribute to carbon emissions in the power sector in most provinces, but they have a slight reduction effect in economically underdeveloped regions, such as Heilongjiang, as a result of population movement from underdeveloped to developed regions.

3.4.3. Analysis of Economic Drivers

The economic drivers in the production theory decomposition analysis include two drivers, GDP per capita and electricity generation per unit of GDP, and economic factors have been the main influencing factors on carbon emissions. Figure 8 shows that changes in economic development have had a catalytic effect on the increase in carbon emissions in the power sectors of all provinces, while electricity generation per unit of GDP has had a dampening effect on carbon emissions in the vast majority of provinces. This is because economic development leads to an increase in electricity consumption and therefore in social carbon emissions, and changes in electricity generation per unit of GDP are associated with carbon reduction effects, such as power generation technology and the efficiency of electricity consumption. It is clear that rapid economic growth has had a significant impact on carbon emissions in the major thermal power generation provinces of Inner Mongolia, Shandong, Shanxi, and Jiangsu. The effect on Qinghai, where GDP is improving at a slower rate, and on Beijing and Hainan, where the economy is smaller, is less significant. This is due to the fact that Inner Mongolia, Shandong, Shanxi, and Jiangsu provinces, as major power-generating provinces, are responsible for the generation of electricity for other provinces. The rapid economic growth has brought about a large demand for electricity, which has led to an increase in the generation of electricity in these power-generating provinces, thus generating more carbon emissions. Although Jiangsu is a major power generation province, it is also a major power consumption province, and similarly to Henan and Guangdong, its carbon emissions are transferred to other major power generation provinces, which significantly suppresses its carbon emissions per unit of GDP generated.

3.4.4. Analysis of Climate Drivers

In addition to the factors analyzed above, this study introduces the climate indicator of rainfall on the basis of other studies in order to quantify the effect of the climate environment on carbon emissions in the power sector, the effect of which is quantified using the annual rainfall driver and the unit area rainfall driver, where the calculation obtained in the model constructed by LMDI is the inverse of the unit area rainfall. Therefore, AR is taken as the inverse to obtain the degree of influence, and the degree of influence is equal to the degree of influence of the annual rainfall driver. As can be seen in Figure 9, changes in rainfall generally contribute to carbon emissions in the power sector. The provinces that play a strong role in promoting this are Ningxia, Shanghai, Heilongjiang, Hubei, and Inner Mongolia. The change in rainfall can reflect the degree of meteorological changes from the side. Inner Mongolia, Ningxia, Heilongjiang, and Hubei are all major power output provinces in China, and the increase in rainfall will, on the one hand, increase the demand for heating and drainage, intensifying the demand for electricity in the local provinces, and on the other hand, bring inconvenience to the thermal power generation in these power-generating provinces, making it necessary for these provinces to increase their thermal power generation capacity. Guangdong, Hainan, and Fujian are the three coastal provinces that are more sensitive to weather changes and are better able to cope with them. The reduction in rainfall in these three provinces could slow the increasing trend of carbon emissions from the power sector.

4. Discussion

Currently, research on the driving factors of carbon emissions in China’s power industry varies depending on the methods used, leading to different results. Wang et al. [28] study found that power output is the main reason for emission growth, and changes in potential emission intensity, emission efficiency performance, and technological gaps can help reduce emissions. Li et al. [40] research indicates that economic activity, population, and emission coefficients have a positive effect on CO2 increases. Xie et al. [41] study proves that the increase in installed capacity is considered to be the biggest contributor nationwide, while the decline in capacity utilization is the most important driving force, which to some extent offsets the increase in installed capacity. Despite different decomposition factors, a common conclusion can be drawn: Economic factors are the main contributor to CO2 increases, and technological changes can help reduce carbon emissions. This is consistent with the results obtained in our research study.
The findings of this study differ from other studies in the following ways. Firstly, by placing driving factors such as technology and economics within the same analytical framework, the study has quantified the difference in the impact of technology and economic factors. At the national level, the inhibiting effects of coal-fired power generation technology and energy conservation technology are 0.41 and 0.88. However, the product of the impact of economic factors and technology factors is 1.57, which is still greater than 1. Technology factors still cannot offset the increase in carbon emissions brought about by economic factors. Secondly, by introducing precipitation as a climate factor in the driving factors, this study analyzes the impact of climate change on carbon emissions. In order to comprehensively analyze the driving factors of carbon emissions in China’s power industry, this study has made the following improvements.
Firstly, compared with the existing literature on PDA models, this study combines the existing improvement methods of PDA models to simultaneously improve DEA efficiency measurement and decomposition, resulting in more scientific and rigorous results. Secondly, this study also includes environmental climate factors in the decomposition process, conducting a more comprehensive study of the decomposition results. This method combines DEA efficiency optimization with decomposition method optimization, representing an innovative attempt to integrate research methods. Finally, this study investigates panel data from 2005 to 2020 for 30 provinces. The research results are more reliable and meaningful, providing better suggestions for improving carbon emission reduction in China’s power industry.
In addition, according to the research results, carbon emissions in the power industry of the 30 provinces in China have shown some fluctuations from 2005 to 2020, with a large degree of inter-provincial variation and great potential for improvement. Therefore, future research could analyze the impact of renewable energy generation and renewable energy generation technology on the power industry. It would also be interesting to examine whether there are differences in the application of the PDA method across different countries’ power industries. Additionally, further applications of the DEA model, stochastic frontier analysis method, and different regression analysis approaches could be explored to examine the carbon emission drivers in the development process of the power industry. These are of practical and theoretical significance and are worthy of in-depth research and exploration.
Finally, it is necessary to acknowledge that there is further development potential with respect to our research. Firstly, the data used in this study only covered a small portion of fossil fuel power plants in China and cannot display the full picture of power plant production. The LMDI method used for decomposition cannot simultaneously examine the effects of both relative and absolute factors. The mutual dependency of various factors limits the decomposition results of LMDI. Additionally, due to limitations in article length and purpose, this article did not further analyze the effectiveness of using this model in different countries. Therefore, we believe that further analysis can be conducted in future work.

5. Conclusions

This study focuses on the power industry in 30 provinces and cities from 2005 to 2020 in China and adopts an improved PDA model to calculate the carbon emission drivers of the Chinese power industry. The model takes into account the impact of technological heterogeneity among different provinces and also considers factors such as power generation structure and climate environment. Compared to existing research methods, it not only decomposes the heterogeneity among provinces more comprehensively but also obtains more accurate results. The main conclusions are as follows:
(1)
Carbon emissions from the power sector, with the national power sector’s carbon emission ratio being greater than 1, indicate that carbon emissions from China’s power sector still increased during the study period, while provincial carbon emission ratios show that super tier 1 cities, such as Beijing, Shanghai, and Qinghai, and provinces with low electricity consumption have a better effect in reducing emissions from the power sector compared to other provinces and cities.
(2)
With respect to driving factors, economic development is the most important reason for the growth of carbon emissions in China’s power sector. Growth in GDP per capita has more than double the impact on carbon emissions in the power sector than all other drivers of carbon emissions growth combined. Electricity generation per unit of GDP is the main driver of carbon emission reduction in the power sector, and the generation mix, thermal power reduction technologies, and thermal power energy efficiency technologies are also positive factors in achieving carbon reduction in the power sector.
The following policy recommendations can be provided based on the findings of the study: (1) With respect to the development of power industry emission reduction policies to achieve power generation restructuring, not only to provide new energy-related policy subsidies but also to consider the impact of the growth of new energy generation on the thermal power industry. (2) Improvements in the measurement of carbon emissions can be attained by combining responsibility for carbon emissions with actual electricity consumption. Compared to other energy sources, the end-use consumption of electricity does not necessarily directly generate carbon emissions, the transfer of carbon emissions is implicit in electricity trading between provinces and municipalities, and the implementation of responsibility for carbon emissions can reduce carbon emissions at the source. (3) In the long run, the realization of fuel reduction technology for thermal power and the improvement in the market share of energy-saving products are still key factors in achieving carbon emission reduction in the power industry, and the popularization of energy-saving and emission reduction technology is especially important for carbon emission reduction in the power industry in major power generation provinces. The degree of influence of the drivers varies from province to province, and it is necessary to promote the implementation of relevant policies according to the actual situation of the province.

Author Contributions

Conceptualization, H.W. and Z.Y.; methodology, H.W.; software, T.Z.; validation, L.Y., H.W. and Z.Y.; formal analysis, L.Y.; investigation, T.Z.; resources, W.S. and L.Y.; data curation, T.Z.; writing—original draft preparation, T.Z.; writing—review and editing, W.S.; visualization, T.Z.; supervision, W.S.; project administration, H.W. All authors have read and agreed to the published version of the manuscript.

Funding

This research received no external funding.

Data Availability Statement

Not applicable.

Acknowledgments

The authors would like to thank the anonymous reviewers and editors for their constructive comments and suggestions for improving the quality of this article.

Conflicts of Interest

The authors declare no conflict of interest.

Appendix A

Table A1. Calorific value of combustion, emission factors and oxidation rates for various types of energy.
EnergyAverage Net
Calorific Value
(108 J/ton)
EFCO2i
(ton/1012 J)
EFCH4i
(ton/1012 J)
EFN2Oi
(ton/1012 J)
Oxygenation Efficiency
(%)
Raw Coal209.0894.600.0010.001591.80
Cleaned Coal263.4494.600.0010.001591.80
Other Washed Coal83.6394.600.0010.001591.80
Briquettes209.0897.530.0010.001592.80
Coke284.35107.070.0010.001592.80
Other Coking Products284.3594.600.0010.001592.80
Crude Oil418.1673.330.0030.000697.90
Gasoline430.7069.300.0030.000698.60
Diesel Oil426.5274.070.0030.000698.20
Fuel Oil418.1677.370.0030.000698.50
Other Petroleum Products418.1673.330.0030.000697.90
Coke Oven Gas167.26 *44.370.0010.000199.00
Other Gas52.27 *44.370.0010.000199.00
Liquefied Petroleum Gas501.7963.070.0010.000198.90
Refinery Gas460.5557.570.0010.000198.90
Natural Gas389.31 *56.100.0010.000199.00
Liquefied Natural Gas514.8656.100.0010.000199.00
Other Energy292.7191.670.0010.000199.00
* Of which coke oven gas, other gas and natural gas units are in one hundred million joules per cubic metre.
Table A2. Chinese provinces and corresponding abbreviations.
ProvinceProvince Abbreviations
AnhuiAH
BeijingBJ
ChongqingCQ
FujianFJ
GansuGS
GuangdongGD
GuangxiGX
GuizhouGZ
HainanHI
HebeiHE
HeilongjiangHL
HenanHA
HubeiHB
HunanHN
Inner MongoliaNM
JiangsuJS
JiangxiJX
JiangxiSX
JilinJL
LiaoningLN
NingxiaNX
QinhaiQH
ShaanxiSN
ShandongSD
ShanghaiSH
SichuanSC
TianjinTJ
XinjiangXJ
YunnanYN
ZhejiangZJ
Table A3. Data source and reference source description.
Graphs or TablesSource
Table A1[15]
Figure 1, Figure 3 and Figure 4Equations (3)–(6) and (11)–(21)
Figure 2Equation (22)
Figure 5, Figure 6, Figure 7, Figure 8 and Figure 9Equations (11)–(13)

References

  1. Lyu, J.; Li, J. Coupling and Coordinated Spatiotemporal Evolution of the Three-Dimensional System among Carbon Emission-Economic Growth-Ecological Environment in China. Ecol. Econ. 2022, 38, 36–43. [Google Scholar]
  2. Zhao, Y.; Wang, W.; Yan, S. Distributionally robust optimization scheduling of a joint wind-solar-storage system considering step-type carbon trading. Power Syst. Prot. Control 2023, 51, 127–136. [Google Scholar] [CrossRef]
  3. Yang, L.S.; Lin, B.Q. Carbon dioxide-emission in China’s power industry: Evidence and policy implications. Renew. Sustain. Energy Rev. 2016, 60, 258–267. [Google Scholar] [CrossRef]
  4. Kou, Y.; Wu, J.; Zhang, H.; Yang, J.; Jiang, H. Low carbon economic dispatch for a power system considering carbon capture and CVaR. Power Syst. Prot. Control 2023, 51, 131–140. [Google Scholar] [CrossRef]
  5. Ding, T.; Yang, J.; Song, P. Decomposition Analysis of Carbon Emissions between Eight Comprehensive Economic Areas of China—Based on the Perspective of Temporal and Spatial Technical Heterogeneities. China Soft Sci. 2022, 36, 89–96. [Google Scholar]
  6. Zhou, X.; Zhou, D.; Wang, Q. Who shapes China’s carbon intensity and how? A demand-side decomposition analysis. Energy Econ. 2020, 85, 104600. [Google Scholar] [CrossRef]
  7. Li, J.; Meng, G.; Li, C.; Du, K. Tracking carbon intensity changes between China and Japan: Based on the decomposition technique. J. Clean. Prod. 2022, 349, 131090. [Google Scholar] [CrossRef]
  8. De Oliveira-De Jesus, P.M. Effect of generation capacity factors on carbon emission intensity of electricity of Latin America & theCaribbean, a temporal IDA-LMDI analysis. Renew. Sustain. Energy Rev. 2019, 101, 516–526. [Google Scholar]
  9. Xu, S.C.; He, Z.X.; Long, R.Y.; Chen, H.; Han, H.M.; Zhang, W.W. Comparative analysis of the regional contributions to carbon emissions in China. J. Clean. Prod. 2016, 127, 406–417. [Google Scholar] [CrossRef]
  10. Yan, Q.; Zhang, Q.; Zou, X. Decomposition analysis of carbon dioxide emissions in China’s regional thermal electricity generation, 2000–2020. Energy 2016, 112, 788–794. [Google Scholar] [CrossRef]
  11. Chang, N.; Lahr, M.L. Changes in China’s production-source CO2 emissions: Insights from structural decomposition analysis and linkage analysis. Econ. Syst. Res. 2016, 28, 224–242. [Google Scholar] [CrossRef]
  12. Chang, Y.F.; Lin, S.J. Structural decomposition of industrial CO2 emission in Taiwan: An input-output approach. Energy Policy 1998, 26, 5–12. [Google Scholar] [CrossRef]
  13. de Araújo, I.F.; Jackson, R.W.; Neto AB, F.; Perobelli, F.S. European union membership and CO2 emissions: A structural decomposition analysis. Struct. Chang. Econ. Dyn. 2020, 55, 190–203. [Google Scholar] [CrossRef]
  14. Dietzenbacher, E.; Kulionis, V.; Capurro, F. Measuring the effects of energy transition: A structural decomposition analysis of the change in renewable energy use between 2000 and 2014. Appl. Energy 2020, 258, 114040. [Google Scholar] [CrossRef]
  15. Wang, Q.; Han, X. Is decoupling embodied carbon emissions from economic output in Sino-US trade possible? Technol. Forecast. Soc. Chang. 2021, 169, 120805. [Google Scholar] [CrossRef]
  16. Zhang, C.; Su, B.; Zhou, K.; Yang, S. Analysis of electricity consumption in China (1990–2016) using index decomposition and decoupling approach. J. Clean. Prod. 2019, 209, 224–235. [Google Scholar] [CrossRef]
  17. Lin, B.; Tan, R. Sustainable development of China’s energy intensive industries: From the aspect of carbon dioxide emissions reduction. Renew. Sustain. Energy Rev. 2017, 77, 386–394. [Google Scholar] [CrossRef]
  18. Chong, C.; Liu, P.; Ma, L.; Li, Z.; Ni, W.; Li, X.; Song, S. LMDI decomposition of energy consumption in Guangdong Province, China, based on an energy allocation diagram. Energy 2017, 133, 525–544. [Google Scholar] [CrossRef]
  19. Yang, J.; Hao, Y.; Feng, C. A race between economic growth and carbon emissions: What play important roles towards global low-carbon development? Energy Econ. 2021, 100, 105327. [Google Scholar] [CrossRef]
  20. Zheng, X.; Wang, R.; Du, Q. How does industrial restructuring influence carbon emissions: City-level evidence from China. J. Environ. Manag. 2020, 276, 111093. [Google Scholar] [CrossRef]
  21. Zhou, P.; Ang, B.W. Decomposition of aggregate CO2 emissions: A production-theoretical approach. Energy Econ. 2008, 30, 1054–1067. [Google Scholar] [CrossRef]
  22. Wang, Q.; Han, X.; Li, R. Does technical progress curb India’s carbon emissions? A novel approach of combining extended index decomposition analysis and production-theoretical decomposition analysis. J. Environ. Manag. 2022, 310, 114720. [Google Scholar] [CrossRef] [PubMed]
  23. Li, H.; Zhao, Y.; Qiao, X.; Liu, Y.; Cao, Y.; Li, Y.; Wang, S.; Zhang, Z.; Zhang, Y.; Wang, J. Identifying the driving forces of national and regional CO2 emissions in China: Based on temporal and spatial decomposition analysis models. Energy Econ. 2017, 68, 522–538. [Google Scholar] [CrossRef]
  24. Zhou, P.; Zhang, H.; Zhang, L. The drivers of energy intensity changes in Chinese cities: A production-theoretical decomposition analysis. Appl. Energy 2022, 30, 118230. [Google Scholar] [CrossRef]
  25. Tian, Y.; Wang, Y.Z.; Hang, Y.; Wang, Q.W. The two-stage factors driving changes in China’s industrial SO2 emission intensity: A production-theoretical decomposition analysis. Sci. Total Environ. 2021, 814, 152426. [Google Scholar] [CrossRef]
  26. Zhang, X.P.; Tan, Y.K.; Tan, Q.L.; Yuan, J.H. Decomposition of aggregate CO2 emissions within a joint production framework. Energy Econ. 2012, 34, 1088–1097. [Google Scholar] [CrossRef]
  27. Wang, C. Changing energy intensity of economies in the world and its decomposition. Energy Econ. 2013, 40, 637–644. [Google Scholar] [CrossRef]
  28. Wang, H.; Zhou, P.; Xie, B.C.; Zhang, N. Assessing drivers of CO2 emissions in China’s electricity sector: A metafrontier production-theoretical decomposition analysis. Eur. J. Oper. Res. 2019, 275, 1096–1107. [Google Scholar] [CrossRef]
  29. Liu, X.; Zhou, D.; Zhou, P.; Wang, Q. Factors driving energy consumption in China: A joint decomposition approach. J. Clean. Prod. 2018, 172, 724–734. [Google Scholar] [CrossRef]
  30. Zhang, Y.; Yu, Z.; Zhang, J. Research on carbon emission differences decomposition and spatial heterogeneity pattern of China’s eight economic regions. Environ. Sci. Pollut. Res. Int. 2022, 29, 29976–29992. [Google Scholar] [CrossRef]
  31. Banerjee, S. Addressing the carbon emissions embodied in India’s bilateral trade with two eminent Annex-II parties: With input–output and spatial decomposition analysis. Environ. Dev. Sustain. 2020, 23, 5430–5464. [Google Scholar] [CrossRef]
  32. Taeyoung, J.; Dowon, K. Korean carbon intensity change: Production-theoretical Decomposition Analysis (PDA) and Log Mean Divisia Index (LMDI). Korean Energy Econ. Rev. 2021, 20, 105–138. [Google Scholar]
  33. Zhang, S. Study on Driving Factors and Reduction Strategies of Greenhouse Gas Emissions for China’s Power Industry. Ph.D. Thesis, Tianjin University, Tianjin, China, 2019. [Google Scholar]
  34. Shao, L.; Yu, X.; Feng, C. Evaluating the eco-efficiency of China’s industrial sectors: A two-stage network data envelopment analysis. J. Environ. Manag. 2019, 247, 551–560. [Google Scholar] [CrossRef] [PubMed]
  35. Shephard, R.W.; Fare, R. The law of diminishing returns. Prod. Theory 1974, 99, 287–318. [Google Scholar]
  36. Färe, R.; Grosskopf, S.; Lovell, C.K.; Pasurka, C. Multilateral productivity comparisons when some outputs are undesirable: A nonparametric approach. Rev. Econ. Stat. 1989, 71, 90–98. [Google Scholar] [CrossRef]
  37. Farrell, M.J. The measurement of productive efficiencyl. J. R. Soc. Ser. A 1957, 120, 253–290. [Google Scholar] [CrossRef]
  38. Wang, M.; Feng, C. The impacts of technological gap and scale economy on the low-carbon development of China’s industries: An extended decomposition analysis. Technol. Forecast. Soc. Chang. 2020, 157, 120050. [Google Scholar] [CrossRef]
  39. Wang, Q.; Hang, Y.; Su, B.; Zhou, P. Contributions to sector-level carbon intensity change: An integrated decomposition analysis. Energy Econ. 2018, 70, 12–25. [Google Scholar] [CrossRef]
  40. Li, X.; Liao, H.; Du, Y.F.; Wang, C.; Wang, J.W.; Liu, Y. Carbon dioxide emissions from the electricity sector in major countries: A decomposition analysis. Environ. Sci. Pollut. Res. 2018, 25, 6814–6825. [Google Scholar] [CrossRef]
  41. Xie, B.C.; Tan, X.Y.; Zhang, S.; Wang, H. Decomposing CO2 emission changes in thermal power sector: A modified production-theoretical approach. J. Environ. Manag. 2021, 281, 111887. [Google Scholar] [CrossRef]
Figure 1. Decomposition results of the carbon emission ratio of the national power sector.
Systems 11 00495 g001
Figure 2. Carbon emission ratio of the power sector in different provinces.
Systems 11 00495 g002
Figure 3. Decomposition results from carbon emissions in the power sectors of different provinces.
Systems 11 00495 g003
Figure 4. Impact of thermal power energy and emission efficiency factors in different provinces.
Systems 11 00495 g004
Figure 5. Effect of technical efficiency factors on thermal power energy efficiency and emission reduction in different provinces.
Systems 11 00495 g005
Figure 6. Impact of potential thermal power energy consumption and thermal fuel emission factors in different provinces.
Systems 11 00495 g006
Figure 7. Influence of power generation structure and population density emission factors in different provinces.
Systems 11 00495 g007
Figure 8. Impact of economic drivers in different provinces.
Systems 11 00495 g008
Figure 9. Influence of annual rainfall factors in different provinces.
Systems 11 00495 g009
Table 1. Descriptive statistics of input and output variables.
IndicatorsEnergy InputLaborInstalled CapacityElectricity OutputCO2 Emissions
(104 tce)(Person)(104 KW)(108 KWh)(104 t)
Maximum25,983.68283,00011,1355141.5650,535.26
Minimum332.650619,471355.63436.6437
Mean5648.746117,412.42717.71229.52710,042.93
Standard deviation5192.41964,939.482670.2281190.1489292.748
Disclaimer/Publisher’s Note: The statements, opinions and data contained in all publications are solely those of the individual author(s) and contributor(s) and not of MDPI and/or the editor(s). MDPI and/or the editor(s) disclaim responsibility for any injury to people or property resulting from any ideas, methods, instructions or products referred to in the content.

