
How Does Economic Resilience Enhance the Innovation Capability of the High-Tech Industry? Evidence from China
College of Humanities and Social Sciences, Harbin Engineering University, Harbin 150001, China
*
Author to whom correspondence should be addressed.
Systems 2023, 11(11), 531; https://doi.org/10.3390/systems11110531
Submission received: 1 October 2023
/
Revised: 27 October 2023
/
Accepted: 31 October 2023
/
Published: 31 October 2023
(This article belongs to the Special Issue Developing Resilient Systems: Engineering Solutions for a Changing World)
Abstract
:There is still a significant gap between most high-tech fields in China and developed countries, and the relationship between the economic resilience of innovation systems and the innovation capability of the high-tech industry has received attention. Using data from 30 provinces in China, this study adopts the fuzzy-set qualitative comparative analysis approach to analyze the relationship between economic resilience and high-tech industry innovation capability, and the findings are as follows: (1) Technological talents and economic development are necessary conditions for explaining the high innovation capability of high-tech industries. (2) The combination of economic resilience and different factors constitutes the equivalent configuration of two high innovation capabilities and four low innovation capabilities. (3) Under high-intensity technological competition between governments, the increased agglomeration of technological talents, and high-quality economic development, the strengthening of economic resilience is conducive to enhancing the innovation capability of high-tech industries. (4) Under low-intensity technological competition between governments, a well-developed technology market, and increased agglomeration of technological talents, the strengthening of economic resilience is adverse to enhancing the innovation capability of high-tech industries. The main contribution of this study is to clarify the configuration mechanism of economic resilience that acts on the innovation capability of the high-tech industry and reveal the complex interaction between economic resilience and multiple factors.
1. Introduction
The high-tech industry has become an important field of national competition, and its innovation capability is a key factor in measuring a country’s innovation capability [1]. Currently, China’s high-tech industry is showing a rapid development trend overall. However, apart from a few fields, such as quantum communication, aerospace, and high-speed rail, there is still a significant gap between most high-tech fields in China and developed countries, with issues of low-end locking in the global value chain and key core technologies being “stuck” [2,3]. Therefore, methods for effectively enhancing the innovation capability of the high-tech industry have become urgently needed in China.
Due to the fact that the improvement of innovation capability in the high-tech industry is a systematic result, the relationship between the economic resilience of regional innovation systems and the innovation capability of the high-tech industry has received attention. The meaning of resilience in mechanics is the capability of an object to recover to its initial state after being subjected to pressure. Resilience research began in the field of ecology, referring to the capability of ecosystems to not only recover their original equilibrium state after being impacted but also their ability to potentially transition into another new equilibrium state [4,5]. Considering the non-equilibrium changes in the system, evolutionary resilience has been proposed, which is believed that resilience is an ongoing process rather than a restoration to a stable equilibrium state [6]. Economic resilience originates from evolutionary resilience, and it is defined as the capability of a region to resist uncertain external shocks and recover back to its original level or even evolve to a higher level via structural adjustment and adaptation [7,8].
However, according to the existing literature, the impact of economic resilience on the innovation capability of the high-tech industry is still uncertain:
- (1)
- (2)
- Economic resilience may also have a negative impact on the innovation capability of high-tech industries. For example, systems with strong resilience may hinder innovation behavior or be adverse to high-tech industry agglomeration [11].
- (3)
- Different from the situations in (1) and (2), some studies have pointed out that there is an inverted U-shaped relationship between resilience strength and innovation output, i.e., the impact on innovation output is greatest when resilience strength is moderate. Resilience strength under low innovation output is negatively correlated with innovation output, and the impact of resilience strength on innovation output is minimal under moderate R&D investment [12].
Therefore, this study aims to identify the causes of this uncertainty. One possible reason for the above problem is that the existing literature mainly uses traditional regression analysis approaches to study the net effect of a single variable (e.g., economic resilience) on the result (e.g., innovation capability of the high-tech industry). The causal conditions for the occurrence of social phenomena are often interdependent rather than independent, and explaining the causes of social phenomena requires a holistic approach [13]. In fact, many key factors can have an impact on the innovation capability of the high-tech industry, such as technological investments from the government [14,15], digital economy development [16,17], foreign direct investment [18,19], technology market [20], etc. If viewed from a holistic perspective, economic resilience is likely to have an impact on the innovation capability of the high-tech industry in a complex combination and synergy process with respect to these key factors. The different combinations of economic resilience and these factors may result in either high or low innovation capabilities. In this complex causal relationship, it is difficult to clarify the impact of economic resilience on the innovation capability of the high-tech industry by only considering the net effect of a single variable.
The fuzzy-set qualitative comparative analysis (fsQCA) approach provides a solution to the aforementioned research limitations. The configuration perspective is widely used to understand causal complexity, where multiple conditions form different configurations and determine the appearance of results (such as the high or low innovation capability of high-tech industry) [13]. The fsQCA approach based on the set-theoretic approach provides a new method for solving complex causal relationships in such configuration problems, as fsQCA is suitable for configuration problems rather than net effect problems [21]. The fsQCA approach can directly analyze the interdependence among variables [22].
Therefore, we adopt the fsQCA approach to conduct this study and attempt to answer the following questions: What is the configuration mechanism that leads to uncertainty in the impact of economic resilience on the innovation capability of the high-tech industry? In what configuration is the strengthening of economic resilience beneficial for enhancing the innovation capability of the high-tech industry? And in what configuration is the strengthening of economic resilience unbeneficial for enhancing the innovation capability of the high-tech industry? Our study may contribute to the following two aspects: (1) systematically integrating the influencing factors of high-tech industry innovation capability from a configuration perspective, clarifying the configuration mechanism of economic resilience that acts on the innovation capability of high-tech industries. (2) By exploring the configuration effects of multiple conditions, the complex interactive nature between economic resilience and various influencing factors is explained, which compensates for the limitations of existing research in explaining the relationship between economic resilience and the innovation capability of the high-tech industry.
The remainder of this study is organized as follows: Section 2 reviews the literature related to the innovation capability of high-tech industry innovations and key influencing factors. Section 3 introduces the methods and data. Section 4 presents the results of the analysis. Section 5 further discusses the results. Section 6 presents the conclusions.
2. Literature Review
As we mentioned in the Introduction section, more than one key factor can affect the innovation capability of high-tech industries. However, we cannot exhaust all factors, and the fsQCA approach itself can only analyze a limited number of condition variables. In this case, we can only select the factors that are often used as independent or control variables from the recent research literature. Therefore, this study adopts the following logic for the literature review: On the one hand, we review the relationship between the innovation capability of high-tech industries and factors such as technological competition between governments, the technology market, technology talent agglomeration, and regional economic factors. Regarding regional economic factors, they include economic resilience, foreign direct investment, the digital economy, gross domestic product (GDP), and urbanization. On the other hand, this study introduces configuration analyses, which can be used to integrate the aforementioned factors and build a configuration framework for this study.
2.1. Government Technology Competition and Innovation Capability of the High-Tech Industry
In the institutional context of China, the central government personnel appointment system based on the relative performance evaluation of officials deeply shapes the behavioral logic of local governments [23]. Therefore, when facing the pressure brought by common higher-level tasks, there will be competitive behavior among governments at the same level, and the winners will receive additional incentives, thereby encouraging local governments to improve their work performance on the corresponding tasks [24,25]. The local government economic competition surrounding GDP once drove the rapid growth of China’s economy [26,27], but it also led to a series of economic and social problems, such as duplicate construction, regional development imbalance, ecological environment deterioration [28], etc. Since the 18th National Congress of the Communist Party of China, technological innovation has risen to an unprecedently important political and strategic position in China, and local governments in China have therefore shifted from GDP competition to technological competition [29].
The impact of technological competition between governments in China on the innovation capacity of the high-tech industry is similar to economic resilience. On the one hand, under the constraints of tenure, local Chinese governments tend to invest in low-risk and short-cycle technology projects and protect the local industry by adopting market segmentation strategies, which is not conducive to the cultivation of high-tech enterprises’ capabilities and collaborative innovation [30]. On the other hand, under the political pressure of promoting competition around technological innovation, local governments will increase their support and investment in high-tech industry to gain increased political performance, which promotes the flow of innovation elements to the high-tech industry, thereby enhancing innovation capabilities [31]. Overall, in the institutional context of China, technological government competition is an important factor affecting the innovation capability of the high-tech industry.
2.2. Technology Market and Innovation Capability of the High-Tech Industry
Under the influence of market mechanisms, the flow and diffusion of innovative elements, the widespread application of new processes and technologies, and the mutual matching of new products and markets can effectively enhance the innovation capability of the high-tech industry [32]. Among them, the technology market is the field where high-tech industries conduct technological transactions, and its developmental level and scale are closely related to innovation capabilities. Seok et al. found that technological trading activities can significantly improve innovation performance [33]. Zheng et al. found that China’s technology market policy can effectively promote the active participation of multinational corporations in technology transfer and promote innovation output [34]. Zhou et al. utilized transaction data from China’s provincial technology market from 2000 to 2019 and found that the development scale of regional technology markets significantly promoted the level of regional technological innovation [35]. Zhao et al. used technology market development as an intermediary variable to empirically test the direct and indirect effects of Internet development on high-tech industrial technological innovation, and they pointed out that the strategy of “Internet + technology market” directs and improves the development of high-tech industrial innovation resources’ optimization layout [36]. Therefore, the technology market is an important influencing factor for the innovation capability of the high-tech industry.
2.3. Technology Talent Agglomeration and Innovation Capability of the High-Tech Industry
The high-tech industry is a knowledge- and technology-intensive industry. When the agglomeration effect caused by the orderly flow of technological talents spreads to the high-tech industry, it plays an irreplaceable role in the acquisition, digestion, transformation, and utilization of knowledge and technology in the high-tech industry, thereby enhancing the innovation capability and competitiveness of the industry [37,38]. Therefore, the relationship between technological talents and the high-tech industry is a research topic that has received long-term attention. In the early literature, as Lucas pointed out, human capital agglomeration is the key to maintaining growth in the industrial economy [39]. Krugman proposed that the flow of technological talents will generate spatial agglomeration, and the agglomeration of technological talents is closely related to industrial agglomeration [40].
The early literature focused on the relationship between human capital agglomeration and industrial economic growth, as well as industrial agglomeration [39,40]. In recent years, research has further empirically analyzed the interaction mechanism between technological talent agglomeration and the innovation capability of the high-tech industry. For example, Pei conducted empirical research using panel data from 31 provinces in China from 2003 to 2013, indicating a significant positive interactive relationship between technology talent agglomeration and the development of high-tech industries, and technology talent agglomeration holds a “dominant position” in the interaction mechanism between the two [41]. Li and Liu found that technological talent agglomeration significantly promotes the improvement of regional innovation capabilities, and scientific and technological expenditures play a mediating effect between technological talent agglomeration and regional innovation capabilities [42]. In summary, technological talent agglomeration is a core element that affects the innovation capability of the high-tech industry.
2.4. Regional Economic Factors and Innovation Capability of the High-Tech Industry
There are many constituent factors in a regional economy, and in recent years, research has mainly focused on the impact of the following five factors on the innovation capability of the high-tech industry.
(1) Economic resilience: Regional economic resilience is a type of economic resilience with spatial characteristics, and its research focuses on the capability of multi-scale spatial economic systems to cope with external shocks [43]. From this perspective, regional development is considered a complex process, and the response, resistance, and post-crisis recovery of a region may lead to a new path for regional development [44]. Existing research mainly focuses on the role of technological innovation in regional economic resilience, and current views believe that technological progress and accumulation are beneficial for enhancing regional economic resilience [45,46]. In recent years, research has begun to focus on the impact of regional economic resilience on technological innovation, believing that regions with high economic resilience have higher efficiency with respect to technological innovation [47]. However, some studies have shown that the impact of economic resilience on the innovation capability of the high-tech industry is still uncertain [12,48].
(2) Foreign direct investment: Foreign direct investment (FDI) is the main carrier of cross-border investment behavior in an open economy, and utilizing FDI to develop high-tech industry has always been an important goal for China. Therefore, increasing attention has been focused on the impact of FDI on innovation in China’s high-tech industry [49,50,51]. However, there is no consensus on whether FDI can improve the innovation capability of the high-tech industry. On the one hand, FDI will fill the gaps in savings, foreign exchange, and technology in the host country, and it can enhance the industrial and technological level of the host country. The existing theoretical and empirical studies have confirmed the positive impact of FDI on the improvement of innovation performance in China’s high-tech industry [52,53]. On the other hand, it was observed that FDI can lead to the increasing dependence of host countries on foreign technology, inhibit the independent innovation and technological progress of host country enterprises, and thereby reduce their market share and productivity [54,55].
(3) Digital economy: In recent years, with the development of emerging digital technologies such as 5G, artificial intelligence, big data, and cloud computing, the digital economy has become an important driving force of economic development and social progress [56]. In China’s transition from high-speed growth to high-quality development, the digital economy has become an important means of promoting technological innovation [57]. For the high-tech industry, the digital economy improves the innovation efficiency of the high-tech industry by reducing the costs and risks of industrial innovation, optimizing innovation links, and achieving the precise integration of the supply and demand of innovation factors [58]. However, it was also found that although the digital economy can effectively improve the innovation efficiency of the high-tech industry, its impact tends to weaken over time [59].
(4) GDP: Regional GDP is an important indicator of regional economic growth, and the level of regional GDP is related to the development of innovation infrastructure, the completeness of the industry–university–research chain, and the degree of convergence of innovation factors in the region [60]. However, the speed of growth is not necessarily equivalent to the quality of growth. For example, in the past, China adopted an extensive economic growth model, pursuing the “speed and scale” of GDP, while the current Chinese economy emphasizes a shift from high-speed growth to high-quality development [61]. Therefore, GDP is not necessarily proportional to the innovation capability of the high-tech industry.
(5) Urbanization: Cities have the advantages of economic agglomeration and diversified innovation factor agglomeration, which makes urbanization beneficial for innovation entities to enhance their innovation capabilities and technological innovation [62]. However, with the development process of urbanization, urban diseases such as increasing pollution, increasing energy consumption, insufficient housing, inadequate employment, and traffic congestion have serious negative impacts on the quality of urbanization [20]. This negative impact may lead to synergy failure between urbanization and high-tech industries, thereby inhibiting the sustainable development of high-tech industries [63].
2.5. Integration of Factors Based on Configuration Analysis
The causes of social phenomena are mostly interdependent rather than independent, and these causal conditions can be aggregated into different configurations in order to jointly determine the occurrence of specific outcomes [21]. Thus, the relationship between causal conditions and outcome sets needs to be explained in a holistic and combinatorial manner [22]. Configuration analysis breaks through the limitations of traditional regression analysis approaches on overlapping effects among important variables, providing a systematic and comprehensive perspective that can effectively handle configurations comprising multiple factors, which has been increasingly confirmed by more and more studies to be suitable as a theoretical perspective for studying complex causal relationships [13].
The relationship between economic resilience and the innovation capability of the high-tech industry that this research focuses on is a configuration issue. On the one hand, as demonstrated by literature reviews, the impact of economic resilience on the innovation capability of the high-tech industry is uncertain. Although there are studies discussing this relationship from a threshold perspective, more than one factor affects the innovation capability of the high-tech industry. The lack of analysis of the combined effects of specific conditions may be the underlying reason for the unclear relationship between economic resilience and the innovation capability of the high-tech industry. On the other hand, the received literature also shows that, in addition to economic resilience, there is uncertainty in the relationship between other important factors (such as the digital economy, GDP, urbanization, etc.) and the innovation capability of high-tech industries. Thus, by building a configuration framework (see Figure 1), this study attempts to adopt a holistic and combinatorial approach to analyze the main causes and combinations of factors that contribute to the innovation capability of the high-tech industry in order to explore various possible configurations through which economic resilience takes effect.
3. Methods and Data
3.1. Fuzzy-Set Qualitative Comparative Analysis Approach
The QCA approach originated in the 1980s and has now been widely applied in research fields such as sociology, politics, and management [13]. The QCA approach combines the advantages of two mainstream research methods, which are quantitative and qualitative, and carries out comparative cross-case analysis via Boolean algebra and set relationships. The QCA approach, believing that cases are composed of causal conditions, focuses on the complex causal relationship and causal asymmetry between configuration and outcomes (for example, different configurations containing economic resilience may generate high or low innovation capability with respect to the high-tech industry) [21]. According to the characteristics of variable types, the QCA approach can be divided into fuzzy-set qualitative comparative analysis (fsQCA), clear-set qualitative comparative analysis (csQCA), and multivalve-set qualitative comparative analysis (mvQCA). Compared to the other two approach types, fsQCA can better handle the problem of continuous data [13]. The fsQCA approach is suitable for medium-sized sample studies (e.g., 15 to 50 sample cases) [64].
The fsQCA approach is applicable to this study. On the one hand, the condition and outcome variables of this study are continuous data, and the selected samples from 30 provinces in China belong to a medium-sized sample. Therefore, the variable characteristics and sample size are matched with the fsQCA approach. On the other hand, the imbalanced regional development in China makes case comparisons valuable for studies. The eastern coastal areas have developed economies and a good innovation environment, gathering a large number of innovative elements, while the basic conditions for innovation in the central and western regions are relatively backward, and eliminating differences is difficult in the short term [65]. Therefore, this study adopts the fsQCA approach, which can not only explore the complexity of the causal relationship between regional economic resilience and the innovation capability of the high-tech industry but also carry out sufficient comparisons between cases and assess the external validity of conclusions [64]. Figure 2 shows the analysis process for carrying out the fsQCA approach.
3.2. Data Source and Measuring Method
Due to some missing data from Hong Kong, Macau, Taiwan, and Tibet, this study used data from 30 provinces in China. The outcome variable of this study used data from 2019, while the conditional variable used data from 2018 for the following reasons: (1) From 2020 to 2022, extremely strict control measures were adopted by the governments in China, which caused many enterprises to be completely shut down [66]. (2) Due to the time-lag effect of condition variables on the innovation capability of the high-tech industry, the condition variables were measured with data from the year 2018. Table 1 shows the introduction of outcome and condition variables.
The most direct manifestation of innovation capability is innovation output, and using patents to measure innovation output and innovation capability is a commonly used practice [67]. According to the literature [68], this study uses the number of patent applications to measure the innovation capability of the high-tech industry (ICHI), and the data are sourced from the China High-Tech Industry Statistical Yearbook (https://data.cnki.net/yearBook/single?id=N2021020055, accessed on 13 April 2023.).
Considering that the government’s policy of participating in technological competition ultimately manifests in financial expenditure, according to the literature [69], the measurement method of technological competition between governments is as follows: GTCi = (sfei/GDPi)/(sfe/GDP). GTCi represents the level of government technology competition in region i; sfei and GDPi represent the current year’s technological fiscal expenditure and regional GDP, respectively. sfe and GDP represent the current year’s national technology fiscal expenditure and GDP. The data are sourced from the China Statistical Yearbook (https://data.cnki.net/yearBook/single?id=N2019110002, accessed on 13 April 2023.).
According to the literature [70], this study uses the technology market’s transaction volume to measure the technology market (TM), and the data are sourced from the China High-Tech Industry Statistical Yearbook.
According to the literature [32], location entropy is used to measure the technological talent agglomeration of the high-tech industry, and the calculation formula is “TTA = (regional technology talent employment of high-tech industry/regional all industry employment)/(national technology talent employment of high-tech industry/national all industry employment)”. This was sourced from the China High-Tech Industry Statistical Yearbook.
This study adopts two calculation steps to measure economic resilience and economic development.
Step 1: Measurement of the initial value of regional economic factors: In this study, regional economic factors include multiple economic variables, and their initial values are measured as follows:
- (1)
- Initial economic resilience: According to the literature [7], this study uses the change rate of GDP for measurements, and the calculation formula is “Initial economic resilience = [(GDPi,t − GDPi,t−1)/GDPi, t−1 − (GDPt − GDPt−1)/GDPt−1]/|(GDPt − GDPt−1)/GDPt−1|”. GDPi, t is the gross domestic product of region i in year t; GDPi, t−1 is the gross domestic product of region i in year t − 1; GDPt is China’s gross domestic product in year t; and GDPt−1 is China’s gross domestic product in year t − 1. The data are sourced from the China Statistical Yearbook.
- (2)
- Other economic factors: The data on FDI are sourced from the statistical yearbooks of 30 provinces in China. This study uses the Digital Economy Development Index to measure the digital economy in various provinces, which is sourced from the 2019 China Digital Economy Development Index White Paper (https://www.ccidgroup.com/info/1096/21833.htm, accessed on 13 April 2023.), an authoritative report released by the China Electronic Information Industry Development Research Institute, a subsidiary of the Ministry of Industry and Information Technology of China. The data on regional GDP and urbanization are sourced from the China Statistical Yearbook, where urbanization is measured by the proportion of the regional urban population to the total population.
Step 2: Principal component extraction of regional economic factors: Due to the fact that the fsQCA approach is not suitable for handling too many condition variables (4–6 condition variables are more suitable for medium sample size) [64] and the calculation method of initial economic resilience overlaps with regional GDP to some extent, this study used principal component analysis to extract regional economic factors. By using the statistical software SPSS17.0 for principal component analysis, the scores of the principal components of economic resilience (ER) and economic development (ED) were obtained.
3.3. Calibration
The data for the conditions and outcome of this study are sourced from statistical data, which have high reliability and wide applicability but lack an external basis and theoretical standards for calibration. According to the literature [64], to determine the set membership of the sample cases, this study adopts the direct calibration method to calibrate initial data, setting the three fully in, crossover, and fully out anchor points of variables as 95%, 50%, and 5% of the descriptive statistical values of the sample cases, respectively. The anchor points of each variable are shown in Table 2, and the calibrated data of each variable are shown in Table A1 in Appendix A.
4. Results
4.1. Necessity Analysis
This study uses fsQCA 4.0 software to analyze data. Separate tests on the necessity of each condition need to be conducted before sufficiency analysis [64], and the results are shown in Table 3.
Consistency is an important criterion for measuring the necessity of conditions. When the consistency value is greater than 0.9, it can be considered a necessary condition for the outcome [64]. From Table 3, it can be seen that when ICHI is taken as the outcome, the consistency values of TTA and ER are both greater than 0.9. Therefore, TTA and ER are necessary conditions for generating ICHI. When ~ICHI is taken as the outcome, the consistency values of all conditions are below 0.9, indicating that none of the conditions can constitute a necessary condition to explain ~ICHI. The above analysis results indicate that the synergistic effect of five condition variables on the innovation capability of the high-tech industry requires a comprehensive consideration of their concurrent synergistic effects.
4.2. Sufficiency Analysis
Sufficiency analysis, also known as standardized analysis, is used to generate configurations. When setting parameters, the consistency threshold is set to 0.8 [13]. The setting of the frequency threshold should include at least 75% of observed cases, and considering that the total number of cases in this study is 30, the frequency threshold is set to 1 [13]. To reduce potential conflicting configurations, this study set the proportional reduction in inconsistency (PRI) at 0.7 [13,64].
When conducting the standardized analysis of ICHI, the software exports four primary implicants: GTC * TTA, TM * TTA, GTC * ED, and TTA * ED *~ER. In this study, “*” denotes interactions among condition variables. Considering the relationship between economic resilience and the innovation capability of the high-tech industry, as well as the importance of governments, markets, talents, and the economy, GTC * TTA, TM * TTA, and GTC * ED were selected as the primary implications for this study. In counterfactual analyses, TTA and ED are necessary conditions, and the “present” option is selected in the software procedure. The relationships between other conditions and outcomes lack clear theoretical expectations; thus, the present or absent option is chosen in the counterfactual analysis procedure [64].
When conducting a standardized analysis of ~ICHI, the software exported two primary implicants: ~ED and ~TM *~ER. Considering the relationship between economic resilience and the innovation capability of the high-tech industry, as well as the importance of the market, this study chose ~TM *~ER as the primary implicant. When conducting counterfactual analyses, due to the lack of clear theoretical expectations regarding the relationship between all conditions and outcomes, the present or absent option is chosen in the counterfactual analysis procedure [64].
Finally, complex solutions, parsimonious solutions, and intermediate solutions for ICHI and ~ICHI are obtained (see Table A2 in Appendix B). The interpretation of the results of sufficiency analysis mainly uses the parsimonious solution and the intermediate solution. The conditions that exist simultaneously in intermediate solutions and parsimonious solutions are the core conditions, and the conditions that only exist in intermediate solutions are the edge conditions [13]. We adopt the approach invented by Ragin and Fiss to showcase the results [21] (see Table 4).
4.3. Configuration Analysis
4.3.1. Configurations for ICHI
Table 4 shows two configurations for explaining ICHI. The solution’s consistency is 0.938, meaning that among all cases that meet these two configurations, 93.8% of cases have high innovation capability. The solution coverage is 0.848, meaning that these two configurations can explain 84.8% of cases with high innovation capability. By analyzing these two configurations, we can further identify the differential combination relationships of different condition variables influencing the ICHI.
(1) Configuration H1: TM*TTA*ED*~ER: Configuration H1 means that when a region combines TM, TTA, ED, and ~ER, this region can obtain high ICHI. In this configuration, TM, TTA, and ED are the core conditions, ~ER is the edge condition, and the presence or absence of GTC has no effect on the outcome. Configuration H1 can explain approximately 56.1% of the cases with high ICHI; approximately 14.6% of the cases with high ICHI can only be explained using this configuration. The typical cases in configuration H1 are Shanghai, Tianjin, Jiangsu, and Shandong.
(2) Configuration H2: GTC*TTA*ED*ER: Configuration H2 means that when a region combines GTC, TTA, Ed, and ER, this region can obtain high ICHI. In this configuration, GTC, TTA, and ED are the core conditions, ER is the edge condition, and the presence or absence of TM has no effect on the outcome. Configuration H2 can explain approximately 70.2% of the cases with high ICHI; approximately 28.7% of the cases with high ICHI can only be explained using this configuration. The typical cases in configuration H2 are Guangdong, Anhui, Jiangxi, Hubei, Zhejiang, and Sichuan.
4.3.2. Configurations for ~ICHI
Table 4 shows four configurations for explaining ~ICHI. The solution’s consistency is 0.989, meaning that among all cases that meet these four configurations, 98.9% of cases have low innovation capability. The solution’s coverage is 0.758, meaning that these four configurations can explain 75.8% of cases with low innovation capability. By analyzing these four configurations, we can further identify the differential combination relationships of different condition variables in influencing the ~ICHI.
(1) Configuration L1: ~TM*~TTA*~ED: Configuration L1 means that when a region combines ~TM, ~TTA, and ~ED, this region may obtain low ICHI. In this configuration, ~TM and ~TTA mean the absence of these two core conditions, ~ED means the absence of this edge condition, and the presence or absence of GTC and ER have no effect on the outcome. Configuration L1 can explain approximately 71.9% of the cases with low ICHI; approximately 16.0% of the cases with low ICHI can only be explained using this configuration. The typical cases in configuration L1 are Qinghai, Ningxia, Shanxi, and Guizhou.
(2) Configuration L2: ~GTC*~TM*~ED*~ER: Configuration L2 means that when a region combines ~GTC, ~TM, ~ED, and ~ER, this region may obtain low ICHI. In this configuration, ~TM and ~ER mean the absence of these two core conditions, ~GTC and ~ED mean the absence of these two edge conditions, and the presence or absence of TTA has no effect on the outcome. Configuration L2 can explain approximately 41.3% of the cases with low ICHI; approximately 0.7% of the cases with low ICHI can only be explained using this configuration. The typical cases in configuration L2 are Heilongjiang, Inner Mongolia, Hainan, and Chongqing.
(3) Configuration L3: ~GTC*TM*~TTA*~ER: Configuration L3 means that when a region combines ~GTC, TM, ~TTA, and ~ER, this region may obtain low ICHI. In this configuration, ~TTA and ~ER mean the absence of these two core conditions, ~GTC means the absence of this edge condition, TM means the presence of this edge condition, and the presence or absence of ED has no effect on the outcome. Configuration L3 can explain approximately 29.0% of the cases with low ICHI; approximately 1.3% of the cases with low ICHI can only be explained using this configuration. The typical cases in configuration L3 are Liaoning, Jilin, and Hebei.
(4) Configuration L4: ~GTC*~TM*~TTA*ER: Configuration L4 means that when a region combines ~GTC, ~TM, ~TTA, and ER, this region may obtain low ICHI. In this configuration, ~TM and ~TTA mean the absence of these two core conditions, ~GTC means the absence of this edge condition, ER means the presence of this edge condition, and the presence or absence of ED has no effect on the outcome. Configuration L4 can explain approximately 45.7% of the cases with low ICHI; approximately 0.8% of the cases with low ICHI can only be explained using this configuration. The typical cases in configuration L4 are Yunnan, Guangxi, Gansu, Xinjiang, and Henan.
5. Discussions
5.1. The Configuration Mechanism of the Impact of ER on the ICHI
The received literature has mainly analyzed the net effect of ER on the ICHI, and the effect of ER on the ICHI may either be positive [9,10], negative [11,48], or an inverted U-shaped relationship [12]. Therefore, in existing studies, the impact of ER on the ICHI is not clear. This study adopts a holistic and combinatorial configuration analysis method and observes whether the combination of ER and different causal conditions has different impact results on the ICHI.
- (1)
- The impact of a high ER on the ICHI: Configuration H2 indicates that the effective synergy among high ER, high GTC, high TTA, and high ED can generate a high ICHI. Configuration L4 indicates that the combination of high ER, low GTC, low TM, and low TTA will lead to low ICHI.
- (2)
- The impact of low ER on the ICHI: Configuration H1 indicates that the combination of low ER with high TM, high TTA, and high ED can generate high ICHI. Configuration L2 and L3 indicate that the combination of low ER with low GTC, low TM, and low ED, as well as the combination of low ER with low GTC, low TTA, and high TM, all lead to low ICHI.
This study takes a holistic perspective as the starting point, revealing the different combinations of ER and various key factors that can either form a configuration that positively affects the ICHI or negatively affects the ICHI. Therefore, this study provides a theoretical and empirical explanation for the uncertainty of the relationship between ER and ICHI in the received literature. It is proven that considering the synergistic effects of multiple variables is an important way to clarify the complex causal relationship between the ER and the ICHI.
5.2. Equivalent Configuration and Substitution Effects of the ICHI
Research based on linear assumptions often focuses on the impact of specific single variables on ICHI (see [9,16,19]), which results in a lack of in-depth analyses of the interaction among relevant factors. When there are differences in different factors and their combinations, different configurations will be shaped, resulting in differentiated outcomes. The fsQCA approach is suitable for configuration problems and can directly analyze the interdependence among variables, identify equivalent configurations composed of different condition variables, and identify substitution effects among different variables [13,21,22,64].
By adopting the fsQCA approach, this study finds that the different combinations of GTC, TM, TTA, ED, and ER constitute two equivalent configurations of high ICHI and four equivalent configurations of low ICHI:
- (1)
- By comparing the similarities and differences between equivalent configurations H1 and H2, the following is observed:
- Although configurations H1 and H2 are composed of different condition variables, they can both achieve high ICHI.
- With the same condition, combinations of “TTA * ED”, “TM *~ER”, and “GTC * ER” can be substituted for each other.
- (2)
- By comparing the similarities and differences of equivalent configurations L1, L2, L3, and L4, the following is observed:
- The four configurations composed of different conditions all lead to low ICHI.
- With the same condition combination “~TM *~TTA”, condition “~ED”, and condition combination “~GTC * ER” in configurations L1 and L4, they can be substituted for each other.
- With the same condition combination “~GTC *~ER”, condition combinations “~TM *~ED” and “TM *~TTA” in L2 and L3 can be substituted for each other.
The equivalent configurations and substitution effects prove that the methods that can drive high-tech industries to achieve high innovation capability or gain low innovation capability are not unique, and this has practical implications for exploring the development path of high-tech industries in technologically backward areas.
5.3. Causal Asymmetry of the Configurations of ICHI
In this study, following linear assumptions, the factors that lead to the presence or absence of outcomes are often the same variables. For example, a high ER can enhance the innovation capability of the high-tech industry [9,10], according to which logic a low ER should reduce the innovation capability of the high-tech industry. However, the specific factor that leads to the presence of the result and the specific factor that leads to the absence of the same result may not be the same factor, which can be interpreted as causal asymmetry [13,64].
By comparing the differences among the six configurations, it can be observed that the configuration mechanisms of high ICHI and low ICHI are asymmetric:
- (1)
- It is directly observed that two configurations lead to high ICHI, while four configurations lead to low ICHI.
- (2)
- GTC, TM, TTA, and ED are the core conditions for high ICHI, while ~TM, ~TTA, and ~ER are the core conditions for low ICHI.
- (3)
- By comparing configurations H1, H2, L2, L3, and L4, it can be found that high ER and low ER can both lead to high (low) ICHI. The causal relationship logic between ER and ICHI does not follow the linear assumption. Similarly, the presence or absence of GTC is irrelevant for the formation of high ICHI in configuration H1, while the absence of GTC becomes an important condition leading to low ICHI in configurations L2, L3, and L4.
The causal asymmetry indicates that decision makers in a specific region cannot simply replicate the successful experiences of other regions if they want to formulate high-tech industry policies that are beneficial to the region, as this so-called successful experience of other regions may lead to the consequences of failure.
5.4. Policy Implications and Research Prospects
The innovation capability of the high-tech industry is a key factor in measuring a country’s innovation capability. Reducing the gap in cutting-edge technology with developed countries, changing the position of technological products in the global value chain, and making breakthroughs in key core technologies, etc., all require China to enhance the innovation capability of the high-tech industry. In this context, the main policy implications of this study for enhancing the innovation capability of China’s high-tech industry are as follows:
- (1)
- High-tech industry technology talents and regional economic development are the core conditions for enhancing the innovation capability of the high-tech industry. However, it is worth noting that these two conditions are not sufficient, and decision-makers must further enhance the synergy between these two conditions and other conditions.
- (2)
- Enhancing the innovation capability of high-tech industry is feasible by enhancing economic resilience, but simultaneously enhancing government support for science and technology, increasing the training of technological talents, and promoting economic development are necessary. Strategically, the synergistic effect of these factors should be enhanced to form configurations that are conducive to generating high innovation capability within the high-tech industry.
- (3)
- For regions where the innovation capability of the high-tech industry has been at a low level for a long period of time, decision makers not only need to conduct in-depth evaluations of conditional endowments, such as technology fiscal expenditure, technology markets, technology talents, economic development, and economic resilience, but also need to conduct in-depth investigations on the factors that hinder the synergistic effect of these conditions in order to find a suitable path for improving the innovation capability of high-tech industries in local areas in accordance with local conditional endowments.
- (4)
- In practice, decision-makers related to these conditions in our study come from different government departments, and the essence of achieving conditional synergy is to achieve decision-making collaboration among different departments. That is to say that the overall effect of enhancing the innovation capability of high-tech industries at the system level is achieved through decision-making collaboration. Therefore, it is necessary to introduce the logic of collaborative governance into the decision-making process. Specifically, it is needed for the following processes: establishing a collaborative governance program in the decision-making process; requiring decision-makers from various departments to participate in discussions; jointly identifying problems; and developing collaborative action, supervision, and evaluation plans.
Finally, there are certain research limitations in this study. In the context of the current emphasis on the relationship between economic resilience and the innovation capability of high-tech industries, the purpose of this study was to clarify the complex causal relationship between the two and thus provide certain policy implications for enhancing the innovation capability of China’s high-tech industry. Therefore, this study mainly conducted static configuration mechanism analyses on the causal relationship between economic resilience and the innovation capability of high-tech industries, but it failed to analyze the dynamic evolution mechanism of this causal relationship. In this regard, future research needs to use methods such as in-depth interviews and historical institutional comparisons to study the dynamic evolution mechanism. Furthermore, due to the lack of dynamic analysis, this study did not provide a good explanation for the inverted U-shaped relationship between economic resilience and the innovation capability of the high-tech industry. Thus, developing a suitable dynamic fsQCA approach for future research is necessary.
6. Conclusions
This study adopts the fsQCA approach to conduct research and uses data from 30 provinces in China to test the relationship between economic resilience and the innovation capability of the high-tech industry. The answers to the research questions raised at the beginning are as follows:
- (1)
- Technological talent and economic development are necessary conditions for explaining the high innovation capability of the high-tech industry.
- (2)
- The combination of economic resilience and different factors constitutes the equivalent configuration of two high innovation capabilities and four low innovation capabilities.
- (3)
- Under the configuration of high-intensity technological competition between governments, the increased agglomeration of technological talents, and high-quality economic development, the strengthening of economic resilience is conducive to enhancing the innovation capability of high-tech industries.
- (4)
- Under the configuration of low-intensity technological competition among governments, a well-developed technology market, and the increased agglomeration of technological talents, the strengthening of economic resilience is averse to enhancing the innovation capability of the high-tech industry.
The main contribution of this study is to clarify the configuration mechanism of economic resilience that acts on the innovation capability of the high-tech industry, explain the complex interaction among economic resilience and multiple factors, and make up for the shortcomings of existing research in explaining the relationship between economic resilience and the innovation capability of high-tech industries.
Author Contributions
Conceptualization, Z.H.; methodology and software, Z.H. and B.H.; validation, Z.H.; formal analysis, Z.H.; data curation, Z.H.; writing—original draft preparation, Z.H.; writing—review and editing, Z.H. and B.H.; supervision, B.H.; project administration, B.H.; funding acquisition, B.H. All authors have read and agreed to the published version of the manuscript.
Funding
This research was funded by the General Project of the National Social Science Fund of China in 2019, grant number 19BSH041.
Data Availability Statement
The Excel Form File data used to support the findings of this study are available from the corresponding author upon request.
Conflicts of Interest
The authors declare no conflict of interest.
Appendix A

Table A1.
Results of calibration.
| Province | ICHI | GTC | TM | TTA | ED | ER |
|---|---|---|---|---|---|---|
| Beijing | 0.55 | 0.96 | 0.99 | 0.5 | 0.95 | 0.27 |
| Tianjin | 0.32 | 0.66 | 0.62 | 0.72 | 0.58 | 0.03 |
| Hebei | 0.5 | 0.08 | 0.51 | 0.28 | 0.31 | 0.35 |
| Shanxi | 0.06 | 0.49 | 0.25 | 0.08 | 0.18 | 0.45 |
| Inner Mongolia | 0.06 | 0.03 | 0.06 | 0.06 | 0.24 | 0.3 |
| Liaoning | 0.28 | 0.26 | 0.57 | 0.26 | 0.53 | 0.38 |
| Jilin | 0.07 | 0.19 | 0.53 | 0.11 | 0.04 | 0.08 |
| Heilongjiang | 0.07 | 0.12 | 0.29 | 0.07 | 0.11 | 0.15 |
| Shanghai | 0.55 | 0.95 | 0.75 | 0.6 | 0.93 | 0.18 |
| Jiangsu | 0.79 | 0.64 | 0.7 | 0.87 | 0.94 | 0.49 |
| Zhejiang | 0.67 | 0.72 | 0.6 | 0.88 | 0.88 | 0.52 |
| Anhui | 0.55 | 0.87 | 0.52 | 0.6 | 0.66 | 0.97 |
| Fujian | 0.56 | 0.36 | 0.12 | 0.71 | 0.74 | 0.75 |
| Jiangxi | 0.53 | 0.72 | 0.18 | 0.68 | 0.56 | 0.87 |
| Shandong | 0.56 | 0.29 | 0.66 | 0.65 | 0.8 | 0.39 |
| Henan | 0.51 | 0.37 | 0.25 | 0.48 | 0.63 | 0.8 |
| Hubei | 0.57 | 0.73 | 0.74 | 0.56 | 0.68 | 0.9 |
| Hunan | 0.52 | 0.5 | 0.51 | 0.6 | 0.6 | 0.57 |
| Guangdong | 0.99 | 0.89 | 0.77 | 0.99 | 0.94 | 0.74 |
| Guangxi | 0.08 | 0.34 | 0.09 | 0.06 | 0.15 | 0.83 |
| Hainan | 0.05 | 0.32 | 0.05 | 0.15 | 0.12 | 0.4 |
| Chongqing | 0.49 | 0.42 | 0.36 | 0.57 | 0.34 | 0.18 |
| Sichuan | 0.56 | 0.51 | 0.7 | 0.64 | 0.52 | 0.89 |
| Guizhou | 0.13 | 0.74 | 0.31 | 0.3 | 0.12 | 0.81 |
| Yunnan | 0.07 | 0.3 | 0.13 | 0.08 | 0.07 | 0.76 |
| Shaanxi | 0.49 | 0.5 | 0.73 | 0.6 | 0.46 | 0.85 |
| Gansu | 0.05 | 0.32 | 0.34 | 0.07 | 0.06 | 0.89 |
| Qinghai | 0.05 | 0.57 | 0.12 | 0.06 | 0.07 | 0.49 |
| Ningxia | 0.05 | 0.85 | 0.05 | 0.17 | 0.1 | 0.34 |
| Xinjiang | 0.05 | 0.47 | 0.05 | 0.04 | 0.13 | 0.93 |
Appendix B
Table A2.
All results of the sufficiency analysis.
| Configurations | Raw Coverage | Unique Coverage | Consistency | |
|---|---|---|---|---|
| ICHI | ||||
| Complex solution | TM * TTA * ED *~ER | 0.561 | 0.146 | 0.938 |
| GTC * TTA * ED * ER | 0.702 | 0.287 | 0.969 | |
| solution coverage: 0.848 solution consistency: 0.938 | ||||
| Parsimonious solution | GTC * TTA | 0.855 | 0.006 | 0.890 |
| TM * TTA | 0.821 | 0.058 | 0.908 | |
| GTC * ED | 0.850 | 0.008 | 0.836 | |
| solution coverage: 0.921 solution consistency: 0.792 | ||||
| Intermediate solution | TM * TTA * ED *~ER | 0.561 | 0.146 | 0.938 |
| GTC * TTA * ED * ER | 0.702 | 0.287 | 0.969 | |
| solution coverage: 0.848 solution consistency: 0.938 | ||||
| ~ICHI | ||||
| Complex solution | ~TM *~TTA *~ED | 0.719 | 0.160 | 1 |
| ~GTC *~TM *~ED *~ER | 0.413 | 0.007 | 0.985 | |
| ~GTC *TM *~TTA *~ER | 0.290 | 0.013 | 0.998 | |
| ~GTC *~TM *~TTA * ER | 0.457 | 0.008 | 0.997 | |
| solution coverage: 0.758 solution consistency: 0.989 | ||||
| Parsimonious solution | ~TTA | 0.895 | 0.435 | 0.979 |
| ~TM *~ER | 0.486 | 0.026 | 0.948 | |
| solution coverage: 0.921 solution consistency: 0.953 | ||||
| Intermediate solution | ~TM *~TTA *~ED | 0.719 | 0.160 | 1 |
| ~GTC *~TM *~ED *~ER | 0.413 | 0.007 | 0.985 | |
| ~GTC *TM *~TTA *~ER | 0.290 | 0.013 | 0.998 | |
| ~GTC *~TM *~TTA * ER | 0.457 | 0.008 | 0.997 | |
| solution coverage: 0.758 solution consistency: 0.989 | ||||
Note: In this study, * means the interaction among condition variables.
References
- Chen, X.; Liu, X.; Zhu, Q. Comparative analysis of total factor productivity in China’s high-tech industries. Technol. Forecast. Soc. Chang. 2022, 175, 1–14. [Google Scholar] [CrossRef]
- Yuan, S.; Yu, L.; Zhong, C.; Chen, Y. Does the innovation policy promote innovation quantity or innovation quality? China Soft Sci. 2020, 3, 32–45. [Google Scholar]
- Liang, Z.; Xu, H.; Hu, D. The conditional configuration of stagnation in the value chain upgrading of China’s high-tech industry: A qualitative comparative analysis based on 19 sub-industries. Sci. Technol. Prog. Policy 2022, 39, 72–80. [Google Scholar]
- Holling, C.S. Resilience and stability of ecological systems. Annu. Rev. Ecol. Syst. 1973, 4, 1–23. [Google Scholar] [CrossRef]
- Walker, B.; Gunderson, L.; Kinzig, A.; Folke, C.; Carpenter, S.; Schultz, L. A handful of heuristics and some propositions for understanding resilience in social-ecological systems. Ecol. Soc. 2006, 11, 709–723. [Google Scholar] [CrossRef]
- Meerow, S.; Newell, J.P.; Stults, M. Defining urban resilience: A review. Landsc. Urban Plan. 2016, 147, 38–49. [Google Scholar] [CrossRef]
- Martin, R.; Sunley, P. On the notion of regional economic resilience: Conceptualization and explanation. J. Econ. Geogr. 2014, 15, 1–42. [Google Scholar] [CrossRef]
- Martin, R.; Sunley, P.; Gardiner, B.; Tyler, P. How Regions React to Recessions: Resilience and the Role of Economic Structure. Reg. Stud. 2016, 50, 561–585. [Google Scholar] [CrossRef]
- Liu, H.; Lu, C. The impact of innovation ecosystem resilience on high-tech economic development. Forum Sci. Technol. China 2023, 321, 48–57. [Google Scholar]
- Wu, C.; Tan, Q. The influence of industrial related variety on regional economic resilience: An explanation from innovation ecosystem symbiosis. Sci. Technol. Prog. Policy 2023, 40, 72–80. [Google Scholar]
- Xie, Y.; Chen, R. Innovation failure, failure recovery and continuous innovation behavior of the innovation team: The moderating effect of team innovation passion. Sci. Res. Manag. 2020, 43, 63–71. [Google Scholar]
- Hu, J.; Yu, L. Research on the influence mechanism and characteristics of innovation resilience on high-tech industry innovation. Sci. Technol. Prog. Policy 2022, 39, 49–59. [Google Scholar]
- Du, Y.; Jia, L. Configuration perspective and qualitative comparative analysis: A new way of management research. J. Manag. World 2017, 6, 155–167. [Google Scholar]
- Xiao, R.; Chen, Z.; Qian, L. China’s high-tech manufacturing industries’ innovation efficiency: Technology heterogeneity perspective. J. Manag. Sci. 2018, 31, 48–68. [Google Scholar]
- Gu, Y.; Wang, Z.; Guo, T.; Chen, H. The configuration effect of sci-tech financial investment on innovation performance of high-tech industry: A fuzzy-set QCA approach. Sci. Technol. Prog. Policy 2023, 40, 60–68. [Google Scholar]
- Hu, J.; Yu, L.; Hong, J. Research on the impact of digital economy on high-tech industry under double cycle. Stud. Sci. Sci. 2022, 40, 2173–2186. [Google Scholar]
- Ren, J.; Zhao, R.; Ren, J. Digital finance, high-tech industrial agglomeration and regional innovation performance. Stat. Decis. 2023, 39, 86–91. [Google Scholar]
- Li, S.; Xu, M.; Lin, Z. Research on the impact of international knowledge spillovers on the innovation performance of high-tech industries under the effection of R&D human capital. Chin. J. Manag. 2021, 18, 1354–1362. [Google Scholar]
- Han, B. FDI and the efficiency of high-tech industries: The mediating effect of technological innovation and market competition. Soc. Sci. 2022, 2, 88–97. [Google Scholar]
- Ren, Y.; Wang, C. Empirical study on impact of urbanization on regional green economic efficiency in China. Technol. Econ. 2017, 36, 72–78. [Google Scholar]
- Ragin, C.C.; Fiss, P.C. Net Effects Analysis versus Configurational Analysis: An Empirical Demonstration. In Redesining Social Inquiry: Fuzzy Set and Beyond; Ragin, C.C., Ed.; University of Chicago Press: Chicago, IL, USA, 2008; pp. 190–212. [Google Scholar]
- Fiss, P.C. A Set-Theoretic Approach to Organizational Configurations. Acad. Manag. Rev. 2007, 32, 1180–1198. [Google Scholar] [CrossRef]
- Edin, M. State capacity and local agent control in China: CCP cadre management from a township perspective. China Q. 2003, 173, 35–52. [Google Scholar] [CrossRef]
- Ma, L. Diffusion and assimilation of government microblogging: Evidence from Chinese cities. Public Manag. Rev. 2014, 16, 274–295. [Google Scholar] [CrossRef]
- Yu, J.; Zhou, L.; Zhu, G. Strategic interaction in political competition: Evidence from spatial effects across Chinese cities. Reg. Sci. Urban Econ. 2016, 57, 23–37. [Google Scholar] [CrossRef]
- Zhou, L. Governing China’s local officials: An analysis of promotion tournament model. Econ. Res. J. 2007, 7, 35–71. [Google Scholar]
- Liu, J. An analysis on Chinese political tournament. J. Public Manag. 2008, 3, 29–34. [Google Scholar]
- Yu, X. Official promotion tournament: Political logic of economic growth-Based on sorting and analysis of the relevant literature. East China Econ. Manag. 2016, 30, 88–95. [Google Scholar]
- Bian, Y.; Wu, L.; Bai, J. Economic Growth, S&T innovation and promotion: The evidence from China’s provincial governments. Sci. Res. Manag. 2019, 40, 53–61. [Google Scholar]
- Ni, J.; Li, H. Market segmentation and high-tech industries’ development: From the perspective of institutional logics. Stud. Sci. Sci. 2021, 39, 1584–1592. [Google Scholar]
- Cheng, G.; Hou, L. Research on local government competition models and regional technological innovation from the perspective of fiscal decentralization. Mod. Econ. Res. 2021, 6, 28–37. [Google Scholar]
- Wan, Q.; Yuan, L.; Wang, B. R&D factor flow and high-tech industries’ innovation ability. Forum Sci. Technol. China 2021, 297, 106–116. [Google Scholar]
- Seok, B.I.; Han, M.S. Effects of network utilization for enterprise technology trading activities on technology commercialization capacity and innovation performance. Glob. Bus. Adm. Rev. 2018, 15, 69–89. [Google Scholar] [CrossRef]
- Zheng, F.; Jiao, H.; Cai, H. Reappraisal of outbound open innovation under the policy of China’s ‘Market for Technology’. Technol. Anal. Strateg. Manag. 2018, 30, 1–14. [Google Scholar] [CrossRef]
- Zhou, J.; Xi, Y.; Zhou, Y. Regional technology market, government support and technological innovation. China Soft Sci. 2021, 371, 80–90. [Google Scholar]
- Zhao, Q.; Liu, Z.; Cui, H. Internet development, technology market and technological innovation efficiency of high-tech industry of China: Empirical analysis based on SBM-Entropy-Tobit model. J. Technol. Econ. 2022, 41, 1–10. [Google Scholar]
- Shi, J.; Lai, W. Incentive factors of talent agglomeration: A case of high-tech innovation in China. Int. J. Innov. Sci. 2019, 11, 561–582. [Google Scholar] [CrossRef]
- Wan, Q.; Yuan, L.; Tan, Z. The influence of the sci-tech talents agglomeration, market competition and interaction on innovation performance of high-tech industry. Soft Sci. 2021, 35, 7–12. [Google Scholar]
- Lucas, R.E. On the mechanics of economic development. J. Monet. Econ. 1988, 22, 3–42. [Google Scholar] [CrossRef]
- Krugman, P.R. Increasing returns and economic geography. J. Political Econ. Hist. 1991, 58, 659–683. [Google Scholar] [CrossRef]
- Pei, L. Interactive relationships between talents agglomeration and high-tech industry development. Stud. Sci. Sci. 2018, 36, 813–824. [Google Scholar]
- Li, L.; Liu, H. A study on the impact of technology talent agglomeration on regional innovation ability: An empirical analysis based on the Chengdu Chongqing double city economic circle. West. China 2022, 2, 72–83. [Google Scholar]
- Modica, M.; Reggiani, A. Spatial economic resilience: Overview and perspectives. Netw. Spat. Econ. 2015, 15, 211–233. [Google Scholar] [CrossRef]
- Martin, R. Roepke lecture in economic geography-rethinking regional path dependence: Beyond lock-in to evolution. Econ. Geogr. 2015, 86, 1–27. [Google Scholar] [CrossRef]
- Filippetti, A.; Gkotsis, P.; Vezzani, A.; Zinilli, A. Are innovative regions more resilient? Evidence from Europe in 2008–2016. Econ. Politica 2020, 37, 807–832. [Google Scholar] [CrossRef]
- Chen, C.; Ye, A. Digital economy, innovation capacity and regional economic resilience. Stat. Decis. 2021, 37, 10–15. [Google Scholar]
- Wang, P.; Zhong, Y.; Yan, Y. Interactive analysis of the efficiency of technological innovation and regional economic resilience: The empirical evidence of the Pearl River Delta. Sci. Technol. Prog. Policy 2022, 39, 48–58. [Google Scholar]
- Caro, P.D. Recessions, recoveries and regional resilience: Evidence on Italy. Camb. J. Reg. Econ. Soc. 2015, 8, 273–291. [Google Scholar] [CrossRef]
- Ito, B.; Yashiro, N.; Xu, Z.; Chen, X.; Wakasugi, R. How do Chinese industries benefit from FDI spillovers? China Econ. Rev. 2012, 23, 342–356. [Google Scholar] [CrossRef]
- Tang, Y.; Zhang, K.H. Absorptive capacity and benefits from FDI: Evidence from Chinese manufactured exports. Int. Rev. Econ. Financ. 2016, 42, 423–429. [Google Scholar] [CrossRef]
- Chen, J.; Zhou, Z. The effects of FDI on innovative entrepreneurship: A regional-level study. Technol. Forecast. Soc. Chang. 2023, 186, 122159. [Google Scholar] [CrossRef]
- Wang, L.; Yu, J.; Shao, Y. Foreign direct investment and regional green total factor efficiency. Financ. Trade Res. 2019, 10, 17–30. [Google Scholar]
- Shao, H.; Lu, J.; Yang, J. Influences of FDI on productivity of domestic firms: Empirical evidence from China’s high-tech industry. Int. Bus. 2015, 4, 36–44. [Google Scholar]
- Görg, H.; Greenaway, D. Much Ado about Nothing? Do Domestic Firms Really Benefit from Foreign Direct Investment? World Bank Res. Obs. 2004, 19, 171–197. [Google Scholar] [CrossRef]
- Ren, S.; Zuo, H. The impact of bidirectional FDI and regional innovation efficiency on China’s green total factor productivity: An empirical analysis based on provincial panel data. Stat. Manag. 2021, 36, 42–46. [Google Scholar]
- Cheng, S.; Ma, W.; Luo, L.; Li, Y. Can the development of digital economy improve the quality of regional investment?—Empirical evidence from Chinese cities. Econ. Anal. Policy 2023, 80, 214–221. [Google Scholar] [CrossRef]
- Guo, B.; Wang, Y.; Zhang, H.; Liang, C.; Feng, Y.; Hu, F. Impact of the digital economy on high-quality urban economic development: Evidence from Chinese cities. Econ. Model. 2023, 120, 106194. [Google Scholar] [CrossRef]
- Yang, B. Digital economy, intellectual property protection and innovation efficiency of high-tech industry. J. Tech. Econ. Manag. 2023, 7, 6–11. [Google Scholar]
- Yuan, H.; Gao, B. The development of digital economy and the improvement of high-tech industry innovation efficiency: Empirical test based on China’s provincial panel data. Sci. Technol. Prog. Policy 2022, 39, 61–71. [Google Scholar]
- Feng, X.; Wang, F. Research on performance improvement path of high-tech industry innovation efficiency from the perspective of configuration: A fuzzy-set qualitative comparative analysis. Sci. Technol. Prog. Policy 2021, 38, 54–60. [Google Scholar]
- Ren, B. Theoretical interpretation and practical orientation of China’s economy from high-speed growth to high quality development in New Era. Acad. Mon. 2018, 50, 66–74. [Google Scholar]
- Tang, J.; Ni, Y.; Zhang, Y. Urbanization, science and education policy and technological innovation capability: An empirical analysis at the provincial level in China. Technol. Innov. Manag. 2021, 42, 144–153. [Google Scholar]
- Hu, X.; Chen, M. Research on the synergistic effect of manufacturing agglomeration and urbanization development for urban green total factor productivity: Empirical evidence from 261 prefecture-level cities and above in China. Sci. Technol. Prog. Policy 2019, 36, 70–79. [Google Scholar]
- Zhang, M.; Du, Y. Qualitative comparative analysis in management and organization research: Position, tactics and directions. Chin. J. Manag. 2019, 9, 1312–1323. [Google Scholar]
- Peng, X.; Zhang, Z. Spatial difference and dynamic evolution of regional innovation system efficiency of China. Sci. Technol. Manag. Res. 2023, 14, 1–15. [Google Scholar]
- Luan, S. Impact of COVID-19 on China’s macro-economy and suggestions. China Mark. 2023, 2, 8–10. [Google Scholar]
- Acs, Z.J.; Anselin, L.; ßVarga, A. Patents and innovation counts as measures of regional production of new knowledge. Res. Policy 2002, 31, 1069–1085. [Google Scholar] [CrossRef]
- Liu, G.; Liu, J. FDI knowledge spillover, absorptive capacity and innovation output of high-tech industries: An empirical analysis based on threshold effect model. Technol. Innov. Manag. 2022, 43, 649–660. [Google Scholar]
- Hong, Y.; Chen, L.; Cao, Y. Does local government competition hinder the improvement of local government debt performance? J. Financ. Res. 2020, 4, 70–90. [Google Scholar]
- Yu, L.; Wang, B. Research on the influence of technology market on collaborative innovation under the theory of market design: Take high-tech enterprises as an example. Sci. Res. Manag. 2022, 43, 144–153. [Google Scholar]
Figure 1.
Configuration framework for the innovation capability of the high-tech industry.

Figure 2.
The analysis process for carrying out the fsQCA approach.
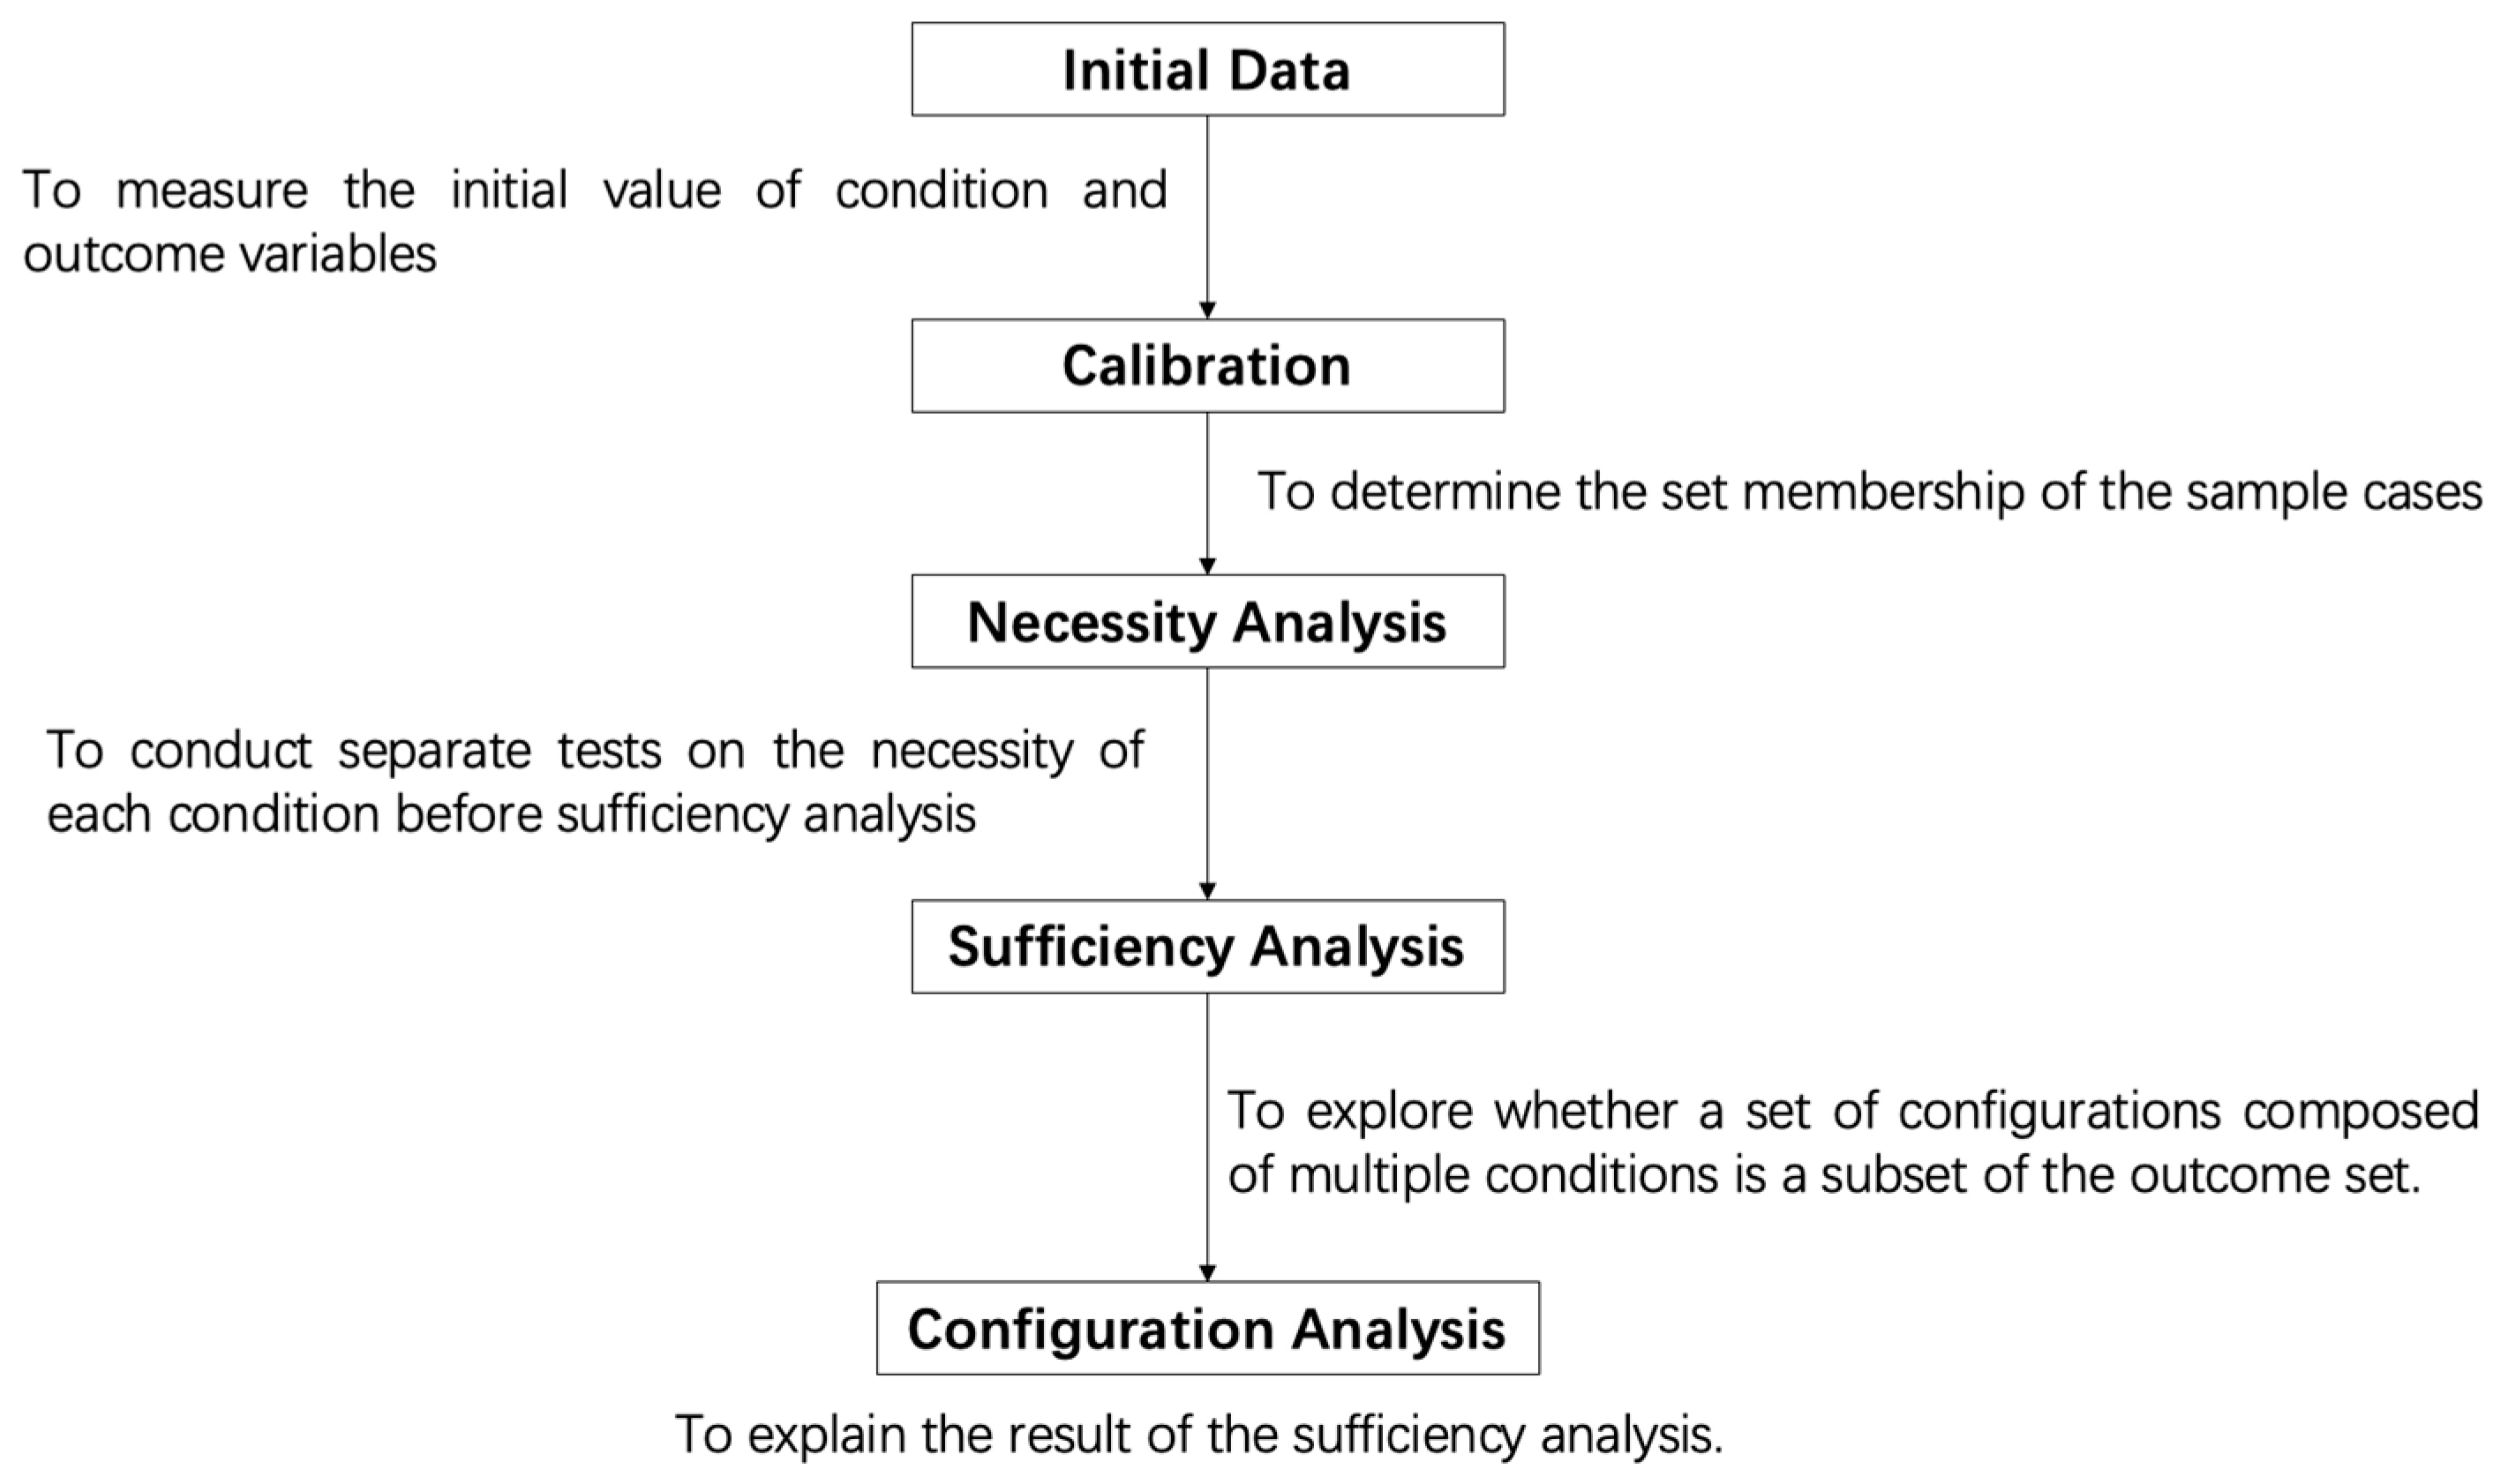
Table 1.
Outcome and condition variables.
| Variable Type | Indicators, Year | Abbreviation |
|---|---|---|
| Outcomes | Innovation Capability of the High-Tech Industry, 2019 | ICHI |
| Conditions | Government Technology Competition, 2018 | GTC |
| Technology Market, 2018 | TM | |
| Technology Talent Agglomeration, 2018 | TTA | |
| Economic Resilience, 2018 | ER | |
| Economic Development, 2018 | ED |
Table 2.
Calibration of outcomes and conditions.
| Outcomes and Conditions | Fully in | Crossover | Fully Out |
|---|---|---|---|
| ICHI | 85,986.950 | 4053.500 | 131.400 |
| GTC | 2.334 | 0.612 | 0.321 |
| TM | 29,820,013.000 | 2,321,684.500 | 55,820.600 |
| TTA | 0.431 | 0.104 | 0.013 |
| ED | 2.027 | −0.218 | −1.128 |
| ER | 1.126 | 0.194 | −2.514 |
Table 3.
Results of necessity analysis.
| Conditions | ICHI | ~ICHI |
|---|---|---|
| Consistency | Consistency | |
| GTC | 0.864 | 0.593 |
| ~GTC | 0.650 | 0.695 |
| TM | 0.852 | 0.472 |
| ~TM | 0.677 | 0.825 |
| TTA | 0.967 | 0.446 |
| ~TTA | 0.641 | 0.895 |
| ED | 0.954 | 0.453 |
| ~ED | 0.560 | 0.836 |
| ER | 0.789 | 0.649 |
| ~ER | 0.621 | 0.581 |
Note: “~” represents not in set operation; e.g., ICHI means the high innovation capability of the high-tech industry, while ~ICHI denotes the low innovation capability of the high-tech industry.
Table 4.
Results of sufficiency analysis.
| Conditions | ICHI | ~ICHI | ||||
|---|---|---|---|---|---|---|
| H1 | H2 | L1 | L2 | L3 | L4 | |
| GTC | ● |  | | | ||
| TM | ● | ⊗ | ⊗ | 🞄 | ⊗ | |
| TTA | ● | ● | ⊗ | ⊗ | ⊗ | |
| ED | ● | ● | | | ||
| ER | | 🞄 | ⊗ | ⊗ | 🞄 | |
| Raw coverage | 0.561 | 0.702 | 0.719 | 0.413 | 0.290 | 0.457 |
| Unique coverage | 0.146 | 0.287 | 0.160 | 0.007 | 0.013 | 0.008 |
| Consistency | 0.938 | 0.969 | 1 | 0.985 | 0.998 | 0.997 |
| Solution coverage | 0.848 | 0.758 | ||||
| Solution consistency | 0.938 | 0.989 | ||||
Note: “●” means the presence of the core condition; “⊗“ means the absence of the core condition; “🞄” means the presence of the edge condition; “![Systems 11 00531 i001]() ” means the absence of the edge condition; and blank either indicates the presence or absence of the condition.
” means the absence of the edge condition; and blank either indicates the presence or absence of the condition.
” means the absence of the edge condition; and blank either indicates the presence or absence of the condition.Disclaimer/Publisher’s Note: The statements, opinions and data contained in all publications are solely those of the individual author(s) and contributor(s) and not of MDPI and/or the editor(s). MDPI and/or the editor(s) disclaim responsibility for any injury to people or property resulting from any ideas, methods, instructions or products referred to in the content. |
© 2023 by the authors. Licensee MDPI, Basel, Switzerland. This article is an open access article distributed under the terms and conditions of the Creative Commons Attribution (CC BY) license (https://creativecommons.org/licenses/by/4.0/).
Share and Cite
MDPI and ACS Style
Huang, Z.; Hou, B. How Does Economic Resilience Enhance the Innovation Capability of the High-Tech Industry? Evidence from China. Systems 2023, 11, 531. https://doi.org/10.3390/systems11110531
AMA Style
Huang Z, Hou B. How Does Economic Resilience Enhance the Innovation Capability of the High-Tech Industry? Evidence from China. Systems. 2023; 11(11):531. https://doi.org/10.3390/systems11110531
Chicago/Turabian StyleHuang, Zhenyu, and Bowen Hou. 2023. "How Does Economic Resilience Enhance the Innovation Capability of the High-Tech Industry? Evidence from China" Systems 11, no. 11: 531. https://doi.org/10.3390/systems11110531
Note that from the first issue of 2016, this journal uses article numbers instead of page numbers. See further details here.