Article

Development of a Unity–VISSIM Co-Simulation Platform to Study Interactive Driving Behavior

Jiangsu Key Laboratory of Urban ITS, Jiangsu Province Collaborative Innovation Center of Modern Urban Traffic Technologies, School of Transportation, Southeast University, Nanjing 211189, China
*
Author to whom correspondence should be addressed.
Systems 2023, 11(6), 269; https://doi.org/10.3390/systems11060269
Submission received: 7 May 2023 / Revised: 22 May 2023 / Accepted: 24 May 2023 / Published: 25 May 2023

Abstract

:
This paper presents the system development of a co-simulation platform aimed at studying driving behavior with multiple participants. The objective of this study was to create an immersive and interactive environment where different driving scenarios could be simulated and driver behavior could be recorded and analyzed. The platform integrated the Unity game engine with the VISSIM microscopic traffic simulator to create a hybrid simulation environment that combined the advantages of both tools. A virtual reality massive multiplayer online (VRMMO) module was developed to capture the interactions of the participants during the simulation experiments. The external control devices of this co-simulation platform were calibrated using the empirical data of a Controller Area Network (CAN-BUS) from actual driving behaviors. The main contributions of this study are the demonstration of the Unity–VISSIM co-simulation platform in simulating interactive driver behavior and the potential for its use in various research areas, such as intelligent transportation systems, human factors, driving education, and traffic safety analyses. The platform could be a valuable tool for evaluating the effectiveness of collective intelligence countermeasures in improving traffic systems, with relatively lower costs and risks.

1. Introduction

Driving behavior is a complex phenomenon that has a significant impact on traffic safety, mobility, and energy consumption [1,2,3,4]. Understanding how drivers behave in different traffic scenarios is crucial for improving the design of transportation systems and developing effective driver assistance technologies. However, studying driving behavior in real-world settings, e.g., naturalistic driving experiments, is time-consuming and often expensive, and it may be difficult to control all the variables that affect this driving behavior [5]. In addition, due to technical and ethical reasons, real-world tests are often not applicable to new technologies or long-tailed cases, such as connected and autonomous vehicles, under real-world safety critical scenarios [6].
To overcome these challenges, researchers have increasingly turned to computer simulations to study driving behavior. Simulations offer a cost-effective and safe way of testing and evaluating driving scenarios while controlling all the relevant parameters [7]. They have merits over real-world tests in terms of their cost, safety, reproducibility, scalability, and flexibility [8]. However, traditional simulation tools may not provide the necessary levels of realism and interactivity needed to accurately model and analyze driver behavior [9]. Physics-based driving simulators could, to some extent, compensate for this realism issue by incorporating vehicle dynamics, but the problems of high construction and maintenance costs and limited participant numbers (usually for individual drivers only) still remain [10]. On the other hand, while the rapid technology advancements in game engines have provided enough power for realism visualizations and immersive interactivities, the underlying logic of the simulation cores inside these computer games is not designed for traffic engineering purposes [11]. Therefore, for transportation professionals, there is a need for research to bridge the gaps between game engines and traffic simulation software [12].
To address these limitations, a co-simulation platform that combines Unity, a popular game engine, and VISSIM, a widely used traffic simulation software, has been developed. This combination of Unity and VISSIM allows for a more realistic and immersive simulation environment that can better capture the complex interactions between drivers and their environments. This platform can also incorporate the latest developments in human–computer interaction (HCI) designs and virtual reality (VR) techniques to model driver behavior and evaluate the effectiveness of various driving assistance systems. In addition, a massive multiplayer online (MMO) server and user interface have been designed to capture the interactions of multiple drivers.
The rest of this paper is organized as follows: we first present a literature review on typical microscopic traffic simulation software, driving simulators, and the combined use of them. Then, we describe the methodology developments of a Unity–VISSIM co-simulation platform for studying interactive driving behavior, including the construction of a VRMMO environment, the system working flow, and the functional designs. This is followed by a discussion about the technical aspects of the platform, its capabilities and limitations, and the potential applications of this approach in future research.
Overall, our aim is to provide a useful resource for researchers interested in using co-simulation methods to study interactive driving behavior and to highlight the potential benefits of integrating Unity and VISSIM in this context.

2. Literature Review

2.1. Microscopic Traffic Simulators

Currently, the microscopic traffic simulation software which have high market shares and are commonly used in the scientific research of planning institutes and universities are VISSIM, SUMO, TransModeler, AIMSUN, TESS NG, and so on [13]. The following passage is a brief introduction to and comparison of several commonly used simulation software.
VISSIM is a microscopic traffic simulator developed by the German company PTV, which was launched into the market in 1992. It is a multi-modal microscopic simulation modeling tool that can analyze the lane-level operating state of urban mobilities under various traffic conditions, making it an effective tool for evaluating traffic engineering design and urban planning schemes. Meanwhile, VISSIM provides a Component Object Model (COM) interface for developers to conduct secondary development to read or modify relevant data, which is friendly for co-simulations. Over the past three decades, VISSIM has been widely adopted by researchers to study driving, cycling, and walking behaviors [14,15,16,17,18,19,20,21,22]. Meanwhile, it has been also combined and used with SSAM and MOVES, etc., to study traffic safety and traffic emission [23,24,25].
Developed by the German Aerospace Center and community users, SUMO has been freely available as an open-source software since 2001 [26]. SUMO is a microscopic and continuous multi-mode traffic simulation software that allows users to make changes to the program’s source code under an open-source license, in order to complete some of the system’s non-native functions [27]. SUMO and its integration with other simulation tools or interfaces (such as TraCI, OMNET++, NS-2, and NS-3) have been commonly used for research on traffic flow, traffic control, route selection, and vehicle communication [28,29,30,31,32].
TransModeler is a microscopic simulation platform developed by Caliper for the study of traffic planning, traffic management, and emergency evacuation, etc. As a complement to their macroscopic traffic simulation software TransCAD, it can display animations of traffic flow, traffic lights, and the overall operation of a traffic network [33,34,35,36,37]. TransModeler also supports being combined with GIS to process and manage spatial geographical data such as road networks, and it can also display traffic statuses on a GIS-T graphical interface. One of the major characteristics of TransModeler is that it supports the co-simulation functions of the macroscopic, mesoscopic, and microscopic levels at the same time, so users can make simultaneous observations about traffic conditions at the mesoscopic and macroscopic levels while observing microscopic traffic simulations.
AIMSUN is an interactive traffic simulation software developed by TSS in Spain. AIMSUN provides GETRAM Extensions to the external program interface for developers, so that these developers can change the simulation process by calling the data inside the software during the simulation [38]. It also integrates macroscopic, mesoscopic, and microscopic traffic models and has been used for traffic design evaluations, traffic emission estimations, and traffic control and management [39,40,41].
TESS NG was released in 2015, and its predecessor was the road traffic simulation system TESS developed under the leadership of Professor Jian Sun from Tongji University in 2006. TESS NG integrates features such as full-road scenario simulations, multi-mode traffic simulations, intelligent transportation system simulations, and visual evaluations. It provides APIs for large road network imports and signal control, etc. In addition, the software incorporates a human-like behavior model, high-density traffic flow model, and the interaction behaviors of mixed traffic flow (including non-motorized vehicles) in a shared space, which makes it unique in adapting to China’s high-density traffic flow environment [42,43,44].
The comparison results of these simulation platforms in terms of developer, operating system, simulation level, display mode, open-source status, API availability, road network import and traffic control module supports were shown in Table 1.
Among these microscopic traffic simulators, VISSIM has had the highest market occupancy for many years. After version updates, VISSIM 2021 has been equipped with verified and validated traffic flow models and new interface functions [16,17,22]. However, despite its relatively good visualization performance in comparison to similar software, its 3D effects have a high fidelity when compared with game engines such as Unity and Unreal. To combine VISSIM’s advantages in more accurate microscopic simulations and Unity’s immersive and interactive environment, this study has developed a co-simulation platform by using VISSIM’s COM interface to establish a connection between the two software through Unity script.

2.2. Driving Simulators

A driving simulator combines vehicle mechanics with VR technology to create a virtual driving environment for training and education purposes. It allows users to interact with the virtual environment and improve their driving skills safely and efficiently. Driving simulators offer benefits such as reduced costs in terms of environmental pollution, fuel consumption, and vehicle wear and tear. The most common application of driving simulators is in automobile driving. These simulators include visual systems, operating sensors, data acquisition cards, and components resembling those of a real vehicle, such as a fixed base, steering wheel, clutch, throttle, and brake [45,46,47,48].
Based on their system components and design purpose, driving simulators can generally be divided into physics-based driving simulators and VR-based driving simulators [5]. The choice between the two depends on the specific research or training objectives. Physics-based simulators are typically used for studying vehicle dynamics and control, while virtual-reality-based simulators are more suitable for training and researching driver behavior and perception.

2.2.1. Physics-Based Driving Simulators

Physics-based driving simulators use mathematical models to simulate vehicle dynamics, traffic flow, and environmental factors [49,50,51,52,53]. They provide a realistic driving experience with components such as a steering wheel, pedals, and display screen. There are three types of physics-based simulators: non-interactive, interactive, and motion sensing. Non-interactive simulators focus on familiarizing users with real operating equipment and are typically used for teaching driving operations. Interactive simulators have a dynamic visual display that changes with driving operations and require the real-time collection of the user control data. Motion-based simulators add hydraulic servo devices to create a sense of motion for the user.

2.2.2. VR-Based Driving Simulators

VR-based driving simulators aim to provide an immersive experience in a 3D virtual environment. They combine physics-based models and graphics engines. VR simulators can be classified into desktop-based VR, projector-based VR, and head mounted display (HMD)-based VR [54]. Desktop-based VR renders a 3D virtual world on a regular display, allowing users to interact using external devices such as a mouse and keyboard [55]. Projector-based VR uses cameras to capture a user’s image and replaces the real environment with a virtual one on a screen [49,56]. HMD-based VR provides full immersion by isolating users from the outside world, using stereo vision and interaction equipment such as data gloves [57].

2.3. Co-Simulation Platforms

Co-simulation platforms combine traffic simulation software and VR engines to overcome limitations in rendering 3D environments. They have been widely explored in various traffic-related fields. For instance, Erath et al. integrated VISSIM, Unity, and Esri CityEngine to enhance the 3D modeling in traffic research and planning [58]. Liao et al. combined SUMO and Unity to verify a ramp-merging strategy using game theory [59]. Li et al. tested pedestrian path choice behavior in a virtual environment by importing a simulation model into desktop-level virtual reality [60].
Researchers have also added external devices to enhance participant immersion and driving fidelity. Bogacz et al. investigated the risk perception in bicycle driving by adding an HMD and bicycle simulator to the Unity–VISSIM platform [61]. Morra et al. collected data using a skin conductance testing device on a joint simulation platform [62]. Perez et al. developed the AR-PED platform, which combines PARAMICS and Unity, integrates steering wheels and brakes, and uses HMDs to simulate pedestrians [63].
While co-simulation platforms have been used to study single autonomous vehicles and pedestrian–vehicle interactions, there is a lack of research on multi-player online driving [64,65]. Existing platforms often focus on simulating driving for a single vehicle and pedestrian simulation platforms lack support from traffic simulation software. Therefore, further exploration is needed to develop multi-player online interactive driving platforms that integrate both microscopic traffic simulation software and VR engines.

3. Methodology

This paper is based on the Unity VR development platform and designs a system that supports VR massive multiplayer online (MMO) interactive experiments. The system is developed by combining the VISSIM microscopic traffic simulation software with a digital interface for VR experimentation and traffic simulation software. The result is a traffic simulation system that supports multi-user interaction and vehicle driving takeover, which can be used to test and validate multi-mode microscopic traffic simulation models.
The simulation system consists of microscopic traffic simulation, VR scenes, multiplayer online modules, user vehicles, and non-user vehicles, as shown in Figure 1.
  • Microscopic traffic simulation: considering that different factors have different effects in different traffic scenarios, typical traffic scenarios, such as pedestrian and non-motorized vehicle crossing and pedestrian–vehicle interactions at intersections, are constructed in VISSIM, and the richness of the various elements in the scenario is as close to reality as possible.
  • VR scenes: after constructing a traffic scenario in VISSIM, the microscopic simulation data in VISSIM are transmitted to Unity3D through the COM interface. Firstly, the static data of the road network in the simulation scene, such as the number of roads and the length of each road, are obtained with Unity3D’s scripts, and the 3D model in VISSIM is optimized. Then, the simulation running data are imported into Unity3D and the traffic scenario in VISSIM is restored 1:1 in Unity3D.
  • Multiplayer online modules: the user unit vehicle is used as a prefab in Unity3D’s communication function. After a user connects to the network and enters the simulation system, the corresponding unit can be generated in the scene according to the user’s own needs. During multiplayer online, users can achieve basic interactions such as field of view and physical collisions with each other. These users can also interact with various elements in the environment or non-user units in real-time.
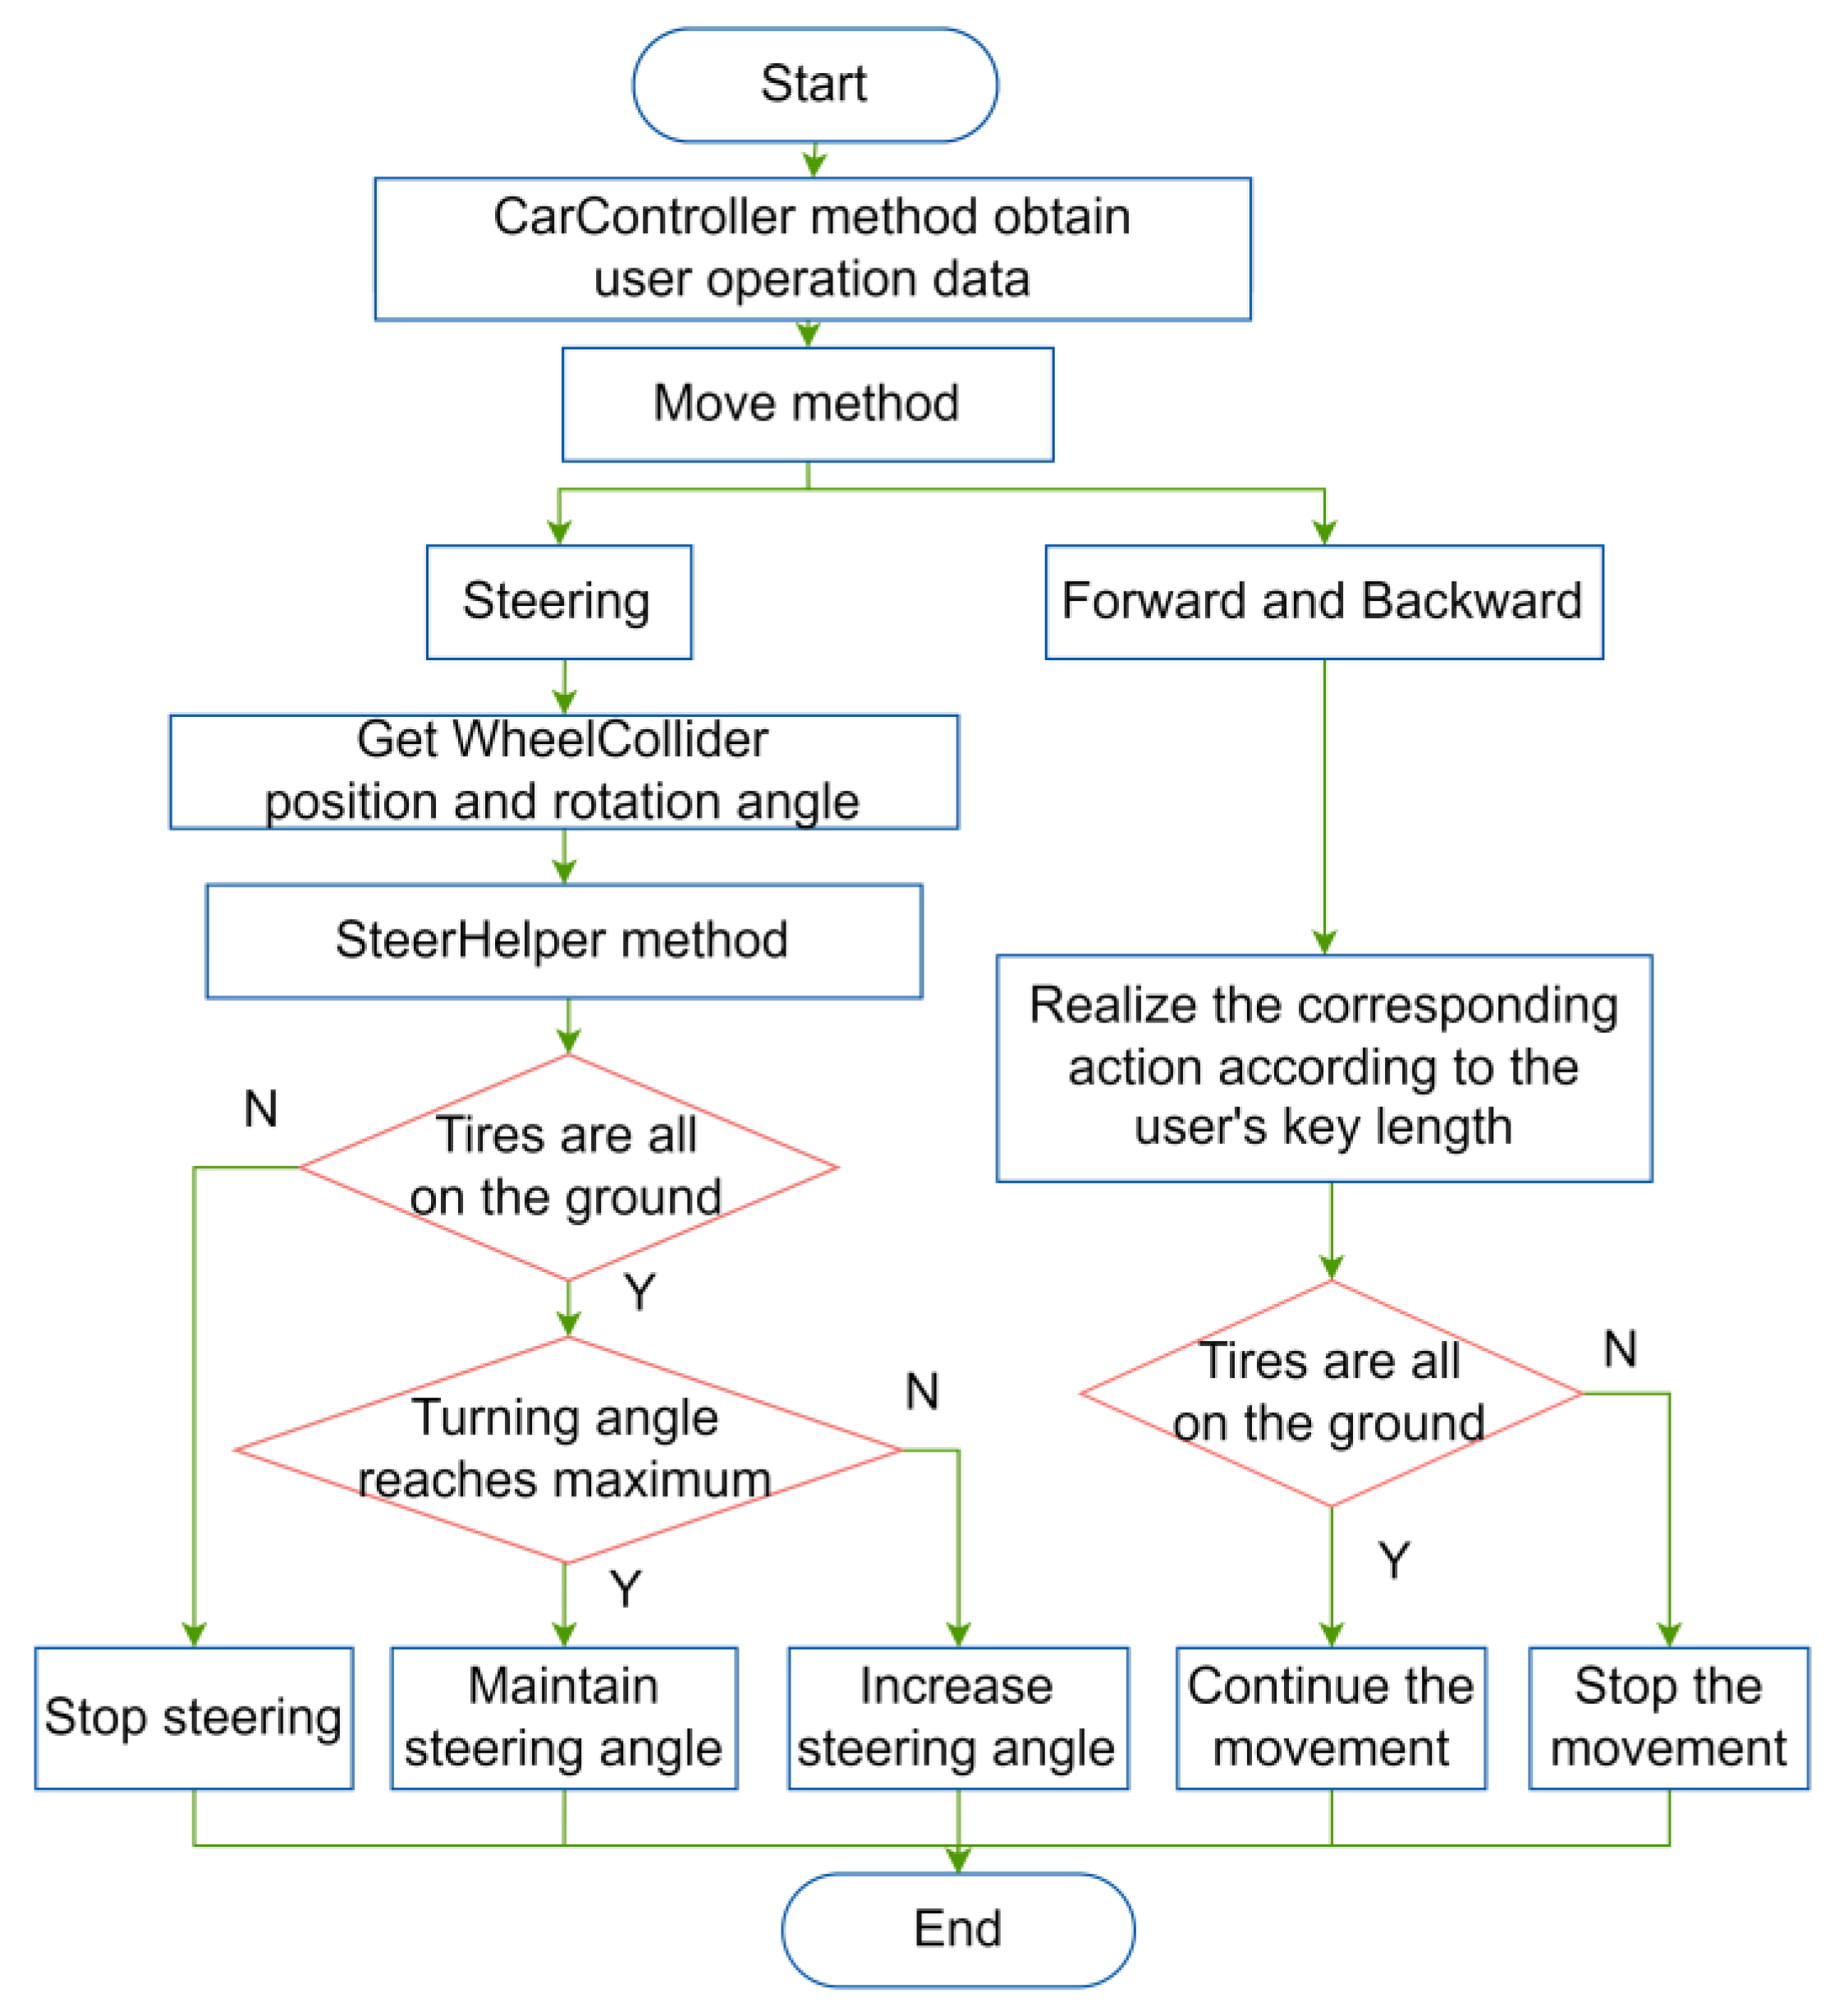
  • User vehicles: users are responsible for controlling the behavior of the vehicles in the simulation scene. These vehicles can perform basic functions such as starting, braking, turning, and accelerating/decelerating. The relevant parameters of each function are calibrated using real driving data to recreate a user’s driving experience.
  • Non-user vehicles: to achieve the real-time responses of the non-user vehicles to the user vehicles, the behavior of the user-controlled vehicles in Unity3D is transmitted to the simulation running scene in VISSIM, where default models such as the Wiedemann74 classic following model are used for calculation. The response results in VISSIM are transmitted back to Unity3D in data form, presenting the changes in the scene caused by the user’s behavior in the system and on the user’s screen, thus achieving a real-time interaction function.
During the system operation, each user needs to enter the software generated by Unity3D. The software obtains the corresponding microscopic simulation scene data according to the script, and the optimized VR scene is loaded on a user’s screen. At the same time, non-user units begin to run. After the user connects to the server, the user and system backend screens simultaneously generate the user’s vehicle, and the user can begin to control the vehicle behavior, thus realizing a microscopic traffic simulation system with online multiplayer interaction.

3.1. VRMMO Environment

3.1.1. Static Components

The static elements of the scene mainly consist of fixed 3D models that do not change with simulation time, including vehicle models and road models, etc. Due to the insufficient detail and oversimplification of 3D models in VISSIM, all the models in the scene are completed in Unity.
  • Vehicle model
Before modeling the vehicle model in Unity, the key data of the vehicle need to be obtained from the VISSIM COM interface. It should be noted that the COM interface can output the length of the vehicle, but lacks width data. Therefore, based on the type data of the available vehicles, the default data are browsed in VISSIM to obtain the width data of different types of vehicles. After obtaining the basic data on the vehicle model, they are written in Unity’s C# script. For the skeleton, material, and other properties of the vehicle model, high-definition models imported from 3DS MAX are used. For the different vehicles generated in each vehicle type during the simulation process, only the color and length need to be changed with the script.
  • Road network
The width of each road varies with each lane of a road. After passing the road-related properties from the script, a cube object is created in Unity based on the three-dimensional model characteristics of each road, with its coordinates generated from the center point coordinates in the interface. At the same time, the road type is identified and attributes such as length, width, and thickness are assigned to it.
  • Environmental object model
Given the shortcomings of the low detail and non-standard formats in VISSIM’s default models, the 3D models in Unity are imported from 3DS MAX. The models of the various environmental objects after they have been built are shown in Figure 2.

3.1.2. Dynamics Components

  • Initial simulation parameter
Before starting the simulation, the simulation-related parameters are set in VISSIM, including the simulation time length, simulation precision, and simulation random seed. The Update function in Unity script can run the data in the script at a frequency of 50 times per second, which is mostly used for updating the dynamic elements of the screen. Therefore, the simulation precision in VISSIM is set to the maximum of 10 steps/second. However, since the update frequency of Unity per second is not synchronized with the simulation step length in VISSIM, and the output data volume of each simulation step is different, it is easy to cause the data reading speed in VISSIM to not be linearly related to time, resulting in the non-smooth movement of the objects in the virtual scene. Therefore, the RunSingleStep method of the ISimulation interface in the COM interface is called into the Unity script to start or continue the simulation running of a simulation step length. This ensures that all the data of a simulation step length in the interface are imported into the script before starting the next simulation step, and the screen update speed in Unity will be synchronized with VISSIM, as shown in Figure 3.
  • Signal control data
In VISSIM, the signal control unit contains various signal lamp groups, and each signal lamp group can set the colors of the lights, end time, and duration, etc. When setting the signal lamp head on the road section, it is necessary to select the signal lamp group in the signal control unit and the signal control unit to which the signal lamp head belongs. The entire signal control part is implemented in the simulation running logic as shown in Figure 4.
  • Non-user vehicle trajectory data
Like with vehicle model data, to display the dynamic changes in the vehicles in Unity, only the ID and current coordinates of each vehicle, i.e., the ID and POINT keywords in the AttValue object, need to be obtained. As VISSIM’s maximum simulation accuracy is only 10 steps/second, there is already lag in the 3D running effect in VISSIM. Therefore, in Unity, in order to present smoother vehicle movement, the Transform.Translate function in the Unity script is used. The parameters required for this function are the target point coordinates and movement speed (m/s), achieving a uniform speed movement towards the target point. By inputting the vehicle’s coordinates for each simulation step and the interval time between two simulation steps, the animation between the two simulation steps can be increased, achieving smooth vehicle movement.

3.1.3. MMO Components

Real-time interaction between the user vehicle (Player) and non-user vehicles (NPC) in the virtual traffic scene is critical to enhancing the driving experience. The feedback from the NPC to the Player needs to be implemented in VISSIM, so the running data of the Player in Unity should be imported into VISSIM in real-time and the NPC’s following and lane-changing behavior should be calculated by VISSIM’s default model. The position information of the NPC affected by the Player is then passed to Unity through the interface and script to achieve a real-time interactive visualization.
As mentioned before, how to render the NPC in Unity has been explained, so here we will explain how to import the data of the Player into VISSIM. Since the movement trajectory of the Player is influenced by subjective and random factors, this movement trajectory is not as standardized as the vehicles in VISSIM. Therefore, it is necessary to judge the location of the user in the road network. After calculating the relevant data about the Player’s location, it is necessary to call the AddVehicleAtLinkCoordinate and MoveToLinkCoordinate methods of the VehicleObjects in the COM interface. The former can add a vehicle in VISSIM at a specific location on a specific lane of a specific road section, located at a certain distance from the starting point of the road section, which is affected by its adjacent vehicles; the latter can place an existing vehicle object in the road network at a specific location on a specific lane of a specific road section, located at a certain distance from the starting point of the road section. If the user has just entered the virtual scene, the former is called; if the user is running in the virtual scene, the latter is called. The overall implementation process of this real-time interaction is shown in Figure 5.

3.2. System Working Flow

As shown in Figure 6, when the system starts, the static data from VISSIM, such as the road network, buildings, and trees, etc., are first obtained through the Unity script. At the same time, a static virtual simulation scene is built in Unity. Then, the simulation function of VISSIM is called to transmit the changes in the vehicles and traffic lights during the simulation to the virtual simulation scene in real-time. At this point, a user can join the scene through the indicators in the UI interface. The system assigns the user’s vehicle generation position based on their ID and provides the vehicle with dynamic performance, physical collision, and visual feedback. Users can control the vehicle using the keyboard and mouse. At the same time, the user’s vehicle data are transmitted in real-time to the script, which creates and updates the corresponding user’s vehicle in VISSIM through the interface. Based on the behavior of the user’s vehicle, VISSIM calculates the follow-up and lane-changing behaviors of the non-user vehicles and synchronously transmits the feedback of these non-user vehicles at each simulation step into Unity, thereby achieving real-time feedback between the vehicles in the user interface. During this period, other users can also join the scene at any time. By clicking the connection button provided by the Mirror function module, multiple users can interact online, and there is also visual and physical feedback between these users. During the running process, the user’s vehicle and dynamic data in VISSIM are constantly updated at a high frequency to ensure the overall driving experience of the user.

3.3. Functional Designs

3.3.1. User Vehicle Building

  • Vehicle dynamic performance
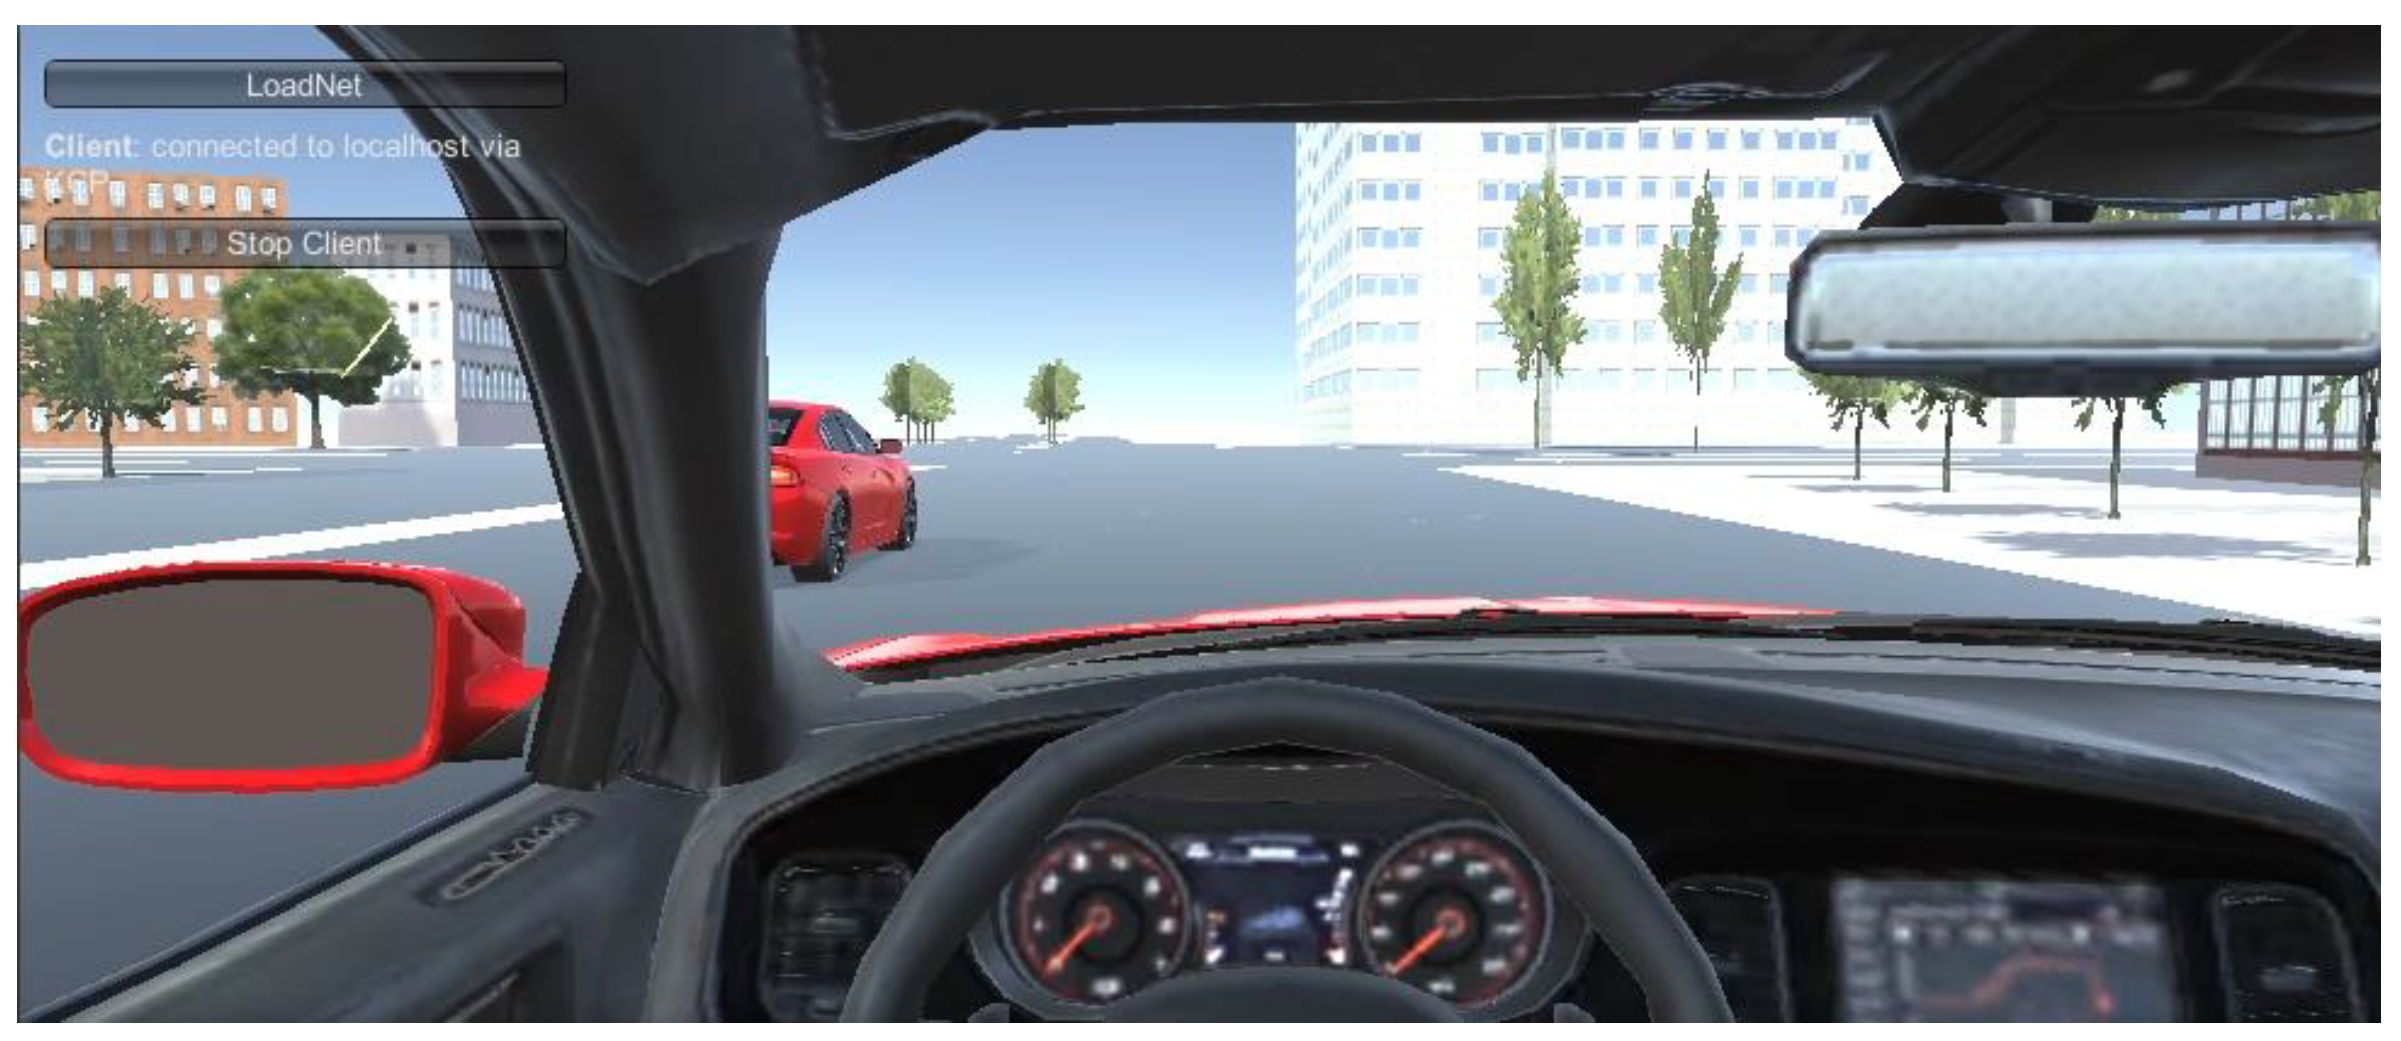
Vehicle dynamics are an important aspect of virtual driving simulations. Typically, professional modeling tools are used to model and calculate these vehicle dynamics. However, integrating these tools into a system can result in low efficiency. Therefore, this system simplifies the modeling process by using Unity’s physics effect methods and functions to achieve dynamic vehicle behavior.
The virtual vehicle driven by a user consists of wheels and a car body. Unity provides a component called WheelCollider, which is a collision body component for the vehicle. There are four wheels, each with a corresponding WheelCollider, corresponding to the four tires of the vehicle. The SteerAngle parameter in the WheelCollider can be adjusted to control the steering of the vehicle.
CarController is the core logic of the vehicle, while CarUserControl is the middleware between the user input and CarController. It is responsible for calling the Move method in CarController to update the vehicle’s state. In every frame, CarUserControl reads the data from the input class and uses this data to call the Move method. In CarUserControl, the parameters related to the vehicle’s performance are set, such as the steering angle, acceleration for starting, and footbrake for braking. After setting the turning angle conversion, the angle status needs to be updated in real-time. The SteerHelper method is used to determine the status of the tires. If one tire is not in contact with the ground, the vehicle stops turning. By attaching the vehicle driving script to the previously mentioned static model of the vehicle, a user can fully control the vehicle. The overall implementation process is shown in Figure 7.
  • Driving Vision
Desktop VR usually uses a keyboard and mouse as its standard input devices. Unity provides the Input class to obtain and process the keyboard input information. In this paper, we design and implement the function of controlling the vehicle’s movement through the keyboard. Referring to the key design of mainstream driving games, we assign the W, S, A, and D keys on the keyboard to control the vehicle’s forward, backward, left turn, and right turn operations, respectively.
Since vehicle control can be achieved through keyboard inputs, mouse control is used to change the driver’s perspective. During mouse movement detection, the distance of the mouse’s movement on the X and Y axes is recorded and the current direction and angle of the driver’s perspective are determined based on these distance data. For example, moving the mouse to the left moves the camera to the left, moving the mouse up moves the camera to the right, and similar events occur for other movements. At the same time, a maximum value of the camera movement is set to restore the characteristics of human head rotation, as shown in Figure 8. Changing the driver’s perspective can fully restore the behavior of a driver observing neighboring vehicles while operating the steering wheel during real-world driving.

3.3.2. Real Driving Data Calibration

The real driving data are obtained through the CAN-BUS from actual driving behaviors and the sensor parameters used for the scripted driving data include acceleration, speed, and yaw angle. There are a total of 13 scenarios for different driving situations, including crossing, left turn, right turn, left lane change, and right lane change. Based on the differences in these driving behaviors in different traffic scenarios and locations within the same scenario, the parameters in the script are calibrated and refined for various driving behaviors.
Taking the crossing scenario as an example, the distribution and correlation of the key data are analyzed, and the acceleration, speed, and lane deviation angle data are selected for this scenario (shown in Figure 9 and Figure 10).
None of the three types of data are a good fit to normal distribution. A Spearman correlation coefficient analysis is used and the results of this correlation analysis are shown in Table 2.
The three variables show a weak correlation with each other, but are all statistically significant, possibly due to the large sample size of N = 46,189. We attempt a multiple linear regression analysis with speed, which has a relatively stronger correlation with the other two variables, with the acceleration and yaw angle as independent variables and the dependent variable. The regression results are shown in Table 3.
As shown in Table 3, the Durbin–Watson (DW) value falls between 0 and 2, indicating a positive autocorrelation. Due to the large sample size, the R-squared value is only 0.15.
As shown in Table 4, the F-value is the result of the F-test, and Sig represents its corresponding p-value. If p < 0.05 in the table, it supports the null hypothesis and indicates that the linear regression equation is significant.
The t-test results are shown in Table 5, with all the Sig values being <0.05, indicating that the variables have a strong significance. Therefore, we can obtain the regression equation:
y = 0.163 x 1 + 0.110 x 2 + 28.567
In this equation, y represents the vehicle speed, x1 represents the acceleration, and x2 represents the yaw angle.
Based on the P-P plot of the standardized residuals of the regression (Figure 11), the concentration of points along the line is high, indicating that the regression meets the requirements. Therefore, a function is implemented in the Unity script to set the speed as data that change due to acceleration and yaw angle. As the correlation between the acceleration and yaw angle is weak, it is roughly assumed that they are independent.
For programming convenience, to simplify the distribution form of the input data, the distribution of the yaw angle is observed and it is found that its peak is high and distribution is highly concentrated. Therefore, the empirical distribution is used to express and input the data. Next, the speed is transformed to fit or approximate a normal distribution. The acceleration is denoted as x1 and its distribution characteristics are observed. The variable is transformed by taking the logarithm. After testing and modifying the new variable repeatedly, the following expression is found to provide relatively satisfactory results:
x 2 = log 10 x 1 + 10
The distribution of x2 is shown in Figure 12, and it can be approximately normally distributed. After obtaining the mean and variance, the same new parameter is set in the Unity script and a normal distribution generation function is added to it. After the script assigns values to the vehicle’s new parameters, the inverse operation is performed to assign values to its acceleration.
The data analysis results for the other scenarios are similar. The lane offset in the left and right turn scenarios needs to be carefully considered, as it determines the range of steering angles for the vehicles in the scene. Upon analyzing the distribution of the lane offset in the left turn scenario, as shown in Figure 13, it can be seen that the frequency is high near 0, but the formed peak is not obvious. Considering the high concentration of points on the straight line in the Q-Q plot and the large sample size, it can be considered to be approximately normally distributed. The steering angle for right turns is set uniformly with that for left turns to reproduce users’ real driving experiences.

3.3.3. Multiplayer Online Network Communication Function

  • Mirror multiplayer online system
The multiplayer functionality is implemented through the Mirror system in Unity3D, which is a system for building multiplayer game features in Unity3D. It is built on top of a lower-level real-time communication layer and handles many common tasks required for multiplayer games. This system structure is shown in Figure 14.
The Mirror client is an instance of the game that typically connects to the server from a different computer. The client can connect via a local network or online connection. The client is the game instance that connects to the server, so a user’s actions can be performed alongside other users connected to their client.
The Mirror server can be a “Dedicated server” or “Host server”. A dedicated server is a game instance that runs only as a server. A host server is when one client can also act as the server if there is no dedicated server. The client acts as the “Host server”, creating a single instance of the game that acts as both the server and the client.
  • Online user creation
When using this Mirror functionality, the host’s IP address is set as the default connection address, and users do not need to manually search for and change this IP address when using it. When multiple users enter the system on multiple computer devices, it is necessary to ensure that the devices are all connected to the same local area network.
To build online user units, a NetworkManager object is created in the Unity scene and the NetworkManager component is added. This object can establish network connections between hosts and clients and change network-connection-related parameters such as the server refresh rate. When an online user vehicle is created, the system generates different positions in the existing road network based on the user’s ID to avoid situations where multiple vehicles are generated in the same position, which may cause errors in physical collision detection.

3.3.4. Other Functions

  • UI design
The UI interface of this system is designed using Unity’s Overlay function. As shown in Figure 15, when a user first enters the software, they need to click the Client button to connect to the scene. At this time, the user’s camera will start and they will enter the driver’s perspective. Clicking the Help button will provide users with relevant information about the scene, as well as driving operation help. Clicking the “ChangeScene” button allows users to switch to other virtual traffic simulation scenes. The prerequisite for connecting to a scene is that the host has already entered this scene beforehand.
  • Scene selection
Considering that different factors have different effects in various real-life traffic scenarios, multiple typical traffic scenarios, such as highways and intersections, are constructed in the system. This not only meets users’ personalized needs, but also provides more references for studying driving behaviors in different scenarios. After entering the system, users can choose to enter different scenarios according to their preferences and needs. Users can also end their experience in the current scenario and switch to another one during the driving process. Figure 16 shows typical intersection and highway scenarios.

4. Discussion

The development of the Unity–VISSIM co-simulation platform offers new opportunities for studying interactive driving behavior in a more comprehensive and realistic way. By combining the strengths of Unity and VISSIM, researchers can create a virtual environment that captures both the physical and psychological aspects of driving, providing a more realistic and immersive experience for participants. The co-simulation platform can also be used to investigate the effects of other factors such as traffic density, weather conditions, driver age and experience, and the presence of other road users. For example, researchers can use the platform to study the interactions between human drivers and automated vehicles, or to evaluate the effectiveness of different communication technologies and warning systems in reducing collisions and improving traffic flow.
One of the main advantages of the co-simulation platform is its ability to provide real-time feedback and interaction between the driver and the virtual environment. This feature can enhance the validity and reliability of driving simulations by allowing researchers to observe and measure driver behavior in a controlled and safe environment. Moreover, the platform can facilitate the testing and evaluation of new technologies and interventions aimed at improving traffic safety, efficiency, and sustainability. These advantages highlight the versatility and value of the Unity–VISSIM co-simulation platform in advancing research and innovation in the fields of intelligent transportation systems, human factors, driving education, and traffic safety analyses:
  • Intelligent Transportation Systems (ITS)
The Unity–VISSIM co-simulation platform can contribute to ITS research by enabling the evaluation and optimization of traffic control and management strategies. It allows researchers to simulate and analyze the impact of different traffic control algorithms, signal timings, and intelligent transportation technologies. The platform can provide valuable insights into traffic flow, congestion management, and the effectiveness of ITS interventions.
  • Human Factors
The platform offers a unique opportunity to study the human factors related to driving behavior. Researchers can investigate how various factors, such as driver distraction, fatigue, and workload, affect driver performance and safety. The immersive and interactive nature of the platform allows for realistic simulations of driving scenarios, facilitating the study of human behavior in complex traffic situations.
  • Driving Education
The Unity–VISSIM co-simulation platform can be utilized as an educational tool for driver training and assessments. Driving schools and training centers can use the platform to provide simulated driving experiences that replicate real-world scenarios. Learners can practice different driving maneuvers, develop their hazard perception skills, and learn to make safe and effective decisions in a controlled environment. The platform’s ability to record and analyze driver behavior enables instructors to provide personalized feedback and evaluate the progress of learners.
  • Traffic Safety Analysis
The platform can contribute to research on traffic safety by allowing researchers to analyze and identify potential risk factors. It enables the study of driver interactions, behavior, and decision making in diverse traffic conditions. By collecting data on near-miss events, traffic conflicts, and driver responses, the platform can help to identify the critical factors that contribute to accidents and develop strategies for improving road safety.
However, there are also some limitations and challenges associated with the use of the co-simulation platform; these include the need for improved model complexity, the realism, calibration, and validation of simulation models, data collection and processing, usability and user experience, and the generalizability of the findings to real-world driving scenarios.
  • Model Complexity and Realism
One potential limitation of the platform is the challenge of accurately representing the complexity and realism of real-world driving scenarios. While the platform provides a hybrid simulation environment, there may still be limitations in capturing all the nuances of driver behavior, vehicle dynamics, and traffic interactions. Therefore, the validity problem of this new driving simulation platform remains a scientific problem to be solved in the new era of the metaverse [57,66,67]. Further research is needed to enhance the fidelity of the simulation models and ensure that they adequately represent real-world conditions.
  • Calibration and Validation
Another challenge lies in the calibration and validation of the simulation models used in the platform. It is crucial to ensure that the models accurately replicate real driving behavior and traffic dynamics. Calibrating the external control devices using empirical data from actual driving behaviors is a step towards addressing this challenge. However, ongoing efforts are required to refine these calibration techniques and validate the simulation results against real-world data.
  • Data Collection and Processing
A potential challenge is the collection and processing of the data generated by the platform. Recording and analyzing driver behavior, vehicle movements, and traffic interactions can generate large amounts of data. For long-term and large-scale experiments, efficient data collection methods, robust data-processing algorithms, and storage infrastructure are necessary to handle the data volume and effectively extract meaningful insights.
  • Usability and User Experience
The platform should strive for user-friendly interfaces and intuitive controls to enhance its usability and the user experience. It is crucial to ensure that researchers and participants can easily navigate the simulation environment and interact with the platform without significant barriers or complexities. Usability testing and iterative design processes can help in addressing these challenges and improving the overall user experience.
  • Generalizability of Findings
As with any simulation-based research, there is a concern about the generalizability of the findings from the platform to real-world driving scenarios. The platform’s effectiveness in simulating driving behavior and its applicability to diverse populations, road conditions, and cultural contexts should be carefully examined to ensure that the research outcomes can be translated into practical solutions.

5. Conclusions

This paper combined VISSIM (version 2021) and Unity software to design and implement a virtual traffic simulation system with real-time interaction and multiplayer online features. The VR driving function was implemented by writing C# scripts in Unity, and the traffic scene data in the VISSIM COM interface were called as the data support for the virtual simulation scene, ensuring the rationality and scientificity of various scene elements during the simulation running. At the same time, the excellent graphic capabilities of Unity were utilized to optimize the relatively simplified scenes in VISSIM, which ensured the immersion of the system users while avoiding data distortion. This system could serve as a platform for vehicle driving training, provide new methods for traffic researchers to analyze driving behavior, and compare VISSIM’s default data with user driving data, providing references for VISSIM’s model methods or data.
Although the multi-player online traffic simulation system provided by this project could offer a good driving experience, it still had some limitations, and there are directions for further research that can be explored, including: (1) due to the limitations of the experiment, the system could not simulate the special scenario of traffic accidents during the simulation. In the future, this can be addressed by incorporating real traffic accident data and simulating adverse weather conditions and damaged vehicles within the virtual environment. (2) This project only developed vehicles for user operation. In the future, a pedestrians and cyclists simulation module could be added to the user functions to make the elements in the road network more diverse and better reproduce real-world traffic operations. This would increase the range of scenarios that this system could be applied to. (3) The driving implementation process for users in this system was relatively simple and the performance differences between the vehicles controlled by different users were not very clear. Therefore, it could not fully reflect the driving style of different drivers. Further research is needed to provide a diverse driving experience.

Author Contributions

Conceptualization, X.S.; methodology, X.S. and S.Y.; software, S.Y.; validation, X.S. and S.Y.; formal analysis, X.S. and S.Y.; investigation, X.S. and S.Y.; resources, X.S.; data curation, X.S. and S.Y.; writing—original draft preparation, X.S. and S.Y.; writing—review and editing, X.S.; visualization, S.Y.; supervision, X.S. and Z.Y.; project administration, X.S. and Z.Y.; funding acquisition, X.S. and Z.Y. All authors have read and agreed to the published version of the manuscript.

Funding

This research was funded by the National Key R&D Program of China (2021YFB1600500), the National Natural Science Foundation of China (52072070, 52202410, 52172342), Foundation for Jiangsu Key Laboratory of Traffic and Transportation Security (TTS2020-04), Jiangsu Provincial Double-Innovation Ph.D. Program (JSSCBS20210108) and Tongling City’s Major R&D Project-Open Competition (202201JB006).

Data Availability Statement

Data and software are available on request.

Conflicts of Interest

The authors declare no conflict of interest.

References

  1. Zhao, X.; Wu, Y.; Rong, J.; Zhang, Y. Development of a Driving Simulator Based Eco-Driving Support System. Transp. Res. Part C Emerg. Technol. 2015, 58, 631–641. [Google Scholar] [CrossRef]
  2. Ahmed, M.M.; Khan, M.N.; Das, A.; Dadvar, S.E. Global Lessons Learned from Naturalistic Driving Studies to Advance Traffic Safety and Operation Research: A Systematic Review. Accid. Anal. Prev. 2022, 167, 106568. [Google Scholar] [CrossRef] [PubMed]
  3. Saifuzzaman, M.; Zheng, Z. Incorporating Human-Factors in Car-Following Models: A Review of Recent Developments and Research Needs. Transp. Res. Part C Emerg. Technol. 2014, 48, 379–403. [Google Scholar] [CrossRef]
  4. Chen, D.; Ahn, S.; Laval, J.; Zheng, Z. On the Periodicity of Traffic Oscillations and Capacity Drop: The Role of Driver Characteristics. Transp. Res. Part B Methodol. 2014, 59, 117–136. [Google Scholar] [CrossRef]
  5. Wynne, R.A.; Beanland, V.; Salmon, P.M. Systematic Review of Driving Simulator Validation Studies. Saf. Sci. 2019, 117, 138–151. [Google Scholar] [CrossRef]
  6. Sportillo, D.; Paljic, A.; Ojeda, L. Get Ready for Automated Driving Using Virtual Reality. Accid. Anal. Prev. 2018, 118, 102–113. [Google Scholar] [CrossRef]
  7. Barcelo, J. Fundamentals of Traffic Simulation; Barceló, J., Ed.; International Series in Operations Research & Management Science; Springer: New York, NY, USA, 2010; Volume 145, ISBN 978-1-4419-6141-9. [Google Scholar]
  8. Olstam, J.; Espié, S.; Måardh, S.; Jansson, J.; Lundgren, J. An Algorithm for Combining Autonomous Vehicles and Controlled Events in Driving Simulator Experiments. Transp. Res. Part C Emerg. Technol. 2011, 19, 1185–1201. [Google Scholar] [CrossRef]
  9. Wang, Z.; Gupta, R.; Han, K.; Wang, H.; Ganlath, A.; Ammar, N.; Tiwari, P. Mobility Digital Twin: Concept, Architecture, Case Study, and Future Challenges. IEEE Internet Things J. 2022, 9, 17452–17467. [Google Scholar] [CrossRef]
  10. Bobermin, M.P.; Silva, M.M.; Ferreira, S. Driving Simulators to Evaluate Road Geometric Design Effects on Driver Behaviour: A Systematic Review. Accid. Anal. Prev. 2021, 150, 105923. [Google Scholar] [CrossRef]
  11. Wang, Z.; Liao, X.; Wang, C.; Oswald, D.; Wu, G.; Boriboonsomsin, K.; Barth, M.J.; Han, K.; Kim, B.G.; Tiwari, P. Driver Behavior Modeling Using Game Engine and Real Vehicle: A Learning-Based Approach. IEEE Trans. Intell. Veh. 2020, 5, 738–749. [Google Scholar] [CrossRef]
  12. Shi, X.; Chang, H.; Xue, S.; Bao, J.; Zhang, H. Serious Games for Transportation Research: An Overview. In Proceedings of the CICTP 2020: Transportation Evolution Impacting Future Mobility—Selected Papers from the 20th COTA International Conference of Transportation Professionals, Xi’an, China, 14–16 August 2020; American Society of Civil Engineers: Reston, VA, USA, 2020; pp. 4462–4472. [Google Scholar]
  13. Ejercito, P.M.; Nebrija, K.G.E.; Feria, R.P.; Lara-Figueroa, L.L. Traffic Simulation Software Review. In Proceedings of the 2017 8th International Conference on Information, Intelligence, Systems and Applications, IISA 2017, Larnaca, Cyprus, 27–30 August 2017; Volume 2018, pp. 1–4. [Google Scholar]
  14. Lu, Z.; Fu, T.; Fu, L.; Shiravi, S.; Jiang, C. A Video-Based Approach to Calibrating Car-Following Parameters in VISSIM for Urban Traffic. Int. J. Transp. Sci. Technol. 2016, 5, 1–9. [Google Scholar] [CrossRef]
  15. Liu, P.; Qu, X.; Yu, H.; Wang, W.; Cao, B. Development of a VISSIM Simulation Model for U-Turns at Unsignalized Intersections. J. Transp. Eng. 2012, 138, 1333–1339. [Google Scholar] [CrossRef]
  16. Park, B.; Schneeberger, J. Microscopic Simulation Model Calibration and Validation: Case Study of VISSIM Simulation Model for a Coordinated Actuated Signal System. Transp. Res. Rec. J. Transp. Res. Board 2003, 1856, 185–192. [Google Scholar] [CrossRef]
  17. Kretz, T.; Hengst, S.; Vortisch, P. Pedestrian Flow at Bottlenecks—Validation and Calibration of Vissim’s Social Force Model of Pedestrian Traffic and Its Empirical Foundations. In Proceedings of the International Symposium of Transport Simulation 2008, Gold Coast, QLD, Australia, 13 May 2008; pp. 1–12. [Google Scholar]
  18. Lee, S.; Jeong, E.; Oh, M.; Oh, C. Driving Aggressiveness Management Policy to Enhance the Performance of Mixed Traffic Conditions in Automated Driving Environments. Transp. Res. Part A Policy Pract. 2019, 121, 136–146. [Google Scholar] [CrossRef]
  19. Durrani, U.; Lee, C.; Maoh, H. Calibrating the Wiedemann’s Vehicle-Following Model Using Mixed Vehicle-Pair Interactions. Transp. Res. Part C Emerg. Technol. 2016, 67, 227–242. [Google Scholar] [CrossRef]
  20. Zhu, M.; Wang, X.; Tarko, A.; Fang, S. Modeling Car-Following Behavior on Urban Expressways in Shanghai: A Naturalistic Driving Study. Transp. Res. Part C Emerg. Technol. 2018, 93, 425–445. [Google Scholar] [CrossRef]
  21. Tiaprasert, K.; Zhang, Y.; Aswakul, C.; Jiao, J.; Ye, X. Closed-Form Multiclass Cell Transmission Model Enhanced with Overtaking, Lane-Changing, and First-in First-out Properties. Transp. Res. Part C Emerg. Technol. 2017, 85, 86–110. [Google Scholar] [CrossRef]
  22. Shi, X.; Xue, S.; Feliciani, C.; Shiwakoti, N.; Lin, J.; Li, D.; Ye, Z. Verifying the Applicability of a Pedestrian Simulation Model to Reproduce the Effect of Exit Design on Egress Flow under Normal and Emergency Conditions. Phys. A Stat. Mech. Its Appl. 2021, 562, 125347. [Google Scholar] [CrossRef]
  23. Huang, F.; Liu, P.; Yu, H.; Wang, W. Identifying If VISSIM Simulation Model and SSAM Provide Reasonable Estimates for Field Measured Traffic Conflicts at Signalized Intersections. Accid. Anal. Prev. 2013, 50, 1014–1024. [Google Scholar] [CrossRef]
  24. Wang, C.; Xu, C.; Xia, J.; Qian, Z.; Lu, L. A Combined Use of Microscopic Traffic Simulation and Extreme Value Methods for Traffic Safety Evaluation. Transp. Res. Part C Emerg. Technol. 2018, 90, 281–291. [Google Scholar] [CrossRef]
  25. Abou-Senna, H.; Radwan, E. VISSIM/MOVES Integration to Investigate the Effect of Major Key Parameters on CO2 Emissions. Transp. Res. Part D Transp. Environ. 2013, 21, 39–46. [Google Scholar] [CrossRef]
  26. Krajzewicz, D.; Hertkorn, G. SUMO (Simulation of Urban MObility) An Open-Source Traffic Simulation. In Proceedings of the Symposium on Simulation, Sharjah, United Arab Emirates, 28–30 September 2002; pp. 63–68. [Google Scholar]
  27. Wegener, A.; Piórkowski, M.; Raya, M.; Hellbrück, H.; Fischer, S.; Hubaux, J.P. TraCI: An Interface for Coupling Road Traffic and Network Simulators. In Proceedings of the 11th Communications and Networking Simulation Symposium, CNS’08, Ottawa, ON, Canada, 14–17 April 2008; pp. 155–163. [Google Scholar]
  28. Biurrun-Quel, C.; Serrano-Arriezu, L.; Olaverri-Monreal, C. Microscopic Driver-Centric Simulator: Linking Unity3D and SUMO. In Proceedings of the Advances in Intelligent Systems and Computing, Lviv, Ukraine, 6–10 September 2016; Springer: Berlin/Heidelberg, Germany, 2017; Volume 569, pp. 851–860. [Google Scholar]
  29. Olaverri-Monreal, C.; Errea-Moreno, J.; Díaz-álvarez, A.; Biurrun-Quel, C.; Serrano-Arriezu, L.; Kuba, M. Connection of the SUMO Microscopic Traffic Simulator and the Unity 3D Game Engine to Evaluate V2X Communication-Based Systems. Sensors 2018, 18, 4399. [Google Scholar] [CrossRef] [PubMed]
  30. Barbecho Bautista, P.; Urquiza Aguiar, L.; Aguilar Igartua, M. How Does the Traffic Behavior Change by Using SUMO Traffic Generation Tools. Comput. Commun. 2022, 181, 1–13. [Google Scholar] [CrossRef]
  31. Krajzewicz, D. Traffic Simulation with SUMO—Simulation of Urban Mobility. In International Series in Operations Research and Management Science; Springer: New York, NY, USA, 2010; Volume 145, pp. 269–293. [Google Scholar]
  32. Lopez, P.A.; Behrisch, M.; Bieker-Walz, L.; Erdmann, J.; Flotterod, Y.P.; Hilbrich, R.; Lucken, L.; Rummel, J.; Wagner, P.; Wiebner, E. Microscopic Traffic Simulation Using SUMO. In Proceedings of the 2018 21st International Conference on Intelligent Transportation Systems (ITSC), Maui, HI, USA, 4–7 November 2018; Volume 2018, pp. 2575–2582. [Google Scholar]
  33. Balakrishna, R.; Morgan, D.; Slavin, H.; Yang, Q. Large-Scale Traffic Simulation Tools for Planning and Operations Management. In Proceedings of the IFAC Proceedings Volumes, Redondo Beach, CA, USA, 2–4 September 2009; Volume 42, pp. 117–122. [Google Scholar]
  34. Song, Z.; Wang, H.; Sun, J.; Tian, Y. Experimental Findings with VISSIM and TransModeler for Evaluating Environmental and Safety Impacts Using Micro-Simulations. Transp. Res. Rec. J. Transp. Res. Board 2020, 2674, 566–580. [Google Scholar] [CrossRef]
  35. Hollander, Y.; Liu, R. The Principles of Calibrating Traffic Microsimulation Models. Transportation 2008, 35, 347–362. [Google Scholar] [CrossRef]
  36. Lu, L.; Yun, T.; Li, L.; Su, Y.; Yao, D. A Comparison of Phase Transitions Produced by PARAMICS, TransModeler, and VISSIM. IEEE Intell. Transp. Syst. Mag. 2010, 2, 19–24. [Google Scholar] [CrossRef]
  37. Jimenez, D.; Munoz, F.; Arias, S.; Hincapie, J. Software for Calibration of Transmodeler Traffic Microsimulation Models. In Proceedings of the 2016 IEEE 19th International Conference on Intelligent Transportation Systems (ITSC), Rio de Janeiro, Brazil, 1–4 November 2016; pp. 1317–1323. [Google Scholar]
  38. Zhang, C.; Sabar, N.R.; Chung, E.; Bhaskar, A.; Guo, X. Optimisation of Lane-Changing Advisory at the Motorway Lane Drop Bottleneck. Transp. Res. Part C Emerg. Technol. 2019, 106, 303–316. [Google Scholar] [CrossRef]
  39. Kamal, M.A.S.; Hashikura, K.; Hayakawa, T.; Yamada, K.; Imura, J. Adaptive Cruise Control with Look-Ahead Anticipation for Driving on Freeways. Appl. Sci. 2022, 12, 929. [Google Scholar] [CrossRef]
  40. Anya, A.R.; Rouphail, N.M.; Frey, H.C.; Schroeder, B. Application of AIMSUN Microsimulation Model to Estimate Emissions on Signalized Arterial Corridors. Transp. Res. Rec. J. Transp. Res. Board 2014, 2428, 75–86. [Google Scholar] [CrossRef]
  41. Acuto, F.; Coelho, M.C.; Fernandes, P.; Giuffrè, T.; Macioszek, E.; Granà, A. Assessing the Environmental Performances of Urban Roundabouts Using the VSP Methodology and AIMSUN. Energies 2022, 15, 1371. [Google Scholar] [CrossRef]
  42. Zuo, K.; Liu, Q.; Sun, J. Modeling and Simulation of Merging Behavior at Urban Expressway On-Ramp. J. Syst. Simul. 2017, 29, 1895. [Google Scholar] [CrossRef]
  43. Liu, Q.; Sun, J.; Tian, Y.; Xiong, L. Modeling and Simulation of Overtaking Events by Heterogeneous Non-Motorized Vehicles on Shared Roadway Segments. Simul. Model. Pract. Theory 2020, 103, 102072. [Google Scholar] [CrossRef]
  44. Zhao, X.; Gao, Y.; Jin, S.; Xu, Z.; Liu, Z.; Fan, W.; Liu, P. Development of a Cyber-Physical-System Perspective Based Simulation Platform for Optimizing Connected Automated Vehicles Dedicated Lanes. Expert Syst. Appl. 2023, 213, 118972. [Google Scholar] [CrossRef]
  45. Bruck, L.; Haycock, B.; Emadi, A. A Review of Driving Simulation Technology and Applications. IEEE Open J. Veh. Technol. 2021, 2, 1–16. [Google Scholar] [CrossRef]
  46. Godley, S.T.; Triggs, T.J.; Fildes, B.N. Driving Simulator Validation for Speed Research. Accid. Anal. Prev. 2002, 34, 589–600. [Google Scholar] [CrossRef]
  47. Lee, W.-S.; Kim, J.-H.; Cho, J.-H. A Driving Simulator as a Virtual Reality Tool. In Proceedings of the 1998 IEEE International Conference on Robotics and Automation (Cat. No.98CH36146), Leuven, Belgium, 20 May 1998; Volume 1, pp. 71–76. [Google Scholar]
  48. Philip, P.; Taillard, J.; Klein, E.; Sagaspe, P.; Charles, A.; Davies, W.L.; Guilleminault, C.; Bioulac, B. Effect of Fatigue on Performance Measured by a Driving Simulator in Automobile Drivers. J. Psychosom. Res. 2003, 55, 197–200. [Google Scholar] [CrossRef] [PubMed]
  49. Wang, X.; Wang, X.; Cai, B.; Liu, J. Combined Alignment Effects on Deceleration and Acceleration: A Driving Simulator Study. Transp. Res. Part C Emerg. Technol. 2019, 104, 172–183. [Google Scholar] [CrossRef]
  50. Lee, J.D.; McGehee, D.V.; Brown, T.L.; Reyes, M.L. Collision Warning Timing, Driver Distraction, and Driver Response to Imminent Rear-End Collisions in a High-Fidelity Driving Simulator. Hum. Factors J. Hum. Factors Ergon. Soc. 2002, 44, 314–334. [Google Scholar] [CrossRef]
  51. Meng, F.; Wong, S.C.; Yan, W.; Li, Y.C.; Yang, L. Temporal Patterns of Driving Fatigue and Driving Performance among Male Taxi Drivers in Hong Kong: A Driving Simulator Approach. Accid. Anal. Prev. 2019, 125, 7–13. [Google Scholar] [CrossRef]
  52. Brooks, J.O.; Crisler, M.C.; Klein, N.; Goodenough, R.; Beeco, R.W.; Guirl, C.; Tyler, P.J.; Hilpert, A.; Miller, Y.; Grygier, J.; et al. Speed Choice and Driving Performance in Simulated Foggy Conditions. Accid. Anal. Prev. 2011, 43, 698–705. [Google Scholar] [CrossRef]
  53. Rong, J.; Mao, K.; Ma, J. Effects of Individual Differences on Driving Behavior and Traffic Flow Characteristics. Transp. Res. Rec. J. Transp. Res. Board 2011, 2248, 1–9. [Google Scholar] [CrossRef]
  54. Feng, Y.; Duives, D.C.; Hoogendoorn, S.P. Wayfinding Behaviour in a Multi-Level Building: A Comparative Study of HMD VR and Desktop VR. Adv. Eng. Inform. 2022, 51, 101475. [Google Scholar] [CrossRef]
  55. Lebram, M.; Engstr, H. A Driving Simulator Based on Video Game Technology. In SIGRAD 2006: The Annual SIGRAD Conference; Linköping University Electronic Press: Linköping, Sweden, 2006; Volume 20, pp. 39–43. [Google Scholar]
  56. Keshavarz, B.; Ramkhalawansingh, R.; Haycock, B.; Shahab, S.; Campos, J.L. Comparing Simulator Sickness in Younger and Older Adults during Simulated Driving under Different Multisensory Conditions. Transp. Res. Part F Traffic Psychol. Behav. 2018, 54, 47–62. [Google Scholar] [CrossRef]
  57. Hartfiel, B.; Stark, R. Validity of Primary Driving Tasks in Head-Mounted Display-Based Driving Simulators. Virtual Real. 2021, 25, 819–833. [Google Scholar] [CrossRef]
  58. Erath, A.; Maheshwari, T.; Joos, M.; Kupferschmid, J.; van Eggermond, M. Visualizing Transport Futures: The Potential of Integrating Procedural 3d Modelling and Traffic Micro-Simulation in Virtual Reality Applications. In Proceedings of the Transportation Research Board, 96th Annual Meeting, Washington, DC, USA, 8–12 January 2017; Volume 1185, pp. 12–19. [Google Scholar]
  59. Liao, X.; Zhao, X.; Wang, Z.; Han, K.; Tiwari, P.; Barth, M.J.; Wu, G. Game Theory-Based Ramp Merging for Mixed Traffic with Unity-SUMO Co-Simulation. IEEE Trans. Syst. Man Cybern. Syst. 2022, 52, 5746–5757. [Google Scholar] [CrossRef]
  60. Li, H.; Zhang, J.; Xia, L.; Song, W.; Bode, N.W.F. Comparing the Route-Choice Behavior of Pedestrians around Obstacles in a Virtual Experiment and a Field Study. Transp. Res. Part C Emerg. Technol. 2019, 107, 120–136. [Google Scholar] [CrossRef]
  61. Bogacz, M.; Hess, S.; Calastri, C.; Choudhury, C.F.; Mushtaq, F.; Awais, M.; Nazemi, M.; van Eggermond, M.A.B.; Erath, A. Modelling Risk Perception Using a Dynamic Hybrid Choice Model and Brain-Imaging Data: An Application to Virtual Reality Cycling. Transp. Res. Part C Emerg. Technol. 2021, 133, 103435. [Google Scholar] [CrossRef]
  62. Morra, L.; Lamberti, F.; Gabriele Prattico, F.; Rosa, S.L.; Montuschi, P. Building Trust in Autonomous Vehicles: Role of Virtual Reality Driving Simulators in HMI Design. IEEE Trans. Veh. Technol. 2019, 68, 9438–9450. [Google Scholar] [CrossRef]
  63. Perez, D.; Hasan, M.; Shen, Y.; Yang, H. AR-PED: A Framework of Augmented Reality Enabled Pedestrian-in-the-Loop Simulation. Simul. Model. Pract. Theory 2019, 94, 237–249. [Google Scholar] [CrossRef]
  64. Ren, R.; Li, H.; Han, T.; Tian, C.; Zhang, C.; Zhang, J.; Proctor, W.; Chen, Y.; Feng, Y. Vehicle Crash Simulations for Safety: Introduction of Connected and Automated Vehicles on the Roadways. Accid. Anal. Prev. 2023, 186, 107021. [Google Scholar] [CrossRef]
  65. Jia, D.; Sun, J.; Sharma, A.; Zheng, Z.; Liu, B. Integrated Simulation Platform for Conventional, Connected and Automated Driving: A Design from Cyber–Physical Systems Perspective. Transp. Res. Part C Emerg. Technol. 2021, 124, 102984. [Google Scholar] [CrossRef]
  66. Pawar, N.M.; Velaga, N.R.; Sharmila, R.B. Exploring Behavioral Validity of Driving Simulator under Time Pressure Driving Conditions of Professional Drivers. Transp. Res. Part F Traffic Psychol. Behav. 2022, 89, 29–52. [Google Scholar] [CrossRef]
  67. Kaptein, N.A.; Theeuwes, J.; van der Horst, R. Driving Simulator Validity: Some Considerations. Transp. Res. Rec. J. Transp. Res. Board 1996, 1550, 30–36. [Google Scholar] [CrossRef]
Figure 1. The main design and implementation module of the co-simulation platform.
Systems 11 00269 g001
Figure 2. Vehicle model, road network, and environmental object model in Unity and VISSIM.
Systems 11 00269 g002
Figure 3. Simulation run update flow chart.
Systems 11 00269 g003
Figure 4. Signal control implementation flow chart.
Systems 11 00269 g004
Figure 5. Real-time interactive implementation flow chart.
Systems 11 00269 g005
Figure 6. System operation flow chart.
Systems 11 00269 g006
Figure 7. User vehicle dynamic performance realization flow chart.
Systems 11 00269 g007
Figure 8. User driving vision.
Systems 11 00269 g008
Figure 9. Distribution of key driving data with fittings: (a) distribution of acceleration, (b) distribution of velocity, and (c) distribution of yaw angle.
Systems 11 00269 g009
Figure 10. Normal Q-Q plots: (a) normal Q-Q plot of acceleration, (b) normal Q-Q plot of velocity, and (c) normal Q-Q plot of yaw angle.
Systems 11 00269 g010
Figure 11. Normal P-P plot of Regression Standardized Residual.
Systems 11 00269 g011
Figure 12. Normal test of x2: (a) distribution of x2, and (b) normal Q-Q plot of x2.
Systems 11 00269 g012
Figure 13. Normal test of left turn yaw angle: (a) distribution of left turn yaw angle, and (b) normal Q-Q plot of left turn yaw angle.
Systems 11 00269 g013
Figure 14. Mirror system structure.
Systems 11 00269 g014
Figure 15. UI interface.
Systems 11 00269 g015
Figure 16. Scene selection interface.
Systems 11 00269 g016
Table 1. Comparison of microscopic traffic simulation platforms.
Simulation PlatformVISSIMSUMOTransModelerAIMSUNTESS NG
DeveloperPTV (GER)DLR (GER)Caliper (USA)TSS (ESP)Jida (CHN)
Operating SystemWindows/LinuxWindows/
Linux/Mac
WindowsWindows/
Linux/Mac
Windows/
Linux
Simulation levelMicroMacro/MicroMacro/MicroMacro/MicroMicro
Display mode2D/3D2D2D/3D2D/3D2D/3D
Open source××××
APICOMTraCIGISDKGETRAM
Extensions
Python/C++
Road network import
Traffic control
Table 2. Significant analysis of acceleration, velocity and yaw angle.
AccelerationVelocityYaw Angle
Acceleration1−0.127−0.15
Sig. (2-tailed)0.0000.001
Velocity−0.12710.26
Sig. (2-tailed)0.0000.000
Yaw angle−0.150.261
Sig. (2-tailed)0.0010.000
Table 3. Correlation analysis results.
RR SquareAdjusted R SquareDurbin-Waston
0.1220.1514.300030.210
Table 4. F-test results.
ModelSum of SquaresdfMean SquareFSig.
Regression143,356.149271,678.074350.5200.000
Residual9,514,553.05346,189204.491
Total9,657,909.20246,191
Table 5. t-test results.
ModelUnstandardized
Coefficients
Standardized CoefficientstSig.
BStd. ErrorBeta
Constant28.5670.154 185.3540.000
Acceleration−0.1630.006−0.121−26.2350.000
Yaw angle0.1100.0270.0194.0920.000
Disclaimer/Publisher’s Note: The statements, opinions and data contained in all publications are solely those of the individual author(s) and contributor(s) and not of MDPI and/or the editor(s). MDPI and/or the editor(s) disclaim responsibility for any injury to people or property resulting from any ideas, methods, instructions or products referred to in the content.

