Abstract
Recently, the demand for citizen-sensible service solutions such as traffic, crime prevention, and disasters in smart cities is increasing. In order to provide technology-based smart city services, local government control centers could be utilized. Accordingly, this paper presented a method for selecting a control center-based dynamic object information utilization service model through in-depth interviews with 26 related local government control center operation personnel. A comparative analysis according to the size of the local government to which the evaluator belongs was also performed. As a methodology, Fuzzy AHP was used, which can support rational decision-making by mathematically expressing ambiguous phenomena such as subjective and uncertain judgments. The summary of the research results is as follows. Services related to recent incidents in South Korea (e.g., school zone traffic accidents and lowland inundation) were identified as very important. These social issues are significant factors in policy decisions. In comparing the results for each urban scale, the importance of pedestrian safety services on backside roads and main road traffic services was found to be important in the metropolitan area and regional, medium, and small cities, respectively. This was attributed to metropolitan cities with high population density, and medium and small cities experiencing alienated traffic information. In metropolitan areas, new services are highly important owing to the demand for a more scientific control service and future mobility based on a sound control infrastructure. In medium and small cities, facility management services were assessed relatively highly owing to the poor conditions of regional cities with a lack of supervising personnel in the field and a lack of surveillance system infrastructure. This paper was able to confirm the difference in service preference by city size, and it is necessary to select the optimal service model considering these results.
1. Introduction
1.1. Research Background and Purpose
In South Korea, closed-circuit television (CCTV) control centers in 226 lower-level local governments monitor anomalies (e.g., transportation problems, crime, and disasters) based on dynamic information. Until the early 2000s, controllers at city control centers directly monitored CCTV images; however, with recent developments in information and communication technology and smart city operation technology, advanced control technologies such as artificial intelligence (AI), big data, Internet of Things (IoT), and digital twins have found extensive use. These advanced control technologies help recognize, renew, and predict the dynamic information of objects, such as pedestrians and vehicles. With this information, emergencies can be responded to within the golden hour, and the expected risk factors can be eliminated. In particular, smart cities are developing various application solutions using advanced technologies such as IoT, artificial intelligence, blockchain, big data, and cloud computing for sustainable development. Looking at the service sector, the importance of areas directly related to citizen safety, such as transportation and crime prevention, is increased [1,2,3].
In order to provide smart city services based on advanced technology to citizens, it is necessary to utilize a central control tower in the public. The New York Police Department in the United States established a real-time surveillance system linked to the police database and CCTV image data through a domain awareness system, which is an integrated real-time crime surveillance system [4]. China operates an active urban surveillance system through CCTV-based facial recognition technology using SenseTime and Face++ [5]. South Korea has also achieved the connection and integration of services in various sectors, including crime prevention, transportation, and disaster management, based on the CCTV control center [6]. Moreover, in South Korea, the characteristics, purpose, and budgeting priority of each local government are considered for the integrated operation of each local government’s control center. However, the control center utilization technology in South Korea is unilaterally implemented by official policymakers without considering the urban scale, the characteristics of the detected dynamic information, and the importance of each service, while mostly focusing on short-term performances [7,8,9]. In terms of research topics, though there are a great number of studies on individual services, including transportation and crime prevention, there is insufficient research on the utilization of dynamic information based on local government control centers for realistic technology implementation. Furthermore, there are few reviews of alternative services and methods for supporting decision-making processes that are appropriate for local governments within a limited budget.
Therefore, this paper aimed to select a control center-based dynamic object information application service model through in-depth interviews with related experts. The goal of this study was to propose a method for selecting a service using dynamic object information by actual city size, to this end, the evaluation target was composed of actual local government control center operating personnel, and the evaluator’s affiliated local government was classified and analyzed into large cities and small and medium-sized cities. This is expected to support the selection of core services in the transportation and crime prevention fields responsible for citizen safety in smart cities. The literature review is presented in Section 1 (Introduction), and the methodology for assessing the service is presented in Section 2. In Section 3, after selecting a service model for evaluating the control center-based dynamic information utilization service, SWOT analysis and hypotheses were established for accurate diagnosis. In Section 4, the assessment criteria and service are evaluated, and an empirical analysis per urban scale is performed. Section 5 and Section 6 present the discussion and implications of the study.
1.2. Research Methodology
This study targeted main roads, backside roads, and the dynamic information utilization service of the local government, which includes roads monitored by the control centers of local governments. Dynamic information refers to the temporary existence and disappearance of spatial data such as changes in transportation circumstances, pedestrian/vehicle movements, transportation density, and facilities [10].
For the research method, we decided upon dynamic information utilization services by considering spatial characteristics, service sectors, and data monitored by the control center through in-depth interviews with specialists. Thereafter, we reviewed the methodology for supporting decision-making and selecting assessment criteria by considering the control center and service characteristics. Finally, a hierarchy was set based on the fuzzy analytic hierarchy process (AHP), and the dynamic information utilization service was assessed at each urban scale.
1.3. Literature Review
This paper focuses on city control services based on dynamic object information in the transportation and safety fields, which are the core fields of smart cities. Smart cities have emerged as a result of innovative ICT industries and markets, and new solutions utilizing IoT, big data, and cloud computing technologies have been used to build profound cities [11]. The role of various computing and communication technologies in the sustainable development of smart cities is presented, and the importance of public safety services, traffic improvement, and safety services to quickly respond to disasters and threats is emphasized [12]. In particular, looking at the recent smart city trends, if the goal of a smart city in the past was to build urban infrastructure, now it is to provide smart city services. Accordingly, smart city service operation and maintenance is an important situation [13]. It is necessary to select a service model for the purpose of providing citizen safety and convenience required in such a smart city.
Dynamic object information mainly refers to moving objects and changing phenomena in the city through CCTVs, drones, etc., and can contribute to solving various social problems by detecting them in real-time. Research on dynamic information utilization has mainly focused on autonomous driving and vehicles in advanced transportation, such as intelligent transport systems (ITS) and pedestrian objects, while research on autonomous driving has covered transportation CCTV imagery-based dynamic object-autonomous driving support [14,15], dynamic information platform technology for urban road cooperative automated driving [16], and dynamic information service assessment [17]. Related to ITS, there are studies on location determination in dynamic transportation environments and simulations [18,19] and real-time safety information provision based on road traffic information [20]. From the perspective of detailed transportation services, research has been conducted on dismissal strategies and dynamic information provision before and after traffic incidents through smart road lighting facilities with video and radar equipment [21] and object analysis based on situation recognition scenarios in school zones [22]. In sectors other than transportation, research on dynamic object detection and intelligent image surveillance system construction based on CCTV [23,24,25,26] has been conducted for crime prevention. In the disaster sector, there have been studies on multi-disaster drone system development through optimal path search and deep-learning-based object recognition [27]. In addition, there have been studies on visualization and system development, including dynamic information and mashup performance comparisons of dynamic and spatial information [28], and dynamic image control system development based on user tracking information [29]. These studies detected, tracked, and systemized dynamic object data based on AI and big data and are significant in advancing analysis research relevant to dynamic information in each sector. However, these studies were conducted as individual units of research and did not consider the comprehensive and dynamic information utilization services monitored by local government control centers. Thus, this study is significant and differs from the previous research.
Research on selected services that will be operated in public, such as CCTV control centers, mainly focuses on services related to smart cities and crime prevention. Examples include research on temporal and spatial crime prediction in smart cities based on crime-related data [30]; analysis of impact factors, number of lawsuits, and crime occurrence according to CCTV control in public areas [31]; CCTV surveillance data verification systems using blockchain technology [32]; and image surveillance systems during events and under fog [33]. In addition, studies have assessed the importance of daily security operations center (SOC) services in transportation, living convenience, medicine, education, culture, and physical activity [34] and AHP assessment for social overhead capital facilities such as bridges, tunnels, and ports [35]. However, although the targets of the abovementioned research were publicly operated services, none targeted the local government control center that implements dynamic information utilization services. Additionally, although most studies use the AHP as a decision-making method, there is a lack of consideration of advanced methods that complement the ambiguity of the AHP’s subjective determinations. This study set the dynamic information utilization service monitored by each local government’s CCTV control center as the assessment criterion, thereby providing decision-making support with greater practical potential. Additionally, it used fuzzy AHP, which can mathematically complement the uncertain and subjective determinations of AHP, to advance a control center-based decision-making support methodology.
2. Methodology
This study has the purpose of supporting decision-making by introducing a control service using dynamic object information that can be monitored by a control center. Therefore, it is important to select a research methodology supported by scientific evidence and logic. In this regard, the multi-criteria decision-making method (MCDM) is mainly used in academia to present objective priority alternatives to the criteria based on the purpose of the research.
Among them, AHP has the following advantages: the possibility of structuring alternative selections during complex decision-making situations and the easy integration of quantitative/qualitative factors and subjective/objective factors based on experts’ experiences and knowledge. Thus, it is a validated decision-making method used by the government for the comprehensive assessment of preliminary feasibility plans. AHP was developed by Saaty and supports decision-making through pairwise comparisons between class factors [36]. Since Saaty, numerous researchers have developed various derivative methods. Zadeh applied fuzzy theory to derive a fuzzy AHP [37]. Fuzzy theory implements fuzzy sets and logic to overcome the inaccuracy and imprecision of subjective determinations during assessments. Fuzzy AHP mathematically expresses ambiguous phenomena, including subjective and uncertain decisions, as well as uncertain quantitative data, and reasonable decision-making alternatives can be derived using fuzzy AHP.
This study used fuzzy AHP as the methodology for assessing dynamic information utilization services, considering its advantages. Although there is no existing research targeting control-center-based dynamic information utilization systems, several studies have applied fuzzy AHP to the manufacturing and energy technology sectors. This research focused on selecting the cutting process technology for water jets through fuzzy AHP [38]. Based on the weighted result values according to a pairwise comparison of each class of the six assessment criteria, two final alternatives were selected through a relative importance analysis per assessment criterion. To select a new manufacturing technology, research has been conducted to develop a decision-making support system based on a fuzzy AHP [39]. The corresponding system supports investment decisions for manufacturing technologies through a relative importance analysis of qualitative attributes, such as flexibility and quality, which are difficult to quantify. For an important analysis of the cost efficiency of various hydrogen production technologies, researchers have comparatively analyzed AHP, fuzzy AHP, and advanced AHP [40]. Fuzzy AHP is considered mathematically reliable because it supplements the ambiguity of subjective determinations. Studies have also derived the priority of hydrogen energy and energy technologies using fuzzy AHP with respect to high oil prices [41,42]. Various studies have utilized the relative importance-based AHP and fuzzy AHP models for technology and service assessments. Most studies have assessed the reliability of fuzzy AHP models. In research based on AHP, all assessment criteria were analyzed through relative importance surveys; however, several studies focused on absolute importance assessment in consideration of the fact that there would be numerous faithless responses and relative assessment survey questions in the case of a significant number of assessment alternatives.
The fuzzy AHP utilized in this study is a complementary formula implemented by Laarhoven and Pedrycz [43] using a triangular fuzzy number (TFN) based on the AHP of Saaty [36]. Here, the TFN is expressed in a triangular form with three dots (l, m, u) (l = lower bound, m = median, u = upper bound), and the area is the size of the TFN [41,44,45]. This study uses the fuzzy scale presented in Table 1 to derive a TFN. This scale has been applied in numerous research models of fuzzy AHP, where the fuzzy AHP expansion analysis technique has been presented [41,45,46,47].

Table 1.
Fuzzy scale.
To derive the assessment criteria for each class, the fuzzy scale in Table 1 was used to calculate the average value of the weight based on pairwise comparisons. Using Equations (1)–(4), the TFN value of the ith property was derived, and the eigenvector normalization value of the minimum value was determined for the defuzzification of TFN for each assessment criterion [41,45]. Equation (1) shows the sum of the relative evaluation scores before fuzzification for each item, and Equation (2) shows triangular fuzzification according to l, m, and u values according to the fuzz scale. Equation (3) shows the sum of the relative evaluation items of each evaluation standard for l, m, and u values, and Equation (4) shows the final TFN value obtained by taking the reciprocal of the sum of l, m, and u.
The fuzzy scale listed in Table 1 was used to derive an alternative assessment. The alternative assessment included numerous assessment criteria, unlike the assessment standard, and it was difficult to maintain reliability and consistency, as it increased survey fatigue during relative evaluation. Therefore, this study performed an absolute assessment based on a five-point Likert scale to increase the immediacy of each question and the number of survey questions. Because determining absolute importance involves expression at three points, a centroid method based on the TFN, which is simple to use and easy to mathematically analyze, was applied. The fuzzy value of n TFNs for acquiring TFN A is shown in Equation (5):
The formula for defuzzification used to express the generated fuzzy set as real values is as follows:
where g is the centroid value, and a, b, and c are triangular fuzzy numbers derived from Equation (6). The alternative attribute value of the triangular fuzzy number can be derived by determining the corresponding centroid value [44,48].
Based on the centroid value determined for each alternative, the decision value (DV) that applies the fuzzy AHP assessment criteria weight is determined using Equation (7). The importance of each alternative is compared through the DV, and decision-making can be supported based on this. Here, is the DV value of the ith dynamic information utilization service, and is the importance (weighting) value of the assessment factor x determined through Equations (1)–(4) based on a pairwise comparison. Thus, is valid. , , and are the TFNs a, b, and c, respectively, of the assessment factor x of the ith service. The assessment factor x is expressed as , , and ; is the assessment of purpose correspondence, is the assessment of service suitability, and is the assessment of service feasibility.
3. Service Model Selection
3.1. Service Model Selection
To establish an alternative for the assessment of the dynamic information utilization service of the control center, the service model was selected through focus group interviews (FGIs) based on relevant experts. FGIs are necessary to discover solutions from new perspectives or when relevant existing research is insufficient [49]. In particular, FGIs are a highly useful decision-making support method when comprehensive viewpoints and insights are necessary across various fields, as was the case in this study. Thus, this study included seven experts in the FGI expert group, including local government control center officials in the fields of spatial data and image analysis, system integration industries, and government think tanks. The FGIs consisted of two parts.
First, the discussion mainly focuses on the existing services provided by local government control centers. With local governments’ control center officials, the spatial characteristics, service sectors, and data collection sources for the dynamic information utilization service of control centers were discussed. Consequently, spatial attributes were classified into three categories–main roads, backside roads, and metropolitan controls–followed by the derivation of service sectors for each space, such as road/traffic, road management, pedestrian safety, and facility safety.
Thereafter, the collected data were classified into mobile objects, such as pedestrians, vehicles, two-wheeled vehicles, bicycles, and sharing mobility (electric scooter); fixed objects, such as road surfaces, road facilities, and illegal structures; and static data, such as communication, bus, and taxi operation data.
Finally, system connection data operated by local governments, such as ITS and crime prevention monitoring systems, were derived. A total of 17 service models were established based on spatial characteristics and service sectors [10].
The service model selected as the primary model is a service already operated by the control center, and it lacks expansion in terms of research and commercialization. Experts have determined that a more active dynamic information utilization service should be derived, which includes the reflection of recent issues, trends, and future technology use. Thus, in the second FGI, additional service model selections based on each spatial characteristic and service sector criterion were discussed. As a result, 11 services were added, including services reflecting future mobility trends such as autonomous driving and shared mobility, living SOC management service for citizens’ life convenience, and urban attractiveness services such as streetscape and landscape; a total of 28 service models were finally selected (Table 2).
Table 2.
Service model.
3.2. SWOT Analysis
In order to play a role as a practical public service, an accurate diagnosis of the dynamic object information utilization service should be made. Therefore, a SWOT analysis was performed on the dynamic object information utilization service in the control center covering the previously selected service model. First, the strength factor of the dynamic object information utilization service is that all dynamic objects detected based on the city control center can be identified. It is possible to control without blind spots by using CCTV, which is a fixed facility, and a drone, which is a mobile device. In addition, sustainable city control is possible, because it includes future-oriented elements as well as currently operating control technologies and targets. Second, the weak point is the construction and operation costs that will be incurred for each service model. CCTV, which is the main means of detecting dynamic object information, does not add cost because it utilizes existing infrastructure. However, in the case of drones to control CCTV blind spots, it is necessary to establish a drone station and a drone control system that can control and manage drones as well as product cost. In addition, it is necessary to build a server and control/visualization system for secondary analysis such as video and space. It is judged that it is necessary to select a service model considering these HW and SW costs. In particular, small local governments need support from the central government because of the lack of budget. Another weakness is that these local government control services are the government-led, unilateral, and uniform introduction of services. It is necessary to select a service type based on spatial characteristics such as city scale, characteristics of local government, and residence type. Third, the opportunity factor is the rapid development of advanced technology to implement the proposed dynamic object utilization service. The rapid development of advanced technologies such as AI, digital twins, and drones, which are essential for the realization of this service, leads to a reduction in construction and operation costs. This is expected to be a positive factor in terms of service expansion and commercialization. Fourth, the threat factor is the problem of personal privacy exposure due to the large number of video-based service models. In the case of Korea, citizens’ awareness tends to value safety services more than personal privacy, but a more cautious approach is needed. One way is to promote the introduction of technology that anonymizes personal information. Based on the SWOT analysis of dynamic object information utilization services, it seems that additional discussions for service operation are needed. This is dealt with in-depth in the discussion section.
3.3. Hypothesis Setting
This study intends to establish several hypotheses about the finally selected service model. First, the new service model will have a lower importance than the service set in the first phase. Since the primary setting service model is operated by the existing control center, it is an essential operation item. New service models are likely to be pushed back in policy priorities as they are mainly focused on grafting future technologies and additional services for citizen convenience. Second, in large cities, the road traffic on the main road and pedestrian safety services on the backside road will be more important than in small and medium-sized cities. Since large cities have high population densities, it is judged that the importance of services for monitoring traffic volume and pedestrian safety will be high. Third, in small and medium-sized cities, the importance of facility safety and living SOC management services will be higher than in large cities. This is because small and medium-sized cities lack facilities management, control infrastructure, and living convenience services for citizens compared to large cities. In the discussion chapter, the hypotheses and analysis results are contrasted for comparative analysis.
4. Empirical Analysis
4.1. Analysis Outline
To assess the dynamic information utilization service based on fuzzy AHP, we conducted an expert survey targeting the control center officials of local governments. The survey was conducted face-to-face or via e-mail by the researcher directly with the person in charge of the local government control center, and Microsoft Office Excel 2019 based on Windows 10 was used as an analysis tool. As this study assumes that dynamic information utilization services operate in local government CCTV control centers, the AHP survey target was set as the officials in charge of the corresponding task to increase the reliability of the analysis. To analyze the difference in importance for each urban scale, we acquired 26 effective samples, including 10 public officials in charge of CCTV control centers in metropolitan areas such as Seoul and Busan, and 16 officials from other regional cities and districts. As the assessor selected and operated the actual relevant service, the level of understanding of the research and survey was significantly high, and the reliability of the analysis results could be enhanced. Despite the small number of respondents in the AHP research, the sample size is not significantly problematic as long as expertise and logical consistency are assumed [50].
The classification process, which is an important process in AHP analysis, must systematically design decision-making details, such as assessment criteria and class structures between alternatives, to achieve the final purpose. The 1st class, which is the goal of this research, is the selection of a dynamic information utilization service based on control centers, and the assessment criteria that evaluate the alternatives are classified as second and third classes; the fourth class is the assessment alternative of the 28 previously selected service models. The final class structure reflecting this is shown in Figure 1. The 4th class in Figure 1 refers to the service model. This study reviews the major public guidelines that assess technology and service value in South Korea to select the assessment criteria that correspond to classes 2 and 3. A review of the smart city service verification system [51], the Korea Technology Finance Corporation’s technology evaluation [52], and the technology value assessment manual by the Ministry of Land, Infrastructure, and Transport [53] showed that the corresponding guidelines commonly have assessment criteria, such as compliance, technology evaluation, marketability, and business feasibility, based on the assessment purpose. Considering that this research is at the service model establishment stage before the actual technology and service operation, the rights, business feasibility, and functional evaluation criteria necessary during the commercialization stage were excluded from the previously surveyed criteria. Finally, three large classification assessment criteria, namely, compliance with purpose, service suitability, and service feasibility, were selected. The sub-classification assessment criteria show that compliance with purpose includes the effectiveness of service provision and correspondence to relevant policies, while service suitability consists of the competitiveness of existing services and service/market growth. For service feasibility, economic efficiency and risk factor/field application potential were selected.
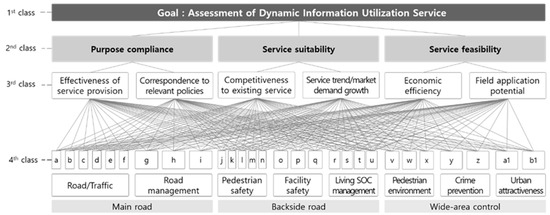
Figure 1.
Hierarchy structure.
4.2. Assessment Criteria Analysis
The consistency of the survey was validated prior to the analysis of the assessment criteria. The consistency ratio (CR) is calculated according to the comparison matrix Consistency Index (CI) and size n and is determined using the average random index of multiple CIs [50]. In general, if CR is smaller than 0.1, consistency is moderate, and CR = 0.1–0.2 is also considered to be not significantly problematic. The CI of the 26 samples used in this study showed CI = 0.051, indicating a significantly good consistency.
For the pairwise comparison analysis of the assessment criteria classes, Class 2 and Class 3, a matrix was composed based on the aforementioned fuzzy scale, followed by the determination of the geometric average value of the fuzzy preference. Based on this, the final weight, which is the eigenvector value of the minimum value, was determined for defuzzification, and the TFN value for each assessment criterion. The TFN values of Class 2 were “0.25, 0.31, 0.38” for purpose compliance, “0.24, 0.29, 0.36” for service suitability, and “0.31, 0.40, 0.50” for service feasibility (Table 3). The normalized weight derived based on this was the highest in service feasibility at 0.388, followed by purpose compliance at 0.317, and service suitability at 0.295. It is important to create various conditions for implementing actual services s uch as securing a budget for service model construction and operations, field application risks, and management operations was highly assessed.
Table 3.
2nd class TFN & weight calculation result.
The TFN for each assessment criterion and weight were determined for Class 3 (Table 4). As for the TFN for purpose compliance, the values were “0.48, 0.58, 0.70” for the effectiveness of service provision and “0.36, 0.42, 0.50” for correspondence to relevant policies; the resultant weight was 0.571 for the effectiveness of service provision, which was relatively higher than 0.429 for correspondence to relevant policies. Thus, the importance of effectiveness based on service purposes such as accident prevention, real-time situation response, and user convenience provision was found to be higher than that of relevant government policies. As for the TFN for service suitability, the values were “0.41, 0.46, 0.52” for competitiveness to existing service and “0.48, 0.54, 0.61” for service/market growth; the weight of service/market growth was 0.539, which was higher than the weight of 0.461 for competitiveness to existing service. Thus, the growth potential of services and the relevant markets is an important aspect of service selection. Lastly, in terms of the TFN for service feasibility, the values were “0.37, 0.45, 0.54” for economic efficiency and “0.44, 0.55, 0.68” for field application potential; the weight was 0.546 for field application potential, which was higher than 0.454 for economic efficiency. Thus, the importance of the field application potential, such as service operations in the field, personal information protection, and risk management, including administrative delays, was highly assessed.
Table 4.
Third class TFN and weight calculation result.
The order of importance was derived by multiplying the Class 2 and Class 3 assessment criteria by the weights: the field application potential was highest at 0.212, followed by the effectiveness of service provision (0.181), economic efficiency (0.176), service/market growth (0.159), competitiveness with existing services (0.136), and correspondence with relevant policies (0.136) (Table 5). Thus, a service model with significant service effects is necessary, as is the securement of economic efficiency and field application potential for realizing services such as risk management, cooperation with relevant institutions, and government support.
Table 5.
Analysis results of assessment criteria.
4.3. Service Assessment Analysis
4.3.1. Calculation Processes
In this study, the centroid value was used to determine the absolute importance of assessment alternatives. The average value of the triangular fuzzy number, transformed based on the fuzzy scale for each assessment criterion, was determined. For example, the average values of the triangular fuzzy numbers—the lower bound a, median b, and upper bound c—of the field application potential among the service model’s road congestion information (A-1) from the total respondents were calculated using Equation (5).
The centroid value (g) of 3.16 was calculated using Equation (6) based on the derived road congestion information) and TFN values of the field application potential (2.67, 3.15, 3.65).
The centroid value for each assessment criterion of the 28 service models was calculated, and the value of the final mathematical decision-making model, DV, which applied the weights for each assessment criterion derived above, was determined. For example, the DV value of road congestion information (A-1) was calculated using Equation (7) as follows:
4.3.2. Analysis Results
An assessment analysis was performed for the dynamic information utilization service of control centers for each classified urban scale of metropolitan areas and regional, medium, and small cities based on the service assessment calculation process. Table 6 presents the DV for each service model and the order for metropolitan areas and regional, medium, and small cities. The overall service model importance tendency was similar in metropolitan and regional cities. In particular, school zone pedestrian environment analysis data, which is a recent social issue in South Korea, showed the highest DV in metropolitan areas (third rank, 3.04), followed by small and medium cities (third rank, 2.91), while the lowland inundation information service showed the highest DV in metropolitan areas (second rank, 3.06), followed by medium and small cities (fifth rank, 2.89). It was determined that various traffic accidents in school zones and inundation accidents owing to heavy rainfall in the summer of 2022 would have significantly affected the results. These social issues significantly contribute to political decision-making, regardless of the urban scale. The overall tendency indicated that the importance of service models related to traffic accident prevention and safety, including pedestrians and vehicles, was high. In the case of the additionally selected new service models, autonomous driving support information and backside road congestion ranked in the middle, whereas the rest ranked low. The new service model is mainly a secondary analysis of information for preventing accidents rather than emergencies, and it was an afterthought for control center officials in terms of urgency.
Table 6.
Analysis results of service model alternative assessment.
The differences in importance between metropolitan areas and medium and small cities are as follows: Metropolitan areas showed high importance for pedestrian safety services on backside roads, such as illegal parking information (DV 3.32, first rank) and unexpected situation information (DV 2.92, fifth rank), whereas medium and small cities showed relatively high importance for main road traffic services, such as road congestion information (DV 3.04, first rank) and unexpected incident information (DV 2.85, sixth rank). Given the characteristics of metropolitan areas with high population densities, numerous major factors threaten pedestrian safety, such as vehicles, bicycles, and electric scooters.
In the case of the two-wheeler/shared mobility analysis data (C-3), metropolitan areas ranked 15th (DV 2.51), and medium and small cities ranked 27th (DV 2.23). For pedestrian congestion information, metropolitan areas ranked 20th (DV 2.27) and medium and small cities ranked 27th (DV 2.23). As such, it was possible to identify the differences between the relevant service models in metropolitan areas and medium and small cities. In the case of medium and small cities, the order of main road congestion information (DV 3.04, first rank) and backside congestion (DV 2.89, fourth rank) was significantly higher than in metropolitan areas. This was understood as the alienation of relevant data in medium and small cities owing to road traffic information service operations, mainly in metropolitan areas.
The importance of facility safety services on backside roads was relatively higher in medium- and small-sized cities than in metropolitan areas. This was attributed to the difficulty in effectively controlling illegal private road use or installations, owing to the lack of onsite enforcement personnel and surveillance system infrastructure in medium and small cities. Similarly, the importance of fire occurrence information detection and structural safety state information monitoring in medium and small cities is considered to be higher owing to the lack of control infrastructure.
Among the secondarily selected new services, metropolitan participants in the survey considered road traffic and pedestrian safety services such as two-wheeler/shared mobility analysis information, autonomous driving support information, and pedestrian congestion information to be important. In metropolitan areas, future mobility demand is considered based on the overall sound control infrastructure, and the demand for a more effective and scientific control service is reflected. The importance of living SOC management and urban attractiveness services was slightly higher in medium and small cities. In medium and small cities, urban attractiveness was interpreted as highly important from the perspective of urban vitalization and living SOC management from the perspective of securing residents’ living services.
5. Discussion
This study assessed the dynamic information utilization service operable in control centers at each urban scale. An important keyword is South Korea’s control center, which is characterized by a centralized supervisory system. In South Korea, 226 local governments have CCTV control centers that can monitor 1,330,000 (as of 2020) CCTVs. Based on type, there were 704, 134 crime prevention CCTV, which accounted for 52.7%, 575,146 (43.0%) facility safety and fire prevention CCTVs, 41,745 (3.1%) traffic control CCTVs, and 15,628 (1.2%) CCTVs for traffic data collection, analysis, and provision. The control center provides citizens with various safety services based on the corresponding CCTVs related to crime prevention, transportation, fire, and inundation. However, as mentioned in the Section 1, services are uniform and mainly based on short-term performance, without considering service importance and dynamic object information. In addition to the dynamic information utilization service model presented in this research, it is necessary to resolve CCTV shadow areas and reflect on rapidly developing future technologies. South Korea uses 50 CCTV monitors per control official as the standard for determining the number of controllers in a control center. However, increasing the number of control officials based on a higher number of CCTVs is impossible, given the limited budget of local governments. Recently, studies criticizing the inefficiency of Korea’s CCTV operation and the lack of control personnel are also increasing [54,55]. For example, the number of monitored CCTVs per control officer in Seoul is 958, which exceeds the optimal level by a factor of 19. Thus, the demand for intelligent control through the application of AI to CCTV images has increased. Convergent utilization services must be sought with future technologies, such as robots and autonomous driving, along with the application of recent technologies (e.g., AI, big data, digital twins, and drones). As controlling the shadow areas of CCTV will be possible with the use of drones and robots, additional service model discovery and demonstration of the service that reflects them are necessary.
This research presented 28 dynamic information utilization service models and a decision-making support method for service selection; however, public budgets must be secured for service implementation in local government control centers. Although the 28 services presented in this study can be operated based on existing CCTV images without additional sensor installation, a drone is required to cover CCTV shadow areas. In this regard, a study dealing with the issue of effective coverage through mixed operation of fixed CCTV and patrol drones has also been conducted [56]. However, to implement these services, operating systems (SW) and servers (HW) must be implemented as well as field equipment, which may incur operational and maintenance costs. As local governments spend significant funds on maintaining existing control centers, it is difficult to secure additional funds to implement these new services. In medium and small cities where financial circumstances are weaker, support from the central government, such as government-matched funds and contest projects, is necessary. In addition to securing the public budget, the demands of residents must be reflected in the selection of service models. Thus far, control services have only been introduced through unilateral decision-making by public institutions and citizens’ opinions have been poorly reflected. Thus, services appropriate for residents have not been provided, and conflicts have arisen between public institutions and residents. Studies suggesting citizen participation in the public policy decision-making process are continuously being proposed [57,58]. As a dynamic information utilization service is implemented to ensure the safety of residents, and personal information issues may occur due to CCTV, it is necessary to identify residents’ demands. For this purpose, realistic measures, such as the establishment of a public and resident governance council for the operation of the control service, are necessary, and residents’ preference assessment of the service models must be followed.
It is necessary to select an optimal service model for each local government, considering the urban scale, local government control infrastructure, and field circumstances. This research presents the implications of dynamic information utilization service assessment by classifying metropolitan areas and regional, medium, and small cities. This is academically significant in that a difference in service preferences was identified for each classified urban scale. However, for field applications, a detailed survey of the current state must entail not only the urban scale but also the characteristics of the cities of each local government, control infrastructure level, residential types, and spatial characteristics. The city characteristics of each local government, including tourism, education, business, nature, and development orientation, differ. In tourist cities, a strategy primarily based on urban attractiveness and pedestrian congestion information services may be necessary; in educational cities, strategies based on school zones and pedestrian safety services may be necessary; in business cities, strategies based on road traffic and autonomous driving support services may be required; and in natural cities, strategies based on fire occurrence and inundation information services may be required. As the control infrastructure and control centers differ for each local government, the current state of the local governments’ equipment by type and relevant project implementation must be investigated in detail. A multidata-based convergence service may be required through connections with relevant projects. In addition, the importance of each service may differ according to the type of residence and spatial characteristics such as high-density apartment complexes, low-rise residences, and single-room neighborhoods. In regions where the foundation of living facilities is weak, the living SOC management service can be set as the major service, and it is possible to establish a strategy for maximizing intelligent platform-based scientific control service operations in areas where systematic spatial management is possible (e.g., apartment complexes).
The following is a comparison of the hypotheses established above and the results of the analysis. The first hypothesis is that ‘the new service model will have a lower importance than the service set in the first phase’. Overall, the new service model tends to appear less important than the existing primary service model. As an example, looking at road traffic services on the main road, new services such as two-wheeler/shared mobility analytics (A-3) and autonomous driving support information (A-6) were ranked lower than the existing primary service models such as road congestion information (A-1), emergency information (A-2), etc. As the reason for setting the hypothesis, it is interpreted that the primary service model, which is an existing essential operation item, is evaluated as more important than new services, which are future technology grafting and citizen convenience additional services. An exception was the case where backside road congestion (E-3) was selected as fourth in a small and medium-sized city. The second hypothesis is ‘in large cities, the importance of road traffic on the main road and pedestrian safety services on backside road will be higher than in small and medium-sized cities’. Pedestrian safety services on backside roads were rated higher in large cities than in small and medium-sized cities, as hypothesized. In particular, illegal parking information (C-2) and unexpected incident information (C-1) were ranked first and fifth in the overall ranking. This was able to grasp the importance of pedestrian safety services according to population density in large cities. However, the road traffic service on the main road did not show a tendency toward large cities. Rather, road congestion information (A-1) was ranked first in the overall ranking in small and medium-sized cities. It is interpreted as reflecting the needs of small and medium-sized cities, which are somewhat insufficient compared to large cities that already have well-equipped traffic control infrastructure/services. The third hypothesis is that ‘in small and medium-sized cities, the importance of facility safety and living SOC management services will be higher than in large cities’. Since the importance of small and medium-sized cities in all detailed service models of facility safety (D-1, D-2, D-3) and living SOC management (E-1, E-2, E-3, E-4) was high, this hypothesis was accepted. As the basis for setting the hypothesis, it is interpreted that small and medium-sized cities lack facility management/control infrastructure and living services compared to large cities.
The implications of this study are summarized as follows. This research presents a dynamic information utilization service model operable in actual local government control centers and a selection process. This is academically and practically significant in that actual control center officials were included in the expert group. The results can act as a reference for decision-making in selecting dynamic information utilization services from local government control centers. In addition, the spatial range and collected data controlled by local governments were reviewed, differentiating this study from previous studies that focused only on certain sectors. It was possible to confirm the differences in service preferences based on metropolitan areas and medium and small cities classified at urban scales. An optimal service model selection that considers these differences is necessary for each local government.
The limitations of this study are as follows. First, as this research focused on the assessment of services based on local government control centers, we could not reflect opinions from private companies. Although local governments implement dynamic information utilization services, private companies develop, operate, and maintain actual services; thus, their opinions must be considered in future research. Second, this study analyzes the difference in service importance for each urban scale, classified into metropolitan areas and medium and small cities. However, a more detailed classification system (e.g., the characteristics of the cities of each local government, control infrastructure level, and residential type) is not available. The purpose of this study was to suggest a method for selecting a service model. In the future, it will be necessary to expand the regional scope and follow-up research through a detailed current status survey of the local government. Third, because this study selected a summarized dynamic information utilization service of the control center, it could not suggest specific service implementation methods (e.g., necessary data, connection system, service range, and predicted costs for each service). Fourth, in relation to the research methodology, there is a difference in the number of samples between large cities and small and medium-sized cities, and the total number of samples is rather small at 26. Thus, subsequent research must overcome the limitations of this study and promote its practical use for the effective and efficient operation of local government control centers such as service implementation plans based on a detailed status survey by city, service architecture design, economic feasibility analysis, etc.
6. Conclusions
This study selected a dynamic information utilization service model by considering the spatial characteristics, service sector, data collection sources, and data types based on dynamic object information controlled by local governments. Based on this, we assessed services while targeting local government control center officials and presented a decision-making support and service implementation method for each urban scale. The results are summarized as follows. The dynamic information utilization service model is broadly classified into main roads, backside roads, and local controls, by considering the characteristics of the spaces monitored by the CCTV control centers of local governments. The service sector was identified for each spatial characteristic. The main road was specifically categorized into road, traffic, and road management; the backside road into pedestrian safety, facility safety, and living SOC management; and local control into the pedestrian environment, crime prevention safety, and urban attractiveness. Based on the classifications, the fuzzy AHP technique was applied to assess the service model for each assessment criterion and urban scale. Among the assessment criteria, the importance of service feasibility, particularly field application potential, was the highest. Service promotion that accounts for onsite service implementation potential, government support, cooperation with relevant institutions, and risk management is necessary. For service assessment, services relevant to recent incidents in South Korea (e.g., school zone traffic accidents and lowland inundation) were found to be highly important. Thus, these social issues are significant factors in policy decision-making.
In comparing the results for each urban scale, the importance of pedestrian safety services on backside roads and main road traffic services was found to be important in the metropolitan area and regional, medium, and small cities, respectively. This was attributed to metropolitan cities with high population density, and medium and small cities experiencing alienated traffic information. In medium and small cities, facility management services were assessed relatively highly owing to the poor conditions of regional cities with a lack of supervising personnel in the field and a lack of surveillance system infrastructure. In metropolitan areas, the importance of future services, such as mobility analysis information and autonomous driving support information, is high. This was owing to the demand for a more scientific control service and future mobility based on a sound control infrastructure. In medium and small cities, the importance of urban attractiveness services was high in terms of urban vitalization, and the importance of living SOC management services was highly assessed in terms of securing residents’ living services.
Through this thesis, it was possible to present a method for selecting a service using practical dynamic object information in a local government control center. Finally, 28 service models, the Fuzzy AHP methodology to evaluate them, and the optimal service introduction plan for each city size were presented. Through this, it was possible to confirm the difference in service preference according to large cities and local small and medium-sized cities, and it is judged that it is necessary to select the optimal service model for each local government considering this. It is hoped that related follow-up research will be actively conducted so that people can lead a safe and convenient life.
Author Contributions
Conceptualization, W.C. and J.Y.; methodology, W.C., J.Y. and T.K.; software, W.C. and J.N.; validation, J.N. and J.Y.; formal analysis, W.C. and J.N.; investigation, W.C.; resources, W.C.; data curation, T.K. and J.Y.; writing—original draft preparation, W.C.; writing—review and editing, W.C. and J.Y.; visualization, W.C. and J.Y.; supervision, J.Y.; project administration, W.C. All authors have read and agreed to the published version of the manuscript.
Funding
This work was supported by a Korea Agency for Infrastructure Technology Advancement (KAIA) grant funded by the Ministry of Land, Infrastructure, and Transport (Grant RS-2022-00143782).
Data Availability Statement
Not applicable.
Conflicts of Interest
The authors declare no conflict of interest.
References
- Kim, J.; Yang, B. A Smart City Service Business Model: Focusing on Transportation Services. Sustainability 2021, 13, 10832. [Google Scholar] [CrossRef]
- Laufs, J.; Borrion, H.; Bradford, B. Security and the smart city: A systematic review. Sustain. Cities Soc. 2020, 55, 102023. [Google Scholar] [CrossRef]
- Park, M.; Lee, H. Smart City Crime Prevention Services: The Incheon Free Economic Zone Case. Sustainability 2020, 12, 5658. [Google Scholar] [CrossRef]
- Levine, E.S.; Tisch, J.; Tasso, A.; Joy, M. The New York City Police Department’s domain awareness system. Interfaces 2017, 47, 70–84. [Google Scholar] [CrossRef]
- Li, Z.; Guo, Y.; Yarime, M.; Wu, X. Policy designs for adaptive governance of disruptive technologies: The case of facial recognition technology (FRT) in China. Policy Des. Pract. 2023, 6, 27–40. [Google Scholar] [CrossRef]
- Lee, S.; Hwang, G. A study on the functions and requirements of the smart city integrated operation center and the integrated platform, which is the center operation system. J. Korean Inst. Commun. Sci. 2017, 34, 9–12. [Google Scholar]
- Shin, J.H.; Kim, S.W. Local autonomous entity CPTED strategy improvement plan by utilizing crime prevention officer (CPO). Korean Police Stud. Rev. 2017, 16, 179–200. [Google Scholar] [CrossRef]
- Shim, M.S. A study on the development direction of CPTED policy in communities: Based on cooperation between the police and the local governments. Korean Assoc. Police Sci. Rev. 2017, 19, 37–64. [Google Scholar] [CrossRef]
- Kim, D.I.; Kim, C.S.; Yoon, T.G.; Park, H.H. Risk management system establishment strategies through apartment house crime prevention CCTV utilization and analysis of problem factors: Focusing on safety managers. J. Converg. Cons. 2023, 6, 77–89. [Google Scholar]
- Choi, W.C.; Youn, J.H.; Na, J.Y. A study on selection of life SOC control service model for local government based on dynamic Information. J. Korea Acad. -Ind. Coop. Soc. 2022, 23, 793–802. [Google Scholar]
- Kirimtat, A.; Krejcar, O.; Kertesz, A.; Tasgetiren, M.F. Future Trends and Current State of Smart City Concepts: A Survey. IEEE Access 2020, 8, 86448–86467. [Google Scholar] [CrossRef]
- Rani, S.; Mishra, R.K.; Usman, M.; Kataria, A.; Kumar, P.; Bhambri, P.; Mishra, A.K. Amalgamation of Advanced Technologies for Sustainable Development of Smart City Environment: A Review. IEEE Access 2021, 9, 150060–150087. [Google Scholar] [CrossRef]
- Kim, J. Smart city trends: A focus on 5 countries and 15 companies. Cities 2022, 123, 103551. [Google Scholar] [CrossRef]
- Cho, K.; Cho, D. Autonomous driving assistance with dynamic objects using traffic surveillance cameras. Appl. Sci. 2022, 12, 6247. [Google Scholar] [CrossRef]
- Kim, S.H.; Lee, J.K.; Yu, S.B.; Jeong, K.H.; Park, J.T. Cooperative automated vehicle system for avoiding road work zone using dynamic infrastructure information. Trans. KSAE 2020, 28, 167–177. [Google Scholar] [CrossRef]
- Roh, C.G.; Kim, H.S. Dynamic information platform for connected automated driving at the urban road. Transp. Technol. Policy 2019, 16, 71–78. [Google Scholar]
- Roh, C.G.; Kim, H.S.; Im, I.J. Evaluation of LDM (Local Dynamic Map) service based on a role in cooperative autonomous driving with a road. J. Korea Inst. Intell. Transp. Syst. 2022, 21, 258–272. [Google Scholar] [CrossRef]
- Yang, K.; Zhang, W.; Le, C.; Wang, X. Accurate location in dynamic traffic environment using semantic information and probabilistic data association. Sensors 2022, 22, 5042. [Google Scholar] [CrossRef]
- Cho, K.C. Dynamic interest management in web simulation for intelligent transportation system. J. Korea Soc. Simul. 2019, 28, 15–22. [Google Scholar] [CrossRef]
- Ko, H.G.; Lee, J.S.; Kim, J.H. A study on provision of real-time safety information considering real-time vehicular data and road traffic condition. KSCE J. Civ. Eng. 2012, 32, 291–303. [Google Scholar] [CrossRef]
- Jeon, G.S.; Kim, T.W.; Lee, H.M.; Jang, J.A. Dynamic traffic information provision and dismissal strategy for before and after traffic incident. J. KIECS 2021, 16, 867–877. [Google Scholar] [CrossRef]
- Song, J.Y. A study for object analysis based on context awareness scenario. J. Korea Acad.-Ind. Coop. Soc. 2014, 15, 3153–3158. [Google Scholar] [CrossRef]
- Chen, C.; Ray, S.; Mubarak, S. Automated monitoring for security camera networks: Promise from computer vision labs. Secur. J. 2021, 34, 389–409. [Google Scholar] [CrossRef]
- Sung, C.S.; Park, J.Y. Design of an intelligent video surveillance system for crime prevention: Applying deep learning technology. Multimed. Tools Appl. 2021, 80, 34297–34309. [Google Scholar] [CrossRef]
- Park, S.J.; Cho, k.; Im, J.H.; Kim, M.C. Location tracking and visualization of dynamic objects using CCTV images. J. Cadastre Land InformatiX 2021, 51, 53–65. [Google Scholar] [CrossRef]
- Park, S.J.; Cho, K.J.; Im, H.M.; Kim, C. Dynamic object detection and tracking technology trends in CCTV images. Rev. Korean Soc. Internet Inf. 2017, 18, 39–43. [Google Scholar]
- Kim, J.H.; Lee, T.H.; Han, Y.; Byun, H.J. A study on the design and implementation of multi-disaster drone system using deep learning-based object recognition and optimal path planning. KIPS Trans. Comput. Commun. Syst. 2021, 10, 117–122. [Google Scholar] [CrossRef]
- Kang, J.W.; Kim, M.S. A Comparative study on mashup performance of large amounts of spatial data and real-time data using various map platforms. J. Cadastre Land InformatiX 2017, 47, 49–60. [Google Scholar] [CrossRef]
- Lim, S.Y. Movable image control system using user’s tracking information. J. Digit. Des. 2015, 15, 431–438. [Google Scholar] [CrossRef]
- Catlett, C.; Cesario, E.; Talia, D.; Vinci, A. Spatio-temporal crime predictions in smart cities: A data-driven approach and experiments. Pervasive Mob. Comput. 2019, 53, 62–74. [Google Scholar] [CrossRef]
- Cai, Y.; Li, D.; Wang, Y. Intelligent crime prevention and control big data analysis system based on imaging and capsule network model. Neural Process. Lett. 2021, 53, 2485–2499. [Google Scholar] [CrossRef]
- Socha, R.; Kogut, B. Urban video surveillance as a tool to improve security in public spaces. Sustainability 2020, 12, 6210. [Google Scholar] [CrossRef]
- Sultana, T.; Wahid, K. IoT-Guard: Event-driven fog-based video surveillance system for real-time security management. IEEE Access 2019, 7, 134881–134894. [Google Scholar] [CrossRef]
- Kim, D.W.; Han, D.H.; Lee, M.S. An evaluation of the importance of living SOC major indicators in small and medium sized cities using AHP. J. Korean Inst. Rural Archit. 2020, 22, 35–42. [Google Scholar] [CrossRef]
- Park, J.W.; Kim, S. Development of importance evaluation system for national major infrastructures using AHP method. J. Korea Contents Assoc. 2015, 15, 532–543. [Google Scholar] [CrossRef]
- Saaty, T. Priority setting in complex problems. IEEE Trans. Eng. Manag. 1983, 30, 140–155. [Google Scholar] [CrossRef]
- Zadeh, L. Fuzzy sets. Inf. Control 1965, 8, 338–353. [Google Scholar] [CrossRef]
- Tozan, H. Fuzzy AHP based decision support system for technology selection in abrasive water jet cutting processes. Teh. Vjesn.-Tech. Gaz. 2011, 18, 187–191. [Google Scholar]
- Jaganathan, S.; Erinjeri, J.; Ker, J. Fuzzy analytic hierarchy process-based group decision support system to select and evaluate new manufacturing technologies. Int. J. Adv. Manuf. Technol. 2007, 32, 1253–1262. [Google Scholar] [CrossRef]
- Thengane, S.; Hoadley, A.; Bhattacharya, S.; Mitra, S.; Bandyopadhyay, S. Cost-benefit analysis of different hydrogen production technologies using AHP and Fuzzy AHP. Int. J. Hydrogen Energy 2014, 39, 15293–15306. [Google Scholar] [CrossRef]
- Lee, S.; Mogi, G.; Kim, J. Decision support for prioritizing energy technologies against high oil prices: A fuzzy analytic hierarchy process approach. J. Loss Prev. Process Ind. 2009, 22, 915–920. [Google Scholar] [CrossRef]
- Lee, S.; Mogi, G.; Kim, J. Prioritizing the weights of hydrogen energy technologies in the sector of the hydrogen economy by using a fuzzy AHP approach. Int. J. Hydrogen Energy 2011, 36, 1897–1902. [Google Scholar] [CrossRef]
- Laarhoven, P.; Pedrycz, W. A fuzzy extension of Saaty’s priority theory. Fuzzy Sets Syst. 1983, 11, 229–241. [Google Scholar] [CrossRef]
- Kim, J. Development of CTP Selection Methodology of Equipment Line Using AHP and Fuzzy Decision Model. Ph.D. Thesis, Kumoh National Institute of Technology, Gumi-si, Republic of Korea, 2019. [Google Scholar]
- Park, Y. Analyzing the Efficiency of SCM Using Fuzzy-AHP/DEA. Ph.D. Thesis, Yonsei University, Seoul, Republic of Korea, 2013. [Google Scholar]
- Chang, D. Applications of extent analysis method on fuzzy AHP. Eur. J. Oper. Res. 1996, 95, 649–655. [Google Scholar] [CrossRef]
- Kahraman, C.; Cebeci, U.; Ruan, D. Multi-attribute comparison of catering service companies using fuzzy AHP: The case of Turkey. Int. J. Prod. Econ. 2003, 87, 171–184. [Google Scholar] [CrossRef]
- You, J.H.; Jung, S.G.; Park, K.H.; Kim, K.T. Rank decision on regional environment assessment indicators using triangular fuzzy number—Focused on ecosystem. J. Environ. Impact Assess. 2006, 15, 395–406. [Google Scholar]
- Park, S.W.; Lee, W.J. Improvement of management of long-term care facilities through FGI. J. Korea Contents Assoc. 2019, 19, 587–597. [Google Scholar] [CrossRef]
- Kim, C.B.; Hong, W.H.; Jo, Y.B.; Kim, J.D. Extraction of evaluation criteria on technology and service related to smart grid and analysis of relative importance among evaluation criteria by AHP method. Korea Environ. Policy Adm. Soc. 2013, 21, 127–144. [Google Scholar] [CrossRef]
- Smart City Korea. Available online: http://smartcitysvc.kict.re.kr (accessed on 5 April 2023).
- Korea Technology Finance Corporation. 2021 KOTEC Annual Report; Korea Technology Finance Corporation: Busan, Republic of Korea, 2021. [Google Scholar]
- Ministry of Land, Infrastructure and Transport. 2021 Manual for Technology Valuation; Ministry of Land, Infrastructure and Transport: Sejong, Republic of Korea, 2021. [Google Scholar]
- Yeo, S.S.; Park, J.J.; Wang, S. A Study on the Spatial Information-Based Video Surveillance System for the Efficient Operation of CCTV. Korean Secur. J. 2022, 73, 231–253. [Google Scholar]
- Chang, I.S.; Park, J.C. Integrated CCTV Control Center: Operational Performance and Improvement Plan—Based on Gumi-si. Police Sci. J. 2018, 13, 211–246. [Google Scholar]
- Kim, M.S.; Kim, J.H. Effective Coverage Problem through a Mixed Operation of fixed CCTV and Patrol Drone. J. Mil. Oper. Res. Soc. Korea 2022, 48, 24–33. [Google Scholar]
- Hugel, S.; Davies, A.R. Public participation, engagement, and climate change adaptation: A review of the research literature. WIREs Clim. Chang. 2020, 11, e645. [Google Scholar] [CrossRef] [PubMed]
- Waddington, H.; Sonnenfeld, A.; Finetti, J.; Gaarder, M.; John, D.; Stevenson, J. Citizen engagement in public services in low- and middle-income countries: A mixed-methods systematic review of participation, inclusion, transparency and accountability (PITA) initiatives. Syst. Rev. 2019, 15, e1025. [Google Scholar] [CrossRef] [PubMed]

Disclaimer/Publisher’s Note: The statements, opinions and data contained in all publications are solely those of the individual author(s) and contributor(s) and not of MDPI and/or the editor(s). MDPI and/or the editor(s) disclaim responsibility for any injury to people or property resulting from any ideas, methods, instructions or products referred to in the content. |
© 2023 by the authors. Licensee MDPI, Basel, Switzerland. This article is an open access article distributed under the terms and conditions of the Creative Commons Attribution (CC BY) license (https://creativecommons.org/licenses/by/4.0/).