
Applicability of Technology Maturity Level Evaluation Methodologies within Small- and Medium-Sized Organizations: Prospects and Proposals

 ,
, 

Abstract
:1. Introduction
2. State of the Art
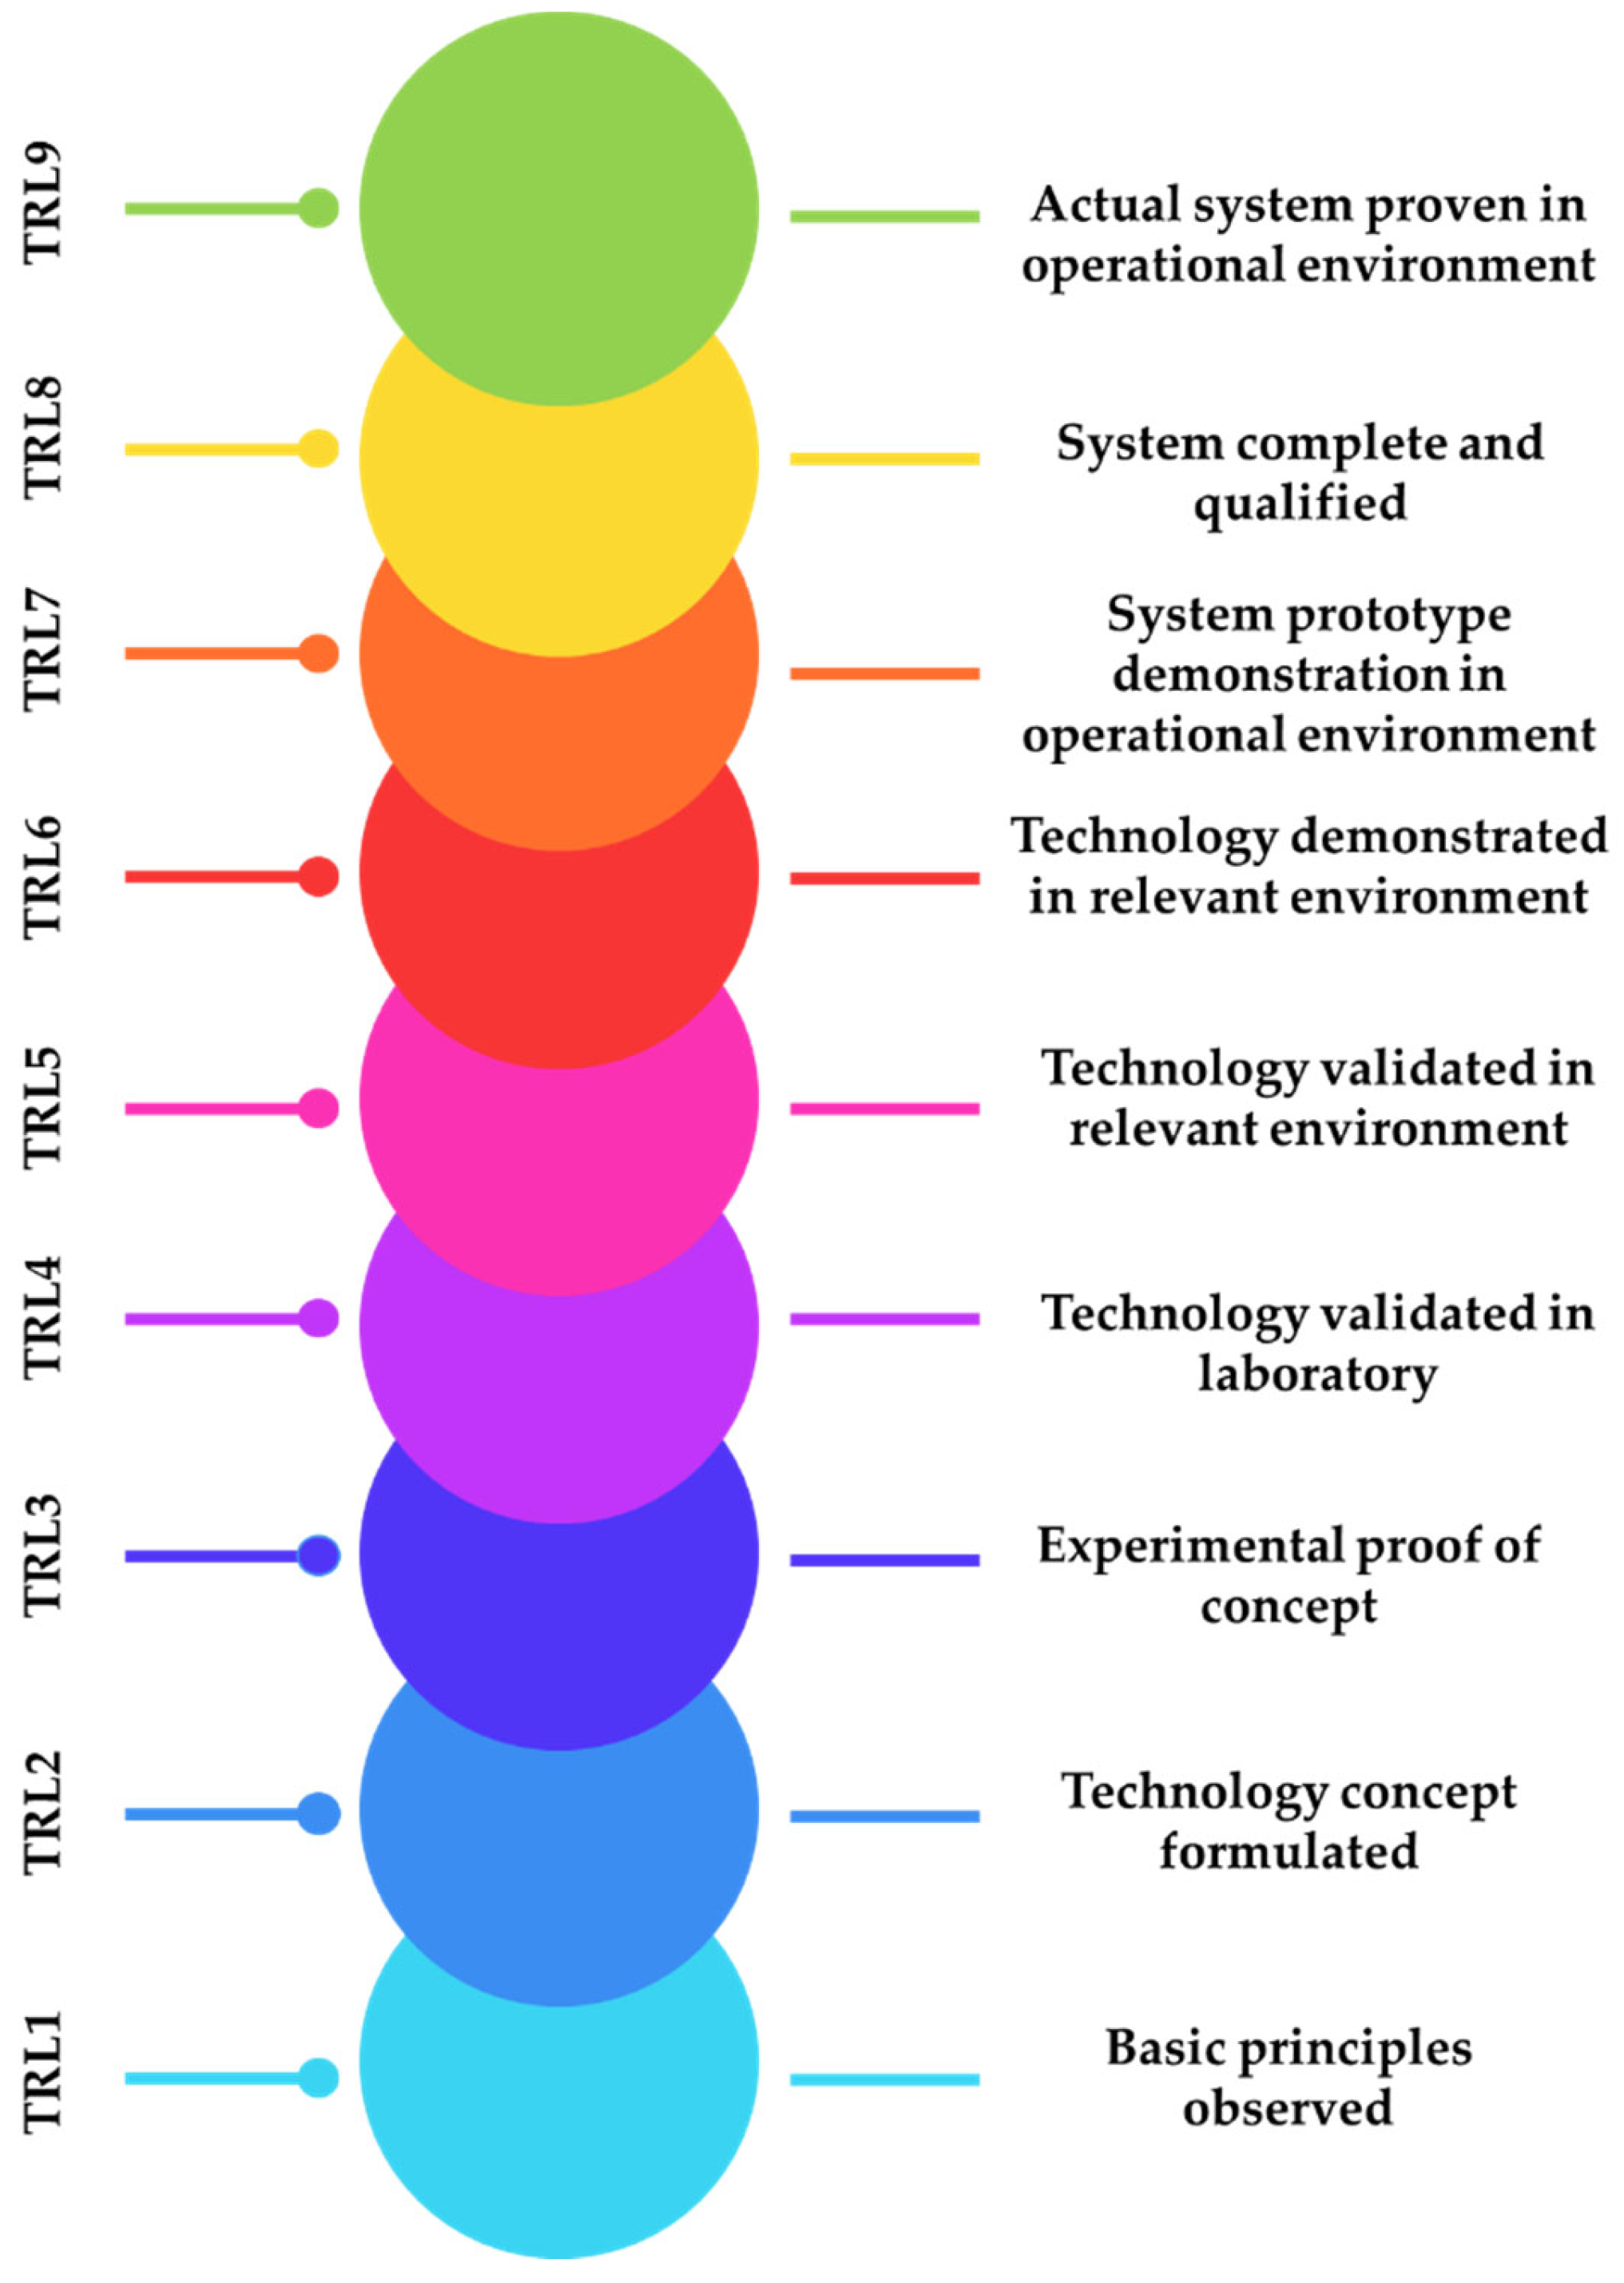
2.1. The Origin of Technology Readiness Level (TRL) and Its Potential
2.2. Techonology Maturity and Its Impact on Business Strategy
2.3. Literature Review of Existing Tools for TRL Estimation
- Guidelines for Technology Readiness procedure. These are based on nuclear energy [29] and include a set of templates where questions/indicators can be found to establish a technology maturity level based on TRLs. They only include rules to determine from TRL1 to TRL6 while TRL7, TRL8, and TRL9 are out of the evaluation. In addition, this method is only based on experts’ answers related to the template questions and on qualitative information.
- Strategic analysis for research and technology. Related to aerospace applications, an integrated methodology is developed named ITAM (Integrated Technology Analysis Methodology) [7]. It is based on a set of elements and parameters to quantify the state of a technology. However, this methodology only includes a new parameter as there are no data about factually establishing the current TRL.
- Calculator of technology level. This calculator gives the value of TRLs in the aerospace sector, based on NASA definitions [30]. This calculator is based on experts’ answers and now it is available for the whole TRL scale (TRL1–TRL9). Before, it was only able to calculate up to TRL6. Based on this calculator, the one found in reference [31] is the one applied in the defense sector in Turkey. A similar calculator based on an Excel tool was developed by Air Force Research Laboratory (AFRL) and is also available, but it is also dependent on experts’ answers [32].
2.3.1. Scientific Method for Determining Emerging Technologies (SmET)
- ISI Web of Knowledge—Science Innovation Index for Scholarly dataset.
- Thomson Innovation—Derwent World Patents Index (DWPI) for Patent dataset.
- Google News for Web News dataset.
- Google Maps for Business Products starts dataset.
- TRL1: If at least one paper is related to the technology (Scholarly dataset).
- TRL2: If two criteria are achieved: the first is if the number of publications is relevant and the second one is if the found papers are cited by a new paper. (Scholarly dataset).
- TRL3: If patent grants peak for the technology, irrespective of the assignee, and if first news data sources are prevalent (a relevant number of mentions). This is determined by the resulting values of three datasets (1. Scholarly dataset, 2. Patent Data, and 3. Web News data). The arithmetic average of three resulting values is calculated and this value (date) is when TRL3 is achieved. Dataset 1 is used to determine TRL2. Dataset 2 determines when patent grants achieve a crest regardless of assignee name. Dataset 3 resolves when the first technology-related news is widespread.
- TRL4: If a first patent for the technology is granted in any country (Patent dataset).
- TRL5 and/or TRL6: If the highest number of patent grants is made (Patent dataset).
- TRL7: This is determined by the results of three datasets (1. Patent data, 2. Web News data, and 3. Business/Product Starts data). The arithmetic average of three resulting values is calculated and this value (date) is when TRL7 is achieved. Dataset 1 determines when the patent grants’ crest by technology and assignee name is reached. Dataset 2 calculates when the first announcement of a product occurs, and Dataset 3 determinates when first announcement is produced in Business/Products Data.
- TRL8: If there is an announcement of a product offering or a product launch (Business/Products Starts dataset).
- TRL9: If there are multiple product offerings (Business/Products starts dataset).
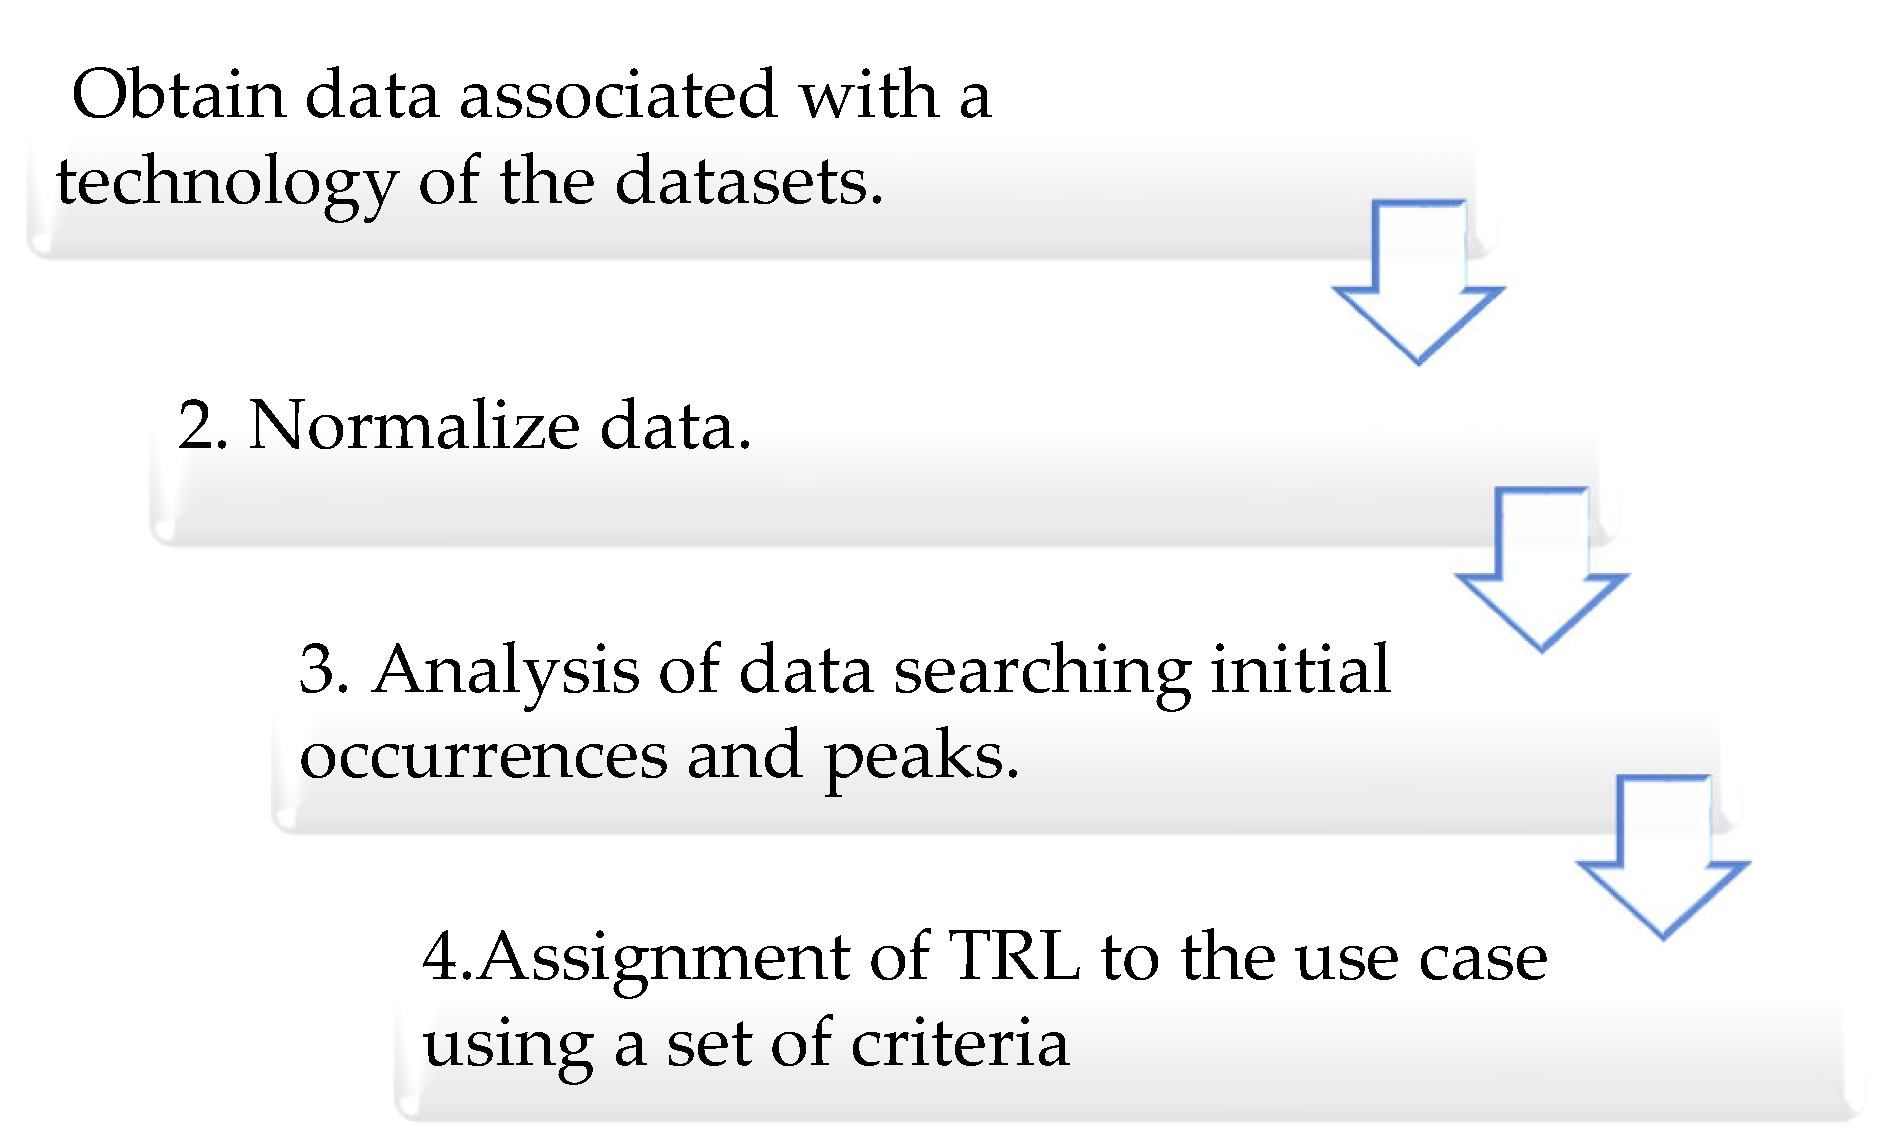
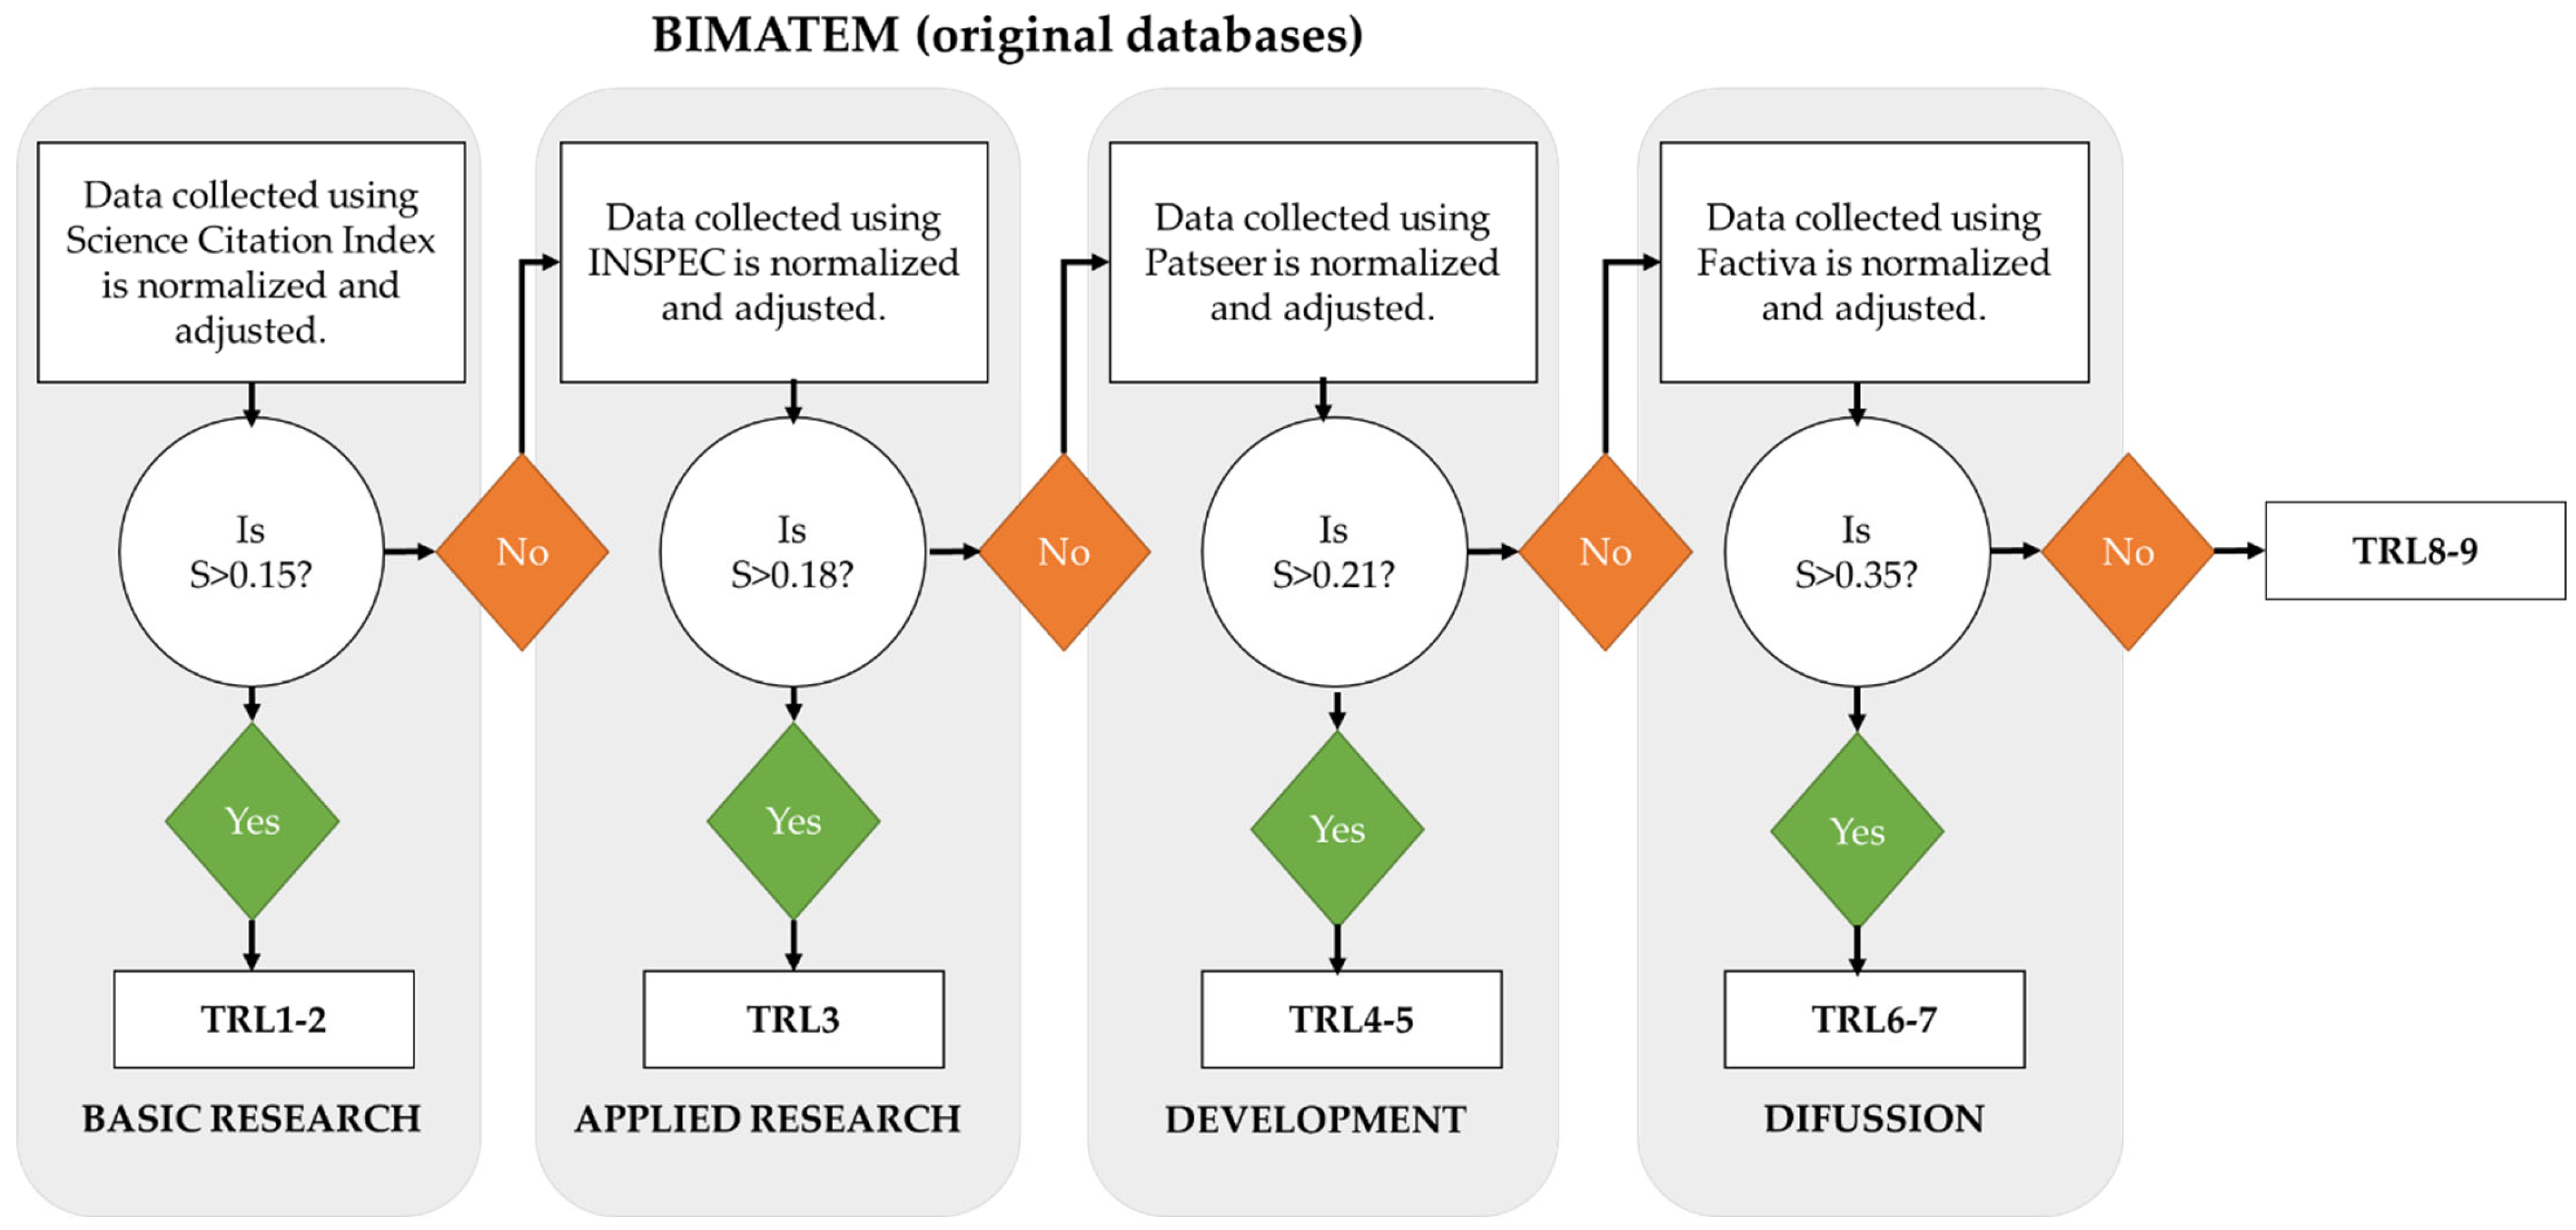
2.3.2. Bibliometric Method for Assessing Technological Maturity (BIMATEM)
- Technology selection: This begins with a terminology selection that needs to be as clear and concise as possible. It implies particular attention to select terms and extensive literature revision (even expert validation). Secondly, database selection is important depending on Technology Lyfe Cycle (TLC) or state of maturity (emerging, mature). A list of suitable databases is included in the paper (especially related to medical and biological sciences).
- Search query: This refers to the design of a search query, by defining the conditions that results must fulfill regarding title fields. If required, additional searches with “Keywords” or “Abstract” fields can be performed. Lastly, a revision of database guidelines and syntax is performed, by amending the search query to the selected database.
- Retrieval of results: This step means the download of search query results where special attention is paid to results such as time periods and results’ relevance. The given time periods need to be reliable, and, in general terms, they will be represented by years. Furthermore, it is essential to guarantee coherent results and to avoid duplications. Authors detail their strategy considering each applied database: PatseerTM, commercial database for patent search; FactivaTM, commercial database for news, etc.
- Technology maturity assessment: This step is focused on the interpretation of results by applying a mathematical model to assign a TRL. It includes the construction of a maturity assessment table, the verification that initial conditions are met, and the application of non-linear regression to each database. Data is grouped by period. The BIMATEM authors use statistical software, Minitab 18TM. If the technology development is in TRL from 1 to 7, scientific papers and patents are the data source and logistic growth is used for curve adjustment. Non-zero data from four periods is needed to use logistic growth approximation. If the TRL are from 7 to 9, a news source is added. In this case, hype-type evolution is used and eight non-zero data periods are required. If the number of periods is not fulfilled, the respective stage should be rejected within the BIMATEM workflow. Otherwise, the application of non-linear regression to each database is applied.
3. Materials and Methods
3.1. Hypotheses
3.2. Input Data
- Test 1.1. To estimate the year when TRL1, TRL2, and TRL3 are attained for AM in ceramics.
- Test 1.2. To determine the year when TRL3, TRL4, TRL5, TRL6, and TRL7 are attained for AM in metals.
- Test 2.1. To determine the year when TRL1, TRL2, and TRL3 are attained for Organ bioprinting
- Test 2.2. To determine the year when TRL3 and TRL4 are attained for the production of larger airframe structures through AM technology.
- Test 2.3. To determine the year when TRL6 is attained for the quality and consistency of (AM) powder production.
4. Validation Tests
4.1. Datasets
4.2. Set #1 of Tests—Additive Manufacturing (AM Platform)
4.2.1. Test 1.1 AM on Ceramics (TRL1–3 in 2014)
SmET Application
BIMATEM Application
BIMATEM Criteria
4.2.2. Test 1.2. AM on Metals (TRL3–7 in 2014)
SmET Fit
SmET Criteria
BIMATEM Fit

| Year | Year-Initial Year | Records | SmET | BIMATEM |
|---|---|---|---|---|
| Normalized Records | Normalized Records | |||
| 1997 | 0 | 1 | 3.57% | 0.00127551 |
| 1998 | 1 | 1 | 3.57% | 0.00127551 |
| 1999 | 2 | 0 | 0.00% | 0 |
| 2000 | 3 | 0 | 0.00% | 0 |
| 2001 | 4 | 2 | 7.14% | 0.00255102 |
| 2002 | 5 | 0 | 0.00% | 0 |
| 2003 | 6 | 0 | 0.00% | 0 |
| 2004 | 7 | 2 | 7.14% | 0.00255102 |
| 2005 | 8 | 0 | 0.00% | 0 |
| 2006 | 9 | 0 | 0.00% | 0 |
| 2007 | 10 | 0 | 0.00% | 0 |
| 2008 | 11 | 2 | 7.14% | 0.00255102 |
| 2009 | 12 | 3 | 10.71% | 0.00382653 |
| 2010 | 13 | 4 | 14.29% | 0.00510204 |
| 2011 | 14 | 6 | 21.43% | 0.00765306 |
| 2012 | 15 | 8 | 28.57% | 0.01020408 |
| 2013 | 16 | 13 | 46.43% | 0.01658163 |
| 2014 | 17 | 28 | 100.00% |
BIMATEM Criteria
4.3. Set #2 of Tests—Additive Manufacturing (AM Motion Project Roadmap)
4.3.1. Test 2.1. Organ Bioprinting (TRL1–3 in 2016)
SmET Fit
SmET Criteria
BIMATEM Criteria
4.3.2. Test 2.2. Production of Larger Airframe Structures through AM Technology (TRL3–4 in 2016)
SmET Fit
SmET Criteria
BIMATEM Criteria
4.3.3. Test 2.3. Quality and Consistency of AM Powder Production (TRL5–6 in 2016)
SmET Fit
| Test ID | Methodology | Boolean Search | Database |
|---|---|---|---|
| 2.3 | SmET | ((ta all “AM powder” AND ta = (“AM” prox/ordered “powder”)) OR (ta all “additive manuf * powder” AND ta = (“additive manuf *” prox/ordered “powder”))) AND pd ≤ “2016” | Espacenet |
| TI = (AM powder OR additive manufacturing powder) | Science Citation Index | ||
| 2.3 | BIMATEM | ((ta all “AM powder” AND ta = (“AM” prox/ordered “powder”)) OR (ta all “additive manuf * powder” AND ta = (“additive manuf *” prox/ordered “powder”))) AND pd ≤ “2016” | Espacenet |
| TI = (additive manufacturing AND aerospace) OR TI = (additive manufacturing AND aircraft) | Science Citation Index |
SmET Criteria
BIMATEM Criteria
5. Results
5.1. Comparison of Results
5.2. Analysis of Applicability
5.2.1. SmET
- Regarding its potential to comply with H1. Ranking of TRL for a given technology and with H2. Unequivocal TRL allocation:
- For H3. Use of free data sources for the search:
- Regarding H4. Applicability to a wide range of applications related to industrial technologies:
- Considering H5. Quantitative procedure not dependent on experts’ experience and H6. Suitability of the methodology in applying open data sources:
- Other aspects, such as the strength of the method, are:
5.2.2. BIMATEM
- Considering compliance with H1. Ranking of TRL for a given technology and H2. Unequivocal TRL allocation:
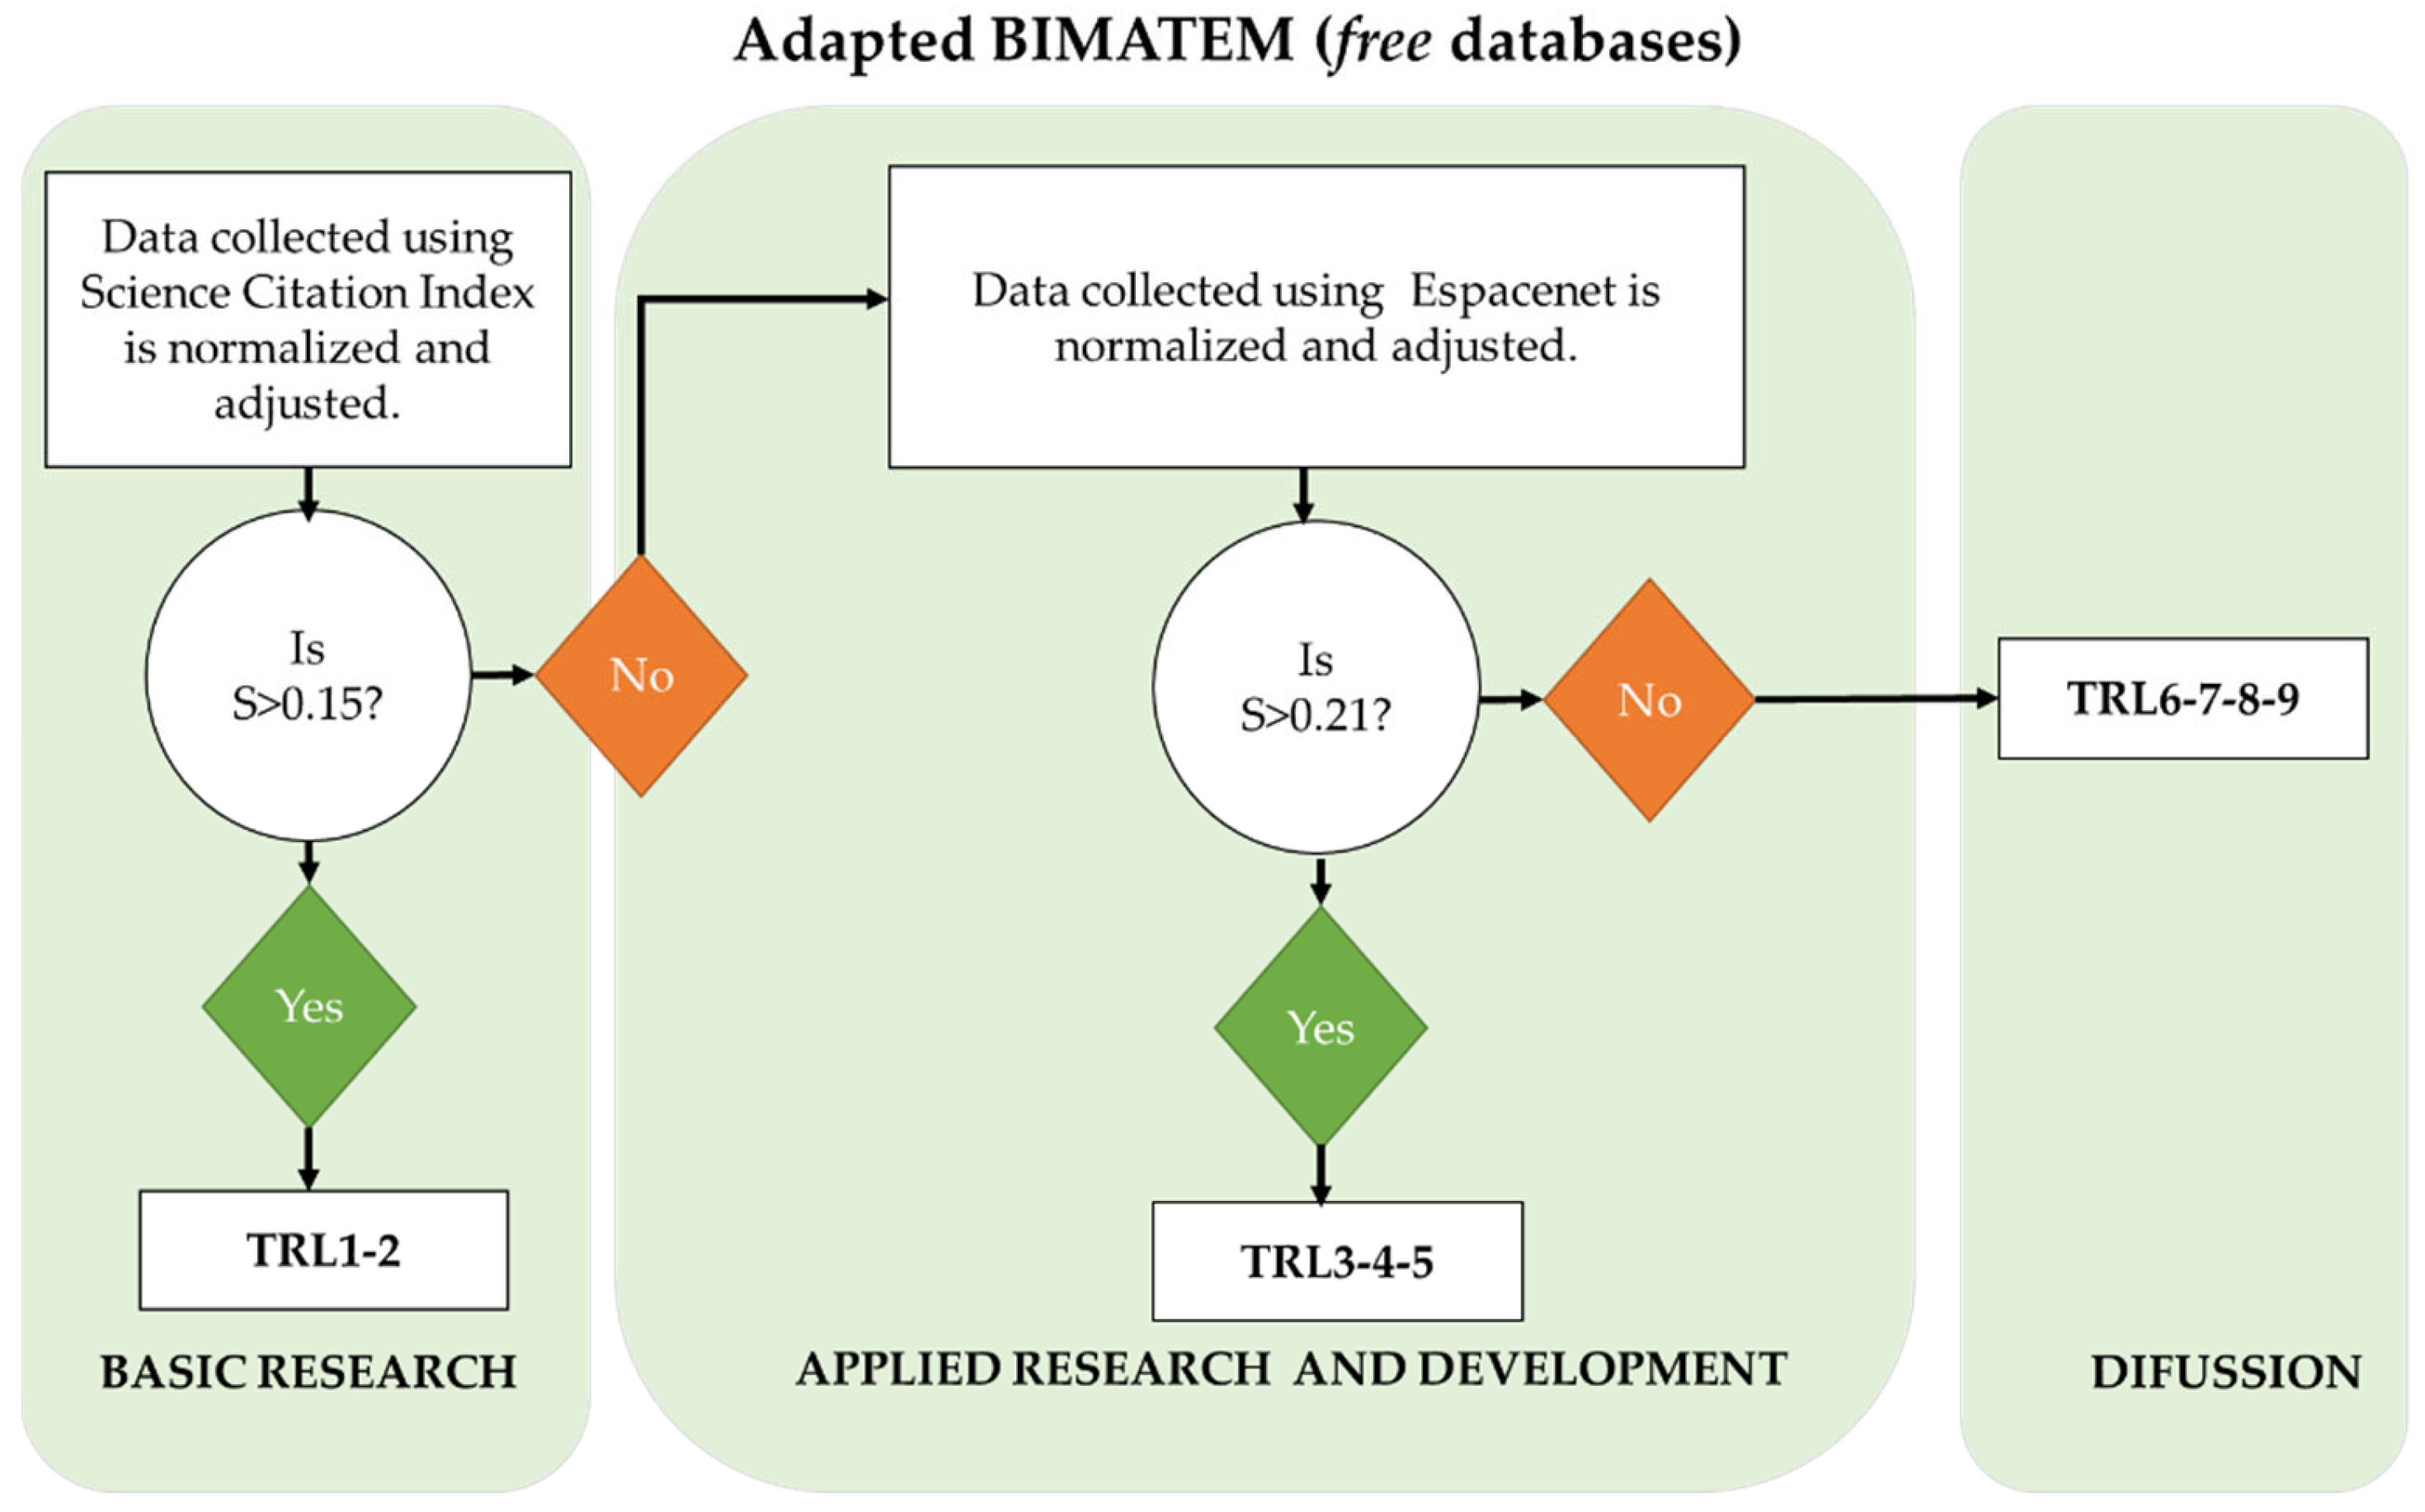
- For H3. Use of free data sources for the search:
- Considering H6. Suitability of the methodology by applying open data sources:
5.2.3. Suitability for Small and Medium Organizations
6. Improvement Proposals
- Scholarly module: this will be focused on quantifying the R&D potential of the use case technology, based on articles and citations. In this case, the data source may be Google Scholar [58] instead of Science Citation Index™ [59], as applied in the state of the art. In brief, authors will prioritize the use of several open science repositories such as Google Scholar (worldwide reference) [60], European Open Access Repositories or Regional Open Access repositories such as RIA [61].
- Patents module: this will be based on identifying the potential patents related to the use case technology, based on the number of patents, assignee names, patent classifications, etc. The data source may be Espacenet or Google Patents instead of Derwent Innovation Index. Likewise, authors will study a range of potential open data sources such as Espacenet, WIPO [62] or USPTO [63], among others.
- Projects module: this will be oriented to identify R&D projects for the use case technology, as many funding programs already classify funded projects using the TRL range. Suitable free sources will be the data sources: EC Quick tools [64] and Cordis [65]. Many papers are also related to projects or funding agencies, and this will enable the creation of a link.
- Business module: this will be oriented to determine technology-related businesses. In this case, the idea is to combine several sources to solve the limitations of current solutions (e.g., the use of Google maps to analyze the existence of businesses on the past). Applicable data sources will rely on a combination of Google maps, sectorial, and standardization sources in the field.
- News/Social Media module: this will be oriented to quantify the related news on the topic. In this case, the applicable data sources will be: Twitter [66] and Google news (in Spain, this means a Google search using the filter of “News” as Google News does not exist anymore due to country particularities). In addition, further studies may tackle other social media sources such as TikTok [67].
7. Conclusions
- SmET is based on a high number of free data sources and is suitable for this type of source. In addition, it is valid for industrial technology applications, even though it was developed for ICT-related issues.
- BIMATEM has been demonstrated to be a strong approach in determining TRL based on quantitative indicators and including a deep description of data processing and analysis. In addition, it was originally developed for manufacturing technologies, so it is a good basis to be extended for other industrial applications.
- Lack of access to experts: the proposed solution will not depend on experts’ feedback, so it will be defined based on quantitative and objective indicators. This will also be made possible by including a wider range of databases and types of data sources (e.g., social media).
- Limited number of resources: the target organizations (small and medium size) cannot dedicate many resources to calculate the technology maturity for selected use cases. In this sense, the proposed methodology will be based on free data sources and a semi-automated approach to answer their needs.
- Resilience to a changing environment: this TRL-based approach will enable organizations to rapidly adapt and redirect their strategy and decision plan (low TRLs for opening new R&D lines and high TRLs for boosting technology-based new business lines). Hence, it will enable them to face sudden crises or events that may arise (e.g., pandemics) based on the valuable knowledge provided by this tool.
Author Contributions
Funding
Institutional Review Board Statement
Informed Consent Statement
Data Availability Statement
Conflicts of Interest
References
- Zhou, J. Digitalization and Intelligentization of Manufacturing Industry. Adv. Manuf. 2013, 1, 1–7. [Google Scholar] [CrossRef] [Green Version]
- Stock, T.; Seliger, G. Opportunities of Sustainable Manufacturing in Industry 4.0. Procedia CIRP 2016, 40, 536–541. [Google Scholar] [CrossRef] [Green Version]
- Almus, M.; Nerlinger, E.A. Growth of New Technology-Based Firms: Which Factors Matter? Small Bus. Econ. 1999, 13, 141–154. [Google Scholar] [CrossRef]
- Makowska, A.; Robin, N.; Steigertahl, L.; Lonkeu, O.-K.; Ramada, P.; Farrenkopf, J.; Mankovska, N.; Devnani, S.; Mattes, A.; Aranda Ruiz, F.; et al. Annual Report on European Smes 2017/2018; European Union: Brussels, Belgium, 2018; ISBN 9789279968228. [Google Scholar]
- Muller, P.; Caliandro, C.; Peycheva, V.; Gagliardi, D.; Marzocchi, C.; Ramlogan, R.; Cox, D. Annual Report on European SMEs; European Union: Brussels, Belgium, 2014; ISBN 9789292026417. [Google Scholar]
- Torres, C.; Fowler, L. Creatively Interpreting Policy to Move Science Forward: Implementing Participatory Technology Assessment at NASA. Rev. Policy Res. 2023, 40, 389–405. [Google Scholar] [CrossRef]
- Mankins, J.C. Approaches to Strategic Research and Technology (R&T) Analysis and Road Mapping. Acta Astronaut. 2002, 51, 3–21. [Google Scholar] [CrossRef]
- Héraud, J.-A.; Kerr, F.; Burger-Helmchen, T. Creative Management of Complez Systems; Wiley: Hoboken, NJ, USA, 2019. [Google Scholar]
- Bruno, I.; Lobo, G.; Covino, B.V.; Donarelli, A.; Marchetti, V.; Panni, A.S.; Molinari, F. Technology Readiness Revisited: A Proposal for Extending the Scope of Impact Assessment of European Public Services. In Proceedings of the ICEGOV 2020: 13th International Conference on Theory and Practice of Electronic Governance, Athens, Greece, 23–25 September 2020; pp. 369–380. [Google Scholar] [CrossRef]
- Sadin, S.R.; Povinelli, F.P.; Rosen, R. The NASA Technology Push towards Future Space Mission Systems. Acta Astronaut. 1989, 20, 73–77. [Google Scholar] [CrossRef]
- Mankins, J.C. Technology Readiness Levels: A White Paper. 1995. Available online: https://aiaa.kavi.com/apps/group_public/download.php/2212/TRLs_MankinsPaper_1995.pdf (accessed on 1 July 2023).
- Mankins, J.C. Technology Readiness Assessments: A Retrospective. Acta Astronaut. 2009, 65, 1216–1223. [Google Scholar] [CrossRef]
- Schinasi, K. Best Practices: Better Management of Technology Development Can Improve Weapon System Outcomes, United States General Account Office, (GAO), National Security and International Affairs Division, July 1999, 80 Pages. Available online: https://www.gao.gov/products/nsiad-99-162 (accessed on 3 June 2023).
- ISO 16290:2013; Space Systems. Definition of the Technology Readiness Levels and Their Criteria of Assessment, ISO/TC 20/SC 14. International Organization for Standarization: Geneva, Switzerland, 2019.
- Buchner, G.A.; Stepputat, K.J.; Zimmermann, A.W.; Schomäcker, R. Specifying Technology Readiness Levels for the Chemical Industry. Ind. Eng. Chem. Res. 2019, 58, 6957–6969. [Google Scholar] [CrossRef]
- Carmack, W.J.; Braase, L.A.; Wigeland, R.A.; Todosow, M. Technology Readiness Levels for Advanced Nuclear Fuels and Materials Development. Nucl. Eng. Des. 2017, 313, 177–184. [Google Scholar] [CrossRef] [Green Version]
- European Commission. Preparing for Our Future: Developing a Common Strategy for Key Enabling Technologies in the EU; Communication Fromo the European Commission to the Europan Parliament, the Council: Brussels, Belgium, 2009; Available online: https://www.eumonitor.eu/9353000/1/j9vvik7m1c3gyxp/vikqhnv1gvzd (accessed on 27 June 2023).
- European Comission. Final Report or High-Level Expert Group on Key Enabling Technologies. 2011. p. 56. Available online: https://www.kowi.de/Portaldata/2/Resources/fp7/hlg_kets_final_report_en.pdf (accessed on 28 June 2023).
- European Commission Technology Readiness Levels (TRL). Horizon 2020—WORK Programme 2014–2015 Gen. Annex. Extr. Part 19—Comm. Decis. C; European Commission: Brussels, Belgium, 2014; p. 1. [Google Scholar]
- European Commission. Horizon 2020 Proposal Template 2018–2020; European Commission: Brussels, Belgium, 2018. [Google Scholar]
- Notice, I.; This, O.N.; Programme, W. Horizon 2020 Work Programme 2018–2020 Call—Building a Low-Carbon, Climate Resilient Future: Next-Generation; European Commission: Brussels, Belgium, 2020. [Google Scholar]
- Hague, R.; Reeves, P.; Jones, S. Mapping UK Research and Innovation in Additive Manufacturing. A Review of the UK’s publicly Funded R&D Activities in Additive Manufacturing between 2012 and 2015. February 2016, p. 33. Available online: https://www.ukri.org/wp-content/uploads/2021/12/IUK-071221-3DPrintingMappingUKAdditiveManufacturing (accessed on 23 February 2021).
- AM-Platform. 2014 Additive Manufacturing Strategic Research Agenda (AM SRA). 2014. Volume 119. Available online: https://www.rm-platform.com/linkdoc/AM%20SRA%20-%20February%202014.pdf (accessed on 27 June 2023).
- Sinclair-Desgagné, Bernard Measuring Innovation and Innovativeness: A Data-Mining Approach. Qual. Qual. 2022, 56, 2415–2434. [CrossRef]
- Willyard, C.H.; McClees, C.W. Motorola’s Technology Roadmap Process. Res. Manag. 1987, 30, 13–19. [Google Scholar] [CrossRef]
- Bray, O.H.; Garcia, M.L. Technology Roadmapping: The Integration of Strategic and Technology Planning for Competitiveness. In Proceedings of the Innovation in Technology Management, The Key to Global Leadership. PICMET ‘97, Portland, OR, USA, 31 July 1997; Institute of Electrical and Electronics Engineers Inc. (IEL): New York, NY, USA, 1997; pp. 25–28. Available online: http://ieeexplore.ieee.org/servlet/opac?punumber=4876 (accessed on 19 March 2021).
- Phaal, R.; Farrukh, C.J.P.; Probert, D.R. Technology Roadmapping—A Planning Framework for Evolution and Revolution. Technol. Forecast. Soc. Chang. 2004, 71, 5–26. [Google Scholar] [CrossRef]
- Phaal, R.; Farrukh, C.; Probert, D. Technology Roadmapping: Linking Technology Resources to Business Objectives; Centre for Technology Management, University of Cambridge: Cambridge, UK, 2001; pp. 1–18. Available online: https://images.template.net/wp-content/uploads/2016/02/22043358/TechnologyRoadmappingProject.pdf (accessed on 28 June 2023).
- Office of Environmental Management DOE; Corporate Critical Decision (CD) Review and Approval Framework Associated with Nuclear Facility Capital and Major Construction Projects Technology Readiness Assessment/Technology Maturity Plan Process Guide. 2010. Available online: https://www.energy.gov/sites/prod/files/em/Volume_I/O_SRP.pdf (accessed on 27 June 2023).
- Altunok, T.; Cakmak, T. A Technology Readiness Levels (TRLs) Calculator Software for Systems Engineering and Technology Management Tool. Adv. Eng. Softw. 2010, 41, 769–778. [Google Scholar] [CrossRef]
- European Space Agency TRL Calculator. Available online: https://trlcalculator.esa.int/ (accessed on 27 June 2023).
- Defense Adquisition University (DAU), AFRL TRL Calculator. Available online: https://www.dau.edu/cop/stm/Lists/Tools/AllItems.aspx (accessed on 27 June 2023).
- Abercrombie, R.; Schlicher, B.; Sheldon, F.T. Scientometric Methods for Identifying Emerging Technologies. U.S. Patent 9,177,249, 3 November 2015. [Google Scholar]
- Lezama-Nicolás, R.; Rodríguez-Salvador, M.; Río-Belver, R.; Bildosola, I. A Bibliometric Method for Assessing Technological Maturity: The Case of Additive Manufacturing. Scientometrics 2018, 117, 1425–1452. [Google Scholar] [CrossRef] [Green Version]
- Campani, M.; Vaglio, R. A Simple Interpretation of the Growth of Scientific/Technological Research Impact Leading to Hype-Type Evolution Curves. Scientometrics 2015, 103, 75–83. [Google Scholar] [CrossRef] [Green Version]
- Spiess, A.N.; Neumeyer, N. An Evaluation of R2as an Inadequate Measure for Nonlinear Models in Pharmacological and Biochemical Research: A Monte Carlo Approach. BMC Pharmacol. 2010, 10, 6. [Google Scholar] [CrossRef] [Green Version]
- European Technology Platform MANUFACTURE Web. Available online: http://www.manufuture.org/ (accessed on 27 June 2023).
- ASTM International Global Leader in Additive Manufacturing Standards. ASTM. 2017. pp. 1–11. Available online: https://amcoe.org/wp-content/uploads/2022/05/Additive-Manufacturing-Sector-Overview.pdf (accessed on 2 December 2022).
- AM-Motion. Am-Motion A Strategic Approach To Increasing Europe’s Value Proposition For Additive Manufacturing Technologies And Capabilities. Grant Agreement No 723560 Final AM Roadmap Deliverable Number: D5.4 Document Details Due Date of Deliverable M24 Lead Contrac. 2016. Available online: https://cordis.europa.eu/project/id/723560/reporting (accessed on 27 June 2023).
- European Patent Office Espacenet. Web Page. Available online: https://worldwide.espacenet.com/ (accessed on 27 June 2023).
- Sarton, L.A.J.L.; Zeedijk, H.B. Proceedings of the 5th European Conference on Advanced Materials and Processes and Applications: Materials, Functionality & Design; Netherlands Society for Materials Science: Zwijndrecht, The Netherlands, 1997; Volume 3, ISBN 9080351334. [Google Scholar]
- Wu, C.; Fan, W.; Zhou, Y.; Luo, Y.; Gelinsky, M.; Chang, J.; Xiao, Y. 3D-Printing of Highly Uniform CaSiO3 Ceramic Scaffolds: Preparation, Characterization and in Vivo Osteogenesis. J. Mater. Chem. 2012, 22, 12288. [Google Scholar] [CrossRef]
- Kühner, F.; Lugmaier, R.A.; Mihatsch, S.; Gaub, H.E. Print Your Atomic Force Microscope. Rev. Sci. Instrum. 2007, 78, 075105. [Google Scholar] [CrossRef] [Green Version]
- Kahn, B. Displays and Lighting: OLED, e-Paper, Electroluminescent and beyond: IDTechEx. Available online: https://www.idtechex.com/en/research-report/displays-and-lighting-oled-e-paper-electroluminescent-and-beyond/211 (accessed on 11 March 2022).
- Morton, T. Titanium Foam Scaffolds Made to Match Bone’s Properties. Web Page. Available online: https://arstechnica.com/science/2008/08/titanium-foam-scaffolds-made-to-match-bones-properties/ (accessed on 7 April 2022).
- Jackson, S. From Rapid Prototyping to Mass Customization-Industrial Laser Solutions. Web Page. Available online: https://www.laserfocusworld.com/industrial-laser-solutions/article/14216581/from-rapid-prototyping-to-mass-customization (accessed on 11 April 2022).
- Fraunhofer-Gesellschaft. RFID Chips: Intelligence inside Metal Components. Science Daily, November 2009 Web Page. Available online: https://www.fraunhofer.de/en/press/research-news/2009/11/intelligence-inside-metal-components-RFID.html (accessed on 27 March 2021).
- Saenz, A. Stainless Steel Printing from Shapeways. Web Page. Available online: https://www.shapeways.com/materials/steel (accessed on 22 March 2021).
- Wang, B. Roadmap for Additive Manufacturing. Available online: http://nvlpubs.nist.gov/nistpubs/ams/NIST.AMS.100-5.pdf (accessed on 23 June 2022).
- Jamais, C. The Desktop Manufacturing Revolution. Available online: https://www.fastcompany.com/1307126/desktop-manufacturing-revolution (accessed on 18 June 2022).
- Fraunhofer-Gesellschaft. Perfectly Proportioned: Evenly Distributed Powder Density For Manufacturing Parts, Science Daily, 30 December 2009. Available online: https://www.sciencedaily.com/releases/2009/11/091106102656.htm (accessed on 13 September 2022).
- Mironov, V. Toward Human Organ Printing: Charleston Bioprinting Symposium. ASAIO J. 2006, 52, e27–e30. [Google Scholar] [CrossRef]
- Yoo, S.S.; Polio, S. 3D On-Demand Bioprinting for the Creation of Engineered Tissues. In Cell and Organ Printing; Springer: Dordrecht, The Netherlands, 2010; pp. 3–19. ISBN 9789048191444. [Google Scholar]
- Gaytan, S.M.; Murr, L.E.; Medina, F.; Martinez, E.; Martinez, L.; Wicker, R.B. Fabrication and Characterization of Reticulated, Porous Mesh Arrays and Foams for Aerospace Applications by Additive Manufacturing Using Electron Beam Melting, Edited by TMS. In Proceedings of the TMS 2010 Annual Meeting, Seattle, Warrendale, PA, USA, 14–18 February 2010; Volume 1, pp. 283–290. [Google Scholar]
- Brandl, E.; Baufeld, B.; Leyens, C.; Gault, R. Additive Manufactured Ti-6Al-4V Using Welding Wire: Comparison of Laser and Arc Beam Deposition and Evaluation with Respect to Aerospace Material Specifications. Phys. Procedia 2010, 5, 595–606. [Google Scholar] [CrossRef] [Green Version]
- Paul, B.K.; Baskaran, S. Issues in Fabricating Manufacturing Tooling Using Powder-Based Additive Freeform Fabrication. J. Mater. Process. Technol. 1996, 61, 168–172. [Google Scholar] [CrossRef]
- Berumen, S.; Bechmann, F.; Lindner, S.; Kruth, J.P.; Craeghs, T. Quality Control of Laser- and Powder Bed-Based Additive Manufacturing (AM) Technologies. Phys. Procedia 2010, 5, 617–622. [Google Scholar] [CrossRef] [Green Version]
- Abercrombie, R.K.; Udoeyop, A.W.; Schlicher, B.G. A Study of Scientometric Methods to Identify Emerging Technologies via Modeling of Milestones. Scientometrics 2012, 91, 327–342. [Google Scholar] [CrossRef]
- R Foundation for Statistical Computing R: A Language and Environment for Statistical Computing. 2013. Available online: https://www.gbif.org/tool/81287/r-a-language-and-environment-for-statistical-computing (accessed on 27 June 2023).
- Google Scholar. Available online: https://scholar.google.es/ (accessed on 17 April 2019).
- Principality of Asturias, Repositorio Institucional de Asturias (RIA). (Public Document Repository of Principality of Asturias (Spain). Available online: https://ria.asturias.es/RIA/ (accessed on 27 June 2023).
- WIPO. World International Property Organization Web Page. Available online: https://www.wipo.int/ (accessed on 27 June 2023).
- USPTO. US Patents and Trademark Office. Available online: https://www.uspto.gov/ (accessed on 27 June 2023).
- European Commission H2020 Projects|Qlik Sense-Interactive Data. Available online: https://webgate.ec.europa.eu/dashboard/sense/app/93297a69-09fd-4ef5-889f-b83c4e21d33e/sheet/a879124b-bfc3-493f-93a9-34f0e7fba124/state/analysis (accessed on 17 April 2019).
- European Commission. CORDIS|European Commission. Available online: https://cordis.europa.eu/en (accessed on 17 April 2019).
- Twitter. Available online: https://twitter.com/ (accessed on 17 April 2019).
- Tiktok. Available online: https://www.tiktok.com/ (accessed on 27 June 2023).
- Wilson, D.W. Monitoring Technology Trends with Podcasts, RSS and Twitter. Libr. Hi Tech News 2008, 25, 8–12. [Google Scholar] [CrossRef]
- Zubiaga, A.; Spina, D.; Martínez, R.; Fresno, V. Real-Time Classification of Twitter Trends. J. Assoc. Inf. Sci. Technol. 2015, 66, 462–473. [Google Scholar] [CrossRef]
- Li, X.; Xie, Q.; Jiang, J.; Zhou, Y.; Huang, L. Identifying and Monitoring the Development Trends of Emerging Technologies Using Patent Analysis and Twitter Data Mining: The Case of Perovskite Solar Cell Technology. Technol. Forecast. Soc. Chang. 2018, 146, 687–705. [Google Scholar] [CrossRef]
- Kocaoglu, D.F. Portland International Center for Management of Engineering and Technology. In Proceedings of the Portland International Conference on Management of Engineering & Technology (PICMET), Kanazawa, Japan, 27–31 July 2014. [Google Scholar]


| Methodologies | Quantitative | Qualitative | Main Features | Range |
|---|---|---|---|---|
| SmET | ✓ | 🗴 | Based on numerical indicators and procedures over science metric data | TRL1–TRL9 |
| BINATEM | ✓ | 🗴 | Based on numerical indicators and procedures | TRL1–TRL9 |
| Guidelines for Technology Readiness procedure | 🗴 | ✓ | Questionnaire based on experts’ answers | TRL1–TRL6 |
| Strategic analysis for research and technology | 🗴 | ✓ | There are no data about establishing current TRL, only parameters based on differences of TRL | - |
| Calculator of technology level | 🗴 | ✓ | TRL1-TRL9Questionnaire based on experts’ answers | TRL1–TRL9 |
| Scholarly Data | Patent Data | Web News | Business/ Product Starts | |
|---|---|---|---|---|
| TRL1 | ✓ | |||
| TRL2 | ✓ | |||
| TRL3 | ✓ | ✓ | ✓ | |
| TRL4 | ✓ | |||
| TRL5 | ✓ | |||
| TRL6 | ✓ | |||
| TRL7 | ✓ | ✓ | ✓ | |
| TRL8 | ✓ | |||
| TRL9 | ✓ |
| Set | Test | TRL |
|---|---|---|
| Set 1 | Test 1.1 | TRL1–3 in 2014 |
| Test 1.2 | TRL3–7 in 2014 | |
| Test 1.3 * | TRL7–9 in 2014 | |
| Set 2 | Test 2.1 | TRL1–3 in 2016. |
| Test 2.2 | TRL3–4 in 2016. | |
| Test 2.2 | TRL6 in 2016. |
| Test | Boolean Search | Source |
|---|---|---|
| 1.1 SmET | “3D printing OR Additive manufacturing AND ceramics” REFINEMENT TI = (3D printing AND ceramics) OR TI = (Additive manufacturing AND CERAMICS) | Science Citation Index |
| (ta all “3D print * AND ceramics” OR ta all “additive manuf * AND ceramics”) AND pd ≤ “2014” | Espacenet | |
| 3d printing OR additive manufacturing AND ceramics | Google search. Filter by News | |
| 1.1 BIMATEM | TI = (3D print * AND ceramics) OR TI = (Additive manufact * AND CERAMICS) | Science Citation Index |
| (ta all “3D print * AND ceramics” OR ta all “additive manuf * AND ceramics”) AND pd ≤ “2014” | Espacenet |
| Year | Period | Records | BIMATEM | SmET |
|---|---|---|---|---|
| Normalized Records | Normalized Records (%) | |||
| 1997 | 0 | 1 | 0.02631579 | 10.00% |
| 2005 | 8 | 3 | 0.07894737 | 30.00% |
| 2006 | 9 | 1 | 0.02631579 | 10.00% |
| 2008 | 10 | 3 | 0.07894737 | 30.00% |
| 2009 | 11 | 3 | 0.07894737 | 30.00% |
| 2010 | 12 | 1 | 0.02631579 | 10.00% |
| 2011 | 13 | 2 | 0.05263158 | 20.00% |
| 2012 | 14 | 7 | 0.18421053 | 70.00% |
| 2013 | 15 | 7 | 0.18421053 | 70.00% |
| 2014 | 16 | 10 | 0.26315789 | 100.00% |
| BIMATEM–R Summary for Logistic Growth Fit of AM Ceramics Records from Science Citation IndexTM Method: Algorithm: Levenberg–Marquardt Nonlinear Least-Squares Algorithm Max Iteration: 50 |
|---|
| Equation: AMceramics records from SCI = 1/(1+6.70539 × EXP(−0.11148 × ‘Year-Initial_Year’) |
| Summary: Iterations: 13 DFE (degrees of freedom for error): 8 S: 0.0858 |
| Methodology | Boolean Search | Database |
|---|---|---|
| 1.2 SmET | TI = (3D printing AND metal) OR TI = (Additive manufacturing AND metal) | Science Citation Index |
| (ta all “3D print * AND metal” OR ta = (“Additive manufact *” prox/distance < 3 “metal”)) AND pd ≤ “2014” | Espacenet | |
| “3d printing OR additive manufacturing AND metal” | Google search. Filter by news | |
| “3d printing OR additive manufacturing AND metal AND product business” | Google maps | |
| 1.2 BIMATEM | TI = (3D printing AND metal) OR TI = (Additive manufactur * AND metal) | Science Citation Index |
| (ta all “3D print * AND metal” OR ta all “additive manuf * AND metal”) AND pd ≤ “2014”“ | Espacenet |
| BIMATEM—R Summary for Logistic Growth Fit of AM Metals Records from Science Citation IndexTM Method: Algorithm: Levenberg–Marquardt Nonlinear Least-Squares Algorithm Max Iteration: 50 |
|---|
| Equation: AMMetal records from SCI = 1/(1 + 8928000 × EXP(−0.8998 × ‘Year-Initial_Year’) |
| Summary: Iterations: 21 DFE (degrees of freedom for error): 50 S: 0.05196 |
| Test ID | Methodology | Boolean Search | Database |
|---|---|---|---|
| 2.1 | SmET | TI = (Bioprinting AND organ) | Science Citation Index |
| ta all “organ AND bioprint *” OR ta = (“print *” prox/distance < 3 “organ”) | Espacenet | ||
| 2.1 | BIMATEM | TI = (Bioprinting AND organ) | Science Citation Index |
| Year | Year-Initial Year | Records | BIMATEM | SmET |
|---|---|---|---|---|
| Normalized Records | Normalized Records | |||
| 2006 | 0 | 1 | 0.04347826 | 16.67% |
| 2007 | 1 | 0 | 0 | 0.00% |
| 2008 | 2 | 0 | 0 | 0.00% |
| 2009 | 3 | 0 | 0 | 0.00% |
| 2010 | 4 | 3 | 0.13043478 | 50.00% |
| 2011 | 5 | 0 | 0 | 0.00% |
| 2012 | 6 | 2 | 0.08695652 | 33.33% |
| 2013 | 7 | 2 | 0.08695652 | 33.33% |
| 2014 | 8 | 3 | 0.13043478 | 50.00% |
| 2015 | 9 | 6 | 0.26086957 | 100.00% |
| 2016 | 10 | 6 | 0.26086957 | 100.00% |
| Year | Grants |
|---|---|
| 2013 | 0 |
| 2014 | 1 |
| 2015 | 0 |
| 2016 | 1 |
| BIMATEM—R Summary for Logistic Growth Fit of AM Metals Records from Science Citation IndexTM Method: Algorithm: Levenberg–Marquardt Nonlinear Least-Squares Algorithm Max Iteration: 50 |
|---|
| Equation: Organ printing production records from SCI = 1/(1 + 12.25121 × EXP(−0.39362 × ‘Year-Initial_Year’) |
| Summary: Iterations: 8 DFE (degrees of freedom for error): 3 S: 0.0369 |
| Test ID | Methodology | Boolean Search | Database |
|---|---|---|---|
| 2.2 | SmET | TI = (additive manufacturing AND aerospace) OR TI = (additive manufacturing AND aircraft) | Science Citation Index |
| (ti all “additive manufact * AND aerospace” OR ta all “additive manufact * AND aircraft”) AND pd ≤ “2016” | Espacenet | ||
| (additive manufacturing AND aerospace) OR (additive manufacturing AND aircraft) | Google search. Filter by News | ||
| 2.2 | BIMATEM | TI = (additive manufacturing AND aerospace) OR TI = (additive manufacturing AND aircraft) | Science Citation Index |
| (ti all “additive manufact * AND aerospace” OR ta all “additive manufact * AND aircraft”) AND pd ≤ “2016” | Espacenet |
| Year | Year–Initial Year | Records | BIMATEM | SmET |
|---|---|---|---|---|
| Normalized Records | Normalized Records | |||
| 2010 | 2 | 0 | 0.14285714 | 50.00% |
| 2011 | 1 | 1 | 0.07142857 | 25.00% |
| 2012 | 0 | 2 | 0 | 0.00% |
| 2013 | 1 | 3 | 0.07142857 | 25.00% |
| 2014 | 3 | 4 | 0.21428571 | 75.00% |
| 2015 | 3 | 5 | 0.21428571 | 75.00% |
| 2016 | 4 | 6 | 0.28571429 | 100.00% |
| Year | Year–Initial Year | Number Records | BIMATEM Normalized Results |
|---|---|---|---|
| 2010 | 0 | 1 | 0.06666667 |
| 2011 | 1 | 0 | 0 |
| 2012 | 2 | 0 | 0 |
| 2013 | 3 | 1 | 0.06666667 |
| 2014 | 4 | 2 | 0.13333333 |
| 2015 | 5 | 5 | 0.33333333 |
| 2016 | 6 | 6 | 0.4 |
| BIMATEM | R Summary for Logistic Growth Fit of Larger Airframe Structure AM Records from Science Citation Index Method: Algorithm: Levenberg–Marquardt Nonlinear Least-Squares Algorithm Max Iteration: 50 |
|---|---|
| Equation | Larger airframe structure AM records from SCI = 1/(1 + 22.0366 × EXP(−0.3619 × ‘Year-Initial_Year’) |
| Summary | Iterations: 14 DFE (degrees of freedom for error): 5 S: 0.06678 |
| BIMATEM | R Summary for Logistic Growth Fit of Larger Airframe Structure AM Records from Science Citation Index Method: Algorithm: Levenberg–Marquardt Nonlinear Least-Squares Algorithm Max Iteration: 50 |
|---|---|
| Equation | larger airframe structure AM records from SCI = 1/(1 + 14.000 × EXP(−8.216 × ‘Year-Initial_Year’) |
| Summary | Iterations: 12 DFE (degrees of freedom for error): 5 S: 0.2 |
| Year | Year–Initial Year | Records | BIMATEM | SmET |
|---|---|---|---|---|
| Normalized Records | Normalized Records | |||
| 1996 | 0 | 1 | 0.0078125 | 2.00% |
| 1997 | 1 | 0 | 0 | 0.00% |
| 1998 | 2 | 0 | 0 | 0.00% |
| 1999 | 3 | 0 | 0 | 0.00% |
| 2000 | 4 | 0 | 0 | 0.00% |
| 2001 | 5 | 0 | 0 | 0.00% |
| 2002 | 6 | 1 | 0.0078125 | 2.00% |
| 2003 | 7 | 2 | 0.015625 | 4.00% |
| 2004 | 8 | 0 | 0 | 0.00% |
| 2005 | 9 | 1 | 0.0078125 | 2.00% |
| 2006 | 10 | 1 | 0.0078125 | 2.00% |
| 2007 | 11 | 2 | 0.015625 | 4.00% |
| 2008 | 12 | 1 | 0.0078125 | 2.00% |
| 2009 | 13 | 4 | 0.03125 | 8.00% |
| 2010 | 14 | 7 | 0.0546875 | 14.00% |
| 2011 | 15 | 3 | 0.0234375 | 6.00% |
| 2012 | 16 | 3 | 0.0234375 | 6.00% |
| 2013 | 17 | 5 | 0.0390625 | 10.00% |
| 2014 | 18 | 19 | 0.1484375 | 38.00% |
| 2015 | 19 | 28 | 0.21875 | 56.00% |
| 2016 | 20 | 50 | 0.390625 | 100.00% |
| Year | Year-Initial Year | Number Records | BIMATEM Normalized Results |
|---|---|---|---|
| 2013 | 0 | 3 | 0.214286 |
| 2014 | 1 | 11 | 0.785714 |
| BIMATEM | R Summary for Logistic Growth Fit of AM Metals Records from Science Citation IndexTM Method: Algorithm: Levenberg–Marquardt Nonlinear Least-Squares Algorithm Max Iteration: 50 |
|---|---|
| Equation | AMPowder production records from SCI = 1/(1 + 79.9713 × EXP(−0.2267 × ‘Year-Initial_Year’) |
| Summary | Iterations: 21 DFE (degrees of freedom for error): 10 S: 0.05287 |
| Set | Test | Target TRL | SmET (TRL) Results | BIMATEM (TRL) Results |
|---|---|---|---|---|
| Set 1 | Test 1.1 | TRL1–3 in 2014 | TRL1 in 1967; TRL2 in 2012; TRL3 could not be calculated. | TRL1–3 in 2014. |
| Test 1.2 | TRL3–7 in 2014 | TRL3 in 2012; TRL4 in 2005; * TRL5–6 in 2014; TRL7 could not be calculated. | TRL3–5 in 2014. | |
| Test 1.3 | TRL7–9 in 2014 | No data. | No data. | |
| Set 2 | Test 2.1 | TRL1–3 in 2016. | TRL1 in 2006. TRL2 in 2010. TRL3 in 2012. | TRL1–3 in 2016 |
| Test 2.2 | TRL3–4 in 2016. | TRL1 in 2010. TRL2 in 2016. * TRL3 in 2014. | Higher than TRL4–5 in 2016. | |
| Test 2.3 | TRL6 in 2016. | TRL1 in 1996. TRL2 in 2010. TRL3 in 2012. * TRL4 in 2007. TRL5–6 in 2012. | TRL3–TRL5 in 2016. |
| SmET | BIMATEM | Novel Approach | |
|---|---|---|---|
| Approach | To determine the year when a TRL of a technology “use case” is attained. | To determine the TRL of a technology at the present. It may be adapted to be determined for a past date. | To determine the TRL of a technology “use case” in the present (main approach) or past. To determine the year when a TRL of a technology use case is attained (optional). |
| Quantitative method | Yes (quantitative indicators are given) | Yes (quantitative indicators are given) | Yes (quantitative indicators are given) |
| Need for experts | No. General procedure without need of experts. However, some steps (normalization of datasets) require experts for their definition. | No If an extensive literature revision is done, experts are not required. However, their expertise may notably reduce the required time. | No |
| Uniqueness on TRL characterization | No (TRL5 and TRL6 have the same definition). | No (Range of TRLs) | Yes (Addition of modules and criteria) |
| Missed information of several procedure steps | Yes. Need of experts for dataset normalization and selection of sources (keywords). | No. Experts may be required for terminology definition (keywords) but it is not mandatory. | No. Methodology will be defined to make it semi-automated, minimizing experts’ inputs during its application. |
| Lack of free data sources | 2 out of 4 datasets are based on paid data sources (WoS for Scholarly dataset and DSII for Patents dataset). | All data sources and statistical tool are available under license. | All modules are based on free data sources. |
| Application | ICT application | Additive manufacturing technologies | Wider application with special attention to industrial technologies. |
Disclaimer/Publisher’s Note: The statements, opinions and data contained in all publications are solely those of the individual author(s) and contributor(s) and not of MDPI and/or the editor(s). MDPI and/or the editor(s) disclaim responsibility for any injury to people or property resulting from any ideas, methods, instructions or products referred to in the content. |
© 2023 by the authors. Licensee MDPI, Basel, Switzerland. This article is an open access article distributed under the terms and conditions of the Creative Commons Attribution (CC BY) license (https://creativecommons.org/licenses/by/4.0/).
Share and Cite
Rodríguez López, N.; Alvarez Cabal, J.V.; Cuiñas, M.C.; Ortega Fernndez, F. Applicability of Technology Maturity Level Evaluation Methodologies within Small- and Medium-Sized Organizations: Prospects and Proposals. Systems 2023, 11, 387. https://doi.org/10.3390/systems11080387
Rodríguez López N, Alvarez Cabal JV, Cuiñas MC, Ortega Fernndez F. Applicability of Technology Maturity Level Evaluation Methodologies within Small- and Medium-Sized Organizations: Prospects and Proposals. Systems. 2023; 11(8):387. https://doi.org/10.3390/systems11080387
Chicago/Turabian StyleRodríguez López, Nuria, José Valeriano Alvarez Cabal, Marcos Cueto Cuiñas, and Francisco Ortega Fernndez. 2023. "Applicability of Technology Maturity Level Evaluation Methodologies within Small- and Medium-Sized Organizations: Prospects and Proposals" Systems 11, no. 8: 387. https://doi.org/10.3390/systems11080387
APA StyleRodríguez López, N., Alvarez Cabal, J. V., Cuiñas, M. C., & Ortega Fernndez, F. (2023). Applicability of Technology Maturity Level Evaluation Methodologies within Small- and Medium-Sized Organizations: Prospects and Proposals. Systems, 11(8), 387. https://doi.org/10.3390/systems11080387