
Evaluating Supply Resilience Performance of an Automotive Industry during Operational Shocks: A Pythagorean Fuzzy AHP-VIKOR-Based Approach

Abstract
:1. Introduction
- (i)
- What are the most important criteria and sub-criteria that affect the resilience performance of suppliers during the COVID-19 outbreak?
- (ii)
- How can the importance levels of the resilience criteria be obtained under the Pythagorean fuzzy environment?
- (iii)
- How can the performances of the suppliers be evaluated under the Pythagorean fuzzy environment with the resilience criteria?
2. Literature Review
Contribution to Literature
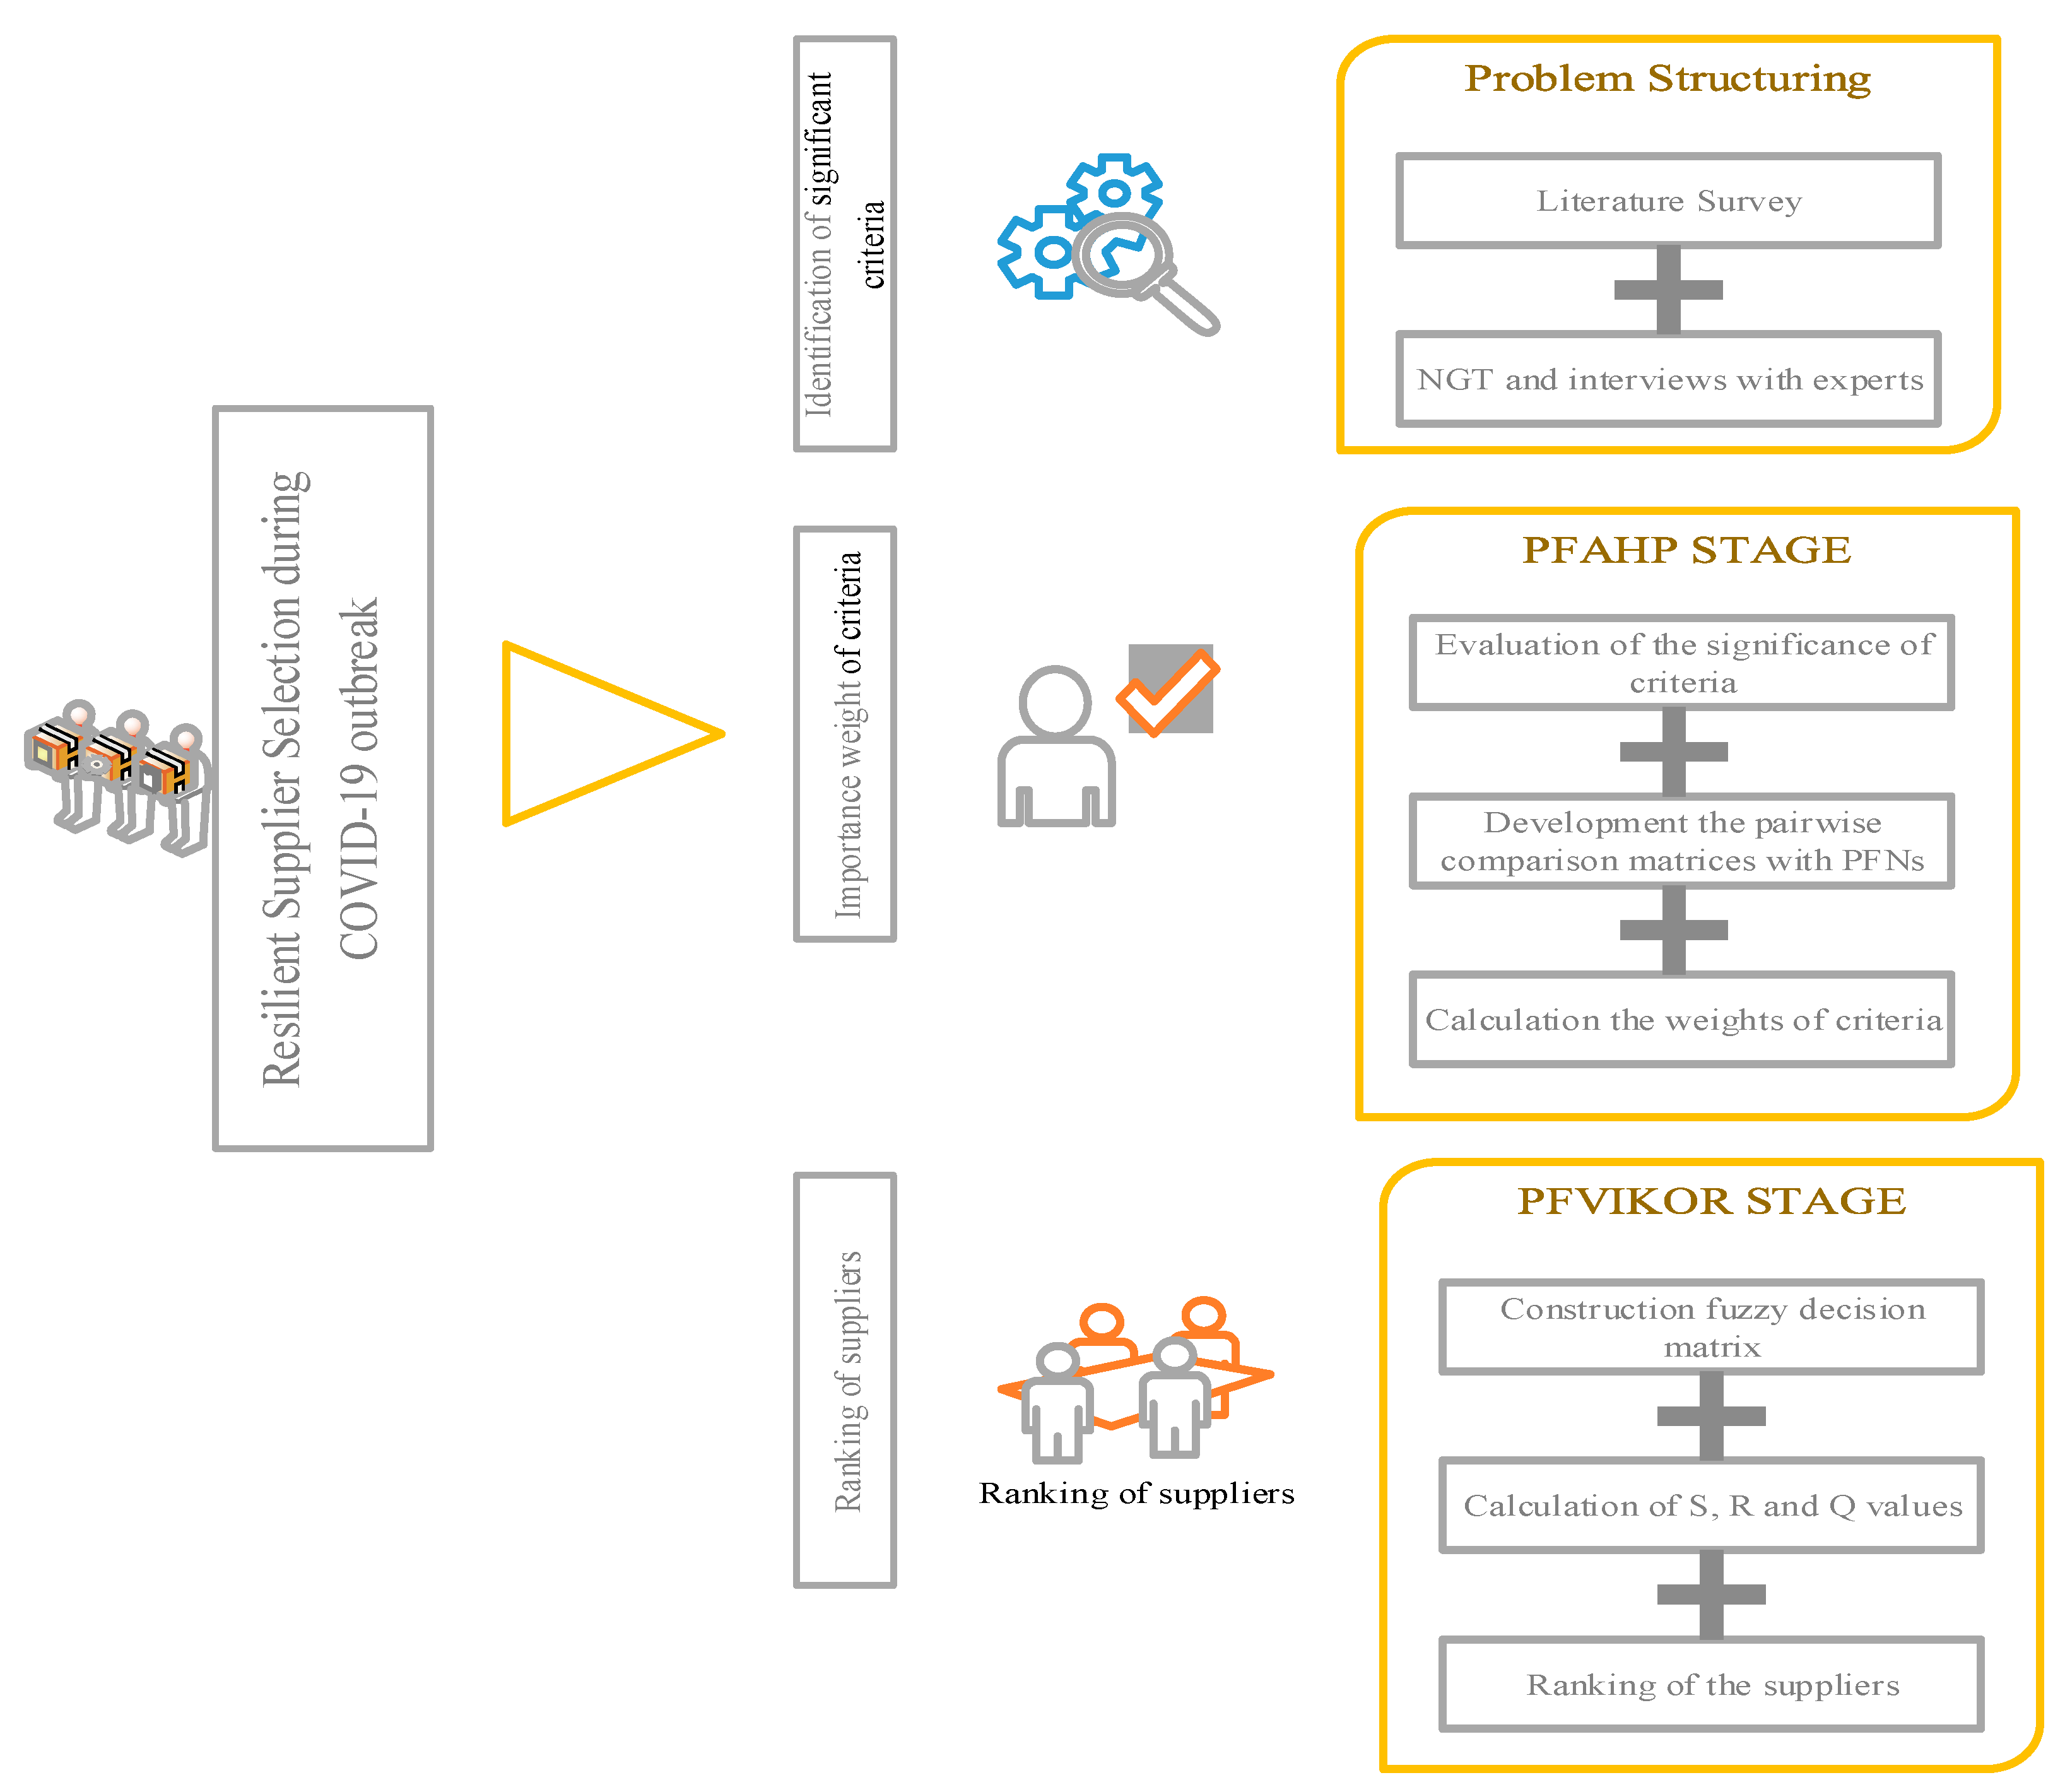
3. Materials and Methods
3.1. The PFAHP
3.2. The PFVIKOR
4. A Case Study
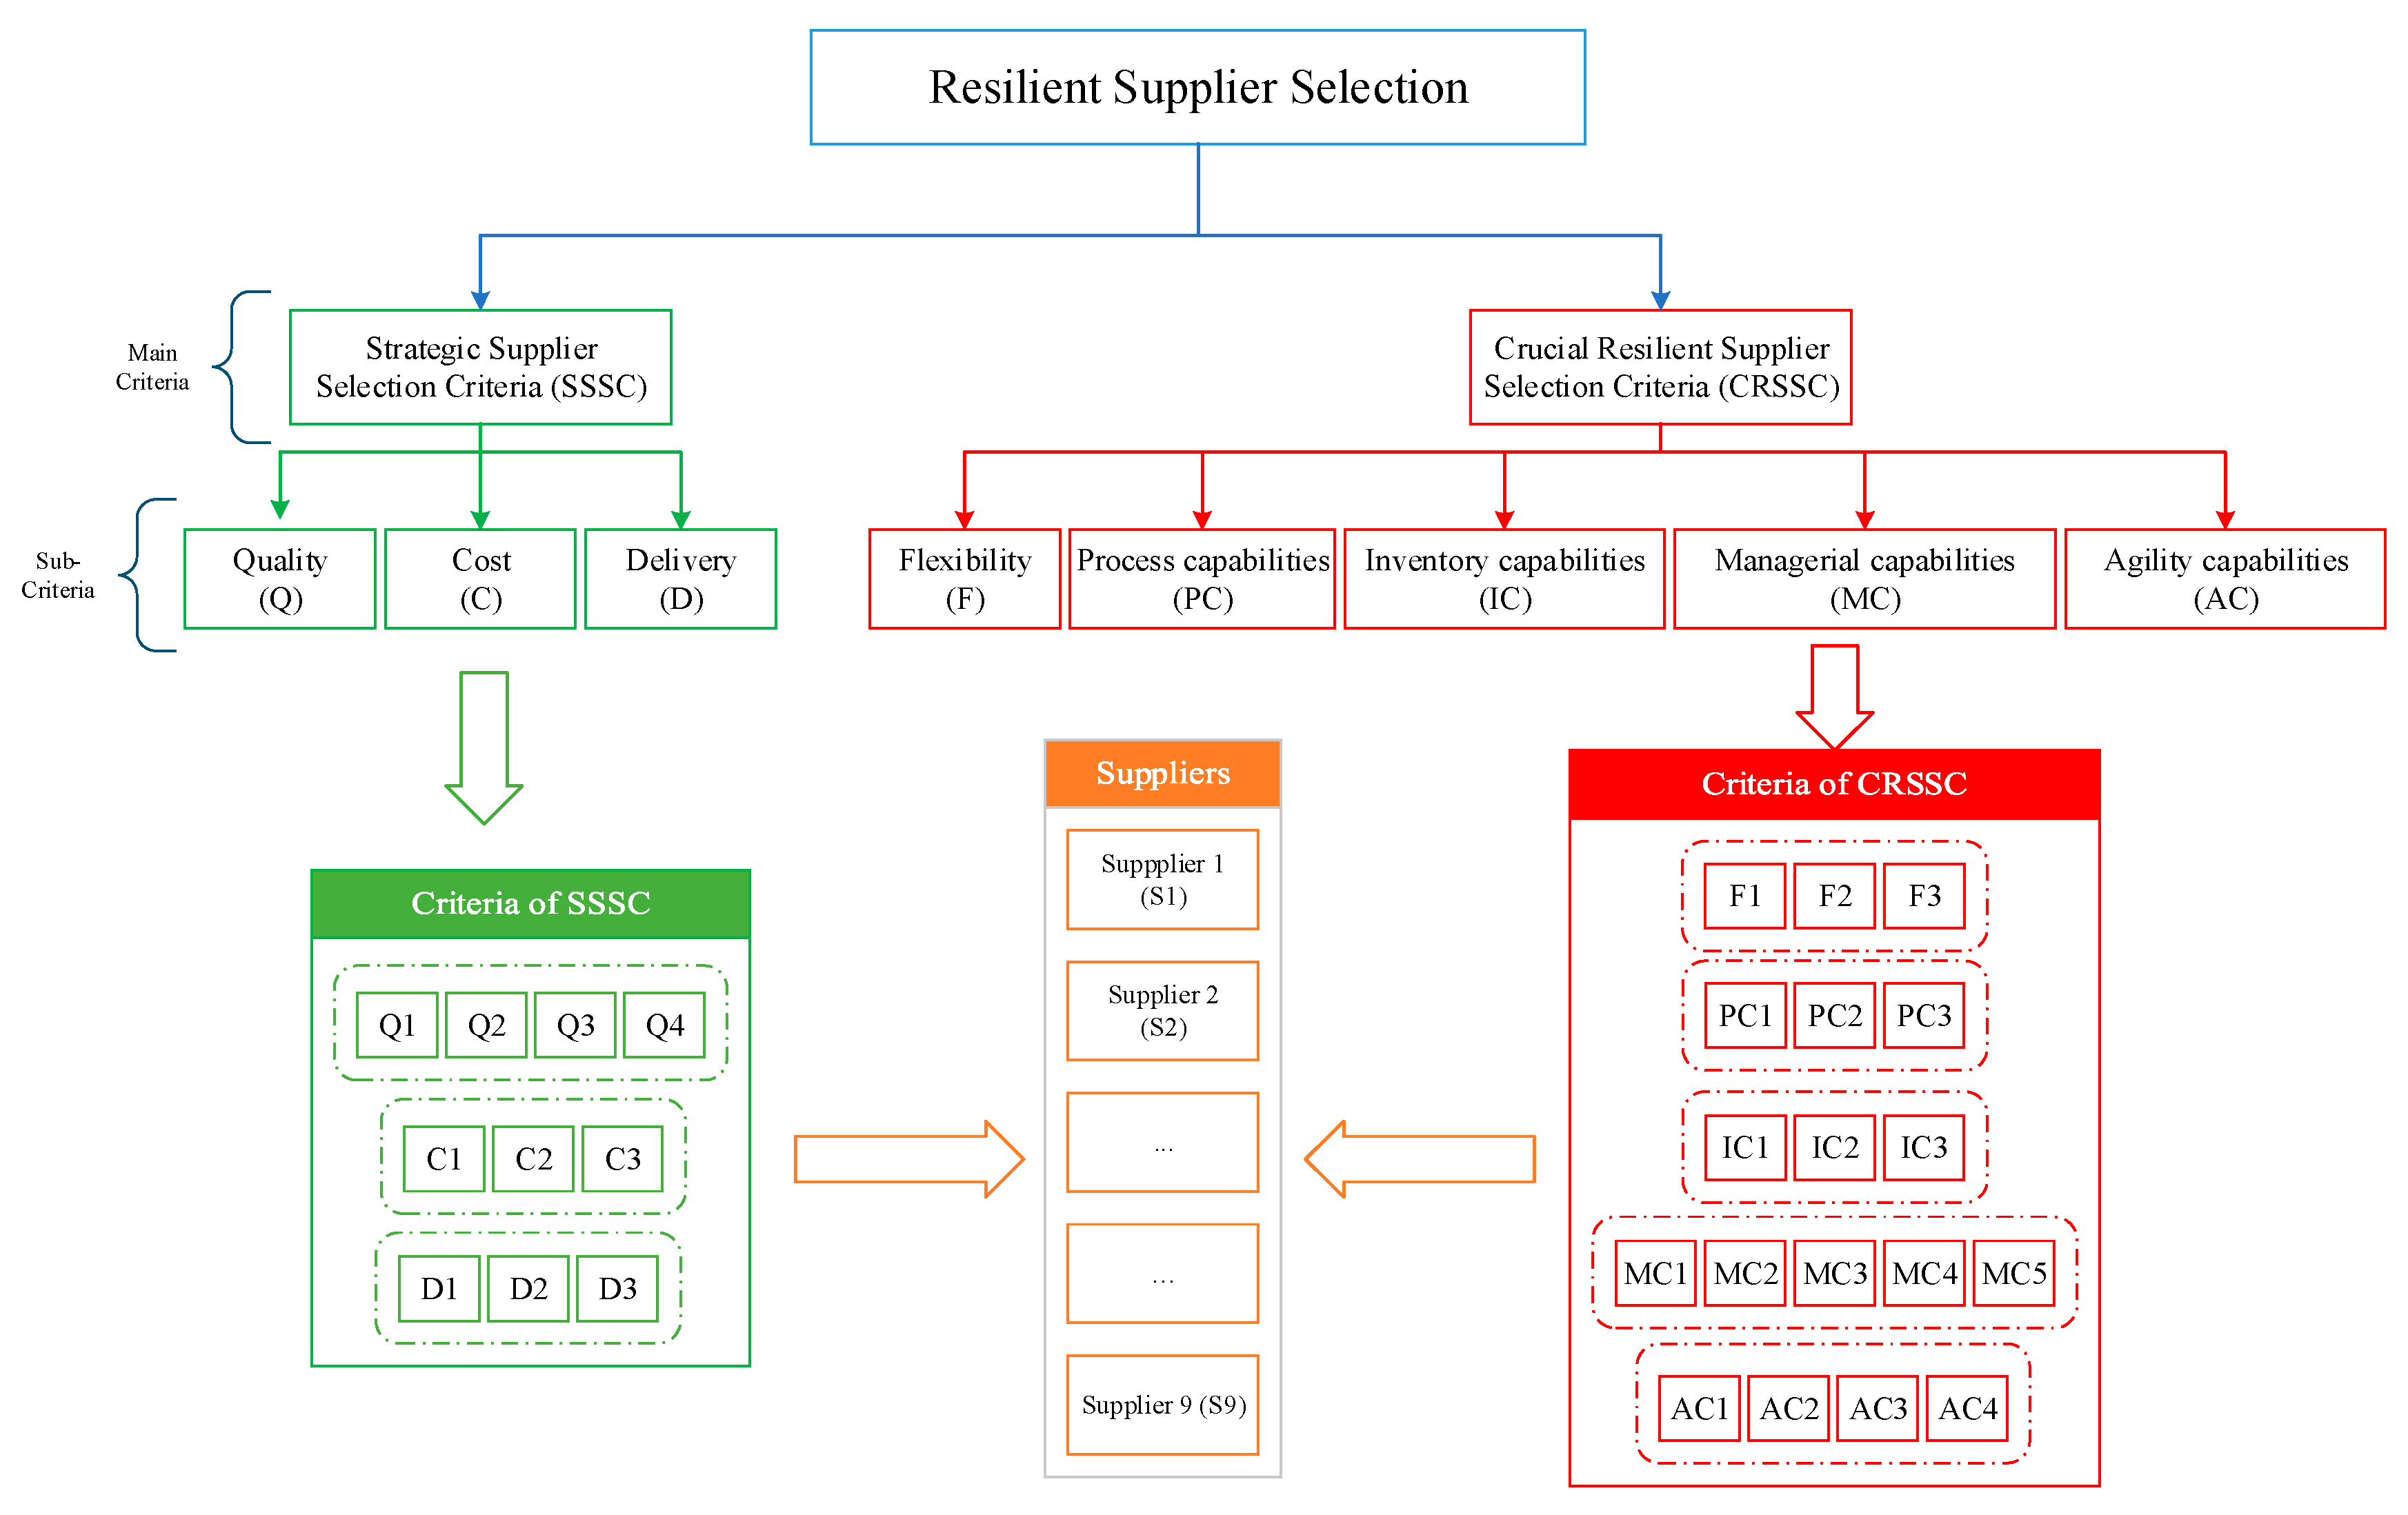
4.1. Identifying Criteria and Obtaining the Weights of the Criteria
4.2. Ranking of Suppliers
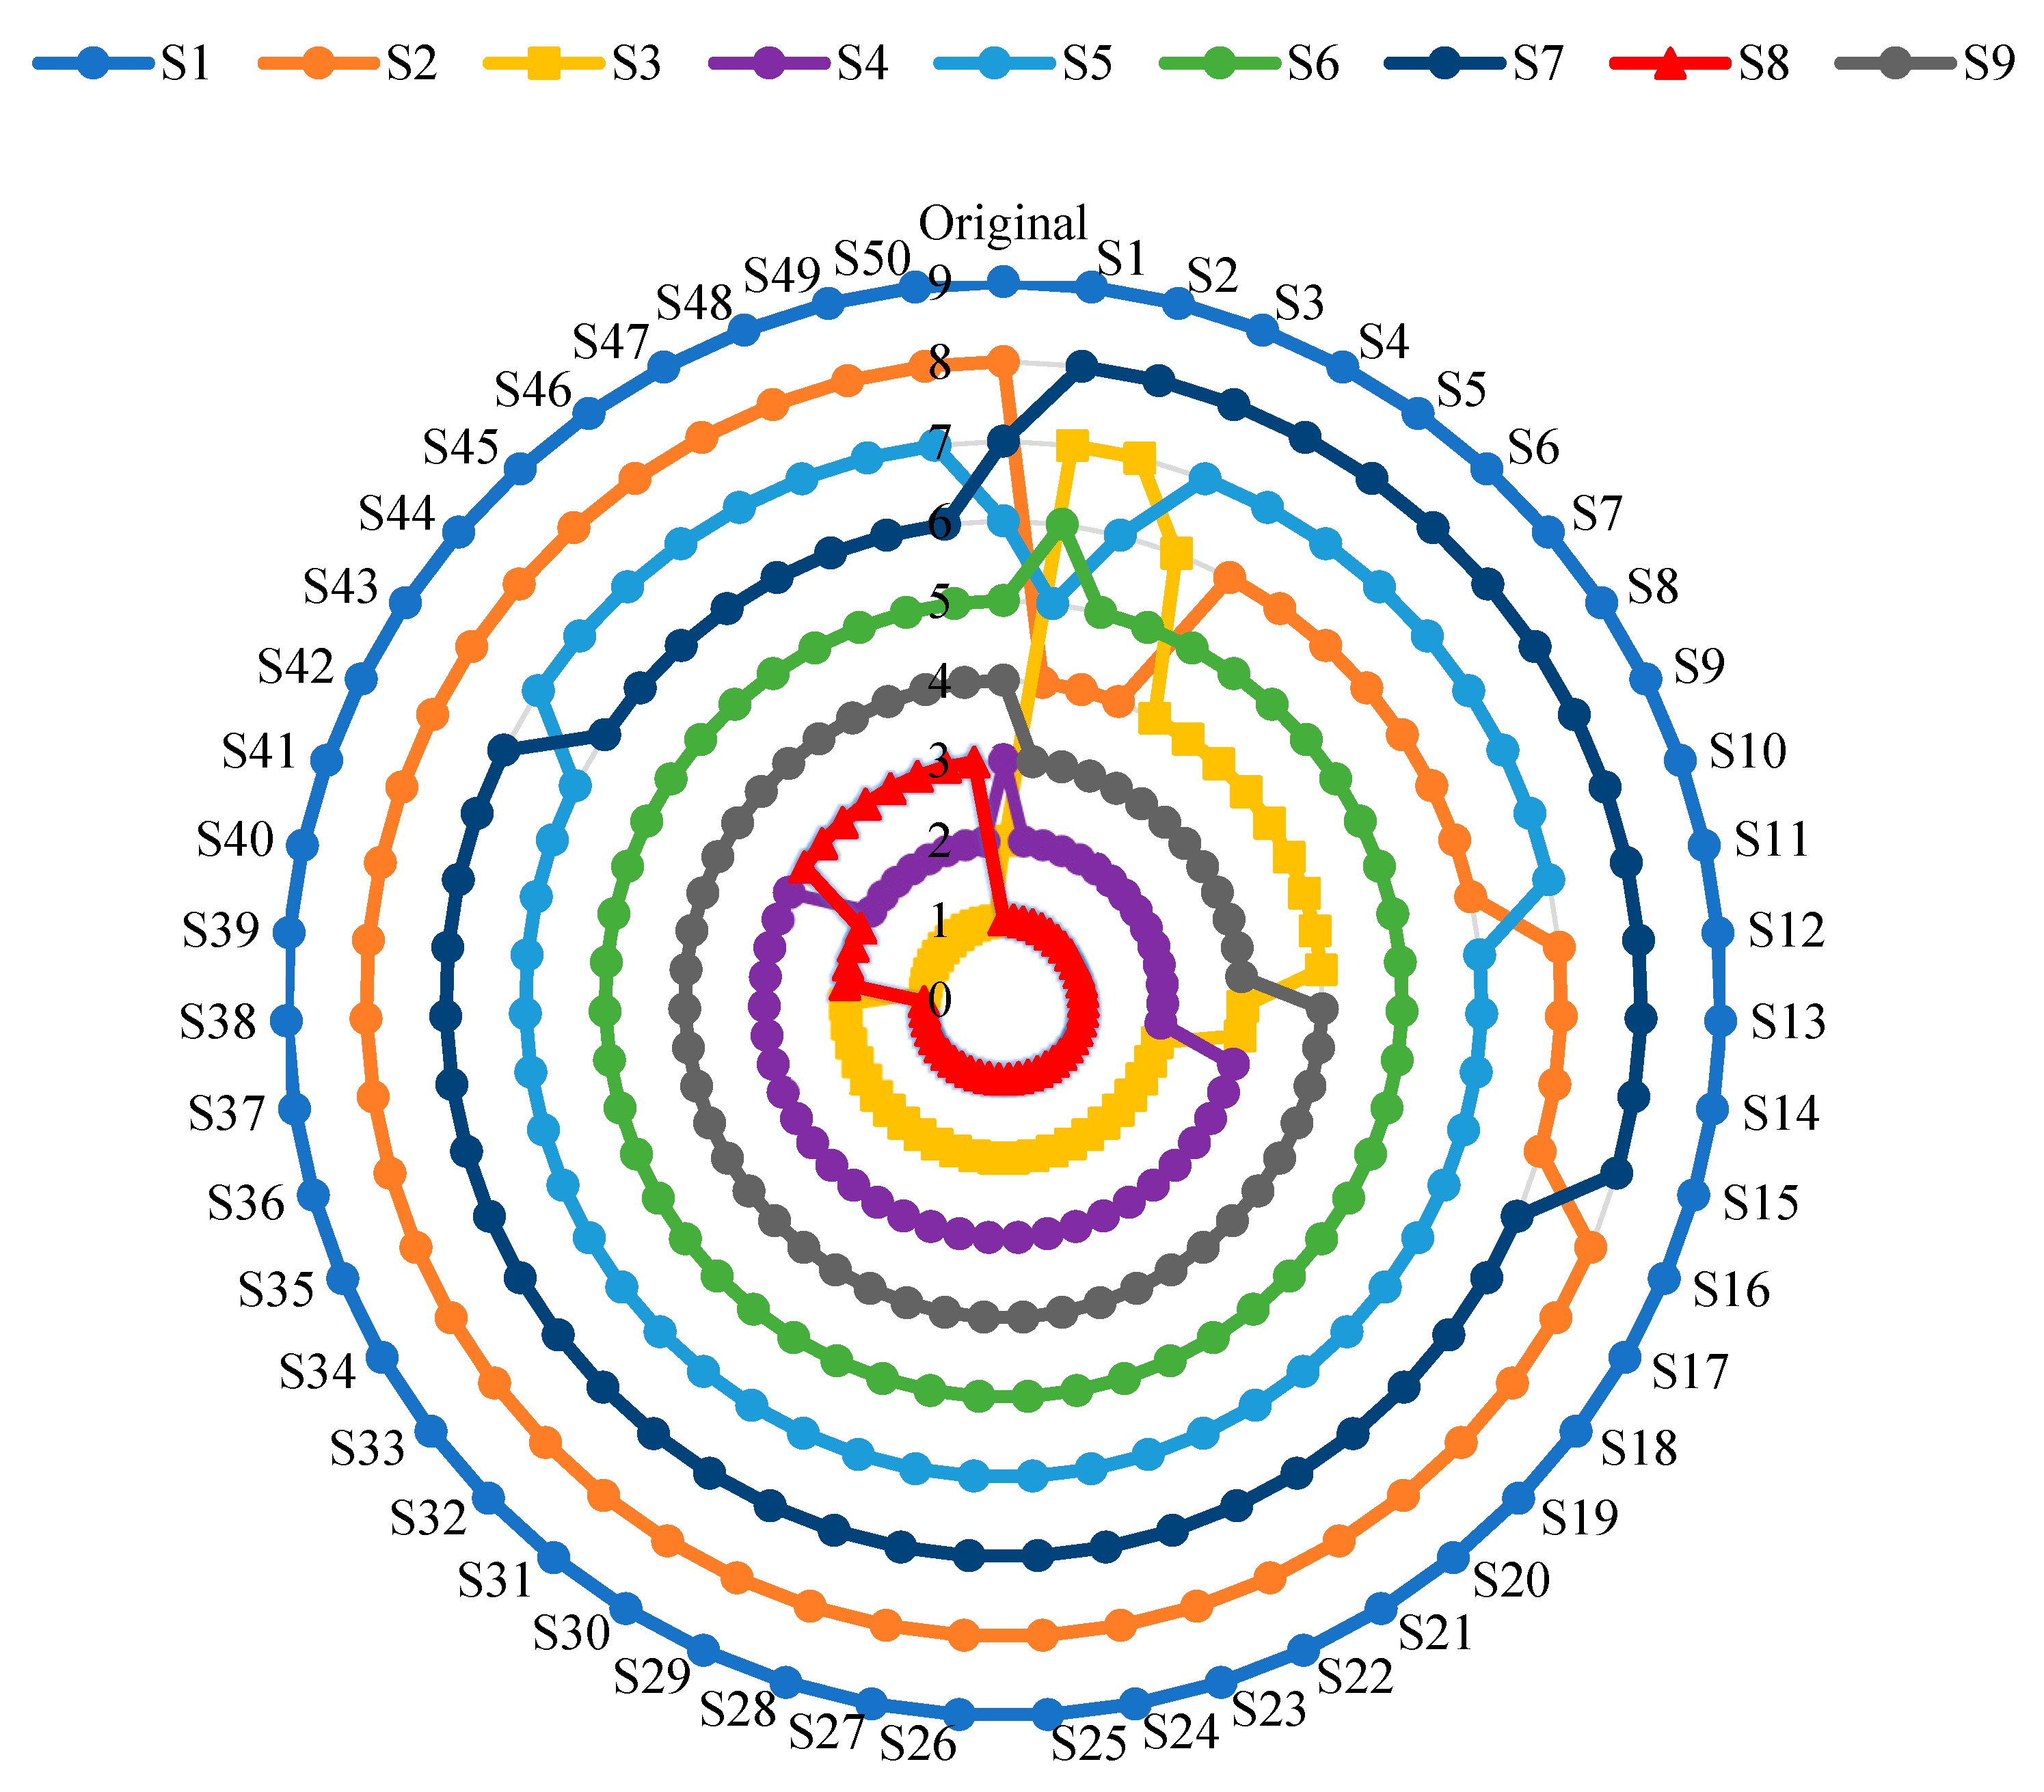
5. Sensitivity Analysis and Validation of the Results
5.1. Variation of Criteria Weights
5.2. Influence of Parameter on the Ranking Results
5.3. Comparative Analysis Based on Different MCDM Methods
6. Conclusions, Policy, and Limitations of the Study
6.1. Policy Implications
6.2. Limitations of the Study
Author Contributions
Funding
Data Availability Statement
Conflicts of Interest
References
- Mehrjerdi, Y.Z.; Shafiee, M. A resilient and sustainable closed-loop supply chain using multiple sourcing and information sharing strategies. J. Clean. Prod. 2020, 289, 125141. [Google Scholar] [CrossRef]
- Hanna, D.; Huang, Y. The Impact of SARS on Asian Economies. Asian Econ. Pap. 2004, 3, 102–112. [Google Scholar] [CrossRef]
- Lee, A.H.I. A fuzzy supplier selection model with the consideration of benefits, opportunities, costs and risks. Expert Syst. Appl. 2009, 36, 2879–2893. [Google Scholar] [CrossRef]
- Hillman, M.; Keltz, H. Managing Risk in the Supply Chain: A Quantitative Study; AMR Research: Boston, MA, USA, 2007. [Google Scholar]
- Goel, R.K.; Saunoris, J.W.; Goel, S.S. Supply chain performance and economic growth: The impact of COVID-19 disruptions. J. Policy Model. 2021, 43, 298–316. [Google Scholar] [CrossRef]
- Singh, S.; Kumar, R.; Panchal, R.; Tiwari, M.K. Impact of COVID-19 on logistics systems and disruptions in food supply chain. Int. J. Prod. Res. 2021, 59, 1993–2008. [Google Scholar] [CrossRef]
- Han, S.-L.; Sung, H.-S.; Shim, H.-S. Antecedents and performance outcomes of flexibility in industrial customer–supplier relationships. J. Bus. Res. 2014, 67, 2115–2122. [Google Scholar] [CrossRef]
- Wagner, S.M.; Grosse-Ruyken, P.T.; Erhun, F. Determinants of sourcing flexibility and its impact on performance. Int. J. Prod. Econ. 2018, 205, 329–341. [Google Scholar] [CrossRef]
- Gosling, J.; Purvis, L.; Naim, M.M. Supply chain flexibility as a determinant of supplier selection. Int. J. Prod. Econ. 2010, 128, 11–21. [Google Scholar] [CrossRef]
- Pamucar, D.; Yazdani, M.; Obradovic, R.; Kumar, A.; Torres-Jiménez, M. A novel fuzzy hybrid neutrosophic decision-making approach for the resilient supplier selection problem. Int. J. Intell. Syst. 2020, 35, 1934–1986. [Google Scholar] [CrossRef]
- Peck, H. Drivers of supply chain vulnerability: An integrated framework. Int. J. Phys. Distrib. Logist. Manag. 2005, 35, 210–232. [Google Scholar] [CrossRef]
- Memon, M.S.; Lee, Y.H.; Mari, S.I. Group multi-criteria supplier selection using combined grey systems theory and uncertainty theory. Expert Syst. Appl. 2015, 42, 7951–7959. [Google Scholar] [CrossRef]
- Qin, J.; Liu, X.; Pedrycz, W. An extended TODIM multi-criteria group decision making method for green supplier selection in interval type-2 fuzzy environment. Eur. J. Oper. Res. 2017, 258, 626–638. [Google Scholar] [CrossRef]
- Gupta, S.; Soni, U.; Kumar, G. Green supplier selection using multi-criterion decision making under fuzzy environment: A case study in automotive industry. Comput. Ind. Eng. 2019, 136, 663–680. [Google Scholar] [CrossRef]
- Çalık, A. A novel Pythagorean fuzzy AHP and fuzzy TOPSIS methodology for green supplier selection in the Industry 4.0 era. Soft Comput. 2020, 25, 2253–2265. [Google Scholar] [CrossRef]
- Rani, P.; Mishra, A.R.; Pardasani, K.R.; Mardani, A.; Liao, H.; Streimikiene, D. A novel VIKOR approach based on entropy and divergence measures of Pythagorean fuzzy sets to evaluate renewable energy technologies in India. J. Clean. Prod. 2019, 238, 117936. [Google Scholar] [CrossRef]
- Ozdemir, Y.; Gul, M. Measuring development levels of NUTS-2 regions in Turkey based on capabilities approach and multi-criteria decision-making. Comput. Ind. Eng. 2019, 128, 150–169. [Google Scholar] [CrossRef]
- Statista. Number of Cars Sold Worldwide between 2010 and 2021; Statista: Hamburg, Germany, 2020. [Google Scholar]
- Deloitte. Understanding COVID-19′s Impact on the Automotive Sector; Deloitte: Boston, MA, USA, 2020. [Google Scholar]
- Fallahpour, A.; Udoncy Olugu, E.; Nurmaya Musa, S.; Yew Wong, K.; Noori, S. A decision support model for sustainable supplier selection in sustainable supply chain management. Comput. Ind. Eng. 2017, 105, 391–410. [Google Scholar] [CrossRef]
- Shishodia, A.; Verma, P.; Dixit, V. Supplier evaluation for resilient project driven supply chain. Comput. Ind. Eng. 2019, 129, 465–478. [Google Scholar] [CrossRef]
- Mohammed, A. Towards ‘gresilient’ supply chain management: A quantitative study. Resources 2020, 155, 104641. [Google Scholar] [CrossRef]
- Davoudabadi, R.; Mousavi, S.M.; Sharifi, E. An integrated weighting and ranking model based on entropy, DEA and PCA considering two aggregation approaches for resilient supplier selection problem. J. Comput. Sci. 2020, 40, 101074. [Google Scholar] [CrossRef]
- Pramanik, D.; Mondal, S.C.; Haldar, A. Resilient supplier selection to mitigate uncertainty: Soft-computing approach. J. Model. Manag. 2020, 15, 1339–1361. [Google Scholar] [CrossRef]
- Fallahpour, A.; Nayeri, S.; Sheikhalishahi, M.; Wong, K.Y.; Tian, G.; Fathollahi-Fard, A.M. A hyper-hybrid fuzzy decision-making framework for the sustainable-resilient supplier selection problem: A case study of Malaysian Palm oil industry. Environ. Sci. Pollut. Res. 2021. ahead of print. [Google Scholar] [CrossRef]
- Sahebjamnia, N. Resilient supplier selection and order allocation under uncertainty. Sci. Iran. 2020, 27, 411–426. [Google Scholar] [CrossRef]
- Sureeyatanapas, P.; Waleekhajornlert, N.; Arunyanart, S.; Niyamosoth, T. Resilient Supplier Selection in Electronic Components Procurement: An Integration of Evidence Theory and Rule-Based Transformation into TOPSIS to Tackle Uncertain and Incomplete Information. Symmetry 2020, 12, 1109. [Google Scholar] [CrossRef]
- Hosseini, S.; Khaled, A.A. A Hybrid Ensemble and AHP Approach for Resilient Supplier Selection. J. Intell. Manuf. 2019, 30, 207–228. [Google Scholar] [CrossRef]
- Haldar, A.; Ray, A.; Banerjee, D.; Ghosh, S. Resilient supplier selection under a fuzzy environment. Int. J. Manag. Sci. Eng. Manag. 2014, 9, 147–156. [Google Scholar] [CrossRef]
- Valipour Parkouhi, S.; Safaei Ghadikolaei, A. A resilience approach for supplier selection: Using Fuzzy Analytic Network Process and grey VIKOR techniques. J. Clean. Prod. 2017, 161, 431–451. [Google Scholar] [CrossRef]
- Wang, T.-K.; Zhang, Q.; Chong, H.-Y.; Wang, X. Integrated Supplier Selection Framework in a Resilient Construction Supply Chain: An Approach via Analytic Hierarchy Process (AHP) and Grey Relational Analysis (GRA). Sustainability 2017, 9, 289. [Google Scholar] [CrossRef] [Green Version]
- Valipour Parkouhi, S.; Safaei Ghadikolaei, A.; Fallah Lajimi, H. Resilient supplier selection and segmentation in grey environment. J. Clean. Prod. 2019, 207, 1123–1137. [Google Scholar] [CrossRef]
- Davoudabadi, R.; Mousavi, S.M.; Mohagheghi, V.; Vahdani, B. Resilient Supplier Selection Through Introducing a New Interval-Valued Intuitionistic Fuzzy Evaluation and Decision-Making Framework. Arab. J. Sci. Eng. 2019, 44, 7351–7360. [Google Scholar] [CrossRef]
- Haldar, A.; Ray, A.; Banerjee, D.; Ghosh, S. A hybrid MCDM model for resilient supplier selection. Int. J. Manag. Sci. Eng. Manag. 2012, 7, 284–292. [Google Scholar] [CrossRef]
- Sahu, A.K.; Datta, S.; Mahapatra, S.S. Evaluation and selection of resilient suppliers in fuzzy environment. Benchmarking Int. J. 2016, 23, 651–673. [Google Scholar] [CrossRef]
- Pramanik, D.; Haldar, A.; Mondal, S.C.; Naskar, S.K.; Ray, A. Resilient supplier selection using AHP-TOPSIS-QFD under a fuzzy environment. Int. J. Manag. Sci. Eng. Manag. 2017, 12, 45–54. [Google Scholar] [CrossRef]
- Ilbahar, E.; Karaşan, A.; Cebi, S.; Kahraman, C. A novel approach to risk assessment for occupational health and safety using Pythagorean fuzzy AHP & fuzzy inference system. Saf. Sci. 2018, 103, 124–136. [Google Scholar] [CrossRef]
- Gul, M. Application of Pythagorean fuzzy AHP and VIKOR methods in occupational health and safety risk assessment: The case of a gun and rifle barrel external surface oxidation and colouring unit. Int. J. Occup. Saf. Ergon. 2018, 26, 705–718. [Google Scholar] [CrossRef]
- Gul, M.; Ak, M.F. A comparative outline for quantifying risk ratings in occupational health and safety risk assessment. J. Clean. Prod. 2018, 196, 653–664. [Google Scholar] [CrossRef]
- Cui, F.-B.; You, X.-Y.; Shi, H.; Liu, H.-C. Optimal Siting of Electric Vehicle Charging Stations Using Pythagorean Fuzzy VIKOR Approach. Math. Probl. Eng. 2018, 2018, 9262067. [Google Scholar] [CrossRef]
- Büyüközkan, G.; Göçer, F. A Novel Approach Integrating AHP and COPRAS Under Pythagorean Fuzzy Sets for Digital Supply Chain Partner Selection. IEEE Trans. Eng. Manag. 2019, 68, 1486–1503. [Google Scholar] [CrossRef]
- Karasan, A.; Ilbahar, E.; Kahraman, C. A novel pythagorean fuzzy AHP and its application to landfill site selection problem. Soft Comput. 2019, 23, 10953–10968. [Google Scholar] [CrossRef]
- Mete, S. Assessing occupational risks in pipeline construction using FMEA-based AHP-MOORA integrated approach under Pythagorean fuzzy environment. Hum. Ecol. Risk Assess. Int. J. 2019, 25, 1645–1660. [Google Scholar] [CrossRef]
- Liang, D.; Zhang, Y.; Xu, Z.; Jamaldeen, A. Pythagorean fuzzy VIKOR approaches based on TODIM for evaluating internet banking website quality of Ghanaian banking industry. Appl. Soft Comput. 2019, 78, 583–594. [Google Scholar] [CrossRef]
- Mete, S.; Serin, F.; Oz, N.E.; Gul, M. A decision-support system based on Pythagorean fuzzy VIKOR for occupational risk assessment of a natural gas pipeline construction. J. Nat. Gas Sci. Eng. 2019, 71, 102979. [Google Scholar] [CrossRef]
- Gul, M.; Ak, M.F.; Guneri, A.F. Pythagorean fuzzy VIKOR-based approach for safety risk assessment in mine industry. J. Saf. Res. 2019, 69, 135–153. [Google Scholar] [CrossRef] [PubMed]
- Yucesan, M.; Kahraman, G. Risk evaluation and prevention in hydropower plant operations: A model based on Pythagorean fuzzy AHP. Energy Policy 2019, 126, 343–351. [Google Scholar] [CrossRef]
- Shete, P.C.; Ansari, Z.N.; Kant, R. A Pythagorean fuzzy AHP approach and its application to evaluate the enablers of sustainable supply chain innovation. Sustain. Prod. Consum. 2020, 23, 77–93. [Google Scholar] [CrossRef]
- Tepe, S.; Kaya, İ. A fuzzy-based risk assessment model for evaluations of hazards with a real-case study. Hum. Ecol. Risk Assess. Int. J. 2020, 26, 512–537. [Google Scholar] [CrossRef]
- Wang, L.; Li, W.; Li, H. Decision-making for ecological landslide prevention in tropical rainforests. Nat. Hazards 2020, 103, 985–1008. [Google Scholar] [CrossRef]
- Yucesan, M.; Gul, M. Hospital service quality evaluation: An integrated model based on Pythagorean fuzzy AHP and fuzzy TOPSIS. Soft Comput. 2020, 24, 3237–3255. [Google Scholar] [CrossRef]
- Sarkar, B.; Biswas, A. Pythagorean fuzzy AHP-TOPSIS integrated approach for transportation management through a new distance measure. Soft Comput. 2021, 25, 4073–4089. [Google Scholar] [CrossRef]
- Ayyildiz, E.; Taskin Gumus, A. Interval-valued Pythagorean fuzzy AHP method-based supply chain performance evaluation by a new extension of SCOR model: SCOR 4.0. Complex Intell. Syst. 2021, 7, 559–576. [Google Scholar] [CrossRef]
- Ayyildiz, E.; Taskin Gumus, A. Pythagorean fuzzy AHP based risk assessment methodology for hazardous material transportation: An application in Istanbul. Environ. Sci. Pollut. Res. 2021, 28, 35798–35810. [Google Scholar] [CrossRef]
- Bakioglu, G.; Atahan, A.O. AHP integrated TOPSIS and VIKOR methods with Pythagorean fuzzy sets to prioritize risks in self-driving vehicles. Appl. Soft Comput. 2021, 99, 106948. [Google Scholar] [CrossRef]
- Ayyildiz, E.; Taskin, A. A novel spherical fuzzy AHP-VIKOR methodology to determine serving petrol station selection during COVID-19 lockdown: A pilot study for İstanbul. Socio-Econ. Plan. Sci. 2022, 83, 101345. [Google Scholar] [CrossRef]
- Awasthi, A.; Govindan, K.; Gold, S. Multi-tier sustainable global supplier selection using a fuzzy AHP-VIKOR based approach. Int. J. Prod. Econ. 2018, 195, 106–117. [Google Scholar] [CrossRef] [Green Version]
- Hemmati, A.; Stålhane, M.; Hvattum, L.M.; Andersson, H. An effective heuristic for solving a combined cargo and inventory routing problem in tramp shipping. Comput. Oper. Res. 2015, 64, 274–282. [Google Scholar] [CrossRef]
- Ibishukcu, O.; Datar, A. Maintaining Power Relations in Supply Chain; Jönköping University: Jönköping, Sweden, 2016. [Google Scholar]
- Milovanovic, G.; Milovanovic, S.; Spasic, T. The role of contemporary web technologies in supply chain management. Ekonomika 2016, 62, 43–58. [Google Scholar] [CrossRef] [Green Version]
- Welker, G.A.; de Vries, J. Formalisation of the Ordering Process; University of Groningen: Groningen, The Netherlands, 2002. [Google Scholar]
- Chen, X.; Wan, N.; Wang, X. Flexibility and coordination in a supply chain with bidirectional option contracts and service requirement. Int. J. Prod. Econ. 2017, 193, 183–192. [Google Scholar] [CrossRef] [Green Version]
- Alikhani, R.; Torabi, S.A.; Altay, N. Retail supply chain network design with concurrent resilience capabilities. Int. J. Prod. Econ. 2021, 234, 108042. [Google Scholar] [CrossRef]
- Ivanov, D. Revealing interfaces of supply chain resilience and sustainability: A simulation study. Int. J. Prod. Res. 2018, 56, 3507–3523. [Google Scholar] [CrossRef] [Green Version]
- Salehi Sadghiani, N.; Torabi, S.A.; Sahebjamnia, N. Retail supply chain network design under operational and disruption risks. Transp. Res. Part E Logist. Transp. Rev. 2015, 75, 95–114. [Google Scholar] [CrossRef]
- Manello, A.; Calabrese, G. The influence of reputation on supplier selection: An empirical study of the European automotive industry. J. Purch. Supply Manag. 2019, 25, 69–77. [Google Scholar] [CrossRef]
- Scholten, K.; Schilder, S. The role of collaboration in supply chain resilience. Supply Chain. Manag. Int. J. 2015, 20, 471–484. [Google Scholar] [CrossRef]
- Gunasekaran, A.; Subramanian, N.; Rahman, S. Supply chain resilience: Role of complexities and strategies. Int. J. Prod. Res. 2015, 53, 6809–6819. [Google Scholar] [CrossRef] [Green Version]
- Sabouhi, F.; Pishvaee, M.S.; Jabalameli, M.S. Resilient supply chain design under operational and disruption risks considering quantity discount: A case study of pharmaceutical supply chain. Comput. Ind. Eng. 2018, 126, 657–672. [Google Scholar] [CrossRef]
- Adobor, H. Supply chain resilience: A multi-level framework. Int. J. Logist. Res. Appl. 2019, 22, 533–556. [Google Scholar] [CrossRef]
- Ageron, B.; Bentahar, O.; Gunasekaran, A. Digital supply chain: Challenges and future directions. Supply Chain. Forum Int. J. 2020, 21, 133–138. [Google Scholar] [CrossRef]
- Ghadge, A.; Kara, M.E.; Moradlou, H.; Goswami, M. The impact of Industry 4.0 implementation on supply chains. J. Manuf. Technol. Manag. 2020, 31, 669–686. [Google Scholar] [CrossRef]
- Irfan, M.; Wang, M.; Akhtar, N. Enabling supply chain agility through process integration and supply flexibility. Asia Pac. J. Mark. Logist. 2019. [Google Scholar] [CrossRef]
- Lin, C.-T.; Chiu, H.; Chu, P.-Y. Agility index in the supply chain. Int. J. Prod. Econ. 2006, 100, 285–299. [Google Scholar] [CrossRef]
- Wu, K.-J.; Tseng, M.-L.; Chiu, A.S.F.; Lim, M.K. Achieving competitive advantage through supply chain agility under uncertainty: A novel multi-criteria decision-making structure. Int. J. Prod. Econ. 2017, 190, 96–107. [Google Scholar] [CrossRef]
- Agarwal, A.; Shankar, R.; Tiwari, M.K. Modeling agility of supply chain. Ind. Mark. Manag. 2007, 36, 443–457. [Google Scholar] [CrossRef]
- Chan, A.T.L.; Ngai, E.W.T.; Moon, K.K.L. The effects of strategic and manufacturing flexibilities and supply chain agility on firm performance in the fashion industry. Eur. J. Oper. Res. 2017, 259, 486–499. [Google Scholar] [CrossRef]
- Yang, J. Supply chain agility: Securing performance for Chinese manufacturers. Int. J. Prod. Econ. 2014, 150, 104–113. [Google Scholar] [CrossRef]
- Ijadi Maghsoodi, A.; Kavian, A.; Khalilzadeh, M.; Brauers, W.K.M. CLUS-MCDA: A novel framework based on cluster analysis and multiple criteria decision theory in a supplier selection problem. Comput. Ind. Eng. 2018, 118, 409–422. [Google Scholar] [CrossRef]
- Kannan, D.; Govindan, K.; Rajendran, S. Fuzzy Axiomatic Design approach based green supplier selection: A case study from Singapore. J. Clean. Prod. 2015, 96, 194–208. [Google Scholar] [CrossRef]
- Mina, H.; Kannan, D.; Gholami-Zanjani, S.M.; Biuki, M. Transition towards circular supplier selection in petrochemical industry: A hybrid approach to achieve sustainable development goals. J. Clean. Prod. 2021, 286, 125273. [Google Scholar] [CrossRef]
- Inemek, A.; Tuna, O. Global supplier selection strategies and implications for supplier performance: Turkish suppliers’ perception. Int. J. Logist. Res. Appl. 2009, 12, 381–406. [Google Scholar] [CrossRef]
- Jain, N.; Singh, A.R. Sustainable supplier selection under must-be criteria through Fuzzy inference system. J. Clean. Prod. 2020, 248, 119275. [Google Scholar] [CrossRef]
- Chen, Y.; Wang, S.; Yao, J.; Li, Y.; Yang, S. Socially responsible supplier selection and sustainable supply chain development: A combined approach of total interpretive structural modeling and fuzzy analytic network process. Bus. Strategy Environ. 2018, 27, 1708–1719. [Google Scholar] [CrossRef]
- Lamba, K.; Singh, S.P. Dynamic supplier selection and lot-sizing problem considering carbon emissions in a big data environment. Technol. Forecast. Soc. Chang. 2019, 144, 573–584. [Google Scholar] [CrossRef]
- Roy, S.A.; Ali, S.M.; Kabir, G.; Enayet, R.; Suhi, S.A.; Haque, T.; Hasan, R. A framework for sustainable supplier selection with transportation criteria. Int. J. Sustain. Eng. 2020, 13, 77–92. [Google Scholar] [CrossRef]
- Feng, J.; Gong, Z. Integrated linguistic entropy weight method and multi-objective programming model for supplier selection and order allocation in a circular economy: A case study. J. Clean. Prod. 2020, 277, 122597. [Google Scholar] [CrossRef]
- Hosseini, S.; Morshedlou, N.; Ivanov, D.; Sarder, M.D.; Barker, K.; Khaled, A.A. Resilient supplier selection and optimal order allocation under disruption risks. Int. J. Prod. Econ. 2019, 213, 124–137. [Google Scholar] [CrossRef]
- Peng, X.; Yang, Y. Fundamental Properties of Interval-Valued Pythagorean Fuzzy Aggregation Operators. Int. J. Intell. Syst. 2016, 31, 444–487. [Google Scholar] [CrossRef]
- Keshavarz Ghorabaee, M.; Amiri, M.; Zavadskas, E.K.; Turskis, Z.; Antucheviciene, J. A new multi-criteria model based on interval type-2 fuzzy sets and EDAS method for supplier evaluation and order allocation with environmental considerations. Comput. Ind. Eng. 2017, 112, 156–174. [Google Scholar] [CrossRef]
- Pamucar, D.; Yazdani, M.; Montero-Simo, M.J.; Araque-Padilla, R.A.; Mohammed, A. Multi-criteria decision analysis towards robust service quality measurement. Expert Syst. Appl. 2021, 170, 114508. [Google Scholar] [CrossRef]


| Author(s) | Aim | Resilience Criteria | Other Criteria | Method(s) | Fuzzy Environment | Application |
|---|---|---|---|---|---|---|
| [22] | To investigate resiliency and greenness in supply chain context and suggest a new resilient supplier assessment model | Development, agility, robustness, sensing, flexibility | Traditional criteria, green criteria, and related sub-criteria | DEMATEL and VIKOR | - | A chemical manufacturing company |
| [23] | To examine RSS problem | Pollution control initiatives, investment in capacity buffers, responsiveness, capacity for holding strategic inventory stocks for crises | Green criteria, and related sub-criteria | DEA, entropy, and principal components analysis | Interval type-2 fuzzy sets | Usage of secondary data from the previous study by Sen et al. (2016) |
| [24] | To develop a global performance measurement MCDM model | Strategic resilient criteria: Supply chain flexibility, adaptability, agility Information resilient criteria: Inconsistent data and information formats, inadequate stream of information, unreliability and unwillingness, inaccessibility, information sharing External resilient criteria Natural disasters, rapid development of technology, transportation network problem | General critical criteria, most critical criteria, and related sub-criteria | Fuzzy entropy, Fuzzy AHP Fuzzy additive ratio assessment | Type-1 fuzzy sets | An automotive original equipment manufacturer |
| [25] | To discuss the sustainable RSS problem | Robustness, responsiveness, cooperation, agility, visibility, risk reduction, surplus inventory, restorative capacity | General, sustainable, and related sub-criteria | FDEMATEL, FBWM, FANP, and fuzzy inference system | Type-1 fuzzy sets | A company in palm oil industry |
| [10] | To offer a decision-making structure for RSS | Top management support, reputation, corporate strategy, and commitment, customer/community pressures, economic stability, logistics-optimized infrastructure, environmental conservation, vulnerability and collaboration in risk reduction, supplier’s sustainability, SC velocity, supplier responsiveness and training | PW model and MABAC | Neutrosophic fuzzy sets | A construction company | |
| [26] | To develop a supplier selection and order allocation model | Quality, delivery, technology, environmental competency, and continuity, and related sub-criteria | Fuzzy DEMATEL, ANP, and fuzzy multi-objective mixed integer programming | Type-1 fuzzy sets | A wood products manufacturer | |
| [27] | RSS | Responsiveness, backup supplier contracts, restoration, risk of losing information and communication, service and support, innovation and technology, and product quality | TOPSIS | - | An electronic components manufacturer | |
| [28] | RSS | Absorptive capacity: Surplus inventory, location separation, interdependency, robustness, reliability Adaptive capacity: Rerouting, reorganization Restorative capacity: Repair/restoration | Traditional criteria, and related sub-criteria | Logistic regression, CART, neural network, and AHP | - | A reputed plastic pipe manufacturer |
| [29] | RSS | Resilience criteria: Supply chain density, supply chain complexity, responsiveness, number of critical nodes, and re-engineering Critical criteria: Buffer capacity, supplier’s resource flexibility, and lead time | General criteria, and related sub-criteria | AHP, QFD, and TOPSIS | - | A manufacturing company |
| [30] | RSS | Benefits: Delivery, flexibility, quality, and culture Opportunity: Joint growth, supplier’s technology, and relationship building. Cost: Cost of product and cost of relationship | - | FANP and Grey VIKOR | Type-1 fuzzy sets | An example from the wood and paper industry |
| [31] | RSS | Flexibility: Time flexibility, product flexibility, quantity flexibility Enterprise capacity, R&D, green abilities, and related sub-criteria | Primary performance factors and related sub-criteria | AHP and grey relational analysis | - | A two-story complex construction project |
| [32] | RSS | Enhancers of supplier resiliency, reducers of supplier resiliency, and related sub-criteria | Grey DEMATEL and Grey simple additive weighting | An example from the wood and paper industry | ||
| [33] | RSS | Investment in capacity buffers, responsiveness, and capacity for holding strategic inventory stocks for crises | Product quality, reliability of a product, functionality of product, customer satisfaction, and cost of the product | COPRAS and WASPAS | Interval-valued intuitionistic fuzzy sets | Two case studies from the literature |
| [34] | RSS | Investment in capacity buffers, responsiveness, and capacity for holding strategic inventory stocks for crises | Quality, reliability of the product, functionality of the product, customer satisfaction, and cost of the product | Fuzzy TOPSIS and Aggregate Fuzzy Weight | Type-1 fuzzy sets | An automobile manufacturer |
| [35] | RSS | Investment in capacity buffers, responsiveness, capacity for holding strategic inventory stocks for crises | Product quality, reliability of the product, functionality of the product, extent of customer satisfaction, and product price | Fuzzy VIKOR | Type-1 fuzzy sets | Empirical research |
| [36] | RSS | Buffer capacity, number of critical nodes, responsiveness, re-engineering, and adaptive capability | Quality, delivery, reliability, processing time, and profit margin | AHP, QFD, TOPSIS | Type-1 fuzzy sets | Empirical research |
| Author(s) | Aim | Method(s) Used | Application |
|---|---|---|---|
| [37] | Investigation of risk for the hazards of excavation process | Pythagorean fuzzy proportional risk assessment, Fine Kinney and PFAHP | Excavation process in a construction yard |
| [38] | Proposal of risk assessment approach | PFAHP and fuzzy VIKOR | A gun and rifle production facility |
| [39] | A comparative analysis in occupational health and safety risk assessment | PFAHP and FTOPSIS | An underground copper and zinc mine |
| [40] | Site selection for electric vehicle charging stations | PFVIKOR | An example in China |
| [16] | Selection of renewable energy technologies | PFVIKOR | An example in India |
| [17] | Development a new model for regional performance | PFAHP | 26 NUTS-2 regions of Turkey |
| [41] | Evaluation process to assess digital supply chains partners | PFAHP and PF COPRAS | A case study from Turkey |
| [42] | Presenting a novel model for landfill site selection problem | PFAHP | The city of Istanbul in Turkey |
| [43] | Suggestion of a risk assessment approach | FMEA, PFAHP, and PFMOORA | A concrete coating process of natural gas pipeline project |
| [44] | Evaluation of internet banking website quality | TODIM and PFVIKOR | A simulated example of ranking Internet banking websites |
| [45] | Forming a decision support system for occupational risk assessment | PFVIKOR | A natural gas pipeline construction |
| [46] | Propose a risk assessment approach | PFVIKOR | An underground copper and zinc mine |
| [47] | Performing a risk assessment model | PFAHP | A hydroelectric power plan |
| [48] | Identification of sustainable supply chain innovation enablers | PFAHP | An Indian manufacturing industry |
| [49] | Building a hazard evaluation approach | PFAHP | A company operating in Istanbul |
| [15] | Green supplier selection problem with industry 4.0 drivers | PFAHP and PFTOPSIS | An agricultural tool and machinery company |
| [50] | Construction of an ecological landslide prevention model | PFAHP | The specific tropical rainforest area China |
| [51] | Evaluating the hospital service quality | PFAHP and PFTOPSIS | A case study consisting of hospitals in Turkey |
| [52] | Proposal of new generalized distance measure and weighted generalized distance measures | PFAHP, PFTOPSIS Pythagorean fuzzy entropy | An international company |
| [53] | Evolution of a novel SCOR 4.0 model | BWM and PFAHP | The oil supply chain |
| [54] | Investigation of the critical risk factors for hazardous material transportation operations | PFAHP | A public company in İstanbul |
| [55] | Prioritization risks in self-driving vehicles | PFAHP and PFVIKOR | Application with experts |
| Linguistic Variables | Pythagorean Fuzzy Numbers | |||
|---|---|---|---|---|
| Certainly Low Importance—CLI | 0.00 | 0.00 | 0.90 | 1.00 |
| Very Low Importance—VLI | 0.10 | 0.20 | 0.80 | 0.90 |
| Low Importance—LI | 0.20 | 0.35 | 0.65 | 0.80 |
| Below Average Importance—BAI | 0.35 | 0.45 | 0.55 | 0.65 |
| Average Importance—AI | 0.45 | 0.55 | 0.45 | 0.55 |
| Above Average Importance—AAI | 0.55 | 0.65 | 0.35 | 0.45 |
| High Importance—HI | 0.65 | 0.80 | 0.20 | 0.35 |
| Very High Importance—VHI | 0.80 | 0.90 | 0.10 | 0.20 |
| Certainly High Importance—CHI | 0.90 | 1.00 | 0.00 | 0.00 |
| Exactly Equal—EE | 0.1965 | 0.1965 | 0.1965 | 0.1965 |
| Main Criteria | Criteria | Sub-Criteria | Definition | Reference |
|---|---|---|---|---|
| Crucial Resilient Supplier Selection Criteria (CRRSC) | Flexibility (F) | Flexibility in delivery time (F1) | The ability to respond to variations in the customer demand | [58,59,60,61] |
| Flexibility in ordering (F2) | The ability to accommodate the competitive market environment | [62] | ||
| Customization (F3) | The ability to customize the product mix as requested by the buyer. | [3,30] | ||
| Process capabilities (PC) | Facility fortification (PC1) | The ability to alleviate risks through proactive capability | [63,64,65] | |
| Restorative capacity (PC2) | The ability to repair or restore damaged facilities | [25,28] | ||
| Investment in capacity buffers (PC3) | The ability to reduce risks with level of safety stock | [23,29] | ||
| Inventory capabilities (IC) | Capacity for holding strategic inventory stocks for crises (IC1) | The capacity for holding a large stock of parts and goods | [23,29,33,35] | |
| Surplus inventory (IC2) | The supplementary inventory for crises | [20,28] | ||
| Adaptive capability (IC3) | The ability to merge new knowledge and intelligence | [10,26] | ||
| Managerial capabilities (MC) | Reputation (MC1) | The perceptual image of suppliers | [10,31,66] | |
| Level of collaboration (MC2) | The ability of two or more companies to work together | [30,67] | ||
| Financial strength (MC3) | The ability to absorb fluctuations in cash flow | [68,69] | ||
| Management skills and compatibility (MC4) | The skills of managers in risky and unexpected events | [70] | ||
| Responsiveness (MC5) | The reaction speed of suppliers to market demand | [27,33,34] | ||
| Agility capabilities (AC) | Digitalization of supply chain(s) (AC1) | The ability to adopt innovative and disruptive technologies | [71,72] | |
| Process integration (AC2) | The ability to establish partnership linked into a network | [73,74,75] | ||
| Delivery speed (AC3) | The ability to meet the delivery target | [76,77] | ||
| Information integration (AC4) | The ability of sharing information by supply chain partners | [75,78] | ||
| Strategic Supplier Selection Criteria (SSSC) | Quality (Q) | Rejection rate of the product (Q1) | This criterion shows the rejected parts by the buyers | [20] |
| After-sale services (Q2) | The ability to provide necessary supports and guaranty/warranty services | [79,80,81] | ||
| Quality certificates (Q3) | The ability of suppliers complying with standards | [82,83] | ||
| Capability of Handling Abnormal Quality (Q4) | The ability of supplier handling abnormal quality problem | [3,20] | ||
| Cost (C) | Purchasing cost (C1) | The price of goods and materials of suppliers | [15,84] | |
| Transportation cost (C2) | The unit transportation cost of suppliers | [85,86] | ||
| Order cost (C3) | The order cost of suppliers | [87,88] | ||
| Delivery (D) | On-time delivery (D1) | The ability to measure delivery in time | [30] | |
| Order lead time (D2) | The ability of time that it takes to fulfill customer orders | [32,68] | ||
| Distribution network quality (D3) | The service ability of suppliers in delivering products | [3,68,81] |
| SSSC | CRSSC | |
|---|---|---|
| SSSC | EE, EE, EE, EE, EE, EE | HI, VLI, AAI, CLI, VHI, LI |
| CRSSC | LI, VHI, BAI, CHI, VLI, HI | EE, EE, EE, EE, EE, EE |
| C1 | C2 | |
|---|---|---|
| C1 | ([0.197, 0.197], [0.197, 0.197]) | ([0.000, 0.000], [0.662, 1000]) |
| C2 | ([0.399, 0.547], [0.523, 0.649]) | ([0.197, 0.197], [0.197, 0.197]) |
| Main Criteria | Weights | Criteria | Weights | Sub-Criteria | Weights | Global Weights |
|---|---|---|---|---|---|---|
| SSSC | 0.4077 | Q | 0.3729 | Q1 | 0.5224 | 0.0794 |
| Q2 | 0.1086 | 0.0165 | ||||
| Q3 | 0.2926 | 0.0445 | ||||
| Q4 | 0.0765 | 0.0116 | ||||
| C | 0.3295 | C1 | 0.4459 | 0.0599 | ||
| C2 | 0.2578 | 0.0346 | ||||
| C3 | 0.2962 | 0.0398 | ||||
| D | 0.2975 | D1 | 0.2705 | 0.0328 | ||
| D2 | 0.4663 | 0.0566 | ||||
| D3 | 0.2631 | 0.0319 | ||||
| CRSSC | 0.5923 | F | 0.4175 | F1 | 0.2478 | 0.0613 |
| F2 | 0.1960 | 0.0485 | ||||
| F3 | 0.5562 | 0.1376 | ||||
| PC | 0.3007 | PC1 | 0.3600 | 0.0641 | ||
| PC2 | 0.4423 | 0.0788 | ||||
| PC3 | 0.1977 | 0.0352 | ||||
| IC | 0.1406 | IC1 | 0.3100 | 0.0258 | ||
| IC2 | 0.3482 | 0.0290 | ||||
| IC3 | 0.3419 | 0.0285 | ||||
| MC | 0.0434 | MC1 | 0.2616 | 0.0067 | ||
| MC2 | 0.3440 | 0.0088 | ||||
| MC3 | 0.2062 | 0.0053 | ||||
| MC4 | 0.1468 | 0.0038 | ||||
| MC5 | 0.0414 | 0.0011 | ||||
| AC | 0.0977 | AC1 | 0.5971 | 0.0346 | ||
| AC2 | 0.1396 | 0.0081 | ||||
| AC3 | 0.1474 | 0.0085 | ||||
| AC4 | 0.1159 | 0.0067 |
| Linguistic Term | |
|---|---|
| Very Poor (VP) | (0.15, 0.85) |
| Poor (P) | (0.25, 0.75) |
| Medium Poor (MP) | (0.35, 0.65) |
| Medium (M) | (0.50, 0.45) |
| Medium Good (MG) | (0.65, 0.35) |
| Good (G) | (0.75, 0.25) |
| Very Good (VG) | (0.85, 0.15) |
| S1 | S2 | S3 | S4 | S5 | S6 | S7 | S8 | S9 | ||||||||||
|---|---|---|---|---|---|---|---|---|---|---|---|---|---|---|---|---|---|---|
| u | v | u | v | u | v | u | v | u | v | u | v | u | v | u | v | u | v | |
| Q1 | 0.508 | 0.549 | 0.470 | 0.535 | 0.561 | 0.422 | 0.726 | 0.275 | 0.529 | 0.532 | 0.546 | 0.478 | 0.540 | 0.489 | 0.661 | 0.368 | 0.581 | 0.445 |
| Q2 | 0.362 | 0.651 | 0.707 | 0.317 | 0.637 | 0.350 | 0.754 | 0.267 | 0.331 | 0.695 | 0.494 | 0.520 | 0.596 | 0.438 | 0.768 | 0.243 | 0.536 | 0.496 |
| Q3 | 0.609 | 0.402 | 0.633 | 0.411 | 0.749 | 0.252 | 0.792 | 0.208 | 0.740 | 0.260 | 0.555 | 0.432 | 0.713 | 0.301 | 0.689 | 0.331 | 0.527 | 0.516 |
| Q4 | 0.554 | 0.496 | 0.644 | 0.400 | 0.542 | 0.480 | 0.745 | 0.269 | 0.368 | 0.654 | 0.482 | 0.507 | 0.375 | 0.659 | 0.643 | 0.374 | 0.591 | 0.447 |
| C1 | 0.344 | 0.660 | 0.688 | 0.312 | 0.462 | 0.554 | 0.765 | 0.237 | 0.349 | 0.656 | 0.638 | 0.370 | 0.741 | 0.261 | 0.691 | 0.315 | 0.382 | 0.629 |
| C2 | 0.616 | 0.434 | 0.573 | 0.470 | 0.739 | 0.271 | 0.700 | 0.301 | 0.581 | 0.440 | 0.468 | 0.574 | 0.470 | 0.570 | 0.673 | 0.351 | 0.331 | 0.697 |
| C3 | 0.241 | 0.770 | 0.562 | 0.439 | 0.625 | 0.371 | 0.684 | 0.326 | 0.259 | 0.748 | 0.675 | 0.347 | 0.575 | 0.451 | 0.650 | 0.367 | 0.579 | 0.413 |
| D1 | 0.376 | 0.621 | 0.751 | 0.260 | 0.539 | 0.462 | 0.675 | 0.319 | 0.591 | 0.424 | 0.402 | 0.605 | 0.419 | 0.561 | 0.498 | 0.553 | 0.756 | 0.245 |
| D2 | 0.198 | 0.807 | 0.701 | 0.295 | 0.593 | 0.414 | 0.745 | 0.256 | 0.438 | 0.624 | 0.398 | 0.604 | 0.526 | 0.476 | 0.702 | 0.313 | 0.533 | 0.492 |
| D3 | 0.634 | 0.371 | 0.727 | 0.272 | 0.626 | 0.394 | 0.784 | 0.217 | 0.484 | 0.521 | 0.730 | 0.283 | 0.691 | 0.318 | 0.598 | 0.395 | 0.479 | 0.520 |
| F1 | 0.601 | 0.400 | 0.761 | 0.266 | 0.701 | 0.314 | 0.800 | 0.202 | 0.642 | 0.363 | 0.675 | 0.334 | 0.558 | 0.463 | 0.785 | 0.218 | 0.567 | 0.456 |
| F2 | 0.459 | 0.594 | 0.493 | 0.527 | 0.679 | 0.365 | 0.645 | 0.402 | 0.389 | 0.669 | 0.630 | 0.414 | 0.777 | 0.223 | 0.705 | 0.327 | 0.624 | 0.388 |
| F3 | 0.460 | 0.592 | 0.725 | 0.282 | 0.483 | 0.493 | 0.632 | 0.381 | 0.819 | 0.182 | 0.593 | 0.403 | 0.428 | 0.610 | 0.772 | 0.246 | 0.723 | 0.301 |
| PC1 | 0.497 | 0.556 | 0.582 | 0.448 | 0.635 | 0.394 | 0.655 | 0.376 | 0.543 | 0.483 | 0.596 | 0.423 | 0.449 | 0.572 | 0.754 | 0.257 | 0.389 | 0.602 |
| PC2 | 0.709 | 0.322 | 0.587 | 0.444 | 0.664 | 0.341 | 0.528 | 0.518 | 0.792 | 0.211 | 0.616 | 0.388 | 0.575 | 0.473 | 0.736 | 0.284 | 0.672 | 0.363 |
| PC3 | 0.512 | 0.541 | 0.741 | 0.267 | 0.685 | 0.317 | 0.742 | 0.272 | 0.558 | 0.450 | 0.570 | 0.419 | 0.587 | 0.420 | 0.797 | 0.211 | 0.611 | 0.407 |
| IC1 | 0.407 | 0.642 | 0.705 | 0.318 | 0.753 | 0.249 | 0.778 | 0.223 | 0.694 | 0.350 | 0.503 | 0.536 | 0.676 | 0.341 | 0.750 | 0.252 | 0.684 | 0.345 |
| IC2 | 0.384 | 0.667 | 0.564 | 0.472 | 0.624 | 0.387 | 0.775 | 0.226 | 0.570 | 0.477 | 0.723 | 0.275 | 0.743 | 0.262 | 0.600 | 0.396 | 0.591 | 0.450 |
| IC3 | 0.553 | 0.480 | 0.789 | 0.225 | 0.637 | 0.369 | 0.699 | 0.296 | 0.672 | 0.350 | 0.630 | 0.382 | 0.782 | 0.232 | 0.769 | 0.238 | 0.642 | 0.387 |
| MC1 | 0.553 | 0.506 | 0.577 | 0.480 | 0.554 | 0.486 | 0.612 | 0.432 | 0.635 | 0.398 | 0.581 | 0.428 | 0.739 | 0.270 | 0.728 | 0.279 | 0.608 | 0.435 |
| MC2 | 0.443 | 0.549 | 0.632 | 0.372 | 0.687 | 0.332 | 0.682 | 0.333 | 0.503 | 0.476 | 0.427 | 0.570 | 0.700 | 0.324 | 0.533 | 0.454 | 0.235 | 0.773 |
| MC3 | 0.727 | 0.281 | 0.617 | 0.415 | 0.608 | 0.434 | 0.629 | 0.396 | 0.584 | 0.433 | 0.612 | 0.392 | 0.611 | 0.428 | 0.740 | 0.275 | 0.517 | 0.524 |
| MC4 | 0.456 | 0.595 | 0.563 | 0.438 | 0.640 | 0.358 | 0.715 | 0.299 | 0.457 | 0.589 | 0.545 | 0.498 | 0.743 | 0.257 | 0.552 | 0.450 | 0.590 | 0.404 |
| MC5 | 0.523 | 0.470 | 0.767 | 0.241 | 0.575 | 0.408 | 0.535 | 0.437 | 0.454 | 0.553 | 0.519 | 0.529 | 0.658 | 0.346 | 0.661 | 0.369 | 0.775 | 0.242 |
| AC1 | 0.573 | 0.476 | 0.676 | 0.334 | 0.403 | 0.638 | 0.607 | 0.430 | 0.447 | 0.588 | 0.466 | 0.582 | 0.577 | 0.450 | 0.713 | 0.284 | 0.459 | 0.584 |
| AC2 | 0.593 | 0.448 | 0.707 | 0.298 | 0.569 | 0.437 | 0.801 | 0.200 | 0.596 | 0.453 | 0.435 | 0.588 | 0.712 | 0.287 | 0.716 | 0.293 | 0.502 | 0.537 |
| AC3 | 0.555 | 0.466 | 0.828 | 0.173 | 0.665 | 0.354 | 0.660 | 0.366 | 0.631 | 0.403 | 0.598 | 0.395 | 0.411 | 0.624 | 0.606 | 0.422 | 0.422 | 0.601 |
| AC4 | 0.496 | 0.523 | 0.742 | 0.256 | 0.597 | 0.405 | 0.701 | 0.299 | 0.434 | 0.581 | 0.321 | 0.687 | 0.551 | 0.493 | 0.677 | 0.341 | 0.581 | 0.427 |
| Si | Ranking | Ri | Ranking | Qi | Ranking | |
|---|---|---|---|---|---|---|
| S1 | 0.621 | 9 | 0.085 | 6 | 0.967 | 9 |
| S2 | 0.437 | 4 | 0.083 | 5 | 0.343 | 4 |
| S3 | 0.430 | 3 | 0.051 | 2 | 0.450 | 7 |
| S4 | 0.426 | 2 | 0.111 | 9 | 0.204 | 2 |
| S5 | 0.483 | 5 | 0.079 | 4 | 0.372 | 5 |
| S6 | 0.538 | 7 | 0.065 | 3 | 0.412 | 6 |
| S7 | 0.531 | 6 | 0.094 | 7 | 0.871 | 8 |
| S8 | 0.363 | 1 | 0.047 | 1 | 0.000 | 1 |
| S9 | 0.540 | 8 | 0.098 | 8 | 0.253 | 3 |
Disclaimer/Publisher’s Note: The statements, opinions and data contained in all publications are solely those of the individual author(s) and contributor(s) and not of MDPI and/or the editor(s). MDPI and/or the editor(s) disclaim responsibility for any injury to people or property resulting from any ideas, methods, instructions or products referred to in the content. |
© 2023 by the authors. Licensee MDPI, Basel, Switzerland. This article is an open access article distributed under the terms and conditions of the Creative Commons Attribution (CC BY) license (https://creativecommons.org/licenses/by/4.0/).
Share and Cite
Çalik, A.; Onifade, S.T.; Alola, A.A. Evaluating Supply Resilience Performance of an Automotive Industry during Operational Shocks: A Pythagorean Fuzzy AHP-VIKOR-Based Approach. Systems 2023, 11, 396. https://doi.org/10.3390/systems11080396
Çalik A, Onifade ST, Alola AA. Evaluating Supply Resilience Performance of an Automotive Industry during Operational Shocks: A Pythagorean Fuzzy AHP-VIKOR-Based Approach. Systems. 2023; 11(8):396. https://doi.org/10.3390/systems11080396
Chicago/Turabian StyleÇalik, Ahmet, Stephen Taiwo Onifade, and Andrew Adewale Alola. 2023. "Evaluating Supply Resilience Performance of an Automotive Industry during Operational Shocks: A Pythagorean Fuzzy AHP-VIKOR-Based Approach" Systems 11, no. 8: 396. https://doi.org/10.3390/systems11080396