Article

Design Model for the Digital Shadow of a Value Stream

1
Institute for Production Management, Technology and Machine Tools, Technical University of Darmstadt, 64287 Darmstadt, Germany
2
WHITE LION Dry Ice & Laser Cleaning Technology GmbH, 64367 Mühltal, Germany
3
Sanofi-Aventis Deutschland GmbH, 65926 Frankfurt, Germany
*
Author to whom correspondence should be addressed.
Systems 2024, 12(1), 20; https://doi.org/10.3390/systems12010020
Submission received: 28 November 2023 / Revised: 2 January 2024 / Accepted: 5 January 2024 / Published: 9 January 2024
(This article belongs to the Special Issue Lean Manufacturing in Industry 4.0)

Abstract

:
The value stream method, a key tool in industry to analyze and visualize value streams in production, aims to holistically optimize process steps, reduce waste, and achieve continuous material flow. However, this method primarily relies on data from a single on-site inspection, which is subjective and represents just a snapshot of the process. This limitation can lead to uncertainty and potentially incorrect decisions, especially in industries producing customer-specific products. The increasing digitization in production offers a solution to this limitation by supporting the method through data provision. The concept of the digital shadow emerges as a key tool that systematically captures, processes, and integrates necessary data into a model to enhance traditional value stream mapping. This addresses the method’s shortcomings, especially in heterogeneous IT landscapes and complex value streams. To effectively implement the digital shadow this study identifies concepts of digital shadows and their key components and evaluates them for their relevance in industrial environments using an expert study. Based on the results, a design model is defined. This model entails guidelines to support companies with the practical implementation of the digital shadow of a value stream. Lastly, the model is evaluated on a realistic value stream in a learning factory.

1. Introduction

Global competition, short product life cycles, disruptive technologies and volatile markets regularly confront manufacturing companies with new challenges. Increased requirements for flexibility, efficiency and resilience of production and thus its value streams are indispensable [1]. Traditionally, production systems are usually designed for a specific combination of product mix and production volume. Neglecting this optimal operating point typically leads to efficiency losses [2]. To reduce these efficiency losses, it is necessary to have short-term updated information about the status of a production system or the associated value streams [3]. A method widely used in industry for the transparent representation of value streams is the value stream method [4,5]. Both material and information flows can be visualized with its use, and wastage in the process can be revealed [6]. However, with the need to adjust a value stream quickly and objectively to new challenges, the value stream method reaches its limits. The usually paper-based, single data collection on-site only enables a subjective snapshot of a value stream and does not consider the dynamic development of production [7]. Since the information to describe a value stream is typically collected through on-site inspection, the effort to update value stream parameters on a situational basis is too costly [8]. Although the proportion of available transaction data is increasing through the use of production data acquisition systems or technologies for automatic identification, these are usually not sufficient to describe the value stream completely [9]. Essential data, such as set-up times, technical availabilities or batch sizes, are not continuously recorded [10]. For this reason, a further development of the value stream method is necessary to be able to capture the dynamics in production systems. A study from 2017 [8] indicates that around two thirds of the lean experts questioned consider a further development of the value stream method with the help of Industry 4.0 technologies to be promising. The combination of both approaches has the potential to eliminate the aforementioned restrictions of the conventional value stream method without neglecting the actual goal—a reduction in waste in the value stream [8]. In recent years, multiple scientific papers examined which Industry 4.0 technology is most suitable for this application [11,12,13,14,15,16,17,18,19,20]. This showed that the concept of the digital shadow is considered the most likely to address the disadvantages mentioned and to further develop the value stream method towards a digital management approach. Therefore, the first research question is as follows:
RQ1. 
“How can the conventional value stream method be enhanced into a digital and data-based management approach using the concept of the digital shadow?”
The concept of the digital shadow has the potential to systematically capture the necessary data, condense it and make it available in a data model [21]. There are already approaches in the literature that deal with the implementation of digital twins in production [22,23]. A universally valid design model of the digital shadow for a value stream, however, does not exist. A design model can be understood as a so-called target model. It enables a system-oriented planning and design of complex systems [24]. In this way, large systems can be subdivided into individual parts and become manageable. The target model provides alternative solutions and decision recommendations for users [25]. Due to the heterogeneous IT landscapes and complexity of the value streams, though, there is a need for a generally valid model for the implementation of a digital shadow for a value stream [21]. To address this challenge, the second research question is as follows:
RQ2. 
“How should a design model for the digital shadow of a value stream be structured to support the value stream method?”
The model’s task is first to automate and objectify data collection at the area of value creation [26]. Second, the model must enable visualization and analysis of value stream performance, taking the following objectives into account:
  • Creating transparency through data across all processes, leading to improved visibility of processes.
  • Increasing responsiveness to react to changes and disruptions by providing decision makers with timely and relevant information.
  • Using the knowledge gained for continuous improvement of production processes, reducing waste and increasing overall efficiency.
  • Integrating different data sources and systems into a consistent representation of the value stream.
  • Providing data-driven decision support for strategic and operational decisions [21].
To ensure that the design model can support the aforementioned tasks in practice, the third research question is as follows:
RQ3. 
“Which elements are required in the design model from a practical perspective to fulfill the tasks?”
By answering the three research questions, this paper contributes to the further development of the conventional value stream method with the support of Industry 4.0 technology of the digital shadow. On the one hand, it shows the state of research in the context of the further development of the value stream method. On the other hand, the model to be developed will enable users of the value stream method to counteract the static project character of the value stream method in form of a one-off snapshot on the shopfloor. The design model will allow regular analysis of the value stream key figures and improvement of the value stream.
To implement such a model, this paper first determines existing concepts of digital shadows in the production context by means of a systematic literature analysis and identifies the most frequently used technical elements. These elements are subsequently assessed for relevance in real industrial environments with the help of an expert study. Based on the results, a design model is defined that supports the users during implementation. This is realized using design guidelines, which are used as framework conditions for the respective design elements. The design model including the guidelines is finally evaluated on a realistic value stream in a learning factory.
The structure of this paper is therefore as follows: Section 2 discusses the theoretical background of the value stream method and the digital shadow. The methodological approach to achieve the research objective is explained in Section 3. Section 4 presents the derived design model and is detailed in Section 5 with the help of design guidelines. The application and piloting take place in Section 6. Section 7 discusses the piloting and Section 8 summarizes the results and offers an outlook on future research activities needed.

2. Theoretical Background

2.1. Value Stream Management

Value stream management is not consistently defined in the literature. Often, the term is used synonymously with the value stream method [21,26]. A more detailed understanding can be found in the work of Erlach, who understands value stream management as the “continuous adaptation and improvement of the value stream during production operations” [6]. This includes, among other things, the planning and control of parameters, such as monitoring the number of kanban cards, as well as activities of conventional production planning. Following this understanding, there are three planning levels into which value stream management can be divided [6]:
  • Long-term planning to design a value stream;
  • Medium-term planning for balancing the production;
  • Short-term planning for production control.
Long-term planning aims to design a value stream. This includes, for example, the re-dimensioning of production resources in case of changes in customer demand or the redesign of material flow connections. In medium-term planning, the value stream is planned by balancing the production. Besides the formation of release quantities, an adjustment of Kanban and ConWIP quantities (constant work in progress) takes place, if necessary. Furthermore, it must be ensured that the installed capacities provided by personnel and labor planning can execute the production program. During short-term planning, the release units are sequenced for production and the bottleneck process is controlled at the operational level. The customer demand is transferred into a production program under constraints which must consider the available capacity and delivery deadlines [6]. In summary, it can be stated that value stream management means the planning, management, and control of the value stream along the material flow, with the aim of continuously enabling the best possible design of the value stream based on a holistic perspective [14]. Accordingly, an improvement of the value stream ideally does not take place selectively, but continuously. In consequence, continuous application of the value stream method is necessary to analyze the current state and design the future target state.
This is a major challenge for value stream managers, as the conventional value stream method has a static project character and, due to the intensive personnel effort required to implement the value stream method in companies, it is usually only applied occasionally and not regularly [8]. Only if companies manage to reduce the implementation and, above all, update effort of the value stream method, a continuous application and thus a holistic value stream management will be feasible in practice. To realize this, it is advisable to use digital support that reduces the effort required to update the value stream maps [8]. An analysis of existing approaches in the literature for enhancing the value stream method shows that the concept of the digital twin is seen as offering the greatest potential (see Table 1).
Ciano et al. use a multiple use case study to identify one-to-one relationships between Industry 4.0 technologies and lean production techniques. The value stream method is assigned to the concept of vertical integration. Linking them has the potential to identify production weaknesses and eliminate them with the help of end-to-end data integration [11]. Dillinger et al., in turn, use a Delphi study and a domain mapping matrix to assign direct relationships between lean production techniques and Industry 4.0 technologies. This study identifies the majority of linkages. The linking of the value stream method with vertical integration, fundamental analytics, the area of big data, the digital twin, horizontal integration, support through Auto-ID, integration in cyber-physical systems, the use of real-time data, the use of cloud computing or support through simulation are named as promising further development potentials [12]. Erlach et al. use a literature analysis to determine the current directions for further development of the value stream method in context of digitalization. The main development potential is seen in supporting the application of the method through analytics or the implementation of a digital twin [13]. Langlotz and Aurich proceed in their analysis of existing links between Industry 4.0 technologies and lean production methods based on Industry 4.0 clusters. The value stream method is assigned to the automatic condition monitoring cluster with the concept of the digital twin [14]. Mayr et al. identify correlations between lean methods and Industry 4.0 technologies based on a use case. The biggest value for the value stream method is seen in increasing transparency through a real-time image using real-time data of the value stream. Supporting Industry 4.0 technologies are Auto-ID, the digital twin, the use of analytics and big data, the integration of cloud computing and the simulation of future target states [15]. Dillinger et al. assign Industry 4.0 technologies to the methods of lean production with the help of expert interviews. The technologies of big data, digital twin, Auto-ID and real-time data are assigned to the value stream method [16]. Florescu and Barabas use a systematic literature analysis to identify correlations between lean production methods and Industry 4.0 technologies. Regarding the value stream method, vertical and horizontal integration, big data, digital twin, cyber-physical systems and simulation correlate with the value stream method [17]. Liu and Zhang also use a systematic literature analysis to determine the current development directions of the value stream method. Within the context of Industry 4.0, the digital twin, the use of real-time data and the expansion using simulation are identified [18]. Ortega et al. conduct a case study analysis to identify the influence of lean production methods in combination with Industry 4.0 technologies on company performance. The technologies of big data, digital twin and cloud computing are identified for the value stream method, but without specifying the influence on company performance [19]. Pereira et al. use a systematic literature analysis to determine the influence of lean methods on companies with the aid of Industry 4.0 technologies. The use of analytics, big data and simulation in the context of the value stream method is mentioned [20].
Accordingly, the virtual image of reality—known as the digital shadow in the literature—has the capability to push the dynamization and further development of the method into a management approach. Therefore, the basics of the digital shadow concept are presented below.

2.2. Digital Shadow

The concept of the digital shadow is not uniquely defined in the literature [27,28]. Nevertheless, three standard components can be identified that form the core elements of the digital twin:
  • the object of observation is a physical object in real space;
  • the above is represented by a virtual object in virtual space;
  • both objects are connected directly by a bidirectional data and information flow [29].
Depending on the design of the bidirectional data and information flow, the literature refers to the concepts of digital model or digital twin. The concepts differ in the level of data integration between the physical and the virtual object [28,29]. A visualization of the differences can be found in Figure 1.
The digital model (DM) is the digital representation of a physical object without an automated data flow between the physical and the digital object. The digital object represents a sufficiently accurate image of the physical object for the specific application. Simulation models of planned factories, mathematical models of new products or virtual representations of physical objects are typical examples. Although the data of the physical object can be used to develop a DM, all data exchange is manual. A change to the physical object’s state has no immediate effect on the digital object and vice versa [29]. Based on the DM, the digital shadow (DS) has a unidirectional automated data flow—from the physical to the digital object. This means that a change of state in the real world is reflected in the virtual world, but not vice versa [29]. Often, the DS is used exclusively for the provision of information and has no further functionalities [30]. Schuh et al. specify that the DS is always related to a specific question or task and therefore only comprises a subset of the available data. Thus, it does not completely represent a production system. The data can originate from different data sources and do not have to be homogeneous, structured or centrally available. The DS thus serves to filter, link, abstract and aggregate the data with reference to the specific problem [31]. The digital twin (DT), in turn, relies on the DS by automating the data flow bidirectionally. A status change of the physical object leads to an immediate status change of the digital object and vice versa. Thus, the digital object is the controlling instance of the physical object [29]. In summary, it can be said that digital twins are virtual representations of immaterial or material objects (machines, processes, services, etc.) that represent the object as realistically as possible in the digital space. In contrast, the digital shadow is merely a sufficiently accurate virtual image of the object. Only by creating a metamodel based on the DS a DT can be created.
In the literature, different approaches are discussed to enable the integration of the concept of the digital shadow into the value stream management. The approaches can be categorized into conceptual approaches and methodological approaches, whereby the conceptual category can be further subdivided into technical and organizational concepts. The technical concepts primarily focus on the realization of a digital shadow or a twin for individual production processes [23,32,33,34,35,36,37,38]. A common deficit among these is their lack of detailed guidance for practical implementation. Similarly, the two organizational approaches, which aim at integrating the digital shadow into continuous value stream management [2,26], also miss guidelines for practical implementation. The methodological approaches, on the other hand, lack the necessary level of detail, meaning that a practical implementation of the approaches presented is unfeasible [39,40,41,42,43].

3. Methodological Approach

This paper follows a three-step approach to achieve the research objective (see Figure 2).
In a previous study by Frick and Metternich, a systematic literature analysis was conducted identifying 22 design models for digital shadows in manufacturing. These design models have been the foundation for the development of a theoretical design model with 16 design elements for a digital shadow of a value stream [21].
In this paper, first, an expert survey is conducted to determine the relevant design elements of a digital shadow for the value stream from an industrial perspective. Therefore, the aforementioned design elements are described in detail and transferred to the expert study. For the study, a total of 41 experts from manufacturing companies were directly consulted. A classification of the expert companies can be found in Figure 3.
A total of 44% of the respondents represent companies with fewer than 250 employees and therefore meet the definition of small- and medium-sized enterprises (SMEs) according to the EU definition [44]. The remaining 56% are representatives of large companies (see Figure 3a). In terms of annual sales, a comparable distribution can be seen: 54% fulfill the criterion of “annual sales of up to EUR 50 million per year”, which classifies them as SMEs, while the remaining 46% exceed this threshold (see Figure 3b).
Figure 3c shows the industry sector of the companies surveyed. Around 50% of the companies belong to the mechanical and plant engineering sector, while further 12% belong to the information and communication technology sector. A total of 10% of the respondents belong to the business service sector.
A total of 41 experts evaluated 16 different design elements in terms of their relevance for practical implementation. Therefore, the experts categorized the elements by rating their importance on a five-point Likert scale. The rating for each element was interpreted as interval-scaled in the six categories of not important, rather not important, neutral, rather important, important and no answer. In the following, only those design elements were included that the experts rated on average as at least “rather important” (mean value µ > 1.00). Thus, it was ensured that only design elements with high practical relevance are integrated within the digital shadow of a value stream. In this way, six design elements were not considered further (see Section 4.1).
In the second step, the identified elements were transferred into the design model. The theoretical design model published by Frick and Metternich in [21] served as a basis and was adapted accordingly (Section 4). The 10 design elements were classified into the three layers—physical, virtual and connection layer—of a digital shadow described in Section 2.2 (see Section 4.2).
In the third step, the individual design elements were specified using design guidelines. The guidelines are intended to detail the respective design elements and thus establish a framework that can be applied in manufacturing companies. To detail the guidelines, practical experience gained during a research project was used as a reference and enhanced with a broader literature analysis of the individual design elements (Section 5).

4. Design Model and Dimensions

The results of the expert study are first described as below (Section 4.1) and subsequently transferred to the design model (Section 4.2).

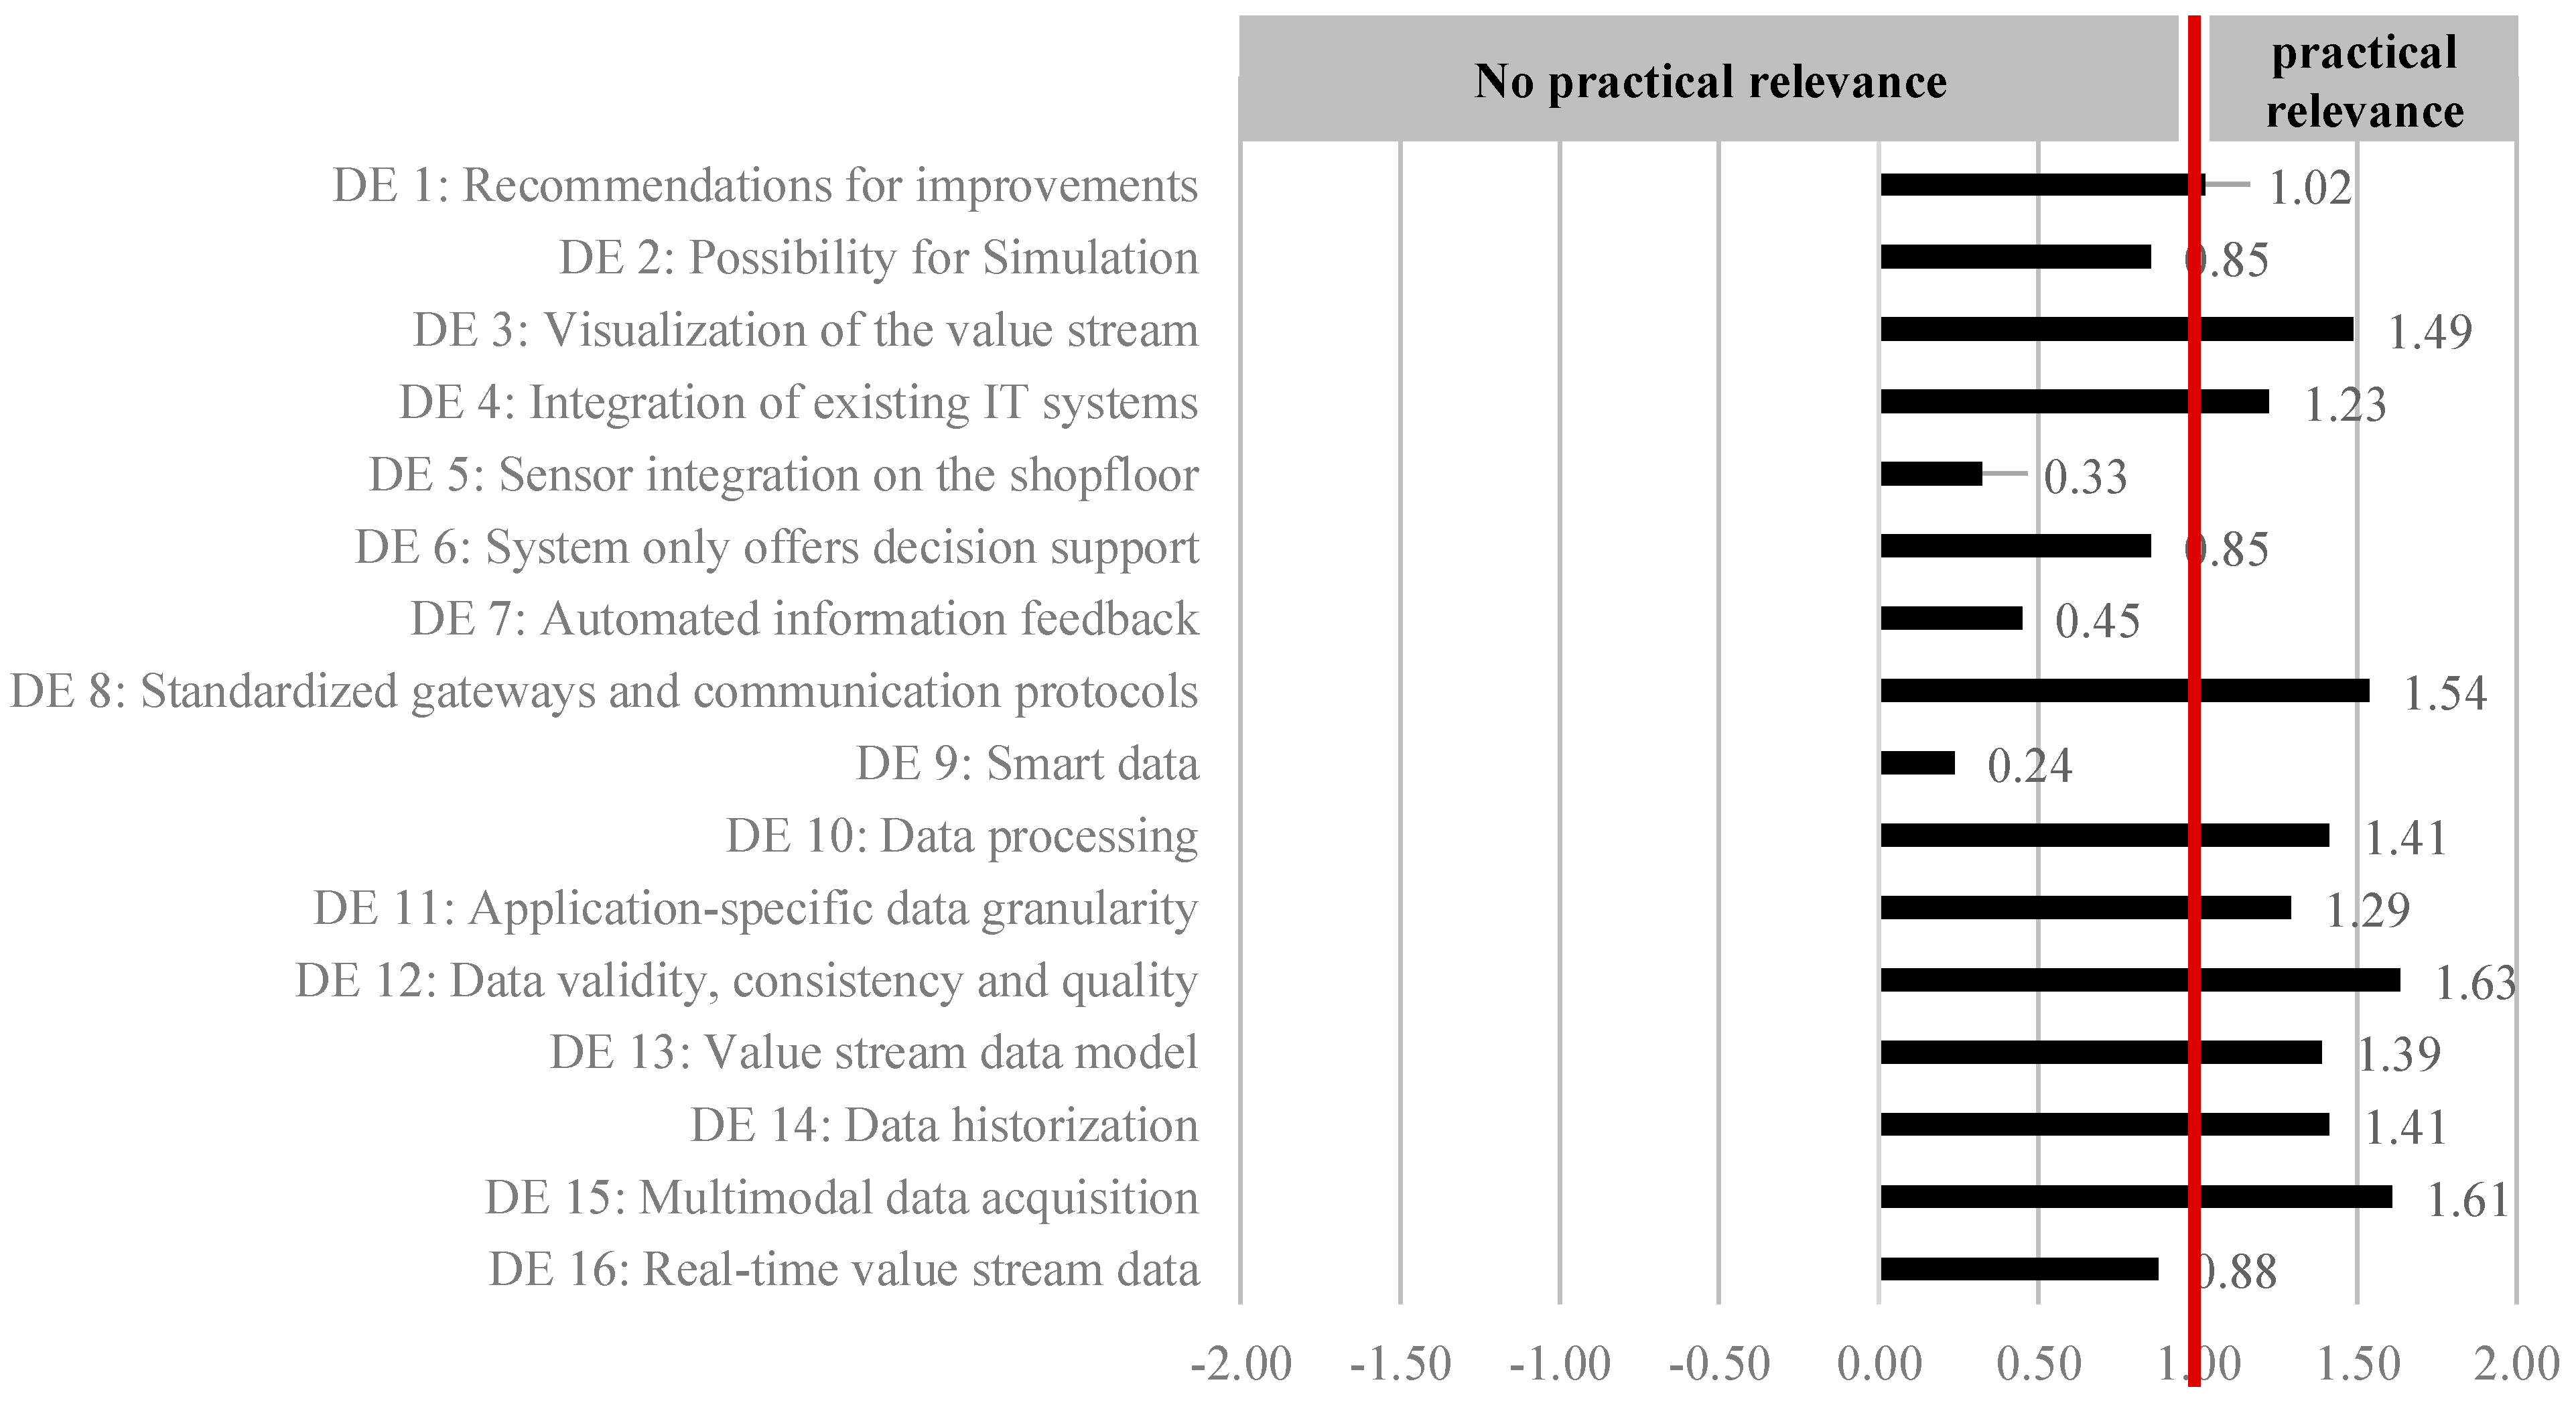
4.1. Expert Survey Findings

For this work, only those design elements were included that were rated by the experts as at least “rather important” on average (mean value µ > 1.00). Therefore, it was ensured that only those design elements with a high practical relevance were integrated into the digital twin of a value stream. A summary of the results of the survey is shown in Figure 4.
Design elements “DE 2: Possibility for Simulation”, “DE 5: Sensor integration on the shopfloor”, “DE 6: Systems only offers decision support”, “DE 7: Automated information feedback”, “DE 9: Smart Data” and “DE 16: Real-time value stream data” were rated by the experts as not relevant from a practical perspective. Therefore, these six design elements were not included in the design model. The remaining ten design elements “DE 1: Recommendations for improvements”, “DE 3: Visualization of the value stream”, “DE 4: Integration of existing IT systems”, “DE 8: Standardized gateways and communication protocols”, “DE 10: Data processing”, “DE 11: Application-specific data granularity”, “DE 12: Data validity, consistency and quality”, “DE 13: Value stream data model”, “DE 14: Data historization” and “DE 15: Multimodal data acquisition” were integrated into the design model.

4.2. Development of the Design Model

The core elements of the digital shadow presented in Section 2.2—physical, connection and virtual layer—are used as the fundamental structure as well as the design model developed by Frick and Metternich in a previous work [21]. The ten design elements identified by the experts are assigned to the three layers and organized in a consistent hierarchy. Related design elements (DE) are grouped in a superior element.
The physical layer is divided into three design elements. First, the basis is the object of observation itself, a predefined value stream (Section 5.1.1) for a selected product family. Here, the value stream management use case (Section 5.1.2) determines the data requirements for further technical implementation. Relevant data points are ensured by different data acquisition methods (Section 5.1.3). These include the integration of existing IT systems (DE 4) as well as the multimodal data acquisition (DE 15) from different data sources.
Within the virtual layer, data historization (DE 14) forms the basis (Section 5.2.1). Data modeling relates different data points to create a uniform and standardized basis (Section 5.2.2). This design element combines the development of a value stream data model (DE 13) on the one hand and the verification of data validity, consistency and quality (DE 12) on the other hand. Subsequent data processing (DE 10) enables a detailed analysis of the processes and their interdependencies (Section 5.2.3) with the help of application-specific data granularity (DE 12).
The connection layer, in turn, is divided into a link from physical to virtual (Section 5.3.1) and from virtual to physical (Section 5.3.2). In the context of data acquisition from physical to virtual, standardized gateways and communication protocols (DE 8) must be considered. The information feedback from virtual to the physical value stream includes recommendations for improvement (DE 1) as well as the visualization of the value stream (DE 3). A visualization of the design model with its design elements can be found in Figure 5. The starting point of the model is the value stream on the physical level. It is subsequently analyzed by passing the design elements clockwise in sequence.

5. Refinement of the Design Elements

In the following, the developed design model is refined. For each layer, the corresponding design elements are described in detail with the help of design guidelines (DG). The guidelines are obtained from relevant literature and enhanced by the author’s experience in implementing the model.

5.1. Physical Layer

The three design elements of the physical layer are detailed below using design guidelines to support the implementation of the digital shadow for a value stream.

5.1.1. Value Stream

To reduce complexity, it is recommended to focus on a specific product family (DG 1.1.1) with strategic and economic relevance [5]. The production segmentation resulting from this enables a transparent structuring of production [45]. Therefore, the creation of the product family matrix is elementary as it allows a clear and organized structure of production processes. A manual setting up of the product family matrix is possible, however, in case of high product variance with high personnel expenditure associated. Industrial practice shows that the specific application of association and cluster analyses can contribute to accelerate the process of product family formation based on data [46,47]. Based on product family creation, the production can be divided into segments, for which separate value streams (DG 1.1.2) are designed afterwards. Segmentation fosters transparency in companies, as the clear separation enables identifying the activities, resources, information, and processes relevant for further consideration.

5.1.2. Use Case Value Stream Management

The data requirements for the digital value stream shadow differ depending on the value stream management use cases (DG 1.2.1). As explained in [48], value stream management differentiates between three planning horizons—short-term, medium-term and long-term planning—each with two core tasks (Figure 6). Focusing on one or more of these core tasks enables the determination of the data requirements necessary for practical application. In this way, the framework for further implementation is defined. The use cases set a starting point for typical data that are required for the respective use cases. However, these can vary depending on the value stream and may need to be adjusted. For example, data on throughput times, productivity, delivery reliability and bottlenecks in production are particularly relevant for monitoring the value stream, while future customer demand or the return on investment for technology investments are relevant for long-term development of the value stream.
To derive the data requirements from the use case (DG 1.2.2), the so-called data requirements matrix is used for structuring (Figure 7). The first column represents the data requirements determined from the use case. The subsequent columns represent the processes and connections of the value stream. For each cell of the matrix, it is indicated whether a data requirement exists for the related process or connection. Here, “x” symbolizes that a data requirement exists and the associated data point is already available. “o” symbolizes that a data requirement exists, but that it is not yet covered by a data point at the current time.

5.1.3. Data Acquisition

The data available in IT systems (DG 1.3.1) are divided into master data and transaction data [46]. Master data are understood to be general company data that are consistent for a long time and represent the basis for operational information systems [49]. It is usually stored in enterprise resource planning (ERP) systems. Transaction data, on the other hand, are linked to a specific date and are subject to constant change. This includes, for example, machine or process data, which are regularly stored in production data acquisition systems. Furthermore, time-variable order and personnel data are recorded in manufacturing execution systems (MES) [50]. In the context of digitization, companies have implemented additional systems and methods for data acquisition alongside existing IT systems, which have led to a variety of additional data storage [51]. Multimodal data acquisition (DG 1.3.2) is used in this context when data are collected from various sources, systems or sensor types to obtain a comprehensive overview of the production process. To structure the overview of existing data points, the data requirements matrix is extended. For this purpose, for each process step or process link, information is added regarding data that has already been collected in specific IT systems (“x”) and that must be collected by additional sensor technology in the future (“o”) (Figure 8).
A summary of the design guidelines for the physical layer can be found in Table 2.

5.2. Virtual Layer

In the following, the three design elements of the virtual layer are detailed using 17 guidelines to support the implementation of the digital shadow of a value stream.

5.2.1. Data Historization

For data storage, the sampling rate as well as the acquisition type of each data point are defined and limited to the necessary minimum (DG 2.1.1). Uhlemann et al. distinguish between volatile and non-volatile data [52]. Volatile data include, for example, machine data that require a continuous, high-frequency sampling rate [53]. Non-volatile data include, for example, process data that are generated by the process operators at a fixed frequency [54]. In addition to the sampling rate, the acquisition type must be defined for each data point. According to Metternich et al., a distinction can be made between automated, semi-automated or manual acquisition [51]. Essential for the subsequent data processing is the unique assignment of each data point to a specific storage location (DG 2.1.2). The assignment enables efficient data organization and simplifies access to the stored information [51]. While the previously established data requirements matrix addresses especially the origin of each data point, the naming of the specific storage location within the IT system intends to enable a precise tracing and analysis of the origin of the data. This minimizes existing inconsistencies between different data points and increases the transparency of the data origin. To be able to analyze the dynamics and variability of the elements of a value stream, it is essential that each data point is provided with a unique time stamp (DG 2.1.3). This ensures a unique chronology of events in a value stream and allows data from different sources to be synchronized.

5.2.2. Data Modeling

The data modeling process requires the creation of a common understanding between all elements involved within the value stream. In practice, a three-step approach is established [55,56]. The stepwise approach allows a continuous enhancement of the model and an accurate representation in a database. Following this approach, first, a database-independent conceptual data model is created, which is afterwards transformed into a logical data model. Finally, the logical data model is transferred into the database language and the database is implemented, which is referred to as the physical data model [55,56].

Conceptual Data Model

A value stream consists of various elements, also called entities (DG 2.2.1). The main entity types of a value stream are as follows: customers, suppliers, process steps, process links, products and material [5]. The entities of a value stream depend on the specific situation and the product family under consideration. Therefore, depending on the industry, there may be additional entities. The above entities represent a general overview typical of a production of discrete goods. The next step in modeling the value stream is the definition of the relationships between the entity types (DG 2.2.2). Typical relationships between entity types are the following. The value stream itself is designed for multiple products of a product family. A value stream can consist of several process steps, which in turn have demand for different materials. There are several process links in a value stream, but each of these can only establish a connection between two process steps. In addition, there are usually multiple customers for a value stream who influence the value stream. On the other hand, a value stream is supplied by several suppliers. The outlined relationships differ depending on the value stream and must be redefined for each specific use case. In the context of generalization, similar entity types are combined into a superordinate entity type, which represents the common characteristics and properties of the combined entities [57]. Contrary to generalization, specialization explicitly derives entity types from a parent entity type to represent specific entities that have unique properties [57]. This leads to a more detailed representation of entity types (DG 2.2.3). By systematizing the attributes, the information is organized and can be mapped in a structured data model in the following stages. This enables an unambiguous and efficient modeling of the value stream (DG 2.2.4). Therefore, the attributes help to understand the relationships and dependencies of individual value stream entities [55,57].
Having identified and abstractly represented the relevant information object classes and their relationships in the conceptual data model, the detailed elaboration of the entities, attributes and relationships takes place in the logical data model.

Logical Data Model

Primary keys (PK) are special attributes that allow unique identification of records in a database. Each primary key must be unique and must not occur more than once in the database (DG 2.2.5). As unique identifiers, primary keys enable the distinction between individual data records and therefore support data integrity. Rules for defining primary key attributes can be found in [57]. In the value stream context, different primary keys are feasible depending on the entity type. For example, a unique product ID that identifies each product in the value stream is essential for the product entity in order to ensure traceability along the value stream. Foreign keys (FK) are attributes in a table of a database that enable a relationship to a primary key of another table [55]. Foreign keys can be used to perform complex data queries that link information from multiple tables, providing a comprehensive view of the relationships between data in the database (DG 2.2.6). To specify the data model further, it is elementary to assign a specific data type to each attribute. This defines the maximum possible value range of the stored information as well as the required storage capacity (DG 2.2.7). The data types must therefore be kept as small as possible for minimizing the memory requirements, but at the same time ensure sufficient accuracy to enable the resolution of the data to be as precise as possible [55,56,58]. To optimize the data model and to eliminate redundancies within the model, normalization is employed. This process consists of several steps referred to as normal forms. In general, normalization aims to decompose the data model into small and well-structured tables, thus preventing redundancies and ensuring data integrity (DG 2.2.8). This enables an efficient data management approach with minimal storage requirements [55].
In the logical data model, certain attributes are defined as primary keys, while additional relationships are established trough foreign keys. In the following, data types for attributes are specified, and the data model undergoes normalization. The next step entails the transformation of the theoretical model into a practical, physical data model.

Physical Data Model

As explained in the conceptual data model, a value stream consists of different entities that need to be related to each other. To be able to map these in a database, the database must fulfil the following criteria (DG 2.2.9): universality, scalability, compatibility, latency, clarity and structure [59,60]. A relational database can be used if the focus is on regular analysis of static data in the context of long-term value stream planning. In contrast, if the focus is on continuous monitoring of the value stream for short-term planning, a time series database is a more suitable solution [61]. To overcome this conflict, a hybrid database management system TimescaleDB is available, which is an extension of the relational database management system PostgreSQL optimized for time series data [62]. If, in addition to time-dependent data series, both meta-data and complex interdependent data are generated, such a hybrid database management system should be used for better structuring [63]. The implementation of a database requires different syntaxes and rules depending on the type (DG 2.2.10). It is recommended to use experts who are familiar with the implementation of databases. To link the relevant IT systems and systems for multimodal data acquisition to the database, it is essential to use middleware that enables communication between the database and the IT system (DG 2.2.11). For this purpose, a basic four-step procedure can be followed:
  • establish a connection to the IT system,
  • select and retrieve data points,
  • establish connection to the database of the physical data model,
  • insert data into the database.
Since the practical implementation varies depending on the IT system, the middleware selected and the physical data model used, the procedure cannot be generalized at this point.

5.2.3. Data Processing

In the first step of data processing, data cleansing and preprocessing is performed based on the five dimensions of data quality (DG 2.3.1):
  • Accuracy evaluates the extent to which data are reliable and proven to be without errors [64].
  • Completeness considers whether a data set contains all necessary data to reflect the state of the object under consideration [65].
  • Consistency refers to the injury of semantic rules, which are defined for a set of data elements [66].
  • Timeliness is influenced by the volatility of the system, the update frequency and the time of data usage and is considered as a reference for the meaningfulness of the information [64,65].
  • Relevance evaluates whether the available data types meet the requirements of the intended use [65].
Subsequent descriptive data exploration and analysis use statistical and graphical techniques to describe and summarize data (DG 2.3.2). The aim is to understand the structure and main features of the data without performing a deeper root cause analysis. For this purpose, simple statistical measures such as mean, median, mode or standard deviation can be applied to cycle time across different production processes to analyze data homogeneity and process stability. Within data exploration, a qualitative analysis of the data is performed so that anomalies, patterns or special features can be identified. Visualization using boxplots or histograms facilitates analysis and identification of trends. They can display the distribution of lead times for different product variants, highlighting fluctuations which may impact delivery performance. If historical data points are available, time series analysis helps to identify inherent patterns in the data (DG 2.3.3). For instance, after implementing a new technology in one production process, a decrease in the cycle time can be observed and improvement activities can be initiated. For manufacturing companies, this is an essential tool for optimizing production processes and dynamically aligning the value stream with external fluctuations and internal variability. Several patterns can be distinguished:
  • Temporary changes, e.g., due to the implementation of a new technology, which results in a reduction in the cycle time or causes a short-term loss of quality.
  • Seasonal changes, e.g., due to seasonal fluctuations in customer demand, which require an adjustment of production capacities.
  • Cyclical patterns, e.g., due to personnel-related fluctuations in processing times within a process step.
A summary of the design guidelines for the virtual layer can be found in Table 3.

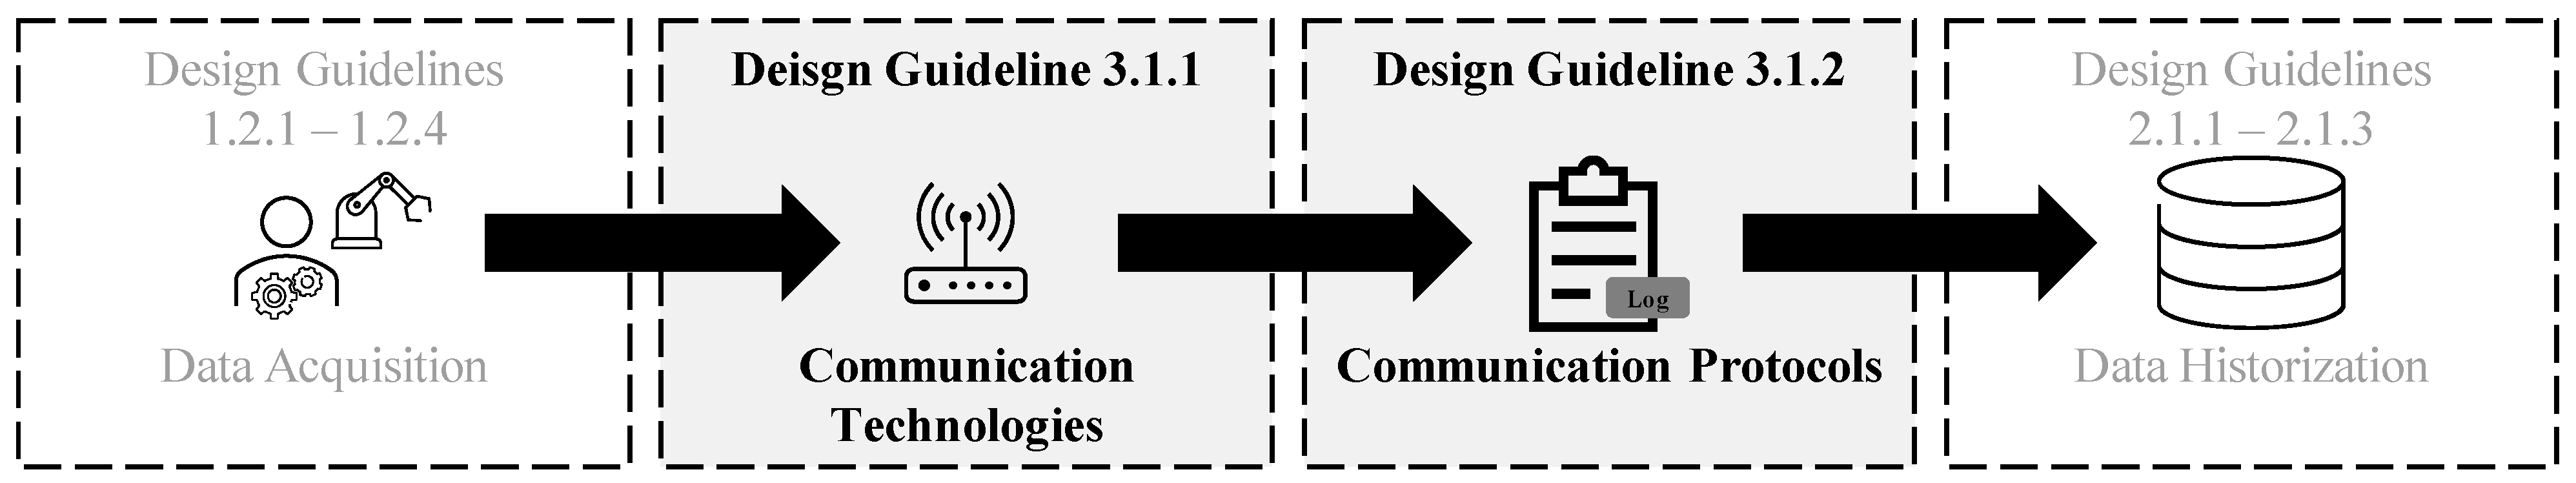
5.3. Connection Layer

The two design elements of the connection layer are detailed below to support the implementation of the digital shadow of a value stream.

5.3.1. Connection: Physical/Virtual

For the physical to virtual connection, the two design guidelines—communication technologies and communication protocols—must be followed (Figure 9). These ensure that a connection can be established between data acquisition (DG 1.2.1–1.2.4) and data storage (DG 2.1.1–2.1.3).
To be able to historize the data points from the multimodal data acquisition, the selection of a suitable communication technology is essential (DG 3.1.1). The advantages and disadvantages of the respective technologies are already discussed in science and summarized by Fleischer et al. in a toolbox [67].
The selection of communication protocols is elementary for the transfer of data from the physical to the virtual level (DG 3.1.2). Six criteria are used for the selection [68,69,70,71]:
  • A communication protocol ensures interoperability between devices, machines and systems.
  • Security is an important decision criterion for Industry 4.0 technologies. Therefore, the selected communication standard must support established security mechanisms such as encryption, authentication and access protocols to ensure data integrity.
  • In addition, scalability is elementary to handle the growing number of devices and data traffic.
  • Depending on the application area, different requirements are placed on the speed and latency of data transmission. Real-time requirements might be a factor influencing the choice of communication protocol.
  • To guarantee smooth data transmission, integration with existing IT systems should be possible without any problems.
  • Finally, the costs for implementing and operating the communication standard must be considered regarding an economically viable solution.

5.3.2. Connection: Virtual/Physical

The flow of information back from the virtual to the physical level ensures the functionality of the digital shadow of the value stream. To support this transition, four guidelines support the design and selection of an adequate visualization solution. The digital visualization of a value stream is essential for creating transparency across all processes, which improves understanding of the dynamics of production processes. This provides decision-makers with current information and enables them to react quickly to problems and disruptions. Merging different data sources and systems in a digital image of the value stream provides a solid basis for data-driven decisions at both strategic and operational levels. Therefore, the digital image must be able to visualize the following elements:
  • Processes and their connections;
  • Process performance, such as individual process parameters like cycle times, lead time or capacity utilization;
  • Inventory, by visualizing the inventory levels in the different process connections;
  • Production dynamics, by highlighting the current bottleneck or disruptions occurring in production.
The selection of a visualization solution requires the careful specification of software requirements. In the context of the present work, the HTO approach (human, technology, organization) is used for this purpose [72]. In addition to technological aspects, this approach also takes human and organizational aspects into account, so that holistic integration into the overall value stream system is ensured. Furthermore, software requirements are divided into the categories of functional requirements, non-functional requirements and organizational boundary conditions [73,74]. To facilitate the specification of requirements within the three categories, the following questions must be answered:
  • Functional requirements: What functions must the system have and how are they implemented technically [73,74]?
  • Non-functional requirements: What properties must the functions possess from the point of view of users and developers [74]?
  • Organizational constraints: What constraints exist on the organizational and legal side [74]?
After answering the questions, the result is an unweighted list of requirements, which must be weighted subsequently according to their relevance for practical implementation. A systematic and objective weighting of the requirements is a key element for selecting adequate visualization software. This ensures the applicability of potential software solutions for the specific use case. Therefore, a pair comparison is used. To ensure the objectivity of the evaluation, the pair comparison must be performed by different stakeholders, including users and developers of the software solution. Following the weighting of the requirements, existing software solutions are identified using previously defined search criteria. To evaluate and interpret the available information, the partial utility values are determined for the individual requirements for each identified software solution in accordance with a utility value analysis and converted into a quantitative evaluation. This ensures objective evaluation and selection of the software solution. A generally valid recommendation is not feasible due to the diversity of existing software solutions. A summary of the design guidelines for the connection layer can be found in Table 4.

6. Application of Design Guidelines at Different Learning Factories

For validation of the applicability of the design model, design guidelines (DG) are applied in a realistic value stream in the learning factories of the Technical University of Darmstadt. The value stream is part of the DiNaPro project and represents the complex requirements of an industrial production environment. The value stream extends across three learning factories with different IT systems and degrees of digitalization, allowing comprehensive testing of the CR. The three levels of the design model with their design elements and the practical implementation of the CR are presented below.

6.1. Physical Layer

A new product family was developed specifically for the project, consisting of 28 different variants (DG 1.1.1). The product is a module for a Smart Office Station (Figure 10, left). The developed value stream covers three learning factories and starts with the material supply and ends with the delivery of the assembled module (DG 1.1.2). The detailed process sequence is shown in Figure 10 (right).
As part of the definition of a value stream management use case, continuous monitoring of the value stream was defined as part of short-term planning (DG 1.2.1). Within the project, this helps to verify the efficiency of the developed value stream and allows adjustments to be made at short notice. Reduction in throughput time is of fundamental interest for monitoring in the context of the project. For this reason, the key parameters, cycle time and process time, must be determined for each component at each process step. Component-specific idle time must be determined in process connections. In addition, batch size and overall equipment effectiveness (OEE) are of interest (DG 1.2.2). The identified key parameters are added to the data requirements matrix (DG 1.3.1) and the call for action is determined for each process step and connection. As no existing IT systems are used in the project, relevant data are recorded using multimodal data acquisition (DG 1.3.2). The exemplary data requirements matrix for the assembly process can be found in Figure 11. Here, “x” symbolizes that a data requirement exists and the associated data point is already available. “o” symbolizes that a data requirement exists.

6.2. Virtual Layer

To ensure comprehensive data storage, a start and end time stamps are captured for each component at each process step using a traceability system based on RFID technology. The recording rate is limited for each component and is partially automated by a worker guidance system (DG 2.1.1). The data are archived in an IoT platform directly (DG 2.1.2). The traceability system ensures that all components are provided with unique time stamps for each process step (DG 2.1.3).
Ahead of the data integration implementation in the virtual layer, the data model is set up using eleven DGs. In the first step, the value stream entities are defined (DG 2.2.1). In this case, these are the entities of customer, supplier, location, process step and process connection. The entities themselves are related to each other, e.g., a site contains multiple process steps and process connections always link two process steps (DG 2.2.2). Further, specialization of the process steps is conducted (DG 2.2.3). Process steps Milling 1, Milling 2, Milling 3 and Lasing are grouped in the category Machining, while the two cleaning steps are grouped in the category Cleaning. Finally, the required attributes are defined for all entities, which must be saved as part of data collection (DG 2.2.4). Figure 12 shows the visualization of the conceptual data model.
To detail the conceptual data model, unique primary keys are assigned to the entities in the subsequent data modeling phase (DG 2.2.5). Attributes that enable unique identification of all entities of an entity type are suitable for this. To avoid mistakes, an additional identifier is introduced for the entity type process steps, for example, to ensure clear differentiation between process steps Milling 1–Milling 3. Foreign keys are added to ensure the relationships between the entity types (DG 2.2.6). For example, the entity type process steps are extended by foreign key location ID so that the n:1 mapping of the process steps to the individual locations is possible. Furthermore, a data type is defined for each attribute, which determines the maximum possible value range of the stored data through the definition range (DG 2.2.7). The subsequent normalization ensures that the redundancy in the data storage is minimized (DG 2.2.8). The result of the transfer to a logical data model is shown in Figure 13.
For the transformation of the logical data model into a physical one, a PostgreSQL database management system is set up on a virtual machine, including the TimescaleDB extension for the efficient management of time series data (DG 2.2.9). The database was subsequently created using the SQL programming language (DG 2.2.10). An example of the transfer of the logical entity type product to the associated hypertable can be found in Figure 14. To implement the database, the existing multimodal data recording systems were linked to the respective database tables (DG 2.2.11). The specifics of this process, which result from the individual system configurations, are not discussed further in the context of this paper.
To provide the necessary data quality in data processing, specific security mechanisms are implemented in the traceability system (DG 2.3.1). These mechanisms ensure that a component with a unique identification number only passes its assigned production processes. In a subsequent test phase, the performance of the system is verified. In total, 391 components are manufactured in three learning factories, generating a total of 6256 time stamps using the traceability system. The descriptive data analysis (DG 2.3.2) is used to gather initial information on the performance of the value stream, e.g., on the variant-dependent range of cycle times of individual process steps (Figure 15, left). In addition, the time series analysis (DG 2.3.3) is used to identify deviations within individual process steps (Figure 15, right).

6.3. Connection Layer

For the connection from the physical to the virtual layer, the data points generated by the traceability system are transmitted directly to the IoT platform via a WLAN connection (DG 3.1.1). For this reason, a specific communication protocol did not have to be determined (DG 3.1.2).
On the other hand, to implement the information flow from the virtual to the physical layer, specific requirements for visualization software were defined as part of the project (DG 3.2.1). Afterwards, the requirements were prioritized using a pair comparison and divided into mandatory and optional requirements (DG 3.2.2). Following, a systematic internet search was conducted to identify commercially available software solutions (DG 3.2.3). For this purpose, relevant search terms were identified in German and English using a mind map (Figure 16, left) and a total of 35 software solutions were identified. These were examined in a qualitative analysis regarding the fulfillment of the mandatory requirements. In this way, 31 software solutions were eliminated as they did not meet the requirements. The remaining four solutions were then quantitatively evaluated in detail regarding all requirements. The result of this selection, documented in Figure 16 (right), led to the selection of the software solution that fulfilled the defined requirements to the greatest extent (DG 3.2.4).
As the implementation of the Digital Value Stream Twin within the selected software is no longer part of the design model due to the individuality of the solution, the implementation is not discussed further at this point.

7. Discussion of Results

The application of the design model and its guidelines in the learning factories at TU Darmstadt shows that the presented design model contributes to the digitalization of production. With the help of the design guidelines on the physical layer, a value stream could be analyzed and digitized based on the traditional value stream method. In this way, the value stream method, which is usually dependent on a subjective one-time on-site recording, can be objectified. A periodic look at the digital value stream map enables a short-term reaction to changes in logistical performance. Alongside the aforementioned advantages, however, certain challenges were identified during practical application. For instance, industry-specific knowledge from production is not sufficient to apply the guidelines. Therefore, an interdisciplinary team is required. It must first deal with production-specific issues and second translate these into a value stream-specific data model in which the relevant data can be stored. In addition, data analysis requires advanced skills in the field of data analytics. The associated personnel costs and the necessary skills cannot always be provided by a single company. Therefore, cooperation between manufacturing companies and specialized companies in the field of data modeling and data analysis will become increasingly important in the future.
To counteract these disadvantages, it will be necessary in the future to further develop and generalize the design model in its current form. For this purpose, support in the form of a method is useful. This method is expected to enable the application of the design model without requiring in-depth knowledge of data modeling or data analytics and facilitate the evolution of the traditional value stream method into a company-specific, digital value stream shadow.

8. Conclusions and Outlook

This paper examined the further development of the conventional value stream method into a digital and data-based management approach. Three research questions were defined for this purpose. The first research question addressed the topic of how the further development into the digital and data-based management approach could work. The literature showed that Industry 4.0 technology of the digital shadow has the greatest potential to support this further by developing a design model, also known as a target model. Building on this, the second research question dealt with the question of how the design model should be structured. It was determined that a division into three layers—physical, virtual and connection layer—is the basic structure. The third research question, in turn, addressed the detailing of the three layers in the form of design elements. This posed the question of which design elements are necessary from a practical point of view. Therefore, with the help of an expert survey with 41 participants, 10 design elements were identified, which were subsequently assigned to the design layers. The elements were further detailed with the help of design guidelines taken from the literature and expanded through practical experience.
This was followed by an initial application of the design model and its guidelines. The application in the learning factories at TU Darmstadt has demonstrated its support for practical implementation. The users were able to design a digital shadow of a value stream from scratch using the model, allowing them to analyze the entire process in detail and identify improvements to the digitalization of the physical layer. By choosing a suitable software solution for the use case and visualizing the collected data in the form of a digital value stream map, the data from different systems were directly correlated. Therefore, 6256 individual time stamps were collected during the test week, which enabled the 15 additional data points to be assigned to individual components. Based on the information obtained, deviations in the value stream performance could be identified leading to process step Milling 3 as the bottleneck in production. Improvement activities for this process step were derived based on these data. The application of the model and the guidelines in the learning factories demonstrated the possibility of regularly updating the relevant value stream indicators and thus responding to changing circumstances. In this way, the model helps to expand the conventional value stream method into a digital and data-based management approach.
Additionally, an important advantage of the design model is its extensibility. The structure of the model was designed to be easily extended at any time. The design elements and the corresponding guidelines set the basis for further improvement and adaptation. Users can adapt the design guidelines to meet the specific needs of their organization. This flexibility ensures the long-term usability of the design model.
For future research, the challenge is to ensure the generality of the design model and to evaluate its applicability in different industries and use cases. It is important to verify whether the model can be used effectively in other contexts and whether it delivers the same results. Successfully proving the adaptability and effectiveness in different industries and use cases will not only further validate the model, but also expand its applicability. Additionally, methodological support is needed to assist users during the implementation phase of the model. Developing a well-structured and practical method can support the implementation process, empower users, and ensure that the model is used optimally to achieve improvements in the value stream. The systematic monitoring of the use of the methodology by its developers and an evaluation of its applicability in practice is necessary to ensure the usability of the methodology in industrial practice. Both the application of the model and the methodology in industrial practice will contribute to further development of the conventional value stream method into a digital and data-based management approach in the future.

Author Contributions

Conceptualization, N.F., J.T., B.S. and J.M.; Data curation, B.S.; Methodology, N.F. and J.T.; Project administration, J.M.; Validation, N.F.; Writing—original draft, N.F.; Writing—review and editing, J.M. All authors have read and agreed to the published version of the manuscript.

Funding

This research was founded by the Bundesministerium für Bildung und Forschung (BMBF)—Funding reference: 02J20E500.

Data Availability Statement

Data are contained within the article and are available from the corresponding author on reasonable request.

Conflicts of Interest

Jan Terwolbeck was employed by the company “WHITE LION Dry Ice & Laser Cleaning Technology GmbH” and Benjamin Seibel was employed by the company “Sanofi Aventis Deutschland GmbH”. The remaining authors declare that the research was conducted in the absence of any commercial or financial relationships that could be construed as a potential conflict of interest.

References

  1. Adolph, S.; Tisch, M.; Metternich, J. Challenges and Approaches to Competency Development for Future Production. J. Int. Sci. Publ. 2014, 12, 1001–1010. [Google Scholar]
  2. Lugert, A.; Völker, K.; Winkler, H. Dynamization of Value Stream Management by technical and managerial approach. Procedia CIRP 2018, 72, 701–706. [Google Scholar] [CrossRef]
  3. Frick, N.; Urnauer, C.; Metternich, J. Echtzeitdaten für das Wertstrommanagement. Z. Für Wirtsch. Fabr. 2020, 115, 220–224. [Google Scholar] [CrossRef]
  4. Hämmerle, M. Wertschöpfung steigern: Ergebnisse der Datenerhebung Über die Verbreitung und Ausgestaltung von Methoden zur Prozessoptimierung in der Produktion mit besonderem Fokus auf die Wertstrommethode; Fraunhofer Verl.: Stuttgart, Germany, 2010; ISBN 9783839601198. [Google Scholar]
  5. DIN ISO 22468; Wertstrommethode (VSM). DIN Deutsches Institut für Normung e.V.: Berlin, Germany; Beuth-Verlag: Berlin, Germany, 2020.
  6. Erlach, K. Wertstromdesign: Der Weg zur Schlanken Fabrik, 3rd ed.; Springer: Berlin/Heidelberg, Germany, 2020; ISBN 978-3-662-58906-9. [Google Scholar]
  7. Forno, A.J.D.; Pereira, F.A.; Forcellini, F.A.; Kipper, L.M. Value Stream Mapping: A study about the problems and challenges found in the literature from the past 15 years about application of Lean tools. Int. J. Adv. Manuf. Technol. 2014, 72, 779–790. [Google Scholar] [CrossRef]
  8. Winkler, H.; Lugert, A. Die Wertstrommethode im Zeitalter von Industrie 4.0: Studienreport; BTU Brandenburgische Technische Universität Cottbus-Senftenberg: Cottbus, Germany, 2017. [Google Scholar]
  9. Lödding, H.; Mundt, C.; Winter, M.; Heuer, T.; Hübner, M.; Seitz, M.; Schmidhuber, M.; Maibaum, J.; Bank, L.; Roth, S.; et al. PPS-Report 2019: Studienergebnisse, 1st ed.; TEWISS: Garbsen, Germany, 2020; ISBN 978-3-95900-402-2. [Google Scholar]
  10. Urnauer, C.; Metternich, J. Die digitale Wertstrommethode. Z. Für Wirtsch. Fabr. 2019, 114, 855–858. [Google Scholar] [CrossRef]
  11. Ciano, M.P.; Dallasega, P.; Orzes, G.; Rossi, T. One-to-one relationships between Industry 4.0 technologies and Lean Production techniques: A multiple case study. Int. J. Prod. Res. 2021, 59, 1386–1410. [Google Scholar] [CrossRef]
  12. Dillinger, F.; Tropschuh, B.; Dervis, M.Y.; Reinhart, G. A Systematic Approach to Identify the Interdependencies of Lean Production and Industry 4.0 Elements. Procedia CIRP 2022, 112, 85–90. [Google Scholar] [CrossRef]
  13. Erlach, K.; Böhm, M.; Gessert, S.; Hartleif, S.; Teriete, T.; Ungern-Sternberg, R. Die zwei Wege der Wertstrommethode zur Digitalisierung: Datenwertstrom und WertstromDigital als Stoßrichtungen der Forschung für die digitalisierte Produktion. Z. Für Wirtsch. Fabr. 2021, 116, 940–944. [Google Scholar] [CrossRef]
  14. Langlotz, P.; Aurich, J.C. Causal and temporal relationships within the combination of Lean Production Systems and Industry 4.0. Procedia CIRP 2021, 96, 236–241. [Google Scholar] [CrossRef]
  15. Mayr, A.; Weigelt, M.; Kühl, A.; Grimm, S.; Erll, A.; Potzel, M.; Franke, J. Lean 4.0—A conceptual conjunction of lean management and Industry 4.0. Procedia CIRP 2018, 72, 622–628. [Google Scholar] [CrossRef]
  16. Dillinger, F.; Bergermeier, J.; Reinhart, G. Implications of Lean 4.0 Methods on Relevant Target Dimensions: Time, Cost, Quality, Employee Involvement, and Flexibility. Procedia CIRP 2022, 107, 202–208. [Google Scholar] [CrossRef]
  17. Florescu, A.; Barabas, S. Development Trends of Production Systems through the Integration of Lean Management and Industry 4.0. Appl. Sci. 2022, 12, 4885. [Google Scholar] [CrossRef]
  18. Liu, C.; Zhang, Y. Advances and hotspots analysis of value stream mapping using bibliometrics. Int. J. Lean Six Sigma 2023, 14, 190–208. [Google Scholar] [CrossRef]
  19. Ortega, I.U.; Amrani, A.Z.; Vallespir, B. Modeling: Integration of Lean and Technologies of Industry 4.0 for Enterprise Performance. IFAC-PapersOnLine 2022, 55, 2067–2072. [Google Scholar] [CrossRef]
  20. Pereira, A.; Dinis-Carvalho, J.; Alves, A.; Arezes, P. How Industry 4.0 can enhance Lean practices. FME Trans. 2019, 47, 810–822. [Google Scholar] [CrossRef]
  21. Frick, N.; Metternich, J. The Digital Value Stream Twin. Systems 2022, 10, 102. [Google Scholar] [CrossRef]
  22. Benfer, M.; Peukert, S.; Lanza, G. A Framework for Digital Twins for Production Network Management. Procedia CIRP 2021, 104, 1269–1274. [Google Scholar] [CrossRef]
  23. D’Amico, D.; Ekoyuncu, J.; Addepalli, S.; Smith, C.; Keedwell, E.; Sibson, J.; Penver, S. Conceptual framework of a digital twin to evaluate the degradation status of complex engineering systems. Procedia CIRP 2019, 86, 61–67. [Google Scholar] [CrossRef]
  24. Scheer, A.-W. Prozessorientierte Unternehmensmodellierung: Grundlagen—Werkzeuge—Anwendungen; Betriebswirtschaftlicher Verlag Dr. Th. Gabler GmbH: Wiesbaden, Germany, 1994; ISBN 978-3-409-17925-6. [Google Scholar]
  25. Patzak, G. Systemtechnik—Planung Komplexer Innovativer Systeme: Grundlagen, Methoden, Techniken, 1st ed.; Springer: Berlin/Heidelberg, Germany; New York, NY, USA, 1982; ISBN 3-540-11783-0. [Google Scholar]
  26. Lugert, A. Dynamisches Wertstrommanagement im Kontext von Industrie 4.0; Logos Berlin: Berlin, Germany, 2019; ISBN 3832548491. [Google Scholar]
  27. Negri, E.; Fumagalli, L.; Macchi, M. A Review of the Roles of Digital Twin in CPS-based Production Systems. Procedia Manuf. 2017, 11, 939–948. [Google Scholar] [CrossRef]
  28. Stark, R.; Damerau, T. Digital Twin. In CIRP Encyclopedia of Production Engineering; Chatti, S., Tolio, T., Eds.; Springer: Berlin/Heidelberg, Germany, 2019; pp. 1–8. ISBN 978-3-642-35950-7. [Google Scholar]
  29. Kritzinger, W.; Karner, M.; Traar, G.; Henjes, J.; Sihn, W. Digital Twin in manufacturing: A categorical literature review and classification. IFAC-PapersOnLine 2018, 51, 1016–1022. [Google Scholar] [CrossRef]
  30. Bauernhansl, T.; Hartleif, S.; Felix, T. The Digital Shadow of production—A concept for the effective and efficient information supply in dynamic industrial environments. Procedia CIRP 2018, 72, 69–74. [Google Scholar] [CrossRef]
  31. Schuh, G.; Walendzik, P.; Luckert, M.; Birkmeier, M.; Weber, A.; Blum, M. Keine Industrie 4.0 ohne den Digitalen Schatten: Wie Unternehmen die notwendige Datenbasis schaffen. Z. Wirtsch. Fabr. 2016, 111, 745–748. [Google Scholar] [CrossRef]
  32. Coronado, P.D.U.; Lynn, R.; Louhichi, W.; Parto, M.; Wescoat, E.; Kurfess, T. Part data integration in the Shop Floor Digital Twin: Mobile and cloud technologies to enable a manufacturing execution system. J. Manuf. Syst. 2018, 48, 25–33. [Google Scholar] [CrossRef]
  33. ISO 23247-1:2021; Automation Systems and Integration—Digital Twin Framework for Manufacturing: Part 1: Overview and General Principles. International Organization for Standardization: Geneva, Switzerland, 2021.
  34. Kunath, M.; Winkler, H. Integrating the Digital Twin of the manufacturing system into a decision support system for improving the order management process. Procedia CIRP 2018, 72, 225–231. [Google Scholar] [CrossRef]
  35. Onaji, I.; Tiwari, D.; Soulatiantork, P.; Song, B.; Tiwari, A. Digital twin in manufacturing: Conceptual framework and case studies. Int. J. Comput. Integr. Manuf. 2022, 35, 831–858. [Google Scholar] [CrossRef]
  36. Pause, D.; Blum, M. Conceptual Design of a Digital Shadow for the Procurement of Stocked Products. In Advances in Production Management Systems. Smart Manufacturing for Industry 4.0; Moon, I., Lee, G.M., Park, J., Kiritsis, D., von Cieminski, G., Eds.; Springer International Publishing: Berlin/Heidelberg, Germany, 2018; pp. 288–295. ISBN 978-3-319-99706-3. [Google Scholar]
  37. Ricondo, I.; Porto, A.; Ugarte, M. A digital twin framework for the simulation and optimization of production systems. Procedia CIRP 2021, 104, 762–767. [Google Scholar] [CrossRef]
  38. Uhlemann, T.H.-J.; Lehmann, C.; Steinhilper, R. The Digital Twin: Realizing the Cyber-Physical Production System for Industry 4.0. Procedia CIRP 2017, 61, 335–340. [Google Scholar] [CrossRef]
  39. Guo, H.; Chen, M.; Mohamed, K.; Qu, T.; Wang, S.; Li, J. A digital twin-based flexible cellular manufacturing for optimization of air conditioner line. J. Manuf. Syst. 2021, 58, 65–78. [Google Scholar] [CrossRef]
  40. Magnanini, M.C.; Melnychuk, O.; Yemane, A.; Strandberg, H.; Ricondo, I.; Borzi, G.; Colledani, M. A Digital Twin-based approach for multi-objective optimization of short-term production planning. IFAC-PapersOnLine 2021, 54, 140–145. [Google Scholar] [CrossRef]
  41. Schuh, G.; Kelzenberg, C.; Wiese, J.; Kessler, N. Creation of digital production twins for the optimization of value creation in single and small batch production. Procedia CIRP 2020, 93, 222–227. [Google Scholar] [CrossRef]
  42. Jeon, S.M.; Schuesslbauer, S. Digital Twin Application for Production Optimization. In Proceedings of the 2020 IEEE International Conference on Industrial Engineering and Engineering Management (IEEM), Singapore, 14–17 December 2020; IEEE: New York, NY, USA, 2020; pp. 542–545, ISBN 978-1-5386-7220-4. [Google Scholar]
  43. Lu, Y.; Liu, Z.; Min, Q. A digital twin-enabled value stream mapping approach for production process reengineering in SMEs. Int. J. Comput. Integr. Manuf. 2021, 34, 764–782. [Google Scholar] [CrossRef]
  44. Eurostat. Kleine und Mittlere Unternehmen (KMU). Available online: https://ec.europa.eu/eurostat/statistics-explained/index.php?title=Glossary:Enterprise_size/de (accessed on 19 September 2023).
  45. Rother, M.; Shook, J. Learning to See: Value Stream Mapping to Add Value and Eliminate Muda; Lean Enterprise Institute: Brookline, MA, USA, 1999. [Google Scholar]
  46. Urnauer, C. Data Analytics in der Analyse und Gestaltung von Wertströmen; Shaker Verlag: Düren, Germany, 2023. [Google Scholar]
  47. Urnauer, C.; Rudolph, L.; Metternich, J. Evaluation of Clustering Approaches and Proximity Measures for Product Familiy Identification. Procedia CIRP 2023, in press. [Google Scholar]
  48. Frick, N.; Reintke, M.; Metternich, J. Wertstrommanagement im Zeitalter dynamischer Produktionssysteme: Aufgaben und Herausforderungen—Ein Blick aus der Praxis. Z. Für Wirtsch. Fabr. 2023, 118, 400–405. [Google Scholar] [CrossRef]
  49. ISO 8000-2:2022; ISO 8000-2 Data Quality—Part. 2: Vocabulary. 5th ed. International Organization for Standardization: Geneva, Switzerland, 2022.
  50. Felderer, M.; Russo, B.; Auer, F. On Testing Data-Intensive Software Systems. In Security and Quality in Cyber-Physical Systems Engineering; Biffl, S., Eckhart, M., Lüder, A., Weippl, E., Eds.; Springer International Publishing: Cham, Switzerland, 2019; pp. 129–148. ISBN 978-3-030-25311-0. [Google Scholar]
  51. Metternich, J.; Meudt, T.; Hartmann, L. Wertstrom 4.0: Wertstromanalyse und Wertstromdesign für eine Schlanke, Digitale Auftragsabwicklung; Hanser: München, Germany, 2022; ISBN 978-3-446-47229-7. [Google Scholar]
  52. Uhlemann, T.H.-J.; Schock, C.; Lehmann, C.; Freiberger, S.; Steinhilper, R. The Digital Twin: Demonstrating the Potential of Real Time Data Acquisition in Production Systems. Procedia Manuf. 2017, 9, 113–120. [Google Scholar] [CrossRef]
  53. Stanula, P.; Ziegenbein, A.; Metternich, J. Machine learning algorithms in production: A guideline for efficient data source selection. Procedia CIRP 2018, 78, 261–266. [Google Scholar] [CrossRef]
  54. Herstätter, P.; Wildbolz, T.; Hulla, M.; Ramsauer, C. Data acquisition to enable Research, Education and Training in Learning Factories and Makerspaces. Procedia Manuf. 2020, 45, 289–294. [Google Scholar] [CrossRef]
  55. Heuer, A.; Saake, G.; Sattler, K.-U. Datenbanken Kompakt: Entwurf von Datenbanken; Einführung in SQL; Anwendungsentwicklung und Internet-Anbindung; Online-Shop als durchgängige, praxisnahe Beispielanwendung, korr. Nachdruck; mitp-Verl.: Bonn, Germany, 2002; ISBN 3826607155. [Google Scholar]
  56. Geisler, F. Datenbanken—Grundlagen und Design; Verlagsgruppe Hüthig Jehle Rehm: Berlin, Germany, 2011; ISBN 9783826684821. [Google Scholar]
  57. Becker, J.; Probandt, W.; Vering, O. Grundsätze Ordnungsmäßiger Modellierung: Konzeption und Praxisbeispiel für ein Effizientes Prozessmanagement; Springer: Berlin/Heidelberg, Germany, 2012; ISBN 978-3-642-30411-8. [Google Scholar]
  58. Elmasri, R.; Navathe, S. Grundlagen von Datenbanksystemen, 1st ed.; Pearson Studium: München, Germany, 2002; ISBN 3827370213. [Google Scholar]
  59. Hübner, C.; Suchold, N.; Alex, J.; Thron, M.; Zipper, H.; Rieger, L. Offene Plattform für die Prozessoptimierung—Digitaler Zwilling im Wassermanagement 4.0—Effiziente Lösungen durch Modellierung und Simulation. In VDI-Berichte Nr. 2330; Verband deutscher Ingenieure, Ed.; VDI Verlag: Duesseldorf, Germany, 2018; pp. 493–502. ISBN 9783181023303. [Google Scholar]
  60. Ellgass, W.; Holt, N.; Saldana-Lemus, H.; Richmond, J.; Barenji, A.V.; Gonzalez-Badillo, G. A Digital Twin Concept for Manufacturing Systems. In Proceedings of the ASME 2018 International Mechanical Engineering Congress and Exposition, Pittsburgh, PA, USA, 9–15 November 2018; pp. 1–9. [Google Scholar]
  61. Petrik, D.; Mormul, M.; Reimann, P.; Gröger, C. Anforderungen für Zeitreihendatenbanken im industriellen IoT. In IoT—Best Practices; Meinhardt, S., Wortmann, F., Eds.; Springer Fachmedien Wiesbaden: Wiesbaden, Germany, 2021; pp. 339–377. ISBN 978-3-658-32438-4. [Google Scholar]
  62. Timescale Inc. Why Timescale? Built for Developers, Trusted by Businesses: A PostgreSQL Cloud Platform Engineered for Your Most Demanding Data Needs. Built for Scale, Speed, and Savings. Available online: https://www.timescale.com/products#enjoyPostgres (accessed on 1 August 2023).
  63. Schneider, M. TimeScaleDB vs. influxDB: Zeitreihendatenbanken für das IIoT. Available online: https://www.inovex.de/de/blog/timescaledb-vs-influxdb-zeitreihen-iiot/#:~:text=TimescaleDB%20ist%20eine%20Erweiterung%20(Plugin,auch%20nach%20Merkmalen%20segmentiert%20ab (accessed on 1 August 2023).
  64. Wang, R.Y.; Strong, D.M. Beyond Accuracy: What Data Quality Means to Data Consumers. J. Manag. Inf. Syst. 1996, 12, 5–33. [Google Scholar] [CrossRef]
  65. Wand, Y.; Wang, R.Y. Anchoring data quality dimensions in ontological foundations. Commun. ACM 1996, 39, 86–95. [Google Scholar] [CrossRef]
  66. Batini, C.; Cappiello, C.; Francalanci, C.; Maurino, A. Methodologies for Data Quality Assessment and Improvement. ACM Comput. Surv. 2009, 41, 1–52. [Google Scholar] [CrossRef]
  67. Fleischer, J.; Klee, B.; Spohrer, A.; Merz, S. Leitfaden Sensorik für Industrie 4.0: Wege zum kostengünstigen Sensorsystem; VDMA Forum Industrie: Frankfurt am Main, Germany, 2018. [Google Scholar]
  68. Petrevska, E. TCP-Basierte Kommunikationsprotokolle als Schlüsseltechnologien für das IioT. 2021. Available online: https://www.pepperl-fuchs.com/germany/de/44926.htm (accessed on 27 July 2023).
  69. Al-Masri, E.; Kalyanam, K.R.; Batts, J.; Kim, J.; Singh, S.; Vo, T.; Yan, C. Investigating Messaging Protocols for the Internet of Things (IoT). IEEE Access 2020, 8, 94880–94911. [Google Scholar] [CrossRef]
  70. Silva, D.; Carvalho, L.I.; Soares, J.; Sofia, R.C. A Performance Analysis of Internet of Things Networking Protocols: Evaluating MQTT, CoAP, OPC UA. Appl. Sci. 2021, 11, 4879. [Google Scholar] [CrossRef]
  71. Babel, W. Internet of Things und Industrie 4.0, 1st ed.; Springer Fachmedien Wiesbaden: Wiesbaden, Germany, 2023; ISBN 9783658399016. [Google Scholar]
  72. Ulich, E. Arbeitspsychologie, 6th ed.; vdf Hochschulverlag AG an der ETH Zürich: Zürich, Switzerland, 2005; Available online: http://scans.hebis.de/HEBCGI/show.pl?13318868_vlg.pdf (accessed on 17 October 2023).
  73. Partsch, H.A. Requirements-Engineering Systematisch: Modellbildung für Softwaregestützte Systeme; Springer: Berlin/Heidelberg, Germany, 2010; ISBN 978-3-642-05357-3. [Google Scholar]
  74. Ebert, C. Systematisches Requirements Engineering: Anforderungen Ermitteln, Spezifizieren, Analysieren und Verwalten, 5th ed.; Dpunkt-Verlag: Heidelberg, Germany, 2014; ISBN 9783864901393. [Google Scholar]
Figure 1. Interlinkage between the concepts of DM, DS and DT (based on [29]).
Systems 12 00020 g001
Figure 2. Methodological Approach [21].
Systems 12 00020 g002
Figure 3. Classification of Experts.
Systems 12 00020 g003
Figure 4. Results of the expert survey.
Systems 12 00020 g004
Figure 5. Design Model for the Digital Shadow of a Value Stream.
Systems 12 00020 g005
Figure 6. Use cases for Value Stream Management.
Systems 12 00020 g006
Figure 7. Data requirement matrix—basic structure.
Systems 12 00020 g007
Figure 8. Data requirements matrix—example for one process.
Systems 12 00020 g008
Figure 9. Relationship between Design Guidelines in the Connection: Physical/Virtual.
Systems 12 00020 g009
Figure 10. Realization of Design Guidelines 1.1.1 and 1.1.2. (* means the numbers of pen seats).
Systems 12 00020 g010
Figure 11. Realization of Design Guidelines 1.3.1 and 1.3.2.
Systems 12 00020 g011
Figure 12. Realization of Design Guidelines 2.2.1–2.2.4.
Systems 12 00020 g012
Figure 13. Realization of Design Guidelines 2.2.5–2.2.8.
Systems 12 00020 g013
Figure 14. Realization of Design Guideline 2.2.10.
Systems 12 00020 g014
Figure 15. Realization of Design Guideline 2.3.2 and 2.3.3.
Systems 12 00020 g015
Figure 16. Selection of the most suitable software solution.
Systems 12 00020 g016
Table 1. Relationship between Value Stream Method and Industry 4.0 Technologies.
SourceIndustry 4.0 Technologies
Vertical IntegrationAnalyticsBig DataDigital Shadow/TwinHorizontal IntegrationAuto-IDCyberphysical SystemsReal-Time DataCloud ComputingSimulation
Ciano et al. (2021)[11]
Dillinger et al. (2022)[12]
Erlach et al. (2021)[13]
Langlotz and Aurich (2021)[14]
Mayr et al. (2018)[15]
Dillinger et al. (2022)[16]
Florescu and Barabas (2022)[17]
Liu and Zhang (2023)[18]
Ortega et al. (2022)[19]
Pereira et al. (2022)[20]
3468232434
Table 2. Design Guidelines for the Physical Layer.
No.Design Guideline
1.1.1The considered product family is defined.
1.1.2The value stream is explicitly separated.
1.2.1The use case for the digital twin in value stream management is determined.
1.2.2The relevant data are derived from the use case and specified for each process step.
1.3.1The data stored in existing IT systems are defined and the storage location for each data point is determined.
1.3.2The data acquired by multimodal data acquisition are defined and the acquisition type of each data point is determined.
Table 3. Design Guidelines for the Virtual Layer.
No.Design Guideline
2.1.1The sampling rate and acquisition type are defined for each data point and limited to the necessary minimum.
2.1.2The specific storage location is uniquely named for each data point.
2.1.3Each data point acquired is provided with a unique time stamp.
2.2.1The entities of the value stream are identified and unambiguously labelled.Conceptual DM
2.2.2The relationships between the entities are defined.
2.2.3The entity types are subdivided and grouped by generalization and specialization.
2.2.4The relevant attributes of the entities are systematized.
2.2.5The unique identifying attributes are defined as primary keys.Logical DM
2.2.6Further relationships are described by foreign keys.
2.2.7The data types of the attributes are specified.
2.2.8Redundant data are avoided by normalization.
2.2.9The database management system and the database client are selected and installed.Physical DM
2.2.10The logical data model is transferred to the data base language.
2.2.11The database connects the existing IT systems and the visualization tool.
2.3.1Data cleansing and pre-processing is based on the five dimensions of data quality.
2.3.2Descriptive data exploration and analysis is applied to gain a thorough understanding of the data.
2.3.3The identification of changes, seasonalities or cyclic patterns is achieved through time series analysis.
Table 4. Design Guidelines for the Connection Layer.
No.Design Guideline
3.1.1Communication technologies are selected on an application-specific basis according to their technical characteristics.
3.1.2A standardized communication protocol is used for each data point.
3.2.1Software requirements are specified using the HTO approach.
3.2.2Systematic weighting of the requirements ensures the selection of the visualization software.
3.2.3Software solutions are identified using defined search criteria.
3.2.4The evaluation results in the selection of the most suitable software solution.
Disclaimer/Publisher’s Note: The statements, opinions and data contained in all publications are solely those of the individual author(s) and contributor(s) and not of MDPI and/or the editor(s). MDPI and/or the editor(s) disclaim responsibility for any injury to people or property resulting from any ideas, methods, instructions or products referred to in the content.

