Abstract
Both executive corruption and corporate innovation are important factors affecting corporate development. This paper explores the impact of executive corruption on corporate innovation and examines the mechanism of their effects from the perspective of financing constraints. It is found that executive corruption significantly inhibits corporate innovation in general. In addition, financing constraints act as a mediator between executive corruption and corporate innovation, i.e., executive corruption exacerbates the financing constraints faced by firms and affects the access to and allocation of corporate resources, thus leading to a decrease in corporate innovation inputs and outputs. Further, the inhibitory effect of executive corruption on firm innovation is more pronounced in firms with low quality internal controls, strong professional background of executives, low quality external audit, low shareholding of institutional investors, strong political affiliation, and state-owned enterprises.
1. Introduction
Innovation is the soul of a nation’s progress, serving as an inexhaustible driving force for the prosperity and development of a country. It is particularly crucial for enterprises to ignite innovation vitality and elevate innovation levels.
Corruption is one of the globally highlighted hot-button issues, often referred to as the ‘cancer of national governance’. This is because corruption poses a serious threat to both the political and economic development of a nation. Due to the arbitrary and opportunistic nature typically associated with corruption, avoiding the numerous risks introduced by corruption during the innovation process becomes exceptionally difficult and costly for enterprises [1,2,3].
Existing research findings suggest that the motivation and capability for corporate innovation are influenced by macro factors such as social and national characteristics, intermediate factors like market structure, and micro factors such as corporate governance [4]. Additionally, the agency issues arising from the separation of ownership and control in enterprises tend to impact the innovation capabilities of firms. This is because the pursuit of managers to maximize their own salaries and benefits conflicts with the owners’ objective of maximizing the firm’s wealth. Such conflicting interests often lead to managerial misuse of power, affecting the efficiency of resource allocation within the company. Consequently, it diminishes the allocation of resources toward innovation and research, ultimately resulting in a decline in the firm’s innovation level [5]. The abuse of power by management often breeds corruption. Would this corruption further impact innovation within a company? Existing research primarily examines executive behavior and empirically tests three different perspectives. One viewpoint suggests that corruption is beneficial to innovation within enterprises. This perspective stems from the premise that in a context where social mechanisms are imperfect, corporate managers utilize corruption to evade government oversight, thereby facilitating the smooth progression of innovation activities within the company [6]. Another viewpoint posits that corruption hampers both corporate innovation and economic development. Researchers empirically demonstrate that managerial corruption to a certain extent weakens the incentive mechanisms for innovation within enterprises. This not only reduces innovation inputs and outputs but also diminishes the efficiency of corporate investments [7]. Additionally, some scholars argue that corruption’s impact on innovation initially weakens positively and then strengthens negatively, following an inverted U-shaped curve relationship [8].
In summary, corruption not only impacts the creation of corporate value and the level of innovation but also influences social equality and justice, thereby exerting significant effects on a nation’s political and economic development. This paper aims to empirically investigate the relationship between executive corruption and corporate innovation, delving into the mediating pathways through which executive corruption influences corporate innovation. Furthermore, it conducts a moderating analysis concerning the internal and external factors within the corporate environment that affect this relationship. The objective is to offer new insights into preventing and addressing executive corruption within Chinese enterprises, promoting the implementation of innovation strategies, and contributing to novel approaches for driving socioeconomic development.
This paper utilizes data from A-share listed companies on the Shanghai and Shenzhen stock exchanges for the period 2012–2020 as the sample. Drawing on theoretical frameworks such as rent-seeking theory, the study empirically examines the relationship between executive corruption and corporate innovation. On this basis, the study empirically investigates the mediating role of financing constraints in the relationship between executive corruption and corporate innovation. Additionally, it examines the moderating effects of internal and external environmental differences on this relationship. Internal environmental variables encompass corporate characteristics, internal controls, and executive professional backgrounds, while external environmental variables include political affiliations, external audit quality, and the proportion of shares held by institutional investors. Additionally, to ensure the scientific robustness of the main effects study conclusions, this paper substitutes the measurement method for corporate innovation as the explained variable and replaces the primary effect regression method, applying Tobit regression, Poisson regression, and negative binomial regression, this paper re-conducts the primary hypothesis regression to examine the robustness of the research conclusions. In addition, instrumental variable methods (IV), placebo tests, propensity score matching analysis (PSM), and other approaches are employed to test for endogeneity issues in the main effect regression conclusions.
The potential contributions of this paper include, firstly, using abnormal on-the-job consumption by executives as a proxy variable for executive corruption, which enriches the relevant research on executive corruption. The current academic discourse on the relationship between executive corruption and corporate innovation yields various conclusions, partly due to disparities among scholars in the selection of proxy variables. Due to regional variations, the evaluation indices are prone to biases in corrupt information, and since corruption is a concealed and non-public behavior, publicly disclosed data may not authentically reflect the level of corruption within enterprises [9,10,11,12,13]. Based on this, this paper takes the abnormal in-service consumption of senior executives, that is, the difference between the actual in-service consumption of senior executives and the expected normal in-service consumption, as the proxy variable of executive corruption. Second, comprehensive use of innovation input (the ratio of R&D input to operating income) and output (the number of patent applications) are used as proxy variables for firm innovation. To a certain extent, it extends the literature research on the mechanism of enterprise innovation promotion.
2. Materials and Methods
2.1. Literature Review
2.1.1. Influencing Factors of Enterprise Innovation
The influence factors of enterprise innovation include three aspects: macroeconomy, market economy and enterprise.
First of all, from the macroeconomic perspective, the three factors of national policies, laws and regulations and market environment will have an impact on enterprise innovation. In terms of national policies, preferential tax policies can significantly improve the innovation input of enterprises and obtain higher innovation performance [14]. Although government subsidies will not improve the innovation investment level of enterprises in the current year, they will stimulate the innovation enthusiasm of enterprises in the next year [15]. In terms of laws and regulations, patent law and intellectual property law create a corresponding legal environment for enterprise innovation. When the law enforcement of intellectual property protection is stronger, the investment of independent research and development of enterprises will be greater, and then more patented and non-patented technologies will be produced [16,17]. However, some scholars put forward the opposite view. Williams [18], through studying the patent data of a private enterprise before and after it was protected by intellectual property rights, concluded that the short-term protection of intellectual property rights by the state would not improve the innovation level of the enterprise, but would continue to reduce the scientific research achievements and the number of patents in the later period. In terms of market environment, the development of financial market can improve the innovation efficiency of enterprises as a whole from the macro level, and thus stimulate the growth of social economy [19]. Digital finance such as big data, artificial intelligence and cloud computing can promote innovation output [20]. In addition, a good credit market will also improve the R&D level of enterprises, because a strong credit market can help enterprises improve the efficiency of capital use, and enterprise managers will have a stronger willingness to focus on innovation projects with a long cycle but a high rate of return [21].
Secondly, from the perspective of market economy, market conditions, especially market competition conditions, will also have an impact on enterprise innovation. He Yurun selected 6 years of financial data of A-share listed companies for research, and the results showed that the innovation investment of enterprises was affected by product market competition, and the greater the market competition pressure, the more enterprises will carry out innovative research and development activities [22]. This view has also been confirmed by relevant studies conducted by foreign scholars. Thakor et al. [23] found that when the competitive pressure in the industry of an enterprise increases, the enterprise will increase its investment in innovation and produce higher innovation performance.
Finally, from the perspective of enterprise, ownership concentration, board size and independence, management characteristics and incentive mechanism will all have an impact on enterprise innovation input. From the perspective of equity concentration, the more concentrated equity, the more conducive to the improvement of enterprise innovation efficiency, while the excessively dispersed equity is not conducive to enterprises’ innovation activities [24]. However, some scholars put forward the opposite view. Yang Jianjun and Sheng Suo [25], by studying the degree of risk faced by enterprises caused by ownership concentration, concluded that the higher the degree of ownership concentration, the higher the risk faced by R&D projects, and thus the lower the willingness of management to invest in R&D projects. From the perspective of the size and independence of the board of directors, although a large-scale board of directors can better complement each other’s advantages and improve investment efficiency, it will also increase coordination costs and make its supervision function unable to play effectively [26]. In addition, independent directors can improve the scientific rigor, effectiveness and safety of the company’s decision-making process, thus promoting the innovation efficiency of the enterprise, and independent directors with higher educational background are more willing to increase the R&D investment of the enterprise [27,28]. From the perspective of management characteristics and incentive mechanism, enterprise executives usually have the characteristics of overconfidence, that is, they have the spirit of adventure and are more willing to invest in high-risk projects, thus increasing enterprise innovation input and producing more patents, and achieving higher innovation performance [29,30]. It is worth mentioning that business executives with professional technical background will make more efficient innovation decisions [31]. As for the management incentive mechanism, a perfect incentive mechanism will improve the fault tolerance rate of enterprises to executives, and allowing failure means that enterprise executives will be more willing to invest funds in innovative projects, thus improving the R&D capability of enterprises [32,33].
2.1.2. The Economic Consequences of Executive Corruption
Regarding the economic consequences of corruption, the academic community presents two perspectives. One contends that businesses, through corrupt practices such as bribery, can circumvent certain inefficient government interventions, reduce unnecessary administrative processes, and enhance the operational efficiency and investment effectiveness of the enterprise. Conversely, another perspective argues that executive corruption, driven by the misuse of managerial authority for personal gain, may impart negative effects on corporate governance and the creation of corporate value.
On one hand, research findings suggest that executive corruption has positive economic consequences [34]. Scholars endorsing this perspective often utilize the Anomie theory to discuss the positive economic outcomes of executive corruption. Anomie theory posits that members of society are more likely to seek illegal means to achieve their ideal goals. When corruption becomes an effective means for corporate success, more and more enterprises will face the pressure of anomie. For example, when a company is committed to innovation, and making informal payments (bribery) facilitates the avoidance of stringent regulations, corporate managers are inclined to undertake such activities. This enables the smooth progression of relevant business activities, thereby contributing to the economic development of the enterprise [6].
On the other hand, more research indicates that executive corruption has negative economic consequences. Domestic scholars, through extensive research, have shown that the abuse of power for corrupt practices by corporate management will bring adverse economic impacts to the enterprise. Their rent-seeking behavior influences the direction of corporate decision-making, increases uncertainty in external and internal investments, affects resource allocation, thereby reducing investment efficiency, resulting in a negative impact on enterprise value creation, directly reflected in the decrease of the net return on assets for the company [35,36]. In addition, executive corruption has a negative impact on corporate culture construction because the corrupt behavior of the management will encroach on investors’ interests, affect the company’s reputation, and hinder the establishment of the correct values in the enterprise [37]. Once the corrupt behavior of corporate executives is exposed, it will lead to an increase in the company’s operating costs, not only damaging the company’s value and investors’ interests but also hindering the future development of the enterprise. After extensive research, foreign scholars generally believe that the phenomenon of corporate corruption has, to a large extent, led to a slowdown in economic development. Pearce et al. [38] through studying corruption data from multiple countries, empirical evidence indicates that managerial corruption significantly inhibits the efficiency of corporate investments, thus impacting economic development. Furthermore, corruption violates the principles of resource allocation, disrupts market fairness, and affects the healthy development of society and the economy. The corrupt behavior of executives will lead companies to allocate more resources to non-productive activities, resulting in a decline in the efficiency of productive endeavors. Mukherjee et al. [39] empirical studies have shown that in environments with severe corruption, the management of companies tends to reduce investment in innovation, hindering the development of new technologies. Additionally, corruption is detrimental to the proper allocation of managerial talents. When corporate executives operate in a corrupt environment, they are more inclined to channel their abilities towards rent-seeking activities, aiming to maximize corporate wealth.
Through the review of the literature mentioned above, the existing research on corporate innovation has extended from the company level and the market economy level to the macroeconomic level. The research perspectives on the factors influencing corporate innovation have evolved from internal to external considerations and have expanded to explore the combined impact of internal and external factors. The research outcomes have been abundant, but there is a limitation in the measurement methods for corporate innovation, as they tend to rely solely on either innovation inputs or outputs. In addition, scholars have conducted extensive research on the economic consequences of corporate corruption, but there is still no unified measurement indicator. Foreign scholars mostly use corruption assessment indices to gauge the extent of corporate corruption, such as the Corruption Perceptions Index (CPI) and the Worldwide Governance Indicators (WGI). However, due to regional political environments, cultural customs, and other differences, these assessment indices are prone to corruption information biases. Domestic scholars often choose the number of crimes committed by entrepreneurs in a region as a proxy variable for executive corruption. However, corruption is a covert and non-public behavior, so disclosed crime data may not accurately and comprehensively reflect the level of corporate corruption. It is worth noting that the academic research on executive corruption and corporate innovation is mostly conducted separately. There are few studies in the literature that simultaneously investigate the relationship between the two and examine the mediating and moderating mechanisms. However, under the current unique political and economic system in China, it is still necessary to continuously explore how enterprises can regulate their behavior, enhance innovation awareness, improve innovation capabilities, and achieve better development.
2.1.3. Correlation between Corporate Innovation and Financial Misconduct
The relationship between corporate innovation and financial misbehaviour has been explored previously. Bange and De Bondt, based on data from 100 US firms from 1977 to 1986, obtained that R&D budget adjustments narrowed the expected gap between analysts’ earnings forecasts and reported revenues, and that more gap narrowing was associated with high trading volume and high business risk [40]. Kwon and Yin examined systematic differences in compensation policies, sensitivity of compensation to market and accounting performance, and earnings management between high-tech and low-tech firms. The findings show that high-tech firms are also more inclined to reward managers who use discretionary accruals to meet earnings projections. This is consistent with compensation committees in high-tech firms rewarding CEOs for using discretionary accruals to convey private information to reduce information asymmetry [41]. Shust finds that the extent to which firms engage in R&D is positively related to the extent to which firms engage in accrual-based earnings management [42].
2.2. Theory Analysis and Research Hypotheses
The academic community holds two main perspectives on the relationship between executive corruption and corporate innovation. One perspective suggests that corporate management, through informal payments and similar means, seeks rent from the government, reducing ineffective government intervention. This allows corporate innovations to obtain market access permits more quickly, thereby improving innovation efficiency. The other perspective posits that corrupt behavior by executives affects the allocation of corporate resources, increases business risks, and consequently leads to higher uncertainty in corporate innovation activities [43].
According to rent-seeking theory, in an idealized market structure, all corporate managers strive to maximize their returns based on their abilities while leading the company to achieve profit maximization, a behavior referred to as “rent-seeking”. However, real markets are influenced by government interventions such as market access policies, industry competition mechanisms, and tariff trade barriers. Entrepreneurs gradually realize the challenges of rent-seeking activities due to these factors. They turn to non-productive activities like bribery to obtain entry permits from the government, thereby improving operational efficiency. This suggests that corruption could serve as a “lubricant” for corporate innovation, as entrepreneurs use bribery and rent-seeking activities to address uncertainties and risks in business operations caused by political factors. Bribery is seen as a compensated service provided by government officials, acting as a compensatory measure for deficiencies in the social system. Through corruption, enterprises can enhance the efficiency of their innovation investments.
However, due to the illegitimacy of corruption, such irregular transactions by corporate managers, even if contracted with government officials, will not be legally protected. This also imparts a post-opportunistic nature to corruption, implying that government officials accepting bribes are highly likely not to fulfill their commitments, opening a “door of convenience” for enterprises [44]. Moreover, the bribery activities of enterprises inadvertently induce the government to formulate more rules to extract additional rents [45]. In this scenario, transaction costs of rent-seeking increase, compromising the interests of those engaged in corrupt practices. This, to a certain extent, can impact the implementation of the innovation strategy for businesses. Thus, from this perspective, corruption can be seen as a “hindrance” to enterprise innovation.
In addition, according to the principal-agent theory, because the principal desires to maximize their wealth while the agent is more focused on maximizing their salary and welfare benefits, conflicts of interest may arise. Since agents prioritize their immediate interests, when enterprises gain greater benefits through corrupt activities, they are more inclined to divert corporate resources to non-productive rent-seeking activities, aiming to maximize profits by misappropriating wealth [46]. That is to say, corruption distorts resource allocation and reduces the ability of enterprises to create wealth. When entrepreneurs realize that engaging in non-productive activities, including morally risky corrupt practices, can enhance corporate performance, they will no longer devote themselves to activities such as innovation to improve core competitiveness or capture market share. Instead, they seek to ensure the survival and development of their enterprises by forming a “network of relationships” with the government. In summary, in a relatively sound societal system, corruption acts as an unforeseen cost. It not only suppresses the innovative abilities of entrepreneurs, increases the risk of innovation for businesses, but also distorts the allocation of social resources, hindering the formation of a just and equitable socio-economic environment.
Based on this, the paper proposes the following hypotheses:
H1a.
Under the same conditions, executive corruption promotes corporate innovation.
H1b.
Under the same conditions, executive corruption inhibits corporate innovation.
Financing constraints refer to the financing difficulties that a company faces, and they have a significant impact on the company’s discretionary cash flow. Unlike general investment projects, innovative research and development projects not only involve higher risks and uncertainties but also require more resources such as time, money, and manpower. This often means that a company cannot solely rely on internal funds to complete the entire process of an innovation project, from investment to output, and finally, the conversion of company earnings. The role of external financing channels becomes crucial, indicating that the impact of financing constraints on corporate innovation is more severe [47]. Although external financing plays a crucial role in corporate innovation, obtaining external financing for innovation projects is not always smooth. This is because to secure external financing, companies need to demonstrate their development potential to investors. However, for the purpose of protecting core technologies from being disclosed, companies often refrain from disclosing research and development projects in public documents. This lack of transparency makes it challenging for external investors to understand the overall development of the company. Chen Peng and Yang Meng [48] conducted an empirical study using small and medium-sized information technology listed companies on the ChiNext board as research samples to investigate the impact of financing constraints on corporate research and development (R&D) investment. The results indicate that the higher the external financing constraints on a company, the lower its level of R&D investment, thereby affecting the company’s profitability.
The emergence of executive corruption is attributed to the realization by corporate managers that rent-seeking behavior allows companies to acquire government resources, entry permits, etc., at a lower cost. However, these non-productive activities do not contribute to the development of the company by enhancing its core competitiveness. This is detrimental to the company’s image, to some extent reducing the willingness of banks to lend and the investment intentions of external investors, thereby increasing the external financing costs of the company. In this scenario, corporate managers carefully consider resource allocation, reassess the feasibility of achieving innovation goals. When information asymmetry is significant, managers will reduce corporate innovation investment to mitigate operational risks. Based on the theoretical analysis above, this paper establishes the following research hypotheses:
H2.
Executive corruption increases the degree of corporate financing constraints, thereby inhibiting corporate innovation.
The quality of internal control reflects the level of internal governance within the company and, to a certain extent, can constrain executive behavior, influencing corporate strategy. The uniqueness of corporate innovation activities means that rational entrepreneurs will only engage in them when private benefits exceed expected private costs. They are also inclined to abandon research and development projects that do not bring commercial value to the company during their tenure. Research by Wang Yanan and Dai Wentao [49] indicates that high-quality internal control can reduce agency costs, alleviate innovation risks caused by information asymmetry, and thereby promote corporate innovation input and efficiency. The construction of a well-established internal control system can constrain executive behavior, alleviate innovation problems caused by agency issues, and have a positive impact on corporate innovation [50]. Based on this, the following hypothesis is proposed:
H3.
The higher the quality of internal control in a company, the more it can mitigate the inhibitory effect of executive corruption on corporate innovation.
Whether executives have a professional finance background has a significant impact on the economic decision-making of the company. This is because executives play a leading role in decision-making within the company, and the performance of the company is closely related to the capabilities of the executive team. Executives with a professional finance background typically possess stronger information collection and processing abilities. Their assessment of and tolerance for risks also differ from those without a professional background. When executives with a professional background seek the development of the company through corrupt practices, their professional capabilities influence their decision-making direction. Specifically, they may divert resources away from innovative projects with higher risks and lean towards lower-cost non-productive rent-seeking activities. Based on the above, this paper establishes the following research hypothesis:
H4.
Compared to executives without a professional background, executives with a professional background have a stronger inhibiting effect on corporate innovation through corruption.
State-owned enterprises in our country generally have salary controls, which link the income of enterprise managers to the wage level of enterprise employees. This is determined by the special state-owned asset management system in China. Currently, in theory, China acknowledges the contribution of enterprise managers to business operations. However, due to the significant information asymmetry between the government and enterprises, the government strictly controls the income of enterprise managers. In the face of many state-owned enterprises, it is difficult for the government to obtain their actual operational status at a lower cost. This also means that the government finds it challenging to formulate effective incentive policies and conduct post-supervision. At the same time, the presence of government intervention has increased the burden on enterprises, shifting their goals from maximizing enterprise value to diversifying objectives. This means that executives in state-owned enterprises are more inclined to maintain a status quo during their tenure, sustaining the company’s ongoing operations, rather than focusing on strengthening the core competitiveness of the enterprise. In other words, executives in state-owned enterprises are more likely to implement a conservative investment strategy, rather than allocating resources to innovative activities with higher risks and uncertain returns [51]. Based on the comprehensive analysis above, this paper establishes the following research hypothesis:
H5.
Compared to non-state-owned enterprises, executive corruption has a stronger inhibitory effect on innovation in state-owned enterprises.
Policy is a crucial factor influencing corporate performance. Boubakri et al. [52] concluded through empirical research that political resources, as one of the essential resources for enterprises, significantly impact corporate decision-making. Currently, China is undergoing a critical transitional period, with political and economic systems not yet fully mature. The government holds a dominant position in the development of the market economy. Compared to companies without political background or with weak political ties, those with political affiliations are more likely to access bank loans, enjoy government tax incentives, and obtain qualification licenses [53,54].
It is noteworthy that the fundamental purpose of executive corruption is to seek personal gains. When corporate managers realize that the cost of rent-seeking is relatively low but the benefits are substantial, such as facilitating convenient access to resources and building a good reputation for the company, the willingness of corporate managers to innovate will significantly decrease. Although this practice is not conducive to the formation of the company’s core competitiveness, it is considered a “shortcut” to improve corporate performance [55]. Therefore, this paper argues that, compared to companies without political backgrounds, corporate executives with political affiliations are more inclined to seek corporate development through corruption rather than innovation.
In conclusion, this paper establishes the following hypothesis:
H6.
Compared to companies without political connections, companies with political connections exhibit a stronger inhibitory effect of executive corruption on innovation.
Existing research indicates that effective information disclosure can attract more financing resources for corporate innovation. The quality of audits, to a certain extent, serves as evidence of the disclosure’s quality. High-quality audits play a role in deterring executive corruption, helping regulate the behavior of corporate managers, and thus fostering a favorable environment for innovation. In summary, based on the above, this paper establishes the following research hypothesis:
H7.
The higher the quality of external audits, the more it can alleviate the inhibitory effect of executive corruption on corporate innovation.
Institutional investors typically possess higher professional expertise, stronger information gathering capabilities, and richer investment experience. They tend to pay closer attention to the development potential of the invested projects during investment activities. To some extent, this focus can restrain inefficient investments by companies, thereby enhancing overall investment levels. Additionally, the higher the institutional investor ownership percentage, the stronger their supervisory role over the company. This implies a more pronounced constraint on company executives. In this situation, corporate managers, hindered by the presence of institutional investors, will regulate their own behavior, reducing the occurrence of improper conduct. Based on the above analysis, this paper establishes the following hypothesis:
H8.
The higher the proportion of institutional investors’ shareholding, the more it can mitigate the inhibitory effect of executive corruption on corporate innovation.
2.3. Research Design
2.3.1. Sample Selection and Data Source
This paper selects data from A-share listed companies on the Shanghai and Shenzhen stock markets from 2012 to 2020 as the sample and conducts preliminary screening based on the following criteria: (1) excluding sample data from companies in the financial industry; (2) excluding sample data from ST and ST* categorized listed companies; (3) excluding sample company data with abnormal data and missing relevant indicators. In the end, 21,444 sample observations are obtained. To mitigate the impact of outliers on the data analysis, this paper performed Winsorization on the primary continuous variables, trimming the upper and lower tails by 1%. This paper uses data on corporate innovation from the CSMAR database. The methodology for executive corruption data follows the approach of Quan Xiaofeng et al., using the model for estimating non-normal on-the-job consumption by executives [56]. Financing constraints are calculated with the SA financing constraint index, referencing the research of Shi Qingmei et al. and Ju Xiaosheng et al. [57]. Data on internal control are sourced from the DIB Internal Control and Risk Management database. Political connection data are referenced from the studies of Fisman and Wang, as well as Jia Ming and Zhang Zhe, and are manually collected and organized from executive information in annual reports [58]. Data on executive professional background, company nature, audit quality, institutional investor shareholding ratio, and basic financial indicators are from the WIND database. Data processing in this paper is primarily conducted using Excel and Stata 17.0.
2.3.2. Variable Definitions
- Enterprise Innovation
For enterprise innovation, academic research has mostly measured it from the perspectives of “input” or “output”. Input refers to the innovation investment of enterprises. Since data on research and development (R&D) investment is relatively scientific, accurate, and accessible, R&D investment is often used as a proxy variable for enterprise innovation [59]. In addition, research and development are highly correlated, so this method of measuring enterprise innovation has been widely accepted and applied in research by most scholars [60,61]. At the same time, some scholars believe that many non-scale enterprises do not form formal R&D plans when engaging in innovation activities, and the level of their innovation activities cannot be perfectly measured by input alone [14]. Therefore, scholars use “output” to characterize the efficiency and capability of enterprise innovation. This is because the quantity and quality of the output of an activity can well reflect the effectiveness of that activity. The quality of the output of innovation activities is difficult to quantify, and there is currently no unified evaluation standard. Most existing literature uses the quantity of innovation output, such as patents and trademarks, to measure the level of enterprise innovation [62,63]. This paper integrates both perspectives, using both R&D investment and the quantity of patents to measure enterprise innovation.
- Executive Corruption
Internationally, the measurement indicators for corruption are mainly reflected at the macro level, i.e., the degree of corruption in a country or region. For instance, the Global Corruption Perception Index (CPI), the Worldwide Governance Indicators (WGI), the Investment Corruption Index (EIU), and the Illicit Payments and Bribes Index (IPB) are commonly used. Domestically, research on corruption primarily focuses on the micro level, specifically discussing the degree of corruption in Chinese listed companies. Scholars approach the definition of executive corruption from different angles. Xu Xixiong based on the “visibility” of the consequences of executive corruption, categorizes it into explicit corruption and implicit corruption. Explicit corruption refers to executive corrupt practices that directly violate national laws and regulations. Once discovered, executives involved will face legal sanctions, directly impacting their reputation and causing negative consequences for the companies they are associated with. Implicit corruption, on the other hand, involves executives abusing the power granted by the company for personal gain through improper means. This type of behavior is often difficult for supervisory authorities to detect. While executives may gain significant benefits, it can substantially damage the company’s values. Huang Qunhui [64] classifies executive corruption into transactional corruption (gaining personal benefits through accepting bribes) and non-transactional corruption (gaining personal benefits through embezzlement) based on whether there are transactions involving power and money. The current academic consensus largely aligns with Xu Xixiong’s viewpoint. Scholars, through empirical research, have confirmed that implicit corruption by corporate executives is more common [65]. This involves executives abusing their authority to seek personal gains, often concealed under various pretexts.
Currently, there are three main categories of indicators for measuring corporate corruption: the first involves using travel and entertainment expenses to assess executive corruption [66,67]. Entertainment expenses refer to the costs incurred by companies for legitimate business operations, while travel and hospitality expenses include various costs such as transportation, accommodation, and miscellaneous expenses generated during business trips by company employees. This category represents a significant and regular expenditure for companies. However, due to the incomplete nature of the national system and the lack of clear regulations defining the reasonable scope of entertainment and travel expenses, instances of non-compliant reimbursement of receipts can easily occur in the actual operation of companies [68]. The second category involves measuring the level of corruption among corporate executives through on-the-job consumption. On-the-job consumption generally includes eight major items: office expenses, business entertainment expenses, travel expenses, overseas training expenses, communication expenses, car expenses, director fees, and meeting expenses. Compared to the first measurement method, this approach covers more indicators that executives may use to conceal their corrupt behavior. It serves as an excellent camouflage for executives’ private misconduct, as executives often tend to reimburse personal expenses through these items, thereby shifting personal expenses to company accounts in reality. The third category involves measuring the extent of corporate corruption through the number of corruption cases involving top executives [11,13]. However, this method is not commonly used because the disclosure of cases usually has a lag and cannot promptly reflect the corruption situation within the company for the current year [56].
After comprehensive analysis, this paper draws on the research of Quan Xiaofeng et al., using abnormal in-service consumption, i.e., the difference between actual in-service consumption by top executives and the expected normal in-service consumption, as the measure of corporate executive corruption (Corr). The expected normal in-service consumption for top executives is estimated using the following Model (1):
Here, i represents an individual, t represents the time at which the individual is located, and ε represents the random disturbance term (similarly below). Perks represent actual in-service consumption by top executives, measured by deducting items such as management expenses, bad debt provisions, inventory depreciation provisions, and the amortization of intangible assets not clearly related to in-service consumption. Asset represents the total assets at the end of the previous year for the company; ΔSale represents the change in the main business income of the company in the current year; PPE represents the net value of fixed assets of the company in the current year; Inv represents the total inventory of the company in the current year, and LnEmp represents the natural logarithm of the total number of employees in the company. By using Model (1) for year-by-year and industry-by-industry regression, the estimated residual value is the abnormal in-service consumption of the sample company for the current year.
- Financing Constraints
This paper refers to the research of Shi Qingmei et al. [57], using the SA index to measure the degree of corporate financing constraints. The calculation formula is as follows:
- Internal Control (IC)
Internal Control is measured using the ‘Dibo China Listed Company Internal Control Index’. A higher index value indicates a higher level of internal control within the company. The reason for selecting this index is its recognition by the Ministry of Finance and its design with scientific and authoritative attributes. In 2011, Dibo Company first released the Internal Control Index for listed companies in Beijing, and since then, many domestic scholars have used this index to measure internal control in studies related to internal control.
- Educational Background of Executives (EDU)
Educational Background of Executives refers to whether there are individuals with a financial background among the current directors, supervisors, and senior management of the company. The data is sourced from the WIND database and is represented as a dummy variable, where having a financial background is assigned a value of 1, and not having one is assigned a value of 0.
- Nature of the Enterprise (SOE)
Nature of the Enterprise is a dummy variable, with a value of 1 for state-owned enterprises (SOEs) and 0 for non-state-owned enterprises.
- Political Connection (PC)
Political Connection refers to the informal and special political-business relationships formed between the company and government departments or individuals with political power, representing a unique resource owned by the company. Yang Qijing [69] suggests that there is a substitution relationship between corporate political connections and innovation capability. Drawing on the research by Fisman and Wang [58] and Jia Ming and Zhang Zhe [70], the study manually compiles executive information from annual reports, setting political connection as a dummy variable to measure whether executives of the company have served or are currently serving as government officials, National People’s Congress (NPC) deputies, Chinese People’s Political Consultative Conference (CPPCC) members, etc.
- Audit Quality (AUDIT)
Audit Quality refers to whether external auditors conduct audits strictly in accordance with auditing standards. The higher the independence and professional competence of the auditors, the higher the audit quality. Currently, there are various indicators used in academia to measure audit quality, including the size of accounting firms, audit fees, and manipulable accrued profits. This paper assesses audit quality based on the size, business revenue, and social influence of the auditing firm. If a company is audited by one of the ‘Big Four’ accounting firms, it is assigned a value of 1; otherwise, it is assigned a value of 0.
- Institutional Investor Ownership (INSP)
Institutional Investor Ownership refers to the percentage of institutional investors’ holdings in listed companies, directly sourced from the WIND database.
- Other control variables
The definitions of the other control variables are displayed in Table 1.

Table 1.
Variable description.
2.3.3. Model Design
This paper follows the empirical practices of relevant literature and sets up the regression model as follows:
where RD represents corporate innovation, Corr represents executive corruption, CONTROLS represents control variables, including firm size (SIZE), firm performance (ROA), growth opportunity (GROW), Tobin’s Q value (TBQ), years of listing (AGE), financial leverage (LEV), cash flow (CFO), the shareholding ratio of the largest shareholder (LARST), executive monetary compensation (COMP), and dual roles (DUAL). represents time fixed effects, and represents firm fixed effects.
Drawing on the approach of Wen Zhonglin et al. [71], we construct the following models to examine the mediating effect of financing constraints. We empirically analyze the relationships between executive corruption and corporate innovation (Model (2)), executive corruption and financing constraints (Model (3)), and the combined effect of executive corruption, financing constraints, and corporate innovation (Model (4)).
3. Results
3.1. Descriptive Statistics
Table 2 displays the descriptive statistical results of the main variables. As shown in Table 2, the mean of research and development investment (RDIN) is 0.0384, indicating an overall low level of innovation investment in Chinese enterprises. Additionally, the mean exceeds the median, and with a standard deviation of 0.0434 and a maximum value of 0.2535, it suggests a significant disparity in R&D investment among listed companies in China. For innovation output (RDOUT), the median number of patent applications is 0, suggesting that the majority of companies did not have innovation output in the given year. Executive corruption (Corr), measured by abnormal on-the-job consumption by management, ranges from −0.06 to 0.09, indicating variations in corruption levels among listed companies in China.
Table 2.
Descriptive statistics.
3.2. Main Regression Results
Table 3 presents the OLS regression results for the full sample in columns (1)–(2) and for the sample excluding firms with no R&D activities (RDIN equals 0) in columns (3)–(4). From the data in the table, it can be observed that before adding control variables, the regression coefficients of top executive corruption on corporate R&D investment are −0.367 and −0.402, showing a significant negative correlation at the 1% level. After including control variables, the regression coefficients become −0.279 and −0.303, both significantly negatively correlated at the 1% level, indicating that top executive corruption significantly inhibits corporate innovation. The regression results support hypothesis H1b.
Table 3.
Regression results on the relationship between executive corruption and corporate innovation.
Meanwhile, the regression results for the full sample show that the coefficients for firm size (SIZE), firm performance (ROA), cash flow (CFO), and growth (GROW) are 0.002, 0.083, 0.037, and 0.002, respectively. These coefficients pass significance tests at the 1%, 1%, 1%, and 5% levels, respectively, consistent with existing research conclusions. Generally, larger firms with more disposable cash flow and better operational performance are more willing to increase innovation investment to enhance core competitiveness, continually solidify their positions, and gain greater development potential. Additionally, the regression coefficient for financial leverage (LEV) is significantly negative, indicating that the corporate leverage ratio significantly affects innovation. This is because a higher leverage ratio implies greater debt repayment pressure on the company, leading managers to reduce the willingness for innovation and decrease innovation investment to lower business risk.
3.3. Mediation Effect Test for Financing Constraints
This paper follows the mediation testing procedure proposed by Wen Zhonglin et al. [71] to examine the mediating effect of financing constraints, following the steps outlined below.
The first step involves examining the relationship between executive corruption and corporate innovation. Column 1 of Table 4 presents the regression results of model (3.2). From the data in the table, it can be observed that executive corruption significantly hinders corporate innovation at the 1% significance level, with a coefficient of −0.279. Therefore, considering the role of the mediator variable, the analysis proceeds to the second step.
Table 4.
Mediation effect test of financing constraints.
The second step involves testing the relationship between executive corruption and financing constraints. Table 4, column 2, presents the regression results for Model (3). From the data in the table, it is evident that executive corruption is significantly positively correlated with financing constraints at the 1% significance level, with a correlation coefficient of 0.619. This indicates that executive corruption exacerbates the degree of corporate financing constraints.
The third step involves testing the relationship between executive corruption, financing constraints, and corporate innovation. Table 4, column 3, presents the regression results for Model (4). From the data in the table, it is evident that executive corruption is significantly negatively correlated with corporate innovation at the 1% significance level, with a correlation coefficient of −0.285. Financing constraints are also significantly negatively correlated with corporate innovation at the 1% significance level, with a correlation coefficient of −0.010. According to Wen Zhonglin’s explanation of the mediating variable, since both the relationships between executive corruption and financing constraints and between financing constraints and corporate innovation pass the significance test, it indicates that the impact of executive corruption on corporate innovation is realized through financing constraints. In other words, financing constraints play a partial mediating role between executive corruption and corporate innovation, supporting the hypothesis H2.
3.4. Analysis of the Moderating Mechanism of Changes in Internal and External Environments
Table 5.
Regression analyses of moderating effects based on internal control, executive educational background, and firm nature.
Table 6.
Regression analysis based on political connection, audit quality, and institutional investor ownership ratio.
To examine the moderating effect of internal control on the relationship between executive corruption and corporate innovation, the sample was divided into two groups based on the median of internal control and subjected to regression analysis. The results are presented in Table 5, columns 1 and 2. The regression results indicate that for firms with lower internal control quality, the coefficient of executive corruption on corporate innovation is −0.267, passing a 1% significance test. However, for firms with higher internal control quality, the relationship between executive corruption and corporate innovation did not pass the significance test. This suggests that as internal control quality improves, the inhibitory effect of executive corruption on corporate innovation gradually diminishes. In other words, higher internal control quality mitigates the inhibitory effect of executive corruption on corporate innovation, supporting Hypothesis 3.
To examine the heterogeneous impact of executive professional background on corporate innovation, this paper classified the sample into groups based on whether executives have a financial background or not. The impact of executive corruption on corporate innovation was then tested, and the results are shown in Table 5, columns 3 and 4. From the data in the table, it can be observed that for executives without a professional background, the level of corruption did not pass the test. In contrast, for executives with a professional background, corruption significantly inhibited corporate innovation at the 1% level, with a coefficient of −0.264. This indicates that the improper conduct of management with a professional financial background has a more negative impact on the level of corporate innovation. In other words, compared to executives without a professional background, executive corruption has a stronger inhibitory effect on corporate innovation when executives have a professional background, supporting Hypothesis 4.
To examine the impact of executive corruption on innovation in companies with different ownership structures, this paper classified the sample into state-owned enterprises (SOEs) and non-state-owned enterprises (non-SOEs). The results are presented in Table 5, columns 5 and 6. The results indicate that executive corruption in SOEs passed the significance test at the 5% level, with a coefficient of −0.229. However, executive corruption in non-SOEs did not pass the significance test. This suggests that, compared to non-SOEs, executive corruption has a stronger inhibitory effect on innovation in SOEs, supporting Hypothesis 5.
To test the moderating effect of political connections on the relationship between executive corruption and innovation, this paper divided the sample into two groups based on whether companies have political connections. The regression results using Stata 17.0 are shown in Table 6, columns 1 and 2. The results indicate that companies with political connections significantly inhibit innovation at the 1% level, with a coefficient of −0.214. In contrast, companies without political connections only passed the significance test at the 10% level. This is because companies with political connections have lower rent-seeking costs and more convenient channels for resource acquisition. The significant cost benefits drive executives to continuously divert productive resources through improper means, seeking enterprise development. In this context, compared to companies without political connections, executive corruption has a stronger inhibitory effect on innovation in companies with political connections, supporting Hypothesis 6.
To examine the impact of executive corruption on innovation under different levels of external audit quality, this paper divided the sample into two groups based on the level of audit quality and empirically tested the moderating effect of external audit quality on the relationship between executive corruption and innovation. The results are presented in Table 6, columns 3 and 4. From the data in the table, it can be observed that executive corruption in companies with low audit quality passed the significance test at the 1% level, with a coefficient of −0.279. In contrast, executive corruption in companies with high audit quality only passed the significance test at the 10% level. This suggests that higher external audit quality can alleviate the inhibitory effect of executive corruption on innovation, supporting Hypothesis 7.
In this subsection, we investigate the moderating effect of institutional investor ownership on the relationship between executive corruption and innovation. The sample was divided into two groups based on the median of institutional investor ownership, and regressions were conducted using stata17.0. The results are presented in Table 6, columns 5 and 6. The regression results show that in companies with lower external institutional investor ownership, executive corruption significantly inhibits innovation, with a regression coefficient of −0.214, passing the significance test at the 1% level. In contrast, in companies with higher external institutional investor ownership, the relationship between executive corruption and innovation did not pass the significance test. This indicates that as the proportion of institutional investor ownership increases, the inhibitory effect of executive corruption on innovation gradually weakens. Thus, when companies have a lower institutional investor ownership percentage, executive corruption has a stronger inhibitory effect on innovation, supporting Hypothesis 8.
3.5. Endogeneity Test and Robustness Test
3.5.1. Endogeneity Test
To address endogeneity issues, this section will employ instrumental variable method (IV), placebo tests, propensity score matching analysis (PSM), and other methods for examination.
- Instrumental Variable Method
The main effect studies indicate that executive corruption hinders corporate innovation. However, there may also be a reverse causal relationship between the two. That is, stronger innovation in an enterprise may lead to the regulation of executive behavior. For example, as the innovation level of an enterprise increases, its core competitiveness strengthens, attracting external investments and intensifying both internal and external supervision. This, to a certain extent, constrains executive behavior. To mitigate the potential reverse causality, this paper, following the approach of scholars like Liu Hang, employs the average value of executive corruption in the same industry (MCorr) as an instrumental variable in a two-stage least squares regression (2SLS) to examine the relationship between executive corruption and corporate innovation. The regression results are presented in Table 7.
Table 7.
Instrumental variable regression results (2SLS).
From the data in the first column of the table, it can be observed that the regression coefficient between the industry-average executive corruption (MCorr) and executive corruption (Corr) is 0.8230, passing the significance test at the 1% level. This indicates the rationality of the instrumental variable chosen in this paper. The results of the second-stage regression, as shown in the second column, reveal that the regression coefficient of executive corruption is −2.7267, passing the significance test at the 1% level. This implies that executive corruption significantly inhibits corporate innovation, providing robustness to the conclusions drawn in this paper.
- Propensity Score Matching Analysis (PSM)
Generally, multiple linear regression can alleviate some endogeneity issues, but its effectiveness in providing unbiased estimates relies on the correct specification of the functional form between the dependent and independent variables. Failure in correct functional form specification can lead to biased estimates. Propensity Score Matching Analysis (PSM) reduces the dependence on functional form specification to some extent.
Firstly, this paper divides the data into a high-corruption group (treatment group) and a low-corruption group (control group) based on the median of executive corruption. The two groups are then matched based on enterprise characteristics such as firm size (SIZE), return on assets (ROA), growth rate (GROW), Tobin’s Q (TBQ), years of listing (AGE), financial leverage (LEV), and cash flow (CFO). This matching process aims to make the treatment and control groups as similar as possible in terms of basic enterprise characteristics, except for the difference in executive corruption. The matching results show that out of 21,444 observations, 21,440 observations fall within the common range of values.
Secondly, to test whether the matching results satisfy the common support assumption, this paper generates kernel density plots before and after matching, as shown in Figure 1. From the results in the figure, it can be observed that the differences between the treatment and control groups significantly decrease after matching, indicating a successful match and fulfilling the common support assumption in PSM.
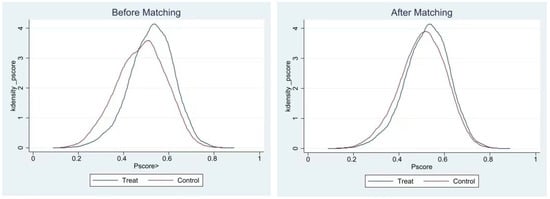
Figure 1.
Density plot comparison before and after.
Thirdly, a balance test is conducted to verify whether the matching results satisfy the assumption of conditional independence. The test results, as shown in Table 8, indicate that after matching, the standardized differences for all variables are below 5%. All t-tests accept the null hypothesis of no systematic differences between the matched groups and the control groups. Therefore, the matching results satisfy the assumption of conditional independence, demonstrating a better balance in the data differences.
Table 8.
Balance assumption test.
Finally, this paper merged the post-matched samples of the matched and control groups and conducted regression analysis once again to reevaluate the impact of executive corruption on corporate innovation. The ultimate PSM matching results are shown in Table 9. It can be observed that, after matching, the regression coefficient for executive corruption (Corr) is −0.2970, passing the significance test at the 1% level. This indicates that under similar conditions, companies with higher levels of executive corruption tend to have lower levels of innovation. The research conclusion remains unchanged, demonstrating the robustness of the primary findings.
Table 9.
PSM matching regression results.
3.5.2. Robustness Test
In order to address potential shortcomings in key variable definitions, regression method selection, and other aspects of this paper, and to enhance the reliability of the research results, this paper conducts robustness tests by replacing the measurement method of the dependent variable and the main effect regression method proposed in this paper.
- Variable Replacement
Drawing on the research by Jiang Xuanyu [59] and Wang Yanan et al. [49], the measurement method of the dependent variable, innovation in the firm, is replaced with the number of patents. The regression is then conducted to examine the robustness of the main effect. The results are shown in Table 10. It can be observed that without including control variables, when regressing the full sample and the sample excluding research and development activities, the regression coefficients between executive corruption and firm innovation are −0.657 and −0.689, respectively, both passing the significance test at the 1% level. After introducing control variables, the regression coefficients of executive corruption are −0.519 and −0.830, respectively, both passing the significance test at the 1% level. This indicates that the main effect research conclusion of this paper, that executive corruption inhibits firm innovation, remains robust even after variable replacement.
Table 10.
The regression results of the relationship between executive corruption and corporate innovation after replacing the variable.
- Regression Method Replacement
In regression analyses, situations where continuous variables are restricted at a certain point are referred to as ‘censored’, and systematically removing observations from the sample is termed ‘truncated’. Both situations can lead to the variable being limited to a specific range of values, causing inconsistent estimates. In this paper, when examining the factors influencing firm innovation, the comprehensive measurement of innovation involves using research and development inputs (RDIN) and outputs (RDOUT) data. Relying solely on OLS regression results may introduce bias because some companies have no innovation intention, resulting in zero investment. Other companies may have innovation intentions, but factors such as corporate culture and external institutional environments can lead to zero innovation input. The latter scenario may not be reflected in the data, meaning there is left-censoring in the innovation investment data. In such cases, using Tobit regression to estimate the model can alleviate the bias resulting from left-censoring in innovation investment data (RDIN).
Moreover, the innovation output data, represented by the number of patent applications, is a non-negative integer with a clear discrete feature. It is necessary to use count model regression methods such as Poisson regression and negative binomial regression. These methods are employed to regress executive corruption against innovation output (RDOUT). In summary, this paper replaces the main effect regression method, utilizing Tobit, Poisson, and negative binomial regression methods to re-examine the relationship between executive corruption and firm innovation. The empirical results are presented in Table 11.
Table 11.
Executive corruption and corporate innovation under different regression methods.
Using the Tobit regression method to estimate the model can alleviate to some extent the result bias caused by the left-censored nature of innovation input data. As shown in the first and second columns of the regression results, it can be observed that both before and after adding control variables, the regression coefficients of executive corruption on corporate innovation are −0.402 and −0.300, respectively, passing the 1% significance test. This indicates a certain robustness of the main regression conclusions. The third and fourth columns present the results of the Poisson regression, while the fifth and sixth columns display the results of the negative binomial regression. It can be noted that when changing the regression method for discrete data (innovation output), the regression coefficient of executive corruption consistently remains significantly negative at the 1% level, whether or not control variables are included. This suggests that the research findings are not sensitive to the choice of regression methods, demonstrating the robustness of the conclusions.
4. Discussion
In the societal context of “mass innovation” and “universal anti-corruption”, this paper, grounded in rent-seeking theory, agency theory, information asymmetry theory, and innovation theory, empirically examines the relationship between executive corruption and corporate innovation. The study investigates the pathways through which executive corruption influences corporate innovation, particularly focusing on the role of financial constraints. Additionally, the study explores the moderating effects of firm characteristics, internal controls, executive professional backgrounds, political connections, external audit quality, and institutional investor ownership in the relationship between executive corruption and corporate innovation.
Utilizing a dataset comprising 21,444 observations from A-share listed companies on the Shanghai and Shenzhen stock markets exchanges over the period 2012–2020, the paper yields the following conclusions: Firstly, executive corruption impedes corporate innovation, and this inhibitory effect is more pronounced in state-owned enterprises with lower internal control quality, stronger executive professional backgrounds, more substantial political connections, lower external audit quality, and reduced institutional investor ownership. Secondly, financial constraints act as an intermediary in the relationship between executive corruption and corporate innovation. Executive corruption exacerbates the financial constraints faced by companies, further influencing the acquisition and allocation of resources, leading to a decrease in both innovation input and output for the enterprise.
In light of the empirical research findings of this paper, recommendations are proposed from both the enterprise and government perspectives. Firstly, at the enterprise level, companies should enhance their innovation awareness and focus on strengthening their core competitiveness. As the national institutional environment continues to improve and the protection of property rights strengthens, the security of innovation outcomes for companies improves, providing a favorable external environment for innovation. Companies should recognize the importance of innovation, continuously elevate their innovation levels, and stabilize their development in the changing economic landscape. Additionally, companies should establish robust anti-corruption mechanisms, enhance cultural development, create a healthy and positive work environment for employees, and advocate for employees to be dedicated, law-abiding, and cultivate a work ethic of integrity. Eradicating corruption at its ideological roots can provide a favorable cultural environment for the economic development of the enterprise.
Secondly, at the government level, efforts should be made to improve anti-corruption mechanisms and create a favorable institutional environment for corporate innovation. The empirical results of this paper demonstrate that corruption significantly inhibits the improvement of corporate innovation levels, and this inhibitory effect is more pronounced in state-owned enterprises with strong political connections and low external audit quality. Therefore, the paper recommends that the government intensify anti-corruption efforts, actively promote anti-corruption legislation, rigorously combat corrupt practices, and enhance the deterrent effect of anti-corruption actions. Additionally, the government should strengthen internal and external supervision, improve internal oversight mechanisms, coordinate and constrain various powers to form a sound power operation mechanism, and mitigate the influence of political connections and state ownership on enterprises. The government should prioritize and advance external audits, encourage social supervision, fully leverage the oversight role of external institutions and the public, establish reward mechanisms to encourage the exposure of corrupt practices by the public, and gradually promote the concept of “universal anti-corruption”. Furthermore, the government should actively play its macroeconomic role, vigorously promote corporate innovation, and provide tax incentives and subsidies to enterprises with outstanding innovation performance, thereby enhancing the enthusiasm for innovation and boosting regional economic vitality.
The research in this paper also possesses certain limitations. Firstly, the definition of innovation warrants further exploration. The term ‘innovation’ is extensive and broad in meaning, and there exists diverse academic discourse on its measurement. This study interprets corporate innovation through innovation input and output (number of patent applications). Future research could enhance the credibility and objectivity of corporate innovation indicators, thereby rendering the research results more reliable and persuasive. Secondly, this empirical study focuses on listed companies in the Shanghai and Shenzhen stock markets, effectively illustrating the relationship between executive corruption and corporate innovation. However, the sample data does not encompass non-listed companies. Subsequent research could gather relevant data to expand the study, thereby rendering the research findings more universally applicable. Finally, this paper primarily investigates the relationship between executive corruption and corporate innovation. Future research could delve deeper into exploring the impact pathways of anti-corruption actions on corporate innovation and other economic outcomes.
Author Contributions
Conceptualization, M.B.; methodology, Y.C.; formal analysis, Y.C.; resources, M.B.; data curation, Y.C.; writing—original draft preparation, Y.C.; writing—review and editing, Y.H. and Z.Y.; project administration, M.B.; funding acquisition, M.B. All authors have read and agreed to the published version of the manuscript.
Funding
This research received no external funding.
Data Availability Statement
The raw data supporting the conclusions of this article will be made available by the authors on request.
Conflicts of Interest
The authors declare no conflicts of interest.
References
- Rodriguez, P.; Siegel, D.S.; Hillman, A.; Eden, L. Three Lenses on the Multinational Enterprise: Politics, Corruption and Corporate Social Responsibility. J. Int. Bus. Stud. 2006, 37, 733–746. [Google Scholar] [CrossRef]
- Luo, Y. An Organizational Perspective of Corruption. Manag. Organ. Rev. 2004, 1, 119–154. [Google Scholar] [CrossRef]
- Anokhin, S.; Schulze, W. Entrepreneurship, Innovation and Corruption. J. Bus. Ventur. 2009, 24, 465–476. [Google Scholar] [CrossRef]
- He, J.; Tian, X. Finance and corporate innovation: A survey. Asia Pac. J. Financ. Stud. 2018, 47, 165–212. [Google Scholar] [CrossRef]
- Hu, M.; Gan, S. Management power, internal control and executive corruption. J. Zhongnan Univ. Econ. Law 2015, 3, 87–93. [Google Scholar]
- Aidt, T.S.; Dutta, J. Policy Compromises: Corruption and Regulation in A Democracy. Econ. Politics 2008, 20, 335–360. [Google Scholar] [CrossRef]
- Claessens, S.; Laeven, L. Financial Development, Property Rights and Growth. J. Financ. 2003, 58, 24–36. [Google Scholar] [CrossRef]
- Li, H.; Zhang, J. Corruption and corporate innovation: Lubricant or stumbling block. Nankai Econ. Res. 2015, 24–58. [Google Scholar]
- Yang, Q. Enterprise growth: Political affiliation or capacity building? Econ. Res. 2011, 10, 54–66. [Google Scholar]
- Zhou, Y.; Zhao, X. Research on Local Government Competition Patterns—Theoretical and Policy Analysis of Constructing a Benign Competition Order among Local Governments. Manag. World 2002, 12, 52–61. [Google Scholar]
- Chen, D.; Li, O.Z.; Liang, S. Do Managers Perform for Perks; Working Paper; Social Science Electronic Publishing: Rochester, NY, USA, 2009. [Google Scholar]
- Zhou, L. Incentives and cooperation of government officials in the promotion game—Another discussion on the reasons for the persistence of local protectionism and duplicated construction problems in China. Econ. Res. 2004, 6, 33–40. [Google Scholar]
- Xu, X.; Liu, X. Decentralization Reform, Compensation Control and Corporate Executive Corruption. Manag. World 2013, 3, 119–132. [Google Scholar]
- Li, W.; Li, H.; Li, H. Innovation Incentive or Tax Shield?—Research on tax incentives for high-tech enterprises. Res. Manag. 2016, 37, 61–70. [Google Scholar]
- Lv, J.; Yu, D. Government Research and Innovation Subsidies and Enterprise R&D Investment: Extrusion, Substitution or Incentive? China Sci. Technol. Forum 2011, 8, 21–28. [Google Scholar]
- Wu, C.; Tang, G. Intellectual property protection enforcement strength, technological innovation and firm performance—Evidence from Chinese listed companies. Econ. Res. 2016, 51, 125–139. [Google Scholar]
- Li, H.; Zhang, Z. Financial development, intellectual property protection and technological innovation efficiency—The role of financial marketization. Res. Manag. 2014, 35, 160–167. [Google Scholar]
- Williams, H.L. Intellectual Property Rights and Innovation: Evidence from the Human Genome. J. Political Econ. 2010, 121, 1–27. [Google Scholar] [CrossRef] [PubMed]
- Li, M.; Xiao, H.; Zhao, S. A study on the relationship between financial development, technological innovation and economic growth—Based on provincial and municipal panel data in China. China Manag. Sci. 2015, 23, 162–169. [Google Scholar]
- Wang, P.; Wang, K. Digital Finance and Corporate Innovation Output—Moderating Effects Based on Reverse Mixing of Privately Listed Companies. Financ. Account. Mon. 2022, 8. [Google Scholar]
- Jia, J.; Lun, X.; Lin, S. Financial Development, Microenterprise Innovation Output and Economic Growth—An Empirical Analysis Based on the Patent Perspective of Listed Companies. Financ. Res. 2017, 1, 99–113. [Google Scholar]
- He, Y.; Lin, H.; Wang, M. Product market competition, executive incentives and corporate innovation—Empirical evidence based on Chinese listed companies. Financ. Trade Econ. 2015, 2, 125–135. [Google Scholar]
- Thakor, R.T.; Lo, A.W. Competition and R&D Financing Decisions: Evidence from the Biopharmaceutical Industry; Social Science Electronic Publishing: Rochester, NY, USA, 2015. [Google Scholar]
- Ren, H. An empirical study on the relationship between equity structure and corporate R&D investment—A data analysis based on A-share manufacturing listed companies. China Soft Sci. 2010, 5, 126–135. [Google Scholar]
- Yang, J.; Sheng, L. An empirical study on the impact of equity structure on corporate investment in technological innovation. Sci. Res. 2007, 4, 787–792. [Google Scholar]
- Linton, J.D. De–babelizing the language of innovation. Technovation 2009, 29, 729–737. [Google Scholar] [CrossRef]
- Ye, Z.; Zhao, Y. Independent directors, institutional environment and R&D investment. J. Manag. 2017, 14, 1033–1040. [Google Scholar]
- Shen, Y.; Wang, F.; Huang, J.; Ji, R. Do innate characteristics of executives play a role in the IPO market? Manag. World 2017, 9, 141–154. [Google Scholar]
- Yi, J.; Zhang, X.; Wang, H. Firm Heterogeneity, Executive Overconfidence and Firm Innovation Performance. Nankai Manag. Rev. 2015, 18, 101–112. [Google Scholar]
- Galasso, A.; Simcoe, T.S. CEO Overconfidence and Innovation. Manag. Sci. 2011, 57, 1469–1484. [Google Scholar] [CrossRef]
- Yu, S.; Wang, T. A study on the correlation between executives’ professional and technical backgrounds and corporate R&D investment. Econ. Manag. Res. 2014, 5, 14–22. [Google Scholar]
- Manso, G. Motivating Innovation. J. Financ. 2011, 66, 1823–1860. [Google Scholar] [CrossRef]
- Kong, D.; Xu, M.; Kong, G. Internal pay gap and innovation in enterprises. Econ. Res. 2017, 52, 144–157. [Google Scholar]
- Chen, X.; Chen, D.; Wan, H.; Liang, S. Regional differences, compensation control and executive corruption. Manag. World 2009, 11, 130–143. [Google Scholar]
- Wan, L.; Chen, F.; Rao, J. Regional corruption and corporate investment efficiency—An empirical study based on listed companies in China. Financ. Res. 2015, 5, 57–62. [Google Scholar]
- Lin, Y.; Liu, X.; Zhu, J. The impact of anti-corruption on investment efficiency: Based on the perspective of sustainable development. East China Econ. Manag. 2019, 33, 111–123. [Google Scholar]
- Wang, Y. Analysis of executive corruption in state-owned enterprise listed companies and coping strategies. Mod. Bus. Ind. 2011, 23, 133–135. [Google Scholar]
- Pearce, C.L.; Manz, C.C.; Sims, H.P. The roles of vertical and shared leadership in the enactment of executive corruption: Implications for research and practice. Leadersh. Q. 2008, 19, 353–359. [Google Scholar] [CrossRef]
- Mukherjee, A.; Singh, M.; Žaldokas, A. Do corporate taxes hinder innovation? J. Financ. Econ. 2017, 124, 195–221. [Google Scholar] [CrossRef]
- Bange, M.M.; De Bondt, W.F. R&D budgets and corporate earnings targets. J. Corp. Financ. 1998, 4, 153–184. [Google Scholar]
- Kwon, S.S.; Yin, Q.J. Executive compensation, investment opportunities, and earnings management: High-tech firms versus low-tech firms. J. Account. Audit. Financ. 2006, 21, 119–148. [Google Scholar] [CrossRef]
- Shust, E. Does research and development activity increase accrual-based earnings management? J. Account. Audit. Financ. 2015, 30, 373–401. [Google Scholar] [CrossRef]
- Murphy, K.; Shleifer, A.; Vishny, R. Why Is Rent–seeking So Costly to Growth? Am. Econ. Rev. 1993, 83, 409–414. [Google Scholar]
- Shleifer, A.; Vishny, R.W. Corruption. Q. J. Econ. 1993, 108, 599–617. [Google Scholar] [CrossRef]
- Guriev, S. Red Tape and Corruption. J. Dev. Econ. 2004, 73, 489–504. [Google Scholar] [CrossRef]
- Baumol, W. Entrepreneurship: Productive, Unproductive and Destructive. J. Political Econ. 1990, 98, 893–921. [Google Scholar] [CrossRef]
- Lian, Y.; Su, J. Financing constraints, uncertainty and investment efficiency of listed companies. Manag. Rev. 2009, 21, 19–26. [Google Scholar]
- Chen, P.; Yang, M. Research on the impact of financing constraints on R&D investment of small and medium-sized science and technology enterprises. Financ. Account. Newsl. 2018, 26, 57–61. [Google Scholar]
- Wang, Y.; Dai, W. Does internal control inhibit or promote corporate innovation?—The logic of China. Audit. Econ. Res. 2019, 34, 19–32. [Google Scholar]
- Zhang, G.; Zhao, J.; Tian, W. Internal control quality and firm performance: A perspective based on internal agency and signaling theory. World Econ. 2015, 1, 126–153. [Google Scholar]
- Yang, G.; Zhu, Y. Pay control, intra-firm pay gap and innovation: Evidence from the manufacturing industry. J. Econ. 2020, 7, 122–155. [Google Scholar]
- Boubakri, N.; Cosset, J.; Saffar, W. Political Connections of Newly Privatized Firms. J. Corp. Financ. 2008, 14, 654–673. [Google Scholar] [CrossRef]
- Zhao, L.; Sun, T.; Chen, S. Does Political Affiliation Ease the Debt Financing Constraints of Small and Medium-sized Enterprises?—Another discussion on the information value-added role of social auditing. Financ. Account. Newsl. 2019, 30, 125–128. [Google Scholar]
- Song, J.; Zhao, R.; Guo, T. Research on government subsidies, political affiliation and value of private listed companies based on mediation effect model. Soft Sci. 2020, 34, 82–87. [Google Scholar]
- Zhuang, Z. Innovation, entrepreneurial activity allocation and long-term economic growth. Econ. Res. 2007, 8, 82–94. [Google Scholar]
- Quan, X.; Wu, S.; Wen, F. Management power, private earnings and pay manipulation. Econ. Res. 2010, 45, 73–87. [Google Scholar]
- Shi, Q.; Sun, M.; Xie, X. Disclosure of critical audit matters and corporate innovation quality: A perspective on financing constraints under information asymmetry. Account. Econ. Res. 2022, 36, 19–40. [Google Scholar]
- Fisman, R.; Wang, Y. The Mortality Cost of Political Connections; Nber Chinese Economy Working Group: Cambridge, MA, USA, 2013. [Google Scholar]
- Jiang, X. Government decentralization and innovation of state-owned enterprises—A study based on the perspective of pyramid structure of local state-owned enterprises. Manag. World 2016, 9, 120–135. [Google Scholar]
- Quan, X.; Yin, H. Chinese short-selling mechanism and corporate innovation—A natural experiment based on the stepwise expansion of financing and securities. Manag. World 2017, 1, 128–144. [Google Scholar]
- Xu, Y.; Liu, Y.; Cai, G. Executive compensation stickiness and corporate innovation. Account. Res. 2018, 7, 43–49. [Google Scholar]
- Zhou, X.; Cheng, L.; Wang, H. Is the higher the level of technological innovation the better the financial performance of enterprises?—An empirical study based on 16 years of patent application data of Chinese pharmaceutical listed companies. Financ. Res. 2012, 8, 166–179. [Google Scholar]
- Xu, X.; Tang, Q. The effects of RD activities and innovation patents on firm value—A study from Chinese listed companies. Res. Dev. Manag. 2010, 22, 20–29. [Google Scholar]
- Huang, Q. New features of management corruption and new stage of state-owned enterprise reform. China Ind. Econ. 2006, 11, 52–59. [Google Scholar]
- Bai, Z.; Chen, Y.; Wang, L.; Yu, H. Research on the performance of state-owned listed companies and the implicit corruption of executives—Based on the perspective of behavioral economics. Res. Manag. 2018, 2, 100–107. [Google Scholar]
- Zhao, C.; Yang, D.; Cao, W. Administrative power, control power and executive corruption in state-owned enterprises. Financ. Res. 2015, 41, 78–89. [Google Scholar]
- Cai, H.; Fang, H.; Xu, L.C. Eat, Drink, Firms and Government: An Investigation of Corruption from the Entertainment and Travel Costs of Chinese Firms. J. Law Econ. 2011, 54, 55–78. [Google Scholar] [CrossRef]
- Huang, J.; Li, K. Eating and drinking, corruption and corporate orders. Econ. Res. 2013, 48, 71–84. [Google Scholar]
- Yang, Q. Political affiliation and corporate growth. Teach. Res. 2010, 6, 38–43. [Google Scholar]
- Jia, M.; Zhang, Z. Does political affiliation of executives affect corporate philanthropic behavior? Manag. World 2010, 4. [Google Scholar]
- Wen, Z.; Hou, J.; Zhang, L. Comparison and application of moderating and mediating effects. J. Psychol. 2005, 2, 268–274. [Google Scholar]
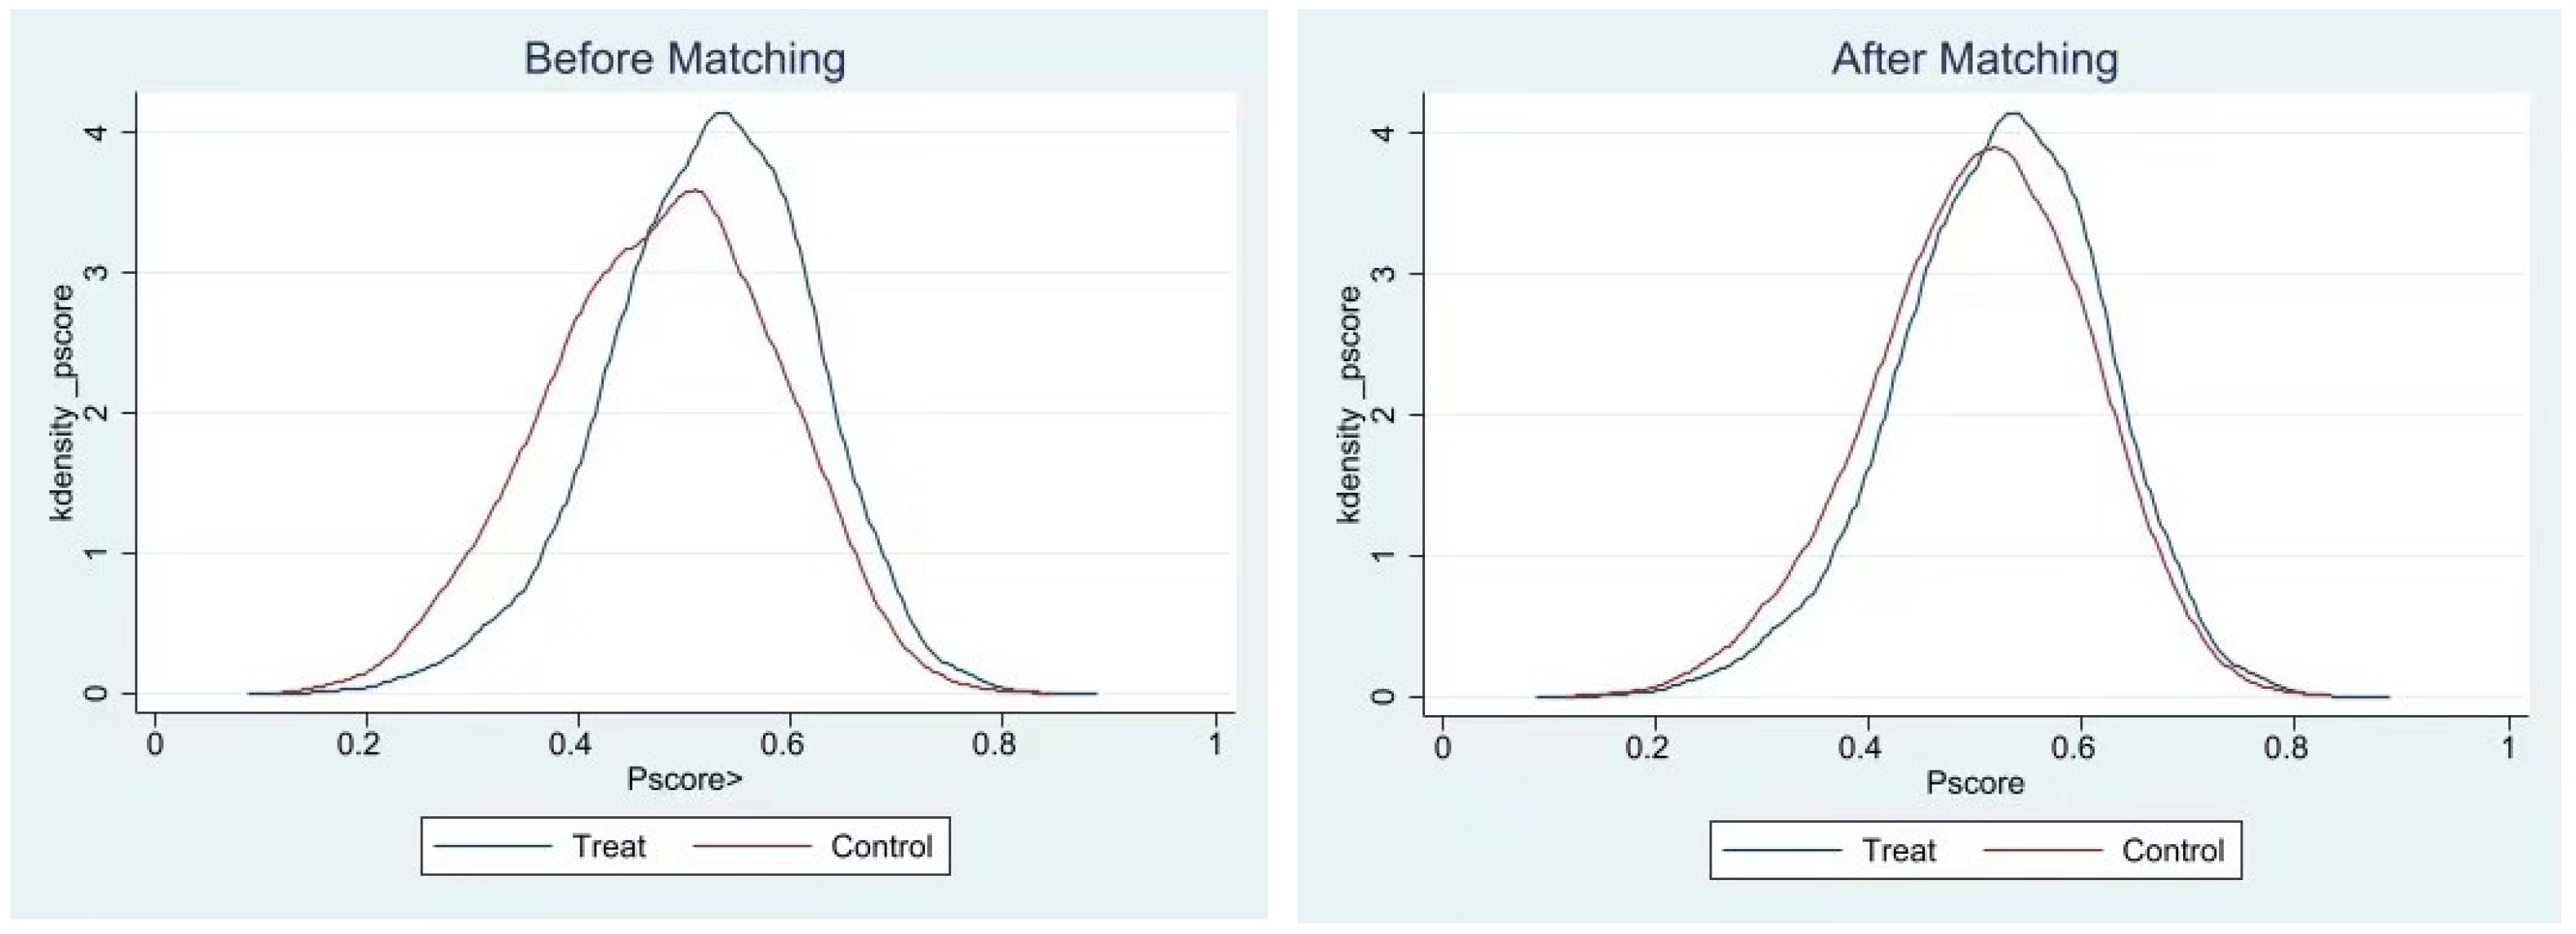
Disclaimer/Publisher’s Note: The statements, opinions and data contained in all publications are solely those of the individual author(s) and contributor(s) and not of MDPI and/or the editor(s). MDPI and/or the editor(s) disclaim responsibility for any injury to people or property resulting from any ideas, methods, instructions or products referred to in the content. |
© 2024 by the authors. Licensee MDPI, Basel, Switzerland. This article is an open access article distributed under the terms and conditions of the Creative Commons Attribution (CC BY) license (https://creativecommons.org/licenses/by/4.0/).