Article

Airside Optimization Framework Covering Multiple Operations in Civil Airport Systems with a Variety of Aircraft: A Simulation-Based Digital Twin

1
Department of Engineering, University of Exeter, Exeter EX4 4QF, UK
2
Exeter Digital Enterprise Systems (ExDES) Laboratory, University of Exeter, Exeter EX4 4QF, UK
3
Department of Industrial Engineering, Islamic Azad University, South Tehran Branch, Tehran 11518-63411, Iran
*
Author to whom correspondence should be addressed.
Systems 2024, 12(10), 394; https://doi.org/10.3390/systems12100394
Submission received: 28 August 2024 / Revised: 20 September 2024 / Accepted: 24 September 2024 / Published: 26 September 2024

Abstract

:
The airside is a principal subsystem in the intricate airport systems. This study focuses on introducing a digital twin framework for analyzing the delays and capacity of airports. This framework encompasses a diverse array of authentic features pertaining to a civil airport for a mixture of both landing and departing flights. Being a decision support for the management of international airports, all sizes and weight categories of aircraft are considered permissible, each with their own unique service time and speed requirements in accordance with the global aviation regulations. The proposed discrete event simulation digital twin provides a real-time demonstration of the system performance with the possibility of predicting the future outcomes of managerial decisions. Additionally, this twin is equipped with an advanced and realistic 3D visualization that facilitates a more comprehensive understanding of the ongoing operations. To assess its efficiency in practice, the framework was implemented at an international airport. The statistical tests revealed the superior similarity between the proposed twin and the real system. Using this twin, we further optimized the studied system by analyzing its projected future performance under a set of scenarios. This resulted in a nearly 30% upgrade in the capacity of this airport while decreasing the expected delays by over 18% annually.

1. Introduction

Optimizing complex systems and monitoring their performance pose convoluted challenges for system managers [1,2]. These tasks involve trade-offs, ensuring reliability, and adapting to changing conditions. Whether it is fine-tuning algorithms, managing resources, or analyzing data, system managers require advanced and up-to-date decision support tools to play their critical role in maintaining efficient and robust systems. Airports are one of such complex systems that are the most strategic component in the aviation industry. Several intricate subsystems with a multitude of events and operations are present in an airport that can be categorized in two major groups: landside and airside [3,4,5]. Here, the landside is mainly the segment of this system that deals with the passengers’ interactions with the airport facilities [6], while the airside concentrates on the operations pertaining to the aircraft on the airport’s ground as well as their movement within the airport’s airspace [3,4,5,7].
A comprehensive, real-time information base, known as a digital twin, offers more precise insights for strategic decision making and enhances the design, planning, and management processes of airport infrastructure [8]. In general, computer simulation models have long been interesting decision-support tools for airport managers for both airside and landside. For instance, Pérez et al. [9], Scozzaro et al. [10], and Derek et al. [11] utilized simulation for optimizing the staff schedules and allocations in the landside of the airport. Here, Pérez et al. [9] offered a discrete event simulation model for the terminal checkpoints to improve the shift allocation of security screening resources. They concluded that to improve the passenger cycle time of the studied airport, additional security officers are required, for which they offered two improvement strategies, namely reactive and proactive.
Manataki and Zografos [12] is another study that explored the use of simulation methods in the landside of airport systems. They applied the system dynamics simulation method to model the performance of the terminals, considering multiple stakeholders and a variety of services, including ticketing, check-in, boarding pass control, passport control, security screening, customs control, baggage claim, and ancillary services. Their model was illustrated using some sample data from Athens International Airport. Very recently, in a theoretical attempt, Uyar and Gürsel [13] discussed a discrete event simulation (DES) model using SimPy for the landside to address the passenger flow and waiting time at the security checkpoints, check-in stage, and boarding points.
On the other hand, focusing on the strategic planning of the airside, Chen et al. [14] proposed a simulation model for Shanghai Hongqiao International Airport (SHA). They built their simulation model on the ProModel platform and used it to analyze different scheduling scenarios to find the bottleneck in the system. The results presented in [14] suggest that if the demand increases from its baseline scenario, a drastic increment in the arrival and departure queue lengths can be anticipated at SHA airport. Özdemir et al. [15] studied the airside from the taxiway perspective. They proposed a simulation model for İstanbul Atatürk Airport using SIMMOD and explored the effects of adding a set of new taxiways. Their proposed changes in the infrastructure included various combinations of end-around and rapid-exit taxiways. The researchers concluded that switching to end-around and rapid-exit taxiways can decrease the taxi time by around 52% and 10%, respectively.
Offering a similar DES model in SIMMOD for the taxiway system of the airside, Dönmez et al. [16] investigated the influence of the International Civil Aviation Organization’s (ICAO) taxiway system development stages on the delays and runway capacity in a single-runway airport. Their case was Turkey’s Samsun Çarşamba Airport (LTFH), which reportedly has a basic level of taxiway layout. In their simulation model, however, they completely disregarded the capacities of other components of the airside (e.g., holding queue, apron). A DES model was also proposed by Feng and Johnson [17] using the ARENA simulation platform, explicitly for analyzing the end-around taxiways. Their configurations were partially inspired by the Dallas/Fort Worth International Airport. Lai et al. [18] proposed a conceptual DES model in Simul8 simulation software for some parts of the airside in New York City’s John F. Kennedy Airport (JFK) to analyze the potential bottlenecks and congestions in the taxiway utilization.
In general, existing studies either modeled the airside partially or put their main focus on scheduling of arrivals and departure events. This keeps them far from what managers would consider a practical decision support tool [19]. To address this gap, a few conceptual frameworks were proposed by Zografos and Madas [19] and Oliveira [8] to help managers analyze the system using various performance measures. In the most recent attempt in 2020, Oliveira [8] investigated the benefits of developing a digital twin for the airports. Being an experienced airport project manager and infrastructure expansion consultant herself, the author sees today’s airports as cyber-physical systems for which building information modeling (BIM) technology and 3D visualizations are essential for facilitating proper decision making.
Thus, in this study, we aim to introduce a practical digital twin that embraces all elements of the airside (e.g., holding stack, glide path, runway, taxiway, apron) in a realistic manner. This twin mimics the real behavior of the system by applying the rules and standards normally applied by airport crew and operation teams in accordance with the global authorities’ mandatory regulations. Such a digital twin can not only be used to assess the performance of the system under given scheduling scenarios, but it can also predict the effect of strategic decisions on the nominal capacity of the airside. The nominal capacity is the upper bound for the airside infrastructures, and thus having a realistic estimation of that is mandatory for the organization’s stakeholders to avoid overselling capacity to airlines [20]. However, such realistic estimations are generally overlooked, and the dominant approaches are the rough analytical methods [21,22].
Therefore, another contribution of the current study is to investigate the implementation of the proposed framework in an international airport case study seeking the optimization of its nominal capacity under sequential landings and departures. Furthermore, to address the above-mentioned need for a visual representation of the system, a realistic 3D visualization is also proposed for this novel framework. Hence, the contributions of the current study are five-fold: (i) presenting a holistic picture of the airside encompassing every component of this sector of the airport, (ii) proposing a fully functional digital twin framework in addition to the conceptual representation of the process, (iii) examining the prospective nominal capacity of the system apart from any shortcomings in flight schedules for strategic planning of facilities, (iv) providing both a 2D and 3D representation of the system for monitoring purposes, and (v) implementing the framework in a real airport to assess its performance in practice.
The rest of this paper is organized as follows: The system under study is described in Section 2. The proposed simulation method and digital twin is presented in Section 3. This section also includes the used aviation rules and assumptions. Section 4 presents the results of this study applied to an international airport as a practical case study, both for the validation phase and the optimized scenarios. In Section 5, the results are discussed using the defined performance indicators. Some concluding remarks and future research directions are provided in the last section.

2. System Description

In this section, we provide a brief description of the studied airport system. Here, first, we explore the parts and components of the airside, and then the necessary performance indicators and terms such as airport capacity, capacity of the apron area, and what is considered a delay for the visiting aircraft are defined. Table 1 lists the important symbols, notations, and abbreviations used in this paper.

2.1. Airside Components

The principal components of the airside consist of runway, taxiway system, and apron area/gates. These components are illustrated in a simplified sketch of the surveyed airside in Figure 1. In general, according to [21,22,23], the airside system may be divided into the following seven main parts that will all be considered in our digital twin:
(1)
Holding stack: Holding (or flying a hold), in aviation, is a maneuver designed to delay an aircraft already in flight while keeping it within a specified airspace. A standard holding pattern can be seen in Figure 1.
(2)
Approach gate: It is an entry part beyond which the pilot cannot alter speed and direction (without a command or permission from the control tower).
(3)
Glide path: it is where all aircraft are sequenced individually under rules of minimum distance separation.
(4)
Final approach: A zone on the approach and in a specified distance from the runway threshold. Once an aircraft enters this zone on its landing operation, no other airplanes are allowed to enter the runway from the departure queue. In other words, despite the runway being empty, it is considered to be locked/occupied by the landing airplane until after its landing operation is complete.
(5)
Runway: A runway is a “distinct rectangular area on a land aerodrome prepared for the landing and takeoff of aircraft” [21]. Runways may be a man-made surface (often asphalt, concrete, or a mixture of both) or a natural one (grass, dirt, gravel, ice, or salt). As a dominant rule in this industry, each runway may be occupied only by one aircraft at a time.
(6)
Taxiway: A walkway made by asphalt, concrete, gravel, or grass that links the runways to the terminals, ramps, and other airport infrastructure assets [24]. Design of this part of the airport and proper management of the taxiways significantly influence the overall capacity of the runway [15,16,25,26].
(7)
Apron: This area is where aircraft are parked. It also hosts multiple operations such as unloading, loading, etc. [27,28] In order to facilitate cooperation amongst users, an apron management service or advisory may exert control over the apron [28,29].

2.2. Airport Capacity

In an airport, the term capacity is the physical capability of the airport system to handle and accommodate multiple or mixed operations (arriving and departing of aircraft) for a specific period of time. This performance indicator also includes the ability to accommodate passengers on the landside [21,22,30]. Airport capacity estimations and analyses are generally performed separately for its landside and airside segments. The airport’s landside includes the terminal buildings in order to provide various services to passengers and ground access systems. Airside facilities, on the other hand, consist of the runways, taxiways, apron area, and the parking positions. Although the runway is the most important component in many airport systems to handle the mixed operations (i.e., landing and takeoff), there are also other factors that affect the ability of airports to carry out activities. These factors include weather conditions, air traffic control, specifications and condition of taxiway systems, apron area, and gate facilities [31].

2.3. Apron Capacity

The capacity of the apron area can be defined as the ability to accept and serve aircraft during a specified interval of time. Different factors may affect the gate/apron capacity—e.g., the number and type of stands, gate occupancy time for various aircraft (i.e., the mix of aircraft types), and the strategies and restrictions in place for apron gates [21,22].

2.4. Delay

In the airfield, delays and congestion happen when the demand is greater than the capacity. Based on the existing studies in air traffic flow management (ATFM), the delays that occur at the airport can be divided into two main categories: (i) airborne delays and (ii) ground delays [32,33,34]. There are intricate relationships among these delays, and a few studies looked at the possibility of transforming airborne delays into their ground counterparts (e.g., [34]). Arriving aircraft might also be delayed, ensuring the completion of the departure operation for another plane. For more details on airport delays, one may refer to [32,33]. Our proposed digital twin incorporates all of these delays and their interactions so as to provide a more comprehensive viewpoint of the airside system.

3. Simulation-Based Digital Twin

The proposed simulation model covers all aforementioned components of the airside, from holding stacks and common glide path to runway, taxiway, apron area, and parking positions. The model also supports arrival and departure queues, mixed operations, and the safety rules used by the control tower to guarantee the minimum time separation for the safety of these operations in a space-time framework. In this section, we illustrate all aspects of the simulation-based digital twin and declare the inherent rules and assumptions in modeling such systems. Then, we propose a comprehensive discrete event simulation model and explain different steps of the aircraft’s journey in the digital model to demonstrate the level of similarity between the real system and the twin.

3.1. Attributes of the Aircraft

The characteristics of the aircraft, as the main entity in this system, are among the most influential inputs to any digital twin in the aviation industry [35]. The separation rules of the Federal Aviation Administration (FAA) of the United States categorize aircraft as heavy, large, medium, and small, depending on their maximum takeoff weights [21,22,30]. These rules declare the minimum separation space rule required between aircraft in vertical, longitudinal, and lateral directions. This space depends on the aircraft type, speed, availability of radar facilities, navigational aids, and a few other factors such as the severity of wake vortices [21]. These separations are given in Table 2—both in the visual flight rule (VFR) and for the instrumental flight rule (IFR). For further information on the calculation basis of these values for each of these aircraft combinations, one may refer to [21,22,31].

3.2. Control Tower Rules and Modeling Assumptions

We aggregate the fundamental decision rules and theoretical assumptions from the literature (refer to [21,22,23,30,31]) with the findings of our field study in several international airports to provide a comprehensive and accurate analysis of landing and takeoff activities. The following assumptions and rules are considered in this paper:
  • The system operates 24 h a day and 365 days a year.
  • Landing events have preemption over departure operations. For all other cases (arrival–arrival or departure–departure events), only a FIFO (first-in, first-out) sequencing strategy is put in place with no preemptions.
  • Only one runway is in operation, and at any point in time, one aircraft can occupy the runway.
  • A departure operation may not be initiated if the subsequent arrival is less than a specified distance from the runway threshold, usually 2 nautical miles (NMI) in IFR conditions.
  • Successive departures are spaced at a minimum time separation equal to their departure service time from Table 2. As an assumption, the freedom of the tower controller to reorder the immediate parts of the departure sequence is disregarded.
  • To estimate the arrival–arrival minimum time separation over the approach path (i.e., M T S ) for each pair i , j of leading aircraft i and trailing aircraft j , the following rule from [21] is applied:
    M T S i j = max δ ij V i + φ δ ij · max 1 V i 1 V j , 0 , RO T i   + Buffer   Time ,
    where δ i j is the minimum permissible distance separation between the two arriving aircraft anywhere along the common glide path from Table 2, φ is the length of the common approach path, and R O T i is the runway occupancy time of the leading aircraft. The relatively short buffer time in this formula acts as a safety period applied by the control tower based on their expertise and the airport conditions. The speeds of leading and trailing planes are also symbolized by V i and V j , respectively.
  • All planes that enter the airport have a two-way visit with a departure already scheduled for them, and no aircraft is expected to stay at the airport indefinitely.

3.3. Simulation Modeling

The simulation model is developed using the discrete event method in Enterprise Dynamics™ (ED) software (version 9), which was proven to possess the versatility and reliability necessary to produce a model of sufficient detail and sensitivity, while offering acceptable 3D features for industry presentation [36,37,38,39,40,41]. The simulation starts with the main entities (i.e., aircraft) entering the holding stack. Once the control tower grants an aircraft permission to exit the stack, it heads to the approach zone and glides to the dedicated runway. Here, it is the responsibility of the model’s control tower to maintain the required distance between aircraft by holding the planes in the stack sufficiently. After completing the landing procedure on the runway, the aircraft enters the apron area through a given taxiway. Subsequently, apron operations (unboarding, unloading, refueling, loading, and boarding) are performed on the airplane.
As we assume that the airplanes that enter the airport do not stay there permanently, the apron operations for each plane should be followed by a departure request. After receiving the departure permission, the plane takes a prescribed taxiway and runway for their takeoff operation and leaves the system. Here, as explained earlier, if the runway is occupied (or locked for another landing plane), the plane has to queue in the taxiway for the final permission to use the runway. This process and the corresponding sequence of events are summarized in Figure 2.
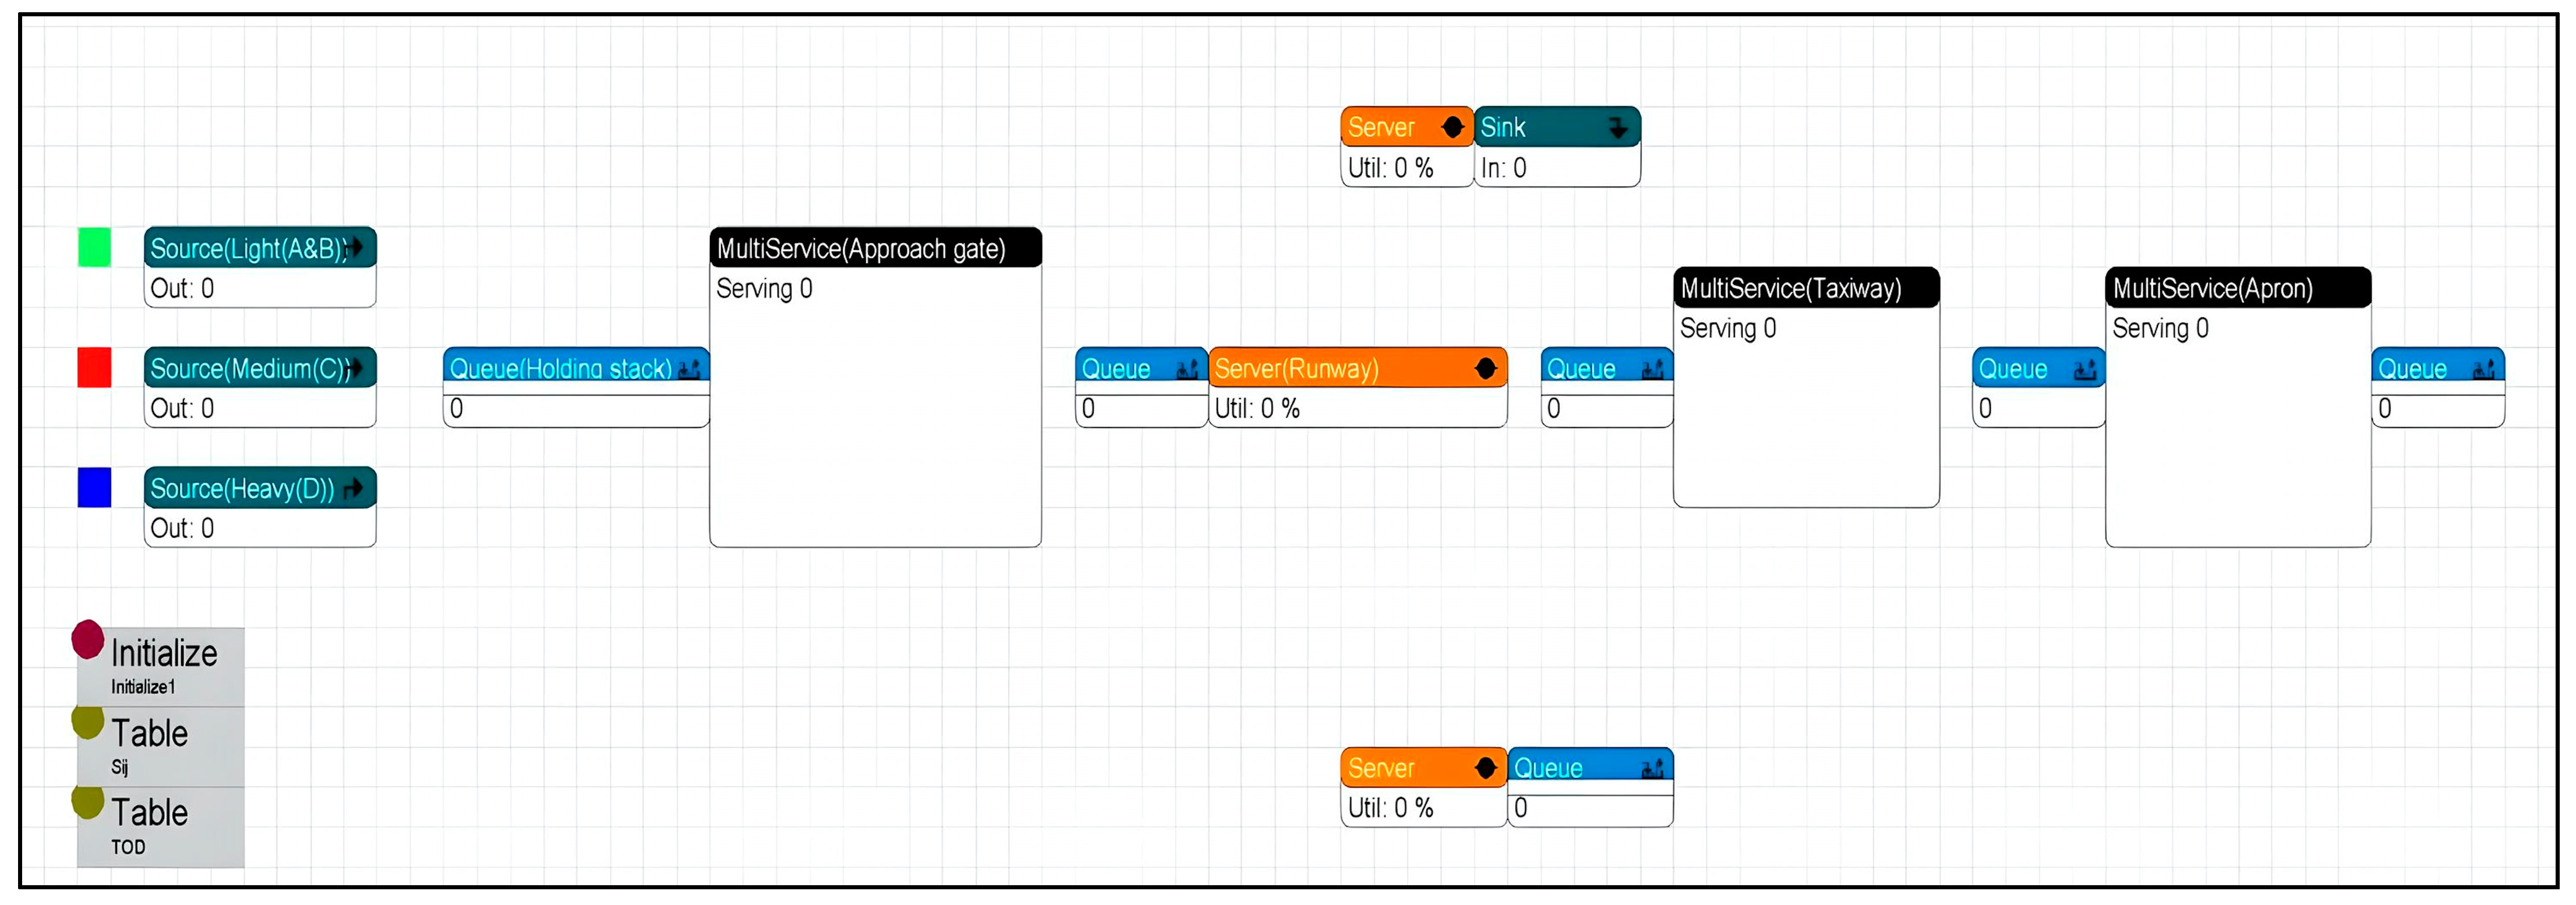
The core of the proposed model can be found in the 2D layout of the digital twin presented in Figure 3. For the three aircraft sizes considered in this system, we utilize three distinct “Source” atoms (i.e., objects) that help model the inter-arrival time of each individual type of aircraft conveniently. A “Queue” atom models the holding stack simultaneous operations. In this model, three unique “Multiservice” atoms represent the approach gate, taxiway, and apron operations. Furthermore, to model the single runway assumed in this paper, we use a “Server” atom. The service time of this server and the mentioned multiservice atoms depend on the type of aircraft. The capacity of the multiservice object is fully adjustable, which empowers this model to flexibly adopt the specifications of the real system. Another advantage of the used objects is their capability to implement the possible failures in the system (one may refer to [36,37,39] for further information about this feature).
According to our problem definition and the process sequence demonstrated in Figure 2, the apron is visited only once by each aircraft, while the taxiways and runway are expected to be used twice: once in the landing process and another time on or before the departure operations. Here, a few atoms together emulate the role of the control tower in regulating the takeoff operations in this digital twin. A “Server” and a “Queue” (placed in the bottom part of the model in Figure 3) manage the outgoing flights and lock the runway in case an incoming flight is about to land. Departure flights leave the system through a “Sink” atom (shown by a teal object in the top part of the layout). Another duty of the control tower is performed by the “Server” atom preceding this sink, which imposes the required departure–departure distance rules between successive outgoing flights.
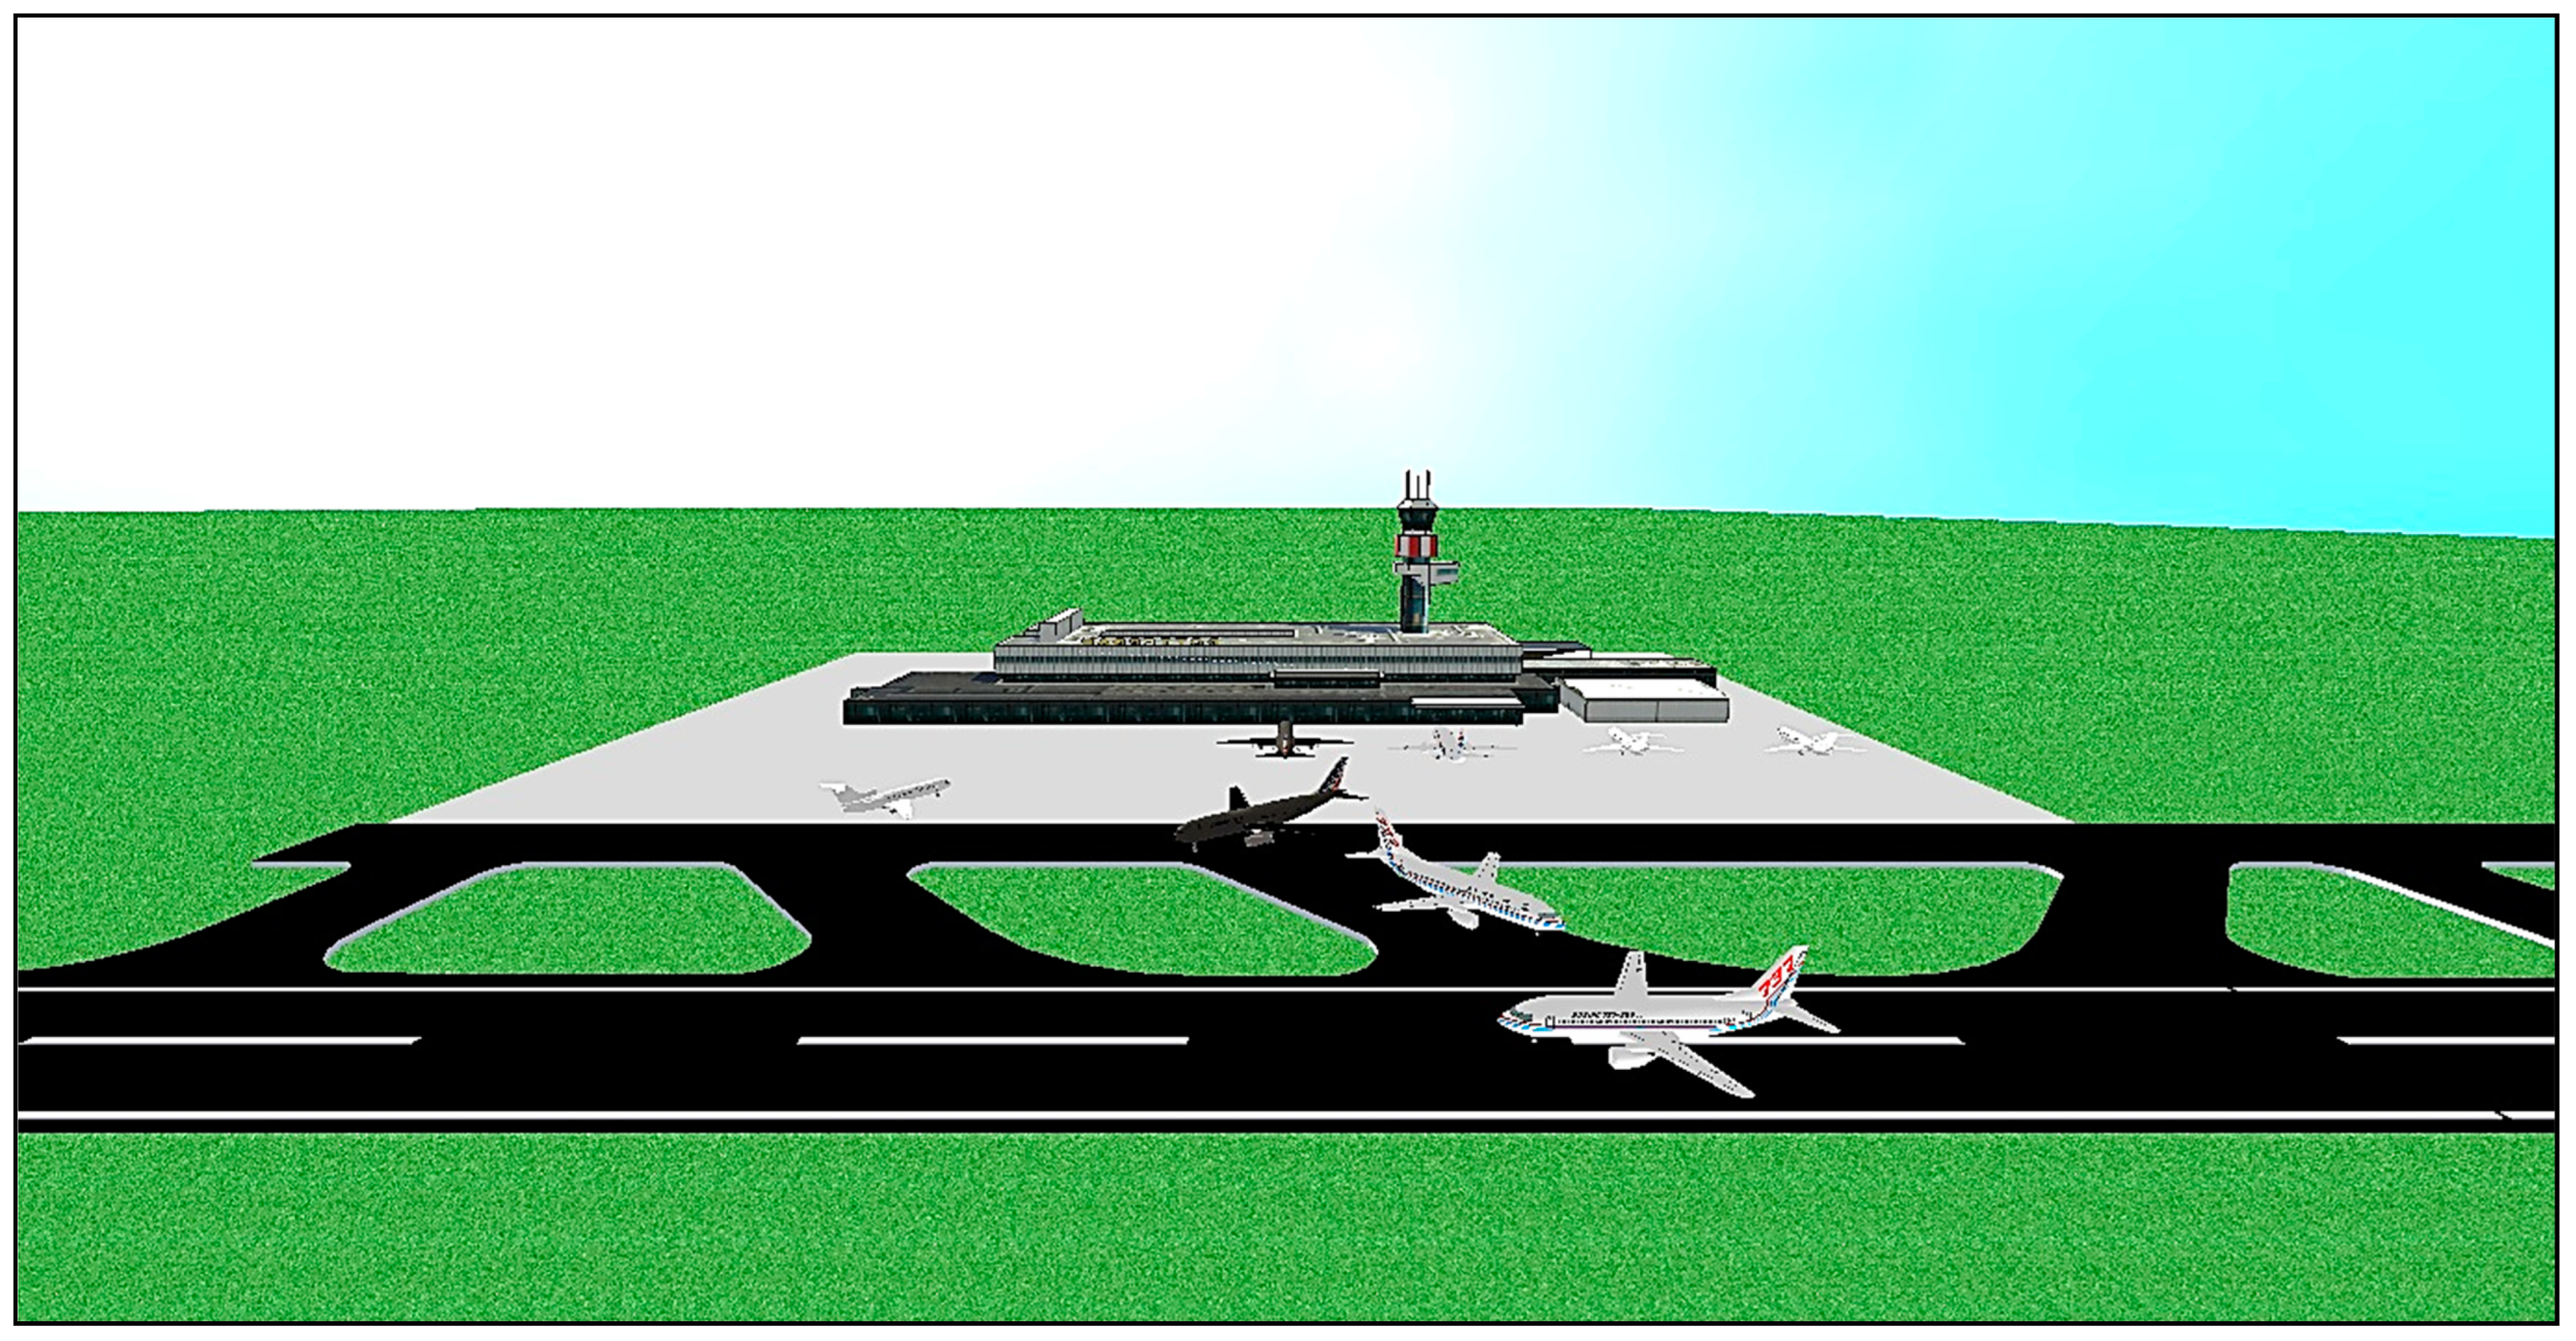
In addition to the presented 2D layout of the model, a 3D animated view is designed for the proposed digital twin, which graphically illustrates the sequence of operations. This feature enhances the ease of interpreting the results and behavior of our twin, enabling real-time system monitoring or focused observation of specific details from desired angles. Figure 4 depicts an example snapshot of the mentioned 3D with multiple planes using the airside.

4. Implementation in an International Airport

In this section, we explain the implementation of the proposed digital twin in an international airport in Iran with one operating runway. In order for the proposed framework to be used as a decision support tool for this airport, the first step is collecting data from the existing state of the system. Based on our survey of historical data in this airport and by consulting the staff and engineers of the airport, we consider the following specifications for this case:
  • The common approach/glide path of this airport is 15 km in length, and the safety buffer time is 20 s.
  • Based on the observed restriction on the operational teams, apron capacity is assumed to be independent of the type of aircraft. Apron capacity is 5 aircraft, and it is also independent of their type.
  • Due to the prevailing weather conditions in the area where the airport is located, runway processes of both arrivals and departures are under the IFR conditions.
  • Equipment and aircraft maintenance operations are assumed to be completely effective. Thus, no failure is expected during the analysis horizon.
  • Changes in the direction and magnitude of wind are disregarded, i.e., the arrival and departure operations are performed in one direction only.
The used simulation software offers a wide range of options available in the “Experiment Wizard” for collecting results from the digital twin. For this study, the observation is replicated 20 times, each for a period of 365 days. Here, to capture the performance of the system in a more realistic and steadier situation, the first 60 days of each observation are considered as a warm-up period. The logged key performance indicators (KPIs) are: (i) the number of airplanes served from each type and (ii) the average waiting time of each aircraft type for permissions in different stages (e.g., in holding stack and the departure waiting times). Inadequate or biased data may result in untrustworthy simulations, and the exactitude of the digital twin is contingent upon the quality and comprehensiveness of the supplied data. Therefore, as a fundamental phase of the implementation, the data gathering over the initial three months of our engagement with this airport involves conducting 15 interviews and meetings with the airport personnel and management, as well as dedicating 20 h to exclusive observations and collaboration with the control tower team. This helped us comprehend the natural behavior and decision-making routines of this airport. Furthermore, there was continuous and ongoing cooperation with a key consultant of the airport throughout the project.
In order to gather the validation data from the system’s steady and normal operation, we utilized the performance data of a one-year period prior to the onset of the COVID-19 outbreak in 2019. That was to mitigate any prejudiced findings arising from the impact of COVID-related lockdowns on the aviation sector reported by other studies such as Suau-Sanchez et al. [42]. Using the mentioned records, we obtained the required data for estimating the following parameters: (i) the aircraft approach speed (in meters per second), (ii) occupancy time of the runway both in landing and takeoff (in seconds), (iii) taxiway occupancy time (TOT) in seconds, (iv) time between arrivals to the holding stack (TBAH) (in hours), and (v) gate (apron) occupancy time (AOT) in seconds.
For each of these parameters, the data is examined statistically to identify the best statistical distribution. These goodness-of-fit tests were performed on more than 150 random samples derived from the data, and the best-fit distributions were identified with a 95% confidence interval. Figure 5 demonstrates this test for the landing ROT of aircraft type C, for which the 200 data points randomly fall around (and close to) the fitted normal distribution line. As seen in this figure, the chosen distribution type (here, normal) fits the data with a very high p-value (>0.250) and the Anderson–Darling (AD) values of 0.780, which indicate no significant type-I error for this fit. The estimated mean and standard deviation of this parameter are approximately 60 and 8 s, respectively.
Likewise, by applying the goodness of fit test on the data for all parameters, we observed that, with a 5% significance level, the approach speed, landing and departure ROT, and the AOT values statistically employ the normal distribution, whilst the TBAH of A&B, C, and D aircraft types followed Weibull, lognormal, and gamma distributions, respectively. The results of these fit tests and the estimated distribution and their associated parameters are presented in Table 3. As a next step of implementing this framework in this airport, we run the twin for one year to see if its performance and KPIs in this state comply with the available records of served aircraft by the real system. This step ensures that the simulation model is an accurate representation of the system and can be used as a digital decision support tool. We ran the model for a few replications and then presented the results to our industry experts, consulting about the level of similarity between our model’s behavior with that of the real system. We also asked the experts to observe the 2D and 3D of the twin to confirm that the recognized logics and sequencing rules for the visiting aircraft are reasonable and realistic. The satisfactory feedback received from the experts in this stage encouraged us to further examine the model by applying a statistical hypothesis testing method.
For this purpose, a one-sample Wilcoxon nonparametric hypothesis test is applied on the known nominal capacity of the system for small and medium (A&B), large (C), and heavy (D) planes compared with the results of our model with a 95% confidence interval. Table 4 presents the results of the aforementioned hypothesis tests based on a 25-run sample of the simulation model under peak conditions where there were no restrictions on aircraft arrivals. From the calculated p-values of 0.421, 0.548, 0.574, and 0.830 for the hypothesis tests, it is perceived that these tests could not detect any significant deviation between the real system data and the capacity values estimated by our digital twin. Consequently, one can conclude that the model is properly tuned and may be used for analyzing the desired managerial decisions for this airport. The input parameters can be modified to evaluate hypothetical “What-if” scenarios, forecast the system outputs, and predict the potential enhancements or repercussions that any ideas for changes in the airside of this airport would have in the future.

5. Scenario Analysis and Discussion

In this section, we utilize the validated twin from the last section to investigate the possible improvement scenarios and predict the future outcomes of such modifications. In general, scenario definition is a prevision manner where the present data are used to develop different feasible, often alternative future scenarios. In our preliminary analysis of this digital twin, we observed that the time spent from the end of the runway until after the apron operations is excessively long, and the queue upstream the apron multiservice was accumulating inventory in the performed simulation runs. This initiated the idea of probable improvements in this part of the model.
Mathematical models are typically employed in theoretical optimization studies to determine the optimal system settings. Nevertheless, the number of viable solutions and the number of possible setting combinations are exceedingly restricted in numerous real-world scenarios. In other words, the mathematically optimal solutions mentioned above may not be feasible to implement, despite their theoretical appeal. This has led to the introduction of scenario-based analysis approaches in industrial real case studies [43]. Such an alternative approach, with the help of experts, tries to define and analyze the fully doable scenarios only, which saves time and leads to significant acceptability levels from industrial partners. The system under study is very complex, and it is regulated by the aviation rules from different aspects. All these characteristics make the possible modifications quite confined; therefore, we take the scenario-based approach for the improvement phase of this case study.
In order to identify the usable scenarios, we needed to pinpoint the possible amendments that would be considered reasonable and applicable by the airport managers and experts. Sharing our initial observations with the consultants led to the identification of a few doable scenarios for this case:
Scenario I:Adding another apron operating team to reduce their cycle times in loading and unloading, boarding and unboarding the passengers, stoking, inspecting, and other routine tasks.
Scenario II:Adding two operational locations (i.e., gates) in the apron.
Scenario III:Considering both workarounds from scenarios I and II simultaneously.
As mentioned earlier, these scenarios are targeting the identified issue after the runway, which was preventing the system from flushing the runway and taxiways. The experts consulted in this study expected that the action suggested in scenario I could reduce the gate occupancy time of this airport from its current state by about 5 min for each type of aircraft. The second scenario, on the other hand, was nominated by the airport managers as a low-cost feasible solution for system extension, as preparing these new gates for operation only required some minimal maintenance and spot repairs in the apron area with no significant change in the overall variable cost of the airside.
After defining the scenarios, we use the digital twin to predict their effect on the identified KPIs of the system. Here, we set these suggested settings in the digital twin and run the experiments to collect the annual throughput and aircraft waiting time (AWT) of the system. To have an even more reliable understanding of the system’s expected behavior, we collect the results of 20 independent observations for each scenario and present their statistical summary in Table 5. In these experiments, we assume to have abundant flights of every type, so we can have a better picture of the nominal capacity of the airport regardless of the possible deficiencies in airline schedules. Furthermore, we also report the results of running the model with no alteration from the current status in this table.
In Table 5, we also present the relative improvement percentage (i.e., RI), which indicates the improvement achieved under each scenario compared to the existing state of the system. The RI values are calculated using the following formulas [37,43,44,45]:
R I k T P = T P T P k T P × 100   and   R I k A W T = A W T k A W T A W T × 100 ,
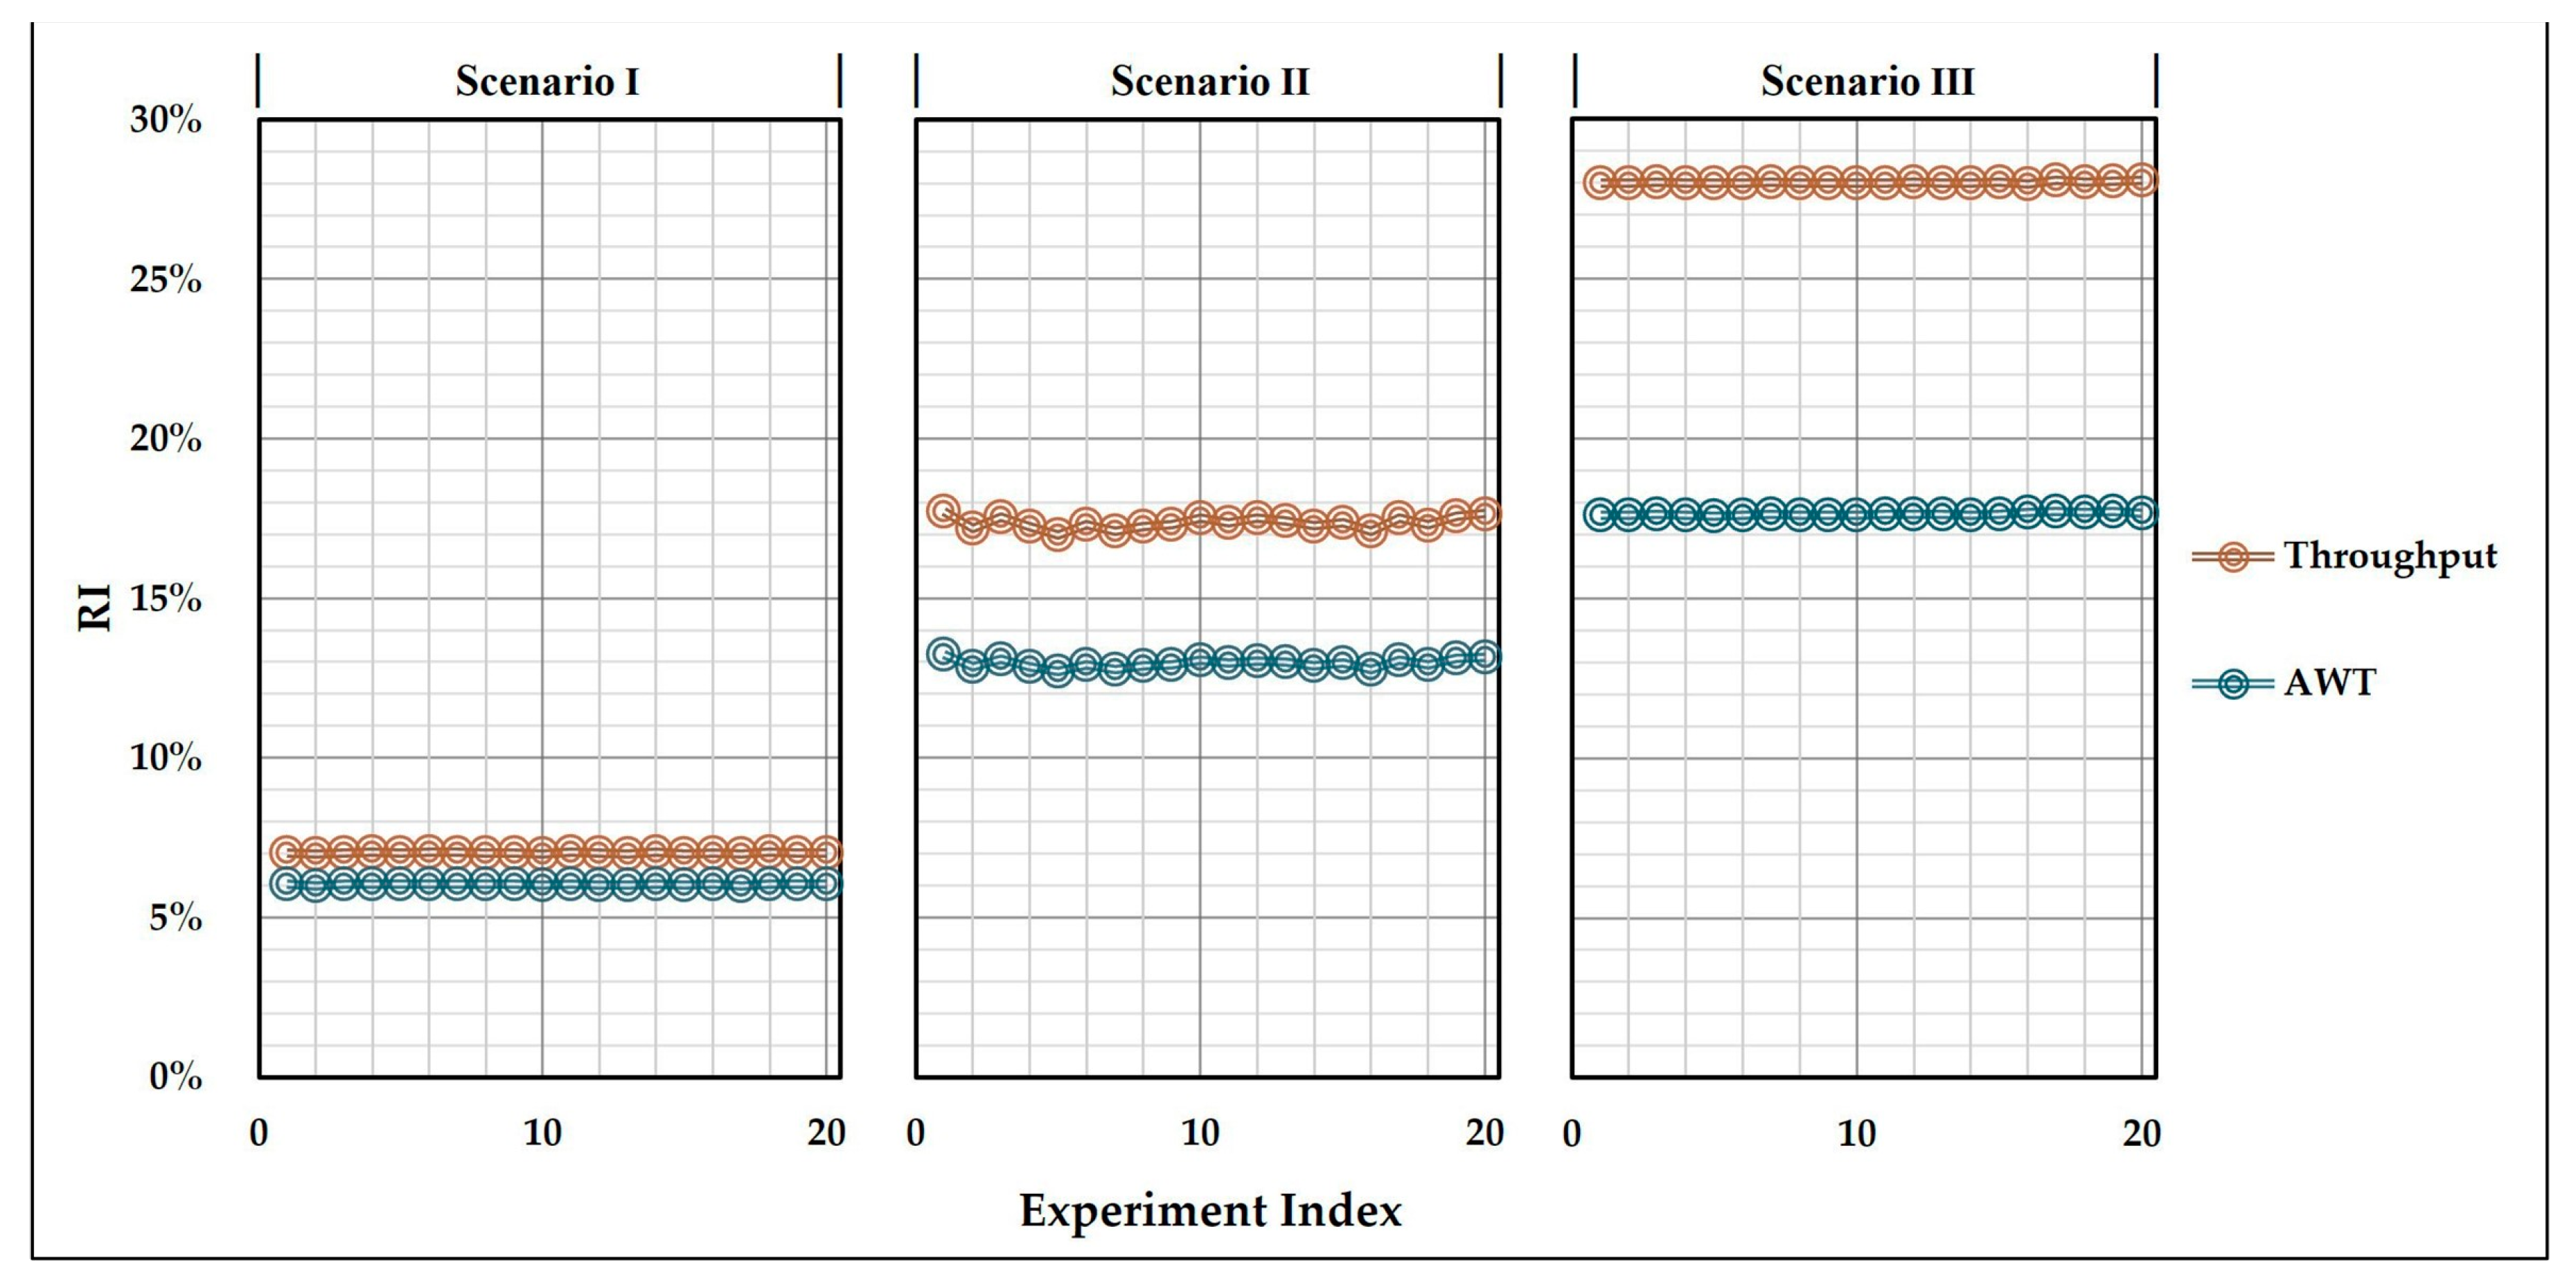
where T P k and A W T k , respectively, represent the throughput and AWT of scenario k , and the pair ( T P , A W T ) refers to the mean values of the current state. Figure 6 illustrates all experiments performed regarding these three scenarios from their RI value perspective.
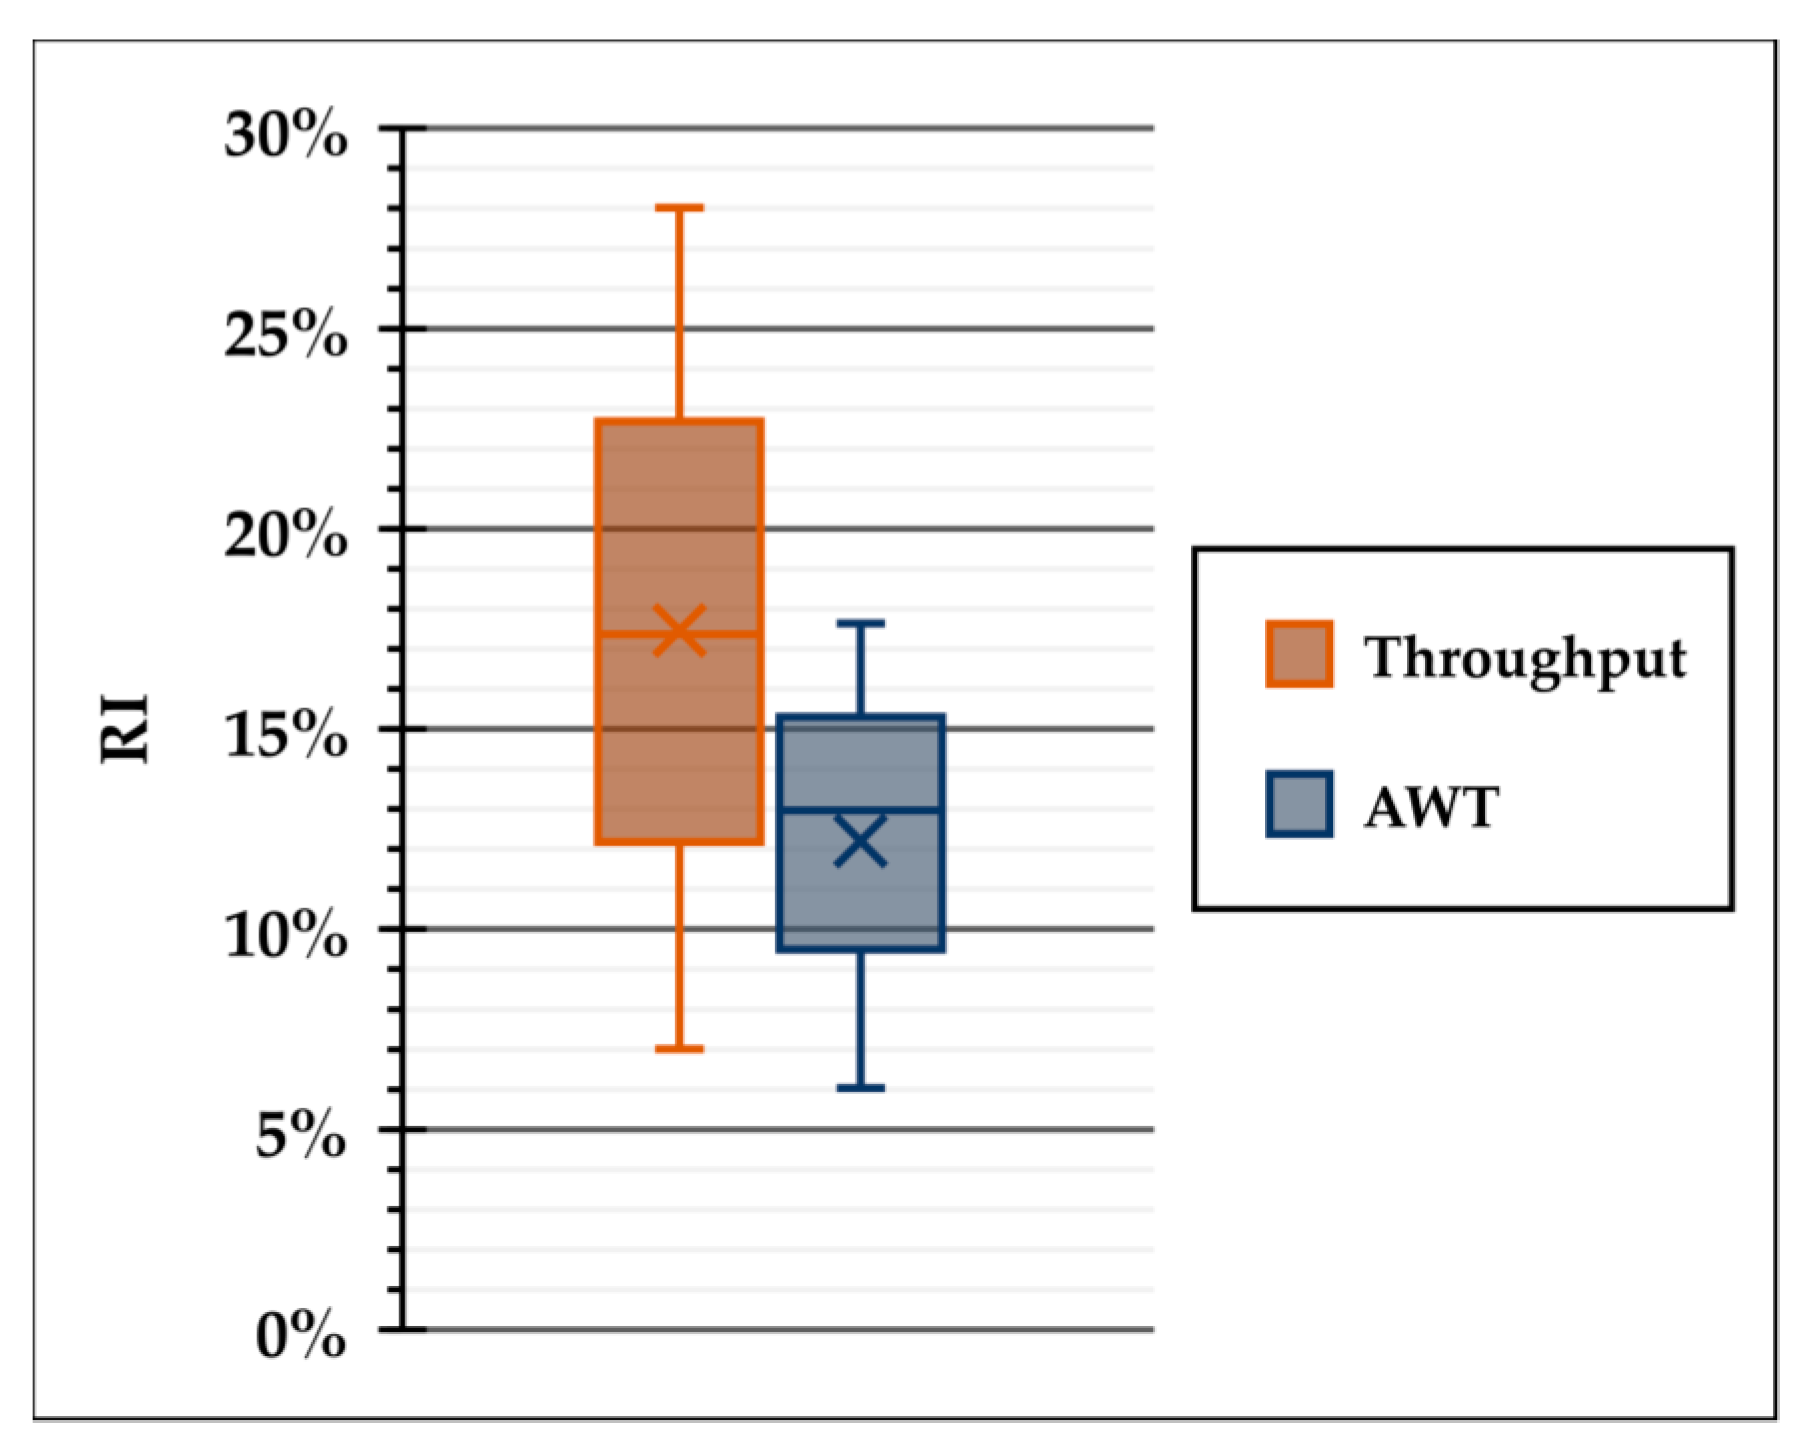
The box plot provided in Figure 7 also offers a holistic picture of the improvements achieved in these experiments regardless of their scenario index. These graphs suggest that the proposed scenarios can achieve a relative improvement between 7% and 28% in the overall throughput indicator, while the AWT was approximately reduced by 6 to 18 percent. The charts in Figure 6 highlight that scenario III outperforms the other two options from both throughput and waiting time perspectives. Moreover, it is observed that the two lines (i.e., throughput and waiting time) diverge in a stepwise manner. This means that the transition from scenario I to III affects the throughput more than it does with the AWT. Furthermore, the low deviation observed in each step of this chart and the standard deviation values reported in Table 5 both indicate that the experiments are all successfully logged in a steady situation, which means the chosen warm-up period was sufficient for this study. In Figure 8, we provide a numerical comparison of the nominal throughput and AWT estimation under the proposed scenarios with the current airport settings, along with the relevant confidence intervals, in order to see the benefits of such low standard deviation values. As shown in these graphs, the significance of the results distinction depends on the variance of the experiments for each scenario. Since the σ values for all scenarios were reasonably low, the scenarios do not overlap even in the highest confidence intervals.
These upshots encourage us to evaluate how these scenarios compare statistically. The most well-known tests for such a comparison are the analysis of variance (ANOVA) and F-test that have widely been used in different contexts (see, for instance, [37,38,46,47,48]). The ANOVA test was carried out separately for each performance measure at a significance level of α = 0.05 (i.e., confidence level of 95%). In other words, p-values less than 0.05 are considered significant, and if the F-value of a scenario exceeds the F 0.05 , the contribution of that scenario is significant. Table 6 and Table 7 present the ANOVA tables and the Tukey method grouping information for the individual performance measures of the described scenarios. For each source of ANOVA in these two tables, DF denotes the degree of freedom, SS is the sum of squares, and MS represents the mean of squares [48].
The outcome of ANOVA and the Tukey grouping method, one more time, discloses that the scenarios are statistically distinct from both aspects of throughput and average waiting time, and there is no evidence to expect them to overlap in the future. These observations indicate that with the existing constraints in this airport, the best improvement in the nominal capacity and waiting time can be realized when a new apron operation team is added to the system and, at the same time, two parking positions are added to the operative ones. Comparing scenarios I and II reveals that appending the two new apron gates brings about a significantly higher improvement in the overall capacity compared to the addition of a new apron operation team. Given that the managers have already highlighted that the second scenario is more affordable than the first one, we can conclude that scenario II completely dominates its first counterpart. Now, the choice between scenarios II and III will be a trade-off between the amount of investment and the achieved performance. That is, if the managers can market the extra capacity gained under scenario III, this scenario is recommended; otherwise, the best recommended workaround would be scenario II.
It is important to acknowledge that the proposed model and digital twin, like any other model, are not perfect. That is, with its current assumption in the case study, the digital twin may need to be further modified in order for it to be adopted by other airports with different operational contexts, infrastructure, or regulatory environments. For instance, the current model considers a single operating runway, which might not be the case in all airports. Such a change in the system definition would necessitate immediate modifications at the simulation model level. Another limitation of the studied airport was its use of IFR for all flights due to its specific geographical characteristics. This significantly affects the estimated overall capacity of the airport. Thus, any attempt to generalize the results reported in this study should involve a cautious evaluation of such restrictions in the target airport as well. On the other hand, the proposed scenario-based optimization approach can hardly cover more sophisticated optimization problems like flight scheduling. This emphasizes the need to combine the proposed framework with other optimization methods, such as metaheuristics or even machine learning, for such purposes.
Furthermore, this digital twin framework lacks a disruption mitigation mechanism. Being in the transportation industry, the reliability of such an airport might also be a concern for the managers and stakeholders. Therefore, adopting a disruption resilient approach (like the one suggested by [45]) might also be essential when implementing this framework in certain airports. These disruptions and vulnerabilities might be in the demand for airport services, or they can be in the availability of planes or other resources caused by random failures that might temporarily keep parts of the airport out of service. For this purpose, we would recommend integrating the proposed framework with a powerful disruption mitigation mechanism like the failure mode and effect analysis (FMEA) technique, which was proven to be successful in handling complex systems [45].

6. Conclusions

This study focuses on presenting a practical framework for airport capacity improvements in civil aviation. Most studies in this field of research focus on the scheduling of flights, and the nominal capacity of the physical airside facilities is widely overlooked. In this study, we utilize the power of simulation modeling to provide a digital twin for the airside that can be adopted by airport managers to predict the outcome of managerial decisions and ultimately optimize the airside system. Such a framework, in addition to its inherent competence in modeling the airport system and the arrival and departure aircraft schedules, enables facility owners to predict potential nominal capacity improvements, disregarding schedule deficiencies. This feature can provide managers with a clearer perception of their facility’s capabilities, enabling them to determine the target capacity they can market and offer to airlines.
Since we chose discrete event simulation modeling technique for this digital twin, we were able to embrace the realistic rules, regulations, and assumptions of the typical civil airports. Our framework covered all principal operations of the airside, from holding, approach gate, and glide path all the way to the taxiway, runway, and apron operations. Furthermore, as the planes visiting an airport usually depart the facility, the necessary operations for the takeoff are considered as well. In order to make the model more realistic, we virtually deployed all decisions and permissions made by the control tower during landing and departure tasks. These decisions include the aerial distance between successive users of the airport’s common glide path, taxiways, and runway. Here, the simulation model also has the option of adding the landing and departure safety time buffers that are commonly considered in international airports.
Targeting international airport systems, the proposed digital twin supports a mixture of arriving and departing planes of various sizes and weights. To bring the twin closer to the real system, our virtual control tower decisions are tailored based on the specifications of the airplane (e.g., speed, size, and maximum weight) using the existing standards and regulations in the aviation industry. The calculations also take into account the different combinations of leading and trailing aircraft that may exist in the common approach path, along with the possibility of having a landing flight use the same runway immediately after the departure of another plane. All these features make the proposed framework a proper representation of the airside for analysis purposes.
This framework was implemented in an international airport to assess the validity of the twin in practice. Some statistical tests were performed, and the management of the airport was consulted about the performance of our twin. The positive feedback received from the experts, together with the exceptional test results reported for this airport, confirmed the usability of this framework in real airport systems. One of the major advantages of such a twin is the possibility of predicting the outcome of managerial decisions for such a complex system. Thus, as an extra step in this research, we compiled any possible changes in the settings to enhance the airport KPIs, forming a list of modification scenarios. These scenarios were all defined by close consultation of the airport experts and managers to guarantee the acceptability and application of the outcome. The investigated scenarios offered an increase of up to 28% in the overall nominal capacity, while reducing the average delay of aircraft by up to 18%.
Given the significant similarities between international airports around the world, we anticipate that the proposed framework will be easily adaptable to match the characteristics of other airports. Hence, as an extension avenue for this work, one may investigate the performance of the proposed digital twin approach in other case studies. Our primary performance indicators were chosen in line with the needs and preferences of the managers of the studied airport. Nonetheless, with the core of this framework being a proper discrete event simulation model, other performance measures may also be logged to satisfy the individual requirements of future projects. Another extension to the current paper may involve fatal failures both in the facilities and in airplanes, together with the corresponding downtimes in different parts of the system. An important prerequisite for such an extension attempt, however, would be a sufficient amount of data on such failure and repair events as an extra input to the model.

Author Contributions

Conceptualization, M.B. and S.R.; methodology, A.A., M.B. and S.R.; software, A.A. and M.B.; validation, A.A., M.B. and S.R.; formal analysis, A.A., M.B., S.R. and M.N.; investigation, A.A., M.B. and S.R.; resources, M.B.; data curation, A.A. and M.B.; writing—original draft preparation, A.A., M.B., S.R. and M.N.; writing—review and editing, A.A., M.B., S.R. and M.N.; visualization, A.A.; supervision, S.R. and M.N.; project administration, A.A., M.B. and S.R. All authors have read and agreed to the published version of the manuscript.

Funding

This research received no external funding.

Data Availability Statement

The original contributions presented in the study are included in the article, further inquiries can be directed to the corresponding author.

Conflicts of Interest

The authors declare no conflicts of interest.

References

  1. Qudrat-Ullah, H. Introduction: Managing Complex Tasks with Systems Thinking. In Managing Complex Tasks with Systems Thinking; Springer: Berlin, Germany, 2023; pp. 3–23. [Google Scholar]
  2. Siddique, I. Systems Engineering in Complex Systems: Challenges and Strategies for Success. Eur. J. Adv. Eng. Technol. 2022, 9, 61–66. [Google Scholar] [CrossRef]
  3. Marquez, V. Landside| Airside: Why Airports Are the Way They Are; Springer: Berlin, Germany, 2019. [Google Scholar]
  4. Skorupski, J. Airside and Landside Modelling for Determining Airport Capacity. Proc. MATH-MoD 2009, 9, 271–282. [Google Scholar]
  5. Yang, Z.; Yu, S.; Notteboom, T. Airport location in multiple airport regions (MARs): The role of land and airside accessibility. J. Transp. Geogr. 2016, 52, 98–110. [Google Scholar] [CrossRef]
  6. Di Mascio, P.; Moretti, L.; Piacitelli, M. Airport landside sustainable capacity and level of service of terminal functional subsystems. Sustainability 2020, 12, 8784. [Google Scholar] [CrossRef]
  7. Sadono, M.; Putra, D.; Harahap, S. Development of Aircraft Movement Simulation in Airport Airside Area. AVIA 2021, 2, 9–19. [Google Scholar] [CrossRef]
  8. Oliveira, P.P. Digital twin development for airport management. J. Airpt. Manag. 2020, 14, 246–259. [Google Scholar] [CrossRef]
  9. Pérez, E.; Taunton, L.; Sefair, J.A. A simulation-optimization approach to improve the allocation of security screening resources in airport terminal checkpoints. In Proceedings of the 2021 Winter Simulation Conference (WSC), Phoenix, AZ, USA, 15–17 December 2021; pp. 1–11. [Google Scholar]
  10. Scozzaro, G.; Mota, M.M.; Delahaye, D.; Mancel, C. Simulation-Optimisation-based decision support system for managing airport security resources. In Proceedings of the EUROSIM 2023, Amsterdam, The Netherlands, 3–5 July 2023. [Google Scholar]
  11. Martinez, D.; Zertuche, D.; Pérez, E. Simulation Based Strategy for Dynamic Workforce Allocation and Checkpoint Configuration in Airport Screening Facilities. In Proceedings of the IIE Annual Conference, New Orleans, LO, USA, 21–23 May 2023; pp. 1–6. [Google Scholar]
  12. Manataki, I.E.; Zografos, K.G. Assessing airport terminal performance using a system dynamics model. J. Air Transp. Manag. 2010, 16, 86–93. [Google Scholar] [CrossRef]
  13. Uyar, M.T.; Gürsel, G. Enhancing Airport Efficiency by Simulating Passenger Waiting Times. J. Appl. Eng. Agric. 2024, 1, 47–51. [Google Scholar]
  14. Chen, X.; Li, J.; Gao, Q. A simple process simulation model for strategic planning on the airside of an airport: A case study. J. Simul. 2015, 9, 64–72. [Google Scholar] [CrossRef]
  15. Özdemir, M.; Çetek, C.; Usanmaz, Ö. Airside capacity analysis and evaluation of Istanbul Ataturk airport using fast-time simulations. Anadolu Univ. J. Sci. Technol. A Appl. Sci. Eng. 2018, 19, 153–164. [Google Scholar] [CrossRef]
  16. Dönmez, K.; Aydoğan, E.; Çetek, C.; Maraş, E.E. The Impact of Taxiway System Development Stages on Runway Capacity and Delay under Demand Volatility. Aerospace 2023, 10, 6. [Google Scholar] [CrossRef]
  17. Feng, Y.; Johnson, M.E. Simulation Analyses of End-Around Taxiway Operations under Four Different Runway and Taxiway Choices. Transp. Res. Rec. 2021. [CrossRef]
  18. Lai, J.; Che, L.; Kashef, R. Bottleneck Analysis in JFK Using Discrete Event Simulation: An Airport Queuing Model. In Proceedings of the 2021 IEEE International Smart Cities Conference (ISC2), Manchester, UK, 7–10 September 2021; pp. 1–7. [Google Scholar]
  19. Zografos, K.G.; Madas, M.A. Development and demonstration of an integrated decision support system for airport performance analysis. Transp. Res. Part C Emerg. Technol. 2006, 14, 1–17. [Google Scholar] [CrossRef]
  20. Driver, C. Capacity utilisation and excess capacity: Theory, evidence, and policy. Rev. Ind. Organ. 2000, 16, 69–87. [Google Scholar] [CrossRef]
  21. Horonjeff, R.; McKelvey, F.X.; Sproule, W.J.; Young, S.B. Planning and Design of Airports, 5th ed.; McGraw-Hill: New York, NY, USA, 2010; Volume 4. [Google Scholar]
  22. Ashford, N.J.; Mumayiz, S.; Wright, P.H. Airport Engineering: Planning, Design, and Development of 21st Century Airports; John Wiley & Sons: Hoboken, NJ, USA, 2011. [Google Scholar]
  23. Ignaccolo, M. A simulation model for airport capacity and delay analysis. Transp. Plan. Technol. 2003, 26, 135–170. [Google Scholar] [CrossRef]
  24. Deng, W.; Zhang, L.; Zhou, X.; Zhou, Y.; Sun, Y.; Zhu, W.; Chen, H.; Deng, W.; Chen, H.; Zhao, H. Multi-strategy particle swarm and ant colony hybrid optimization for airport taxiway planning problem. Inf. Sci. 2022, 612, 576–593. [Google Scholar] [CrossRef]
  25. Sui, D.; Chen, H.; Zhou, T. A Conflict Resolution Strategy at a Taxiway Intersection by Combining a Monte Carlo Tree Search with Prior Knowledge. Aerospace 2023, 10, 914. [Google Scholar] [CrossRef]
  26. Jiang, Y.; Xue, Q.; Wang, Y.; Cai, M.; Zhang, H.; Li, Y. Traffic congestion mechanism in mega-airport surface. Phys. A Statist. Mech. Its Appl. 2021, 577, 125966. [Google Scholar] [CrossRef]
  27. Liu, Y.; Hu, M.; Yin, J.; Su, J.; Wang, S.; Zhao, Z. Optimization Design and Performance Evaluation of U-Shaped Area Operation Procedures in Complex Apron. Aerospace 2023, 10, 161. [Google Scholar] [CrossRef]
  28. IATA. IOSA Reference Manual for Audit Programs (IRM), 12th ed.; International Air Transport Association: Montreal, ON, Canada, 2022. [Google Scholar]
  29. Sznajderman, L.; Ramírez-Díaz, G.; Di Bernardi, C.A. Influence of the apron parking stand management policy on aircraft and ground support equipment (gse) gaseous emissions at airports. Aerospace 2021, 8, 87. [Google Scholar] [CrossRef]
  30. Dixit, A.; Jakhar, S.K. Airport capacity management: A review and bibliometric analysis. J. Air Transp. Manag. 2021, 91, 102010. [Google Scholar] [CrossRef]
  31. Young, S.; Wells, A. Airport Planning and Management, 6th ed.; McGraw Hill: New York, NY, USA, 2011. [Google Scholar]
  32. Andreeva-Mori, A.; Onji, M. Traffic-dependent Airborne Delay Buffer Optimization for Efficient Air Traffic Flow Management under Uncertainties. Trans. Jpn. Soc. Aeronaut. Space Sci. 2024, 67, 145–153. [Google Scholar] [CrossRef]
  33. Zhao, Z.; Yuan, J.; Chen, L. Air Traffic Flow Management Delay Prediction Based on Feature Extraction and an Optimization Algorithm. Aerospace 2024, 11, 168. [Google Scholar] [CrossRef]
  34. Liu, Y.; Hansen, M. Ground Delay Program decision-making using multiple criteria: A single airport case. In Proceedings of the USA/Europe Air Traffic Management Research & Development Seminar, Chicago, IL, USA, 10–13 June 2013. [Google Scholar]
  35. Laukotka, F.N.; Krause, D. Supporting digital twins for the retrofit in aviation by a model-driven data handling. Systems 2023, 11, 142. [Google Scholar] [CrossRef]
  36. Amiri, M.; Taghavifard, M.T.; Azimi, P.; Aghaei, M. Multi-Objective Model for determining Optimal Buffer Size and Redundancy-Availability Allocation Simultaneously in Manufacturing Systems. Ind. Manag. J. 2019, 11, 427–460. [Google Scholar]
  37. Attar, A.; Raissi, S.; Khalili-Damghani, K. A simulation-based optimization approach for free distributed repairable multi-state availability-redundancy allocation problems. Reliab. Eng. Syst. Saf. 2017, 157, 177–191. [Google Scholar] [CrossRef]
  38. Attar, A.; Raissi, S.; Khalili-Damghani, K. Simulation-optimization approach for a continuous-review, base-stock inventory model with general compound demands, random lead times, and lost sales. Simulation 2016, 92, 547–564. [Google Scholar] [CrossRef]
  39. Attar, A.; Raissi, S.; Khalili-Damghani, K. Multi-Objective Reliability-Redundancy Allocation for Non-Exponential Multi-State Repairable Components. In Proceedings of the 11th International Conference of Industrial Engineering, IIEC2015, Tehran, Iran, 7–8 January 2015; pp. 1–8. [Google Scholar] [CrossRef]
  40. Ghasemi, P.; Goodarzian, F.; Simic, V.; Tirkolaee, E.B. A DEA-based simulation-optimisation approach to design a resilience plasma supply chain network: A case study of the COVID-19 outbreak. Int. J. Syst. Sci. Oper. Logist. 2023, 10, 2224105. [Google Scholar] [CrossRef]
  41. Pourhassan, M.R.; Raissi, S.; Apornak, A. Modeling multi-state system reliability analysis in a power station under fatal and nonfatal shocks: A simulation approach. Int. J. Qual. Reliab. Manag. 2021, 38, 2080–2094. [Google Scholar] [CrossRef]
  42. Suau-Sanchez, P.; Voltes-Dorta, A.; Cugueró-Escofet, N. An early assessment of the impact of COVID-19 on air transport: Just another crisis or the end of aviation as we know it? J. Transp. Geogr. 2020, 86, 102749. [Google Scholar] [CrossRef]
  43. Attar, A.; Jin, Y.; Luis, M.; Zhong, S.; Sucala, V.I. Simulation-Based Analyses and Improvements of the Smart Line Management System in Canned Beverage Industry: A Case Study in Europe. In Proceedings of the 2023 Winter Simulation Conference (WSC), San Antonio, TX, USA, 10–13 December 2023; pp. 2124–2135. [Google Scholar] [CrossRef]
  44. Attar, A.; Raissi, S.; Tohidi, H.; Feizollahi, M.J. A Novel Perspective on Reliable System Design With Erlang Failures and Realistic Constraints for Incomplete Switching Mechanisms. IEEE Access 2023, 11, 51900–51914. [Google Scholar] [CrossRef]
  45. Attar, A.; Irawan, C.A.; Akbari, A.A.; Zhong, S.; Luis, M. Multi-disruption resilient hub location–allocation network design for less-than-truckload logistics. Transp. Res. Part A Policy Pract. 2024, 190, 104260. [Google Scholar] [CrossRef]
  46. Jerbi, A.; Ammar, A.; Krid, M.; Salah, B. Performance optimization of a flexible manufacturing system using simulation: The Taguchi method versus OptQuest. Simulation 2019, 95, 1085–1096. [Google Scholar] [CrossRef]
  47. Hussain, M.S.; Ali, M. Multi-agent-based dynamic scheduling of flexible manufacturing systems with routing flexibility. In Smart Systems; CRC Press: Boca Raton, FL, USA, 2024; pp. 212–229. [Google Scholar]
  48. Megdouli, K.; Gholizadeh, T.; Tashtoush, B.; Cinnella, P.; Skorek-Osikowska, A. Optimization of carbon dioxide ejector expansion transcritical refrigeration system with ANOVA and NSGA-II. Int. J. Refrig. 2024, 158, 173–189. [Google Scholar] [CrossRef]
Figure 1. A schematic sketch of airside components along with a graph of landing separation distance calculation in the common glide path. Here, V i and V j denote the aircraft approach speed, T i j is the minimum time separation at the entry gate, and δ i j is the minimum admissible distance separation for two arriving aircraft, i.e., a leading aircraft i (red line) and a following aircraft j (green line).
Systems 12 00394 g001
Figure 2. A schematic view of the main processes and events’ sequence in an airside of a typical civil airport with both landing and departure flights.
Systems 12 00394 g002
Figure 3. A snapshot of the 2D layout of the proposed simulation model of the studied system developed in Enterprise Dynamics software.
Systems 12 00394 g003
Figure 4. A glance at our 3D digital twin designed in ED software for the airside system.
Systems 12 00394 g004
Figure 5. Normal distribution goodness of fit plot for landing ROT of aircraft type C.
Systems 12 00394 g005
Figure 6. The achieved RI in the experiments performed for the three scenarios.
Systems 12 00394 g006
Figure 7. The aggregated box plot of the achieved relative improvements (RIs) in all carried out experiments for the investigated KPIs.
Systems 12 00394 g007
Figure 8. Comparison of the KPIs of the proposed scenarios with the current state of the airport.
Systems 12 00394 g008
Table 1. Notations and symbols.
SymbolDescriptionSymbolDescription
φ Length of the common approach path, R O T i Runway occupancy time of aircraft i ,
δ i j Minimum permissible distance separation between two arriving aircraft (leading aircraft i and trailing aircraft j) anywhere along the common glide path, M T S i j Minimum time separation between leading aircraft i and trailing aircraft j ,
T B A H i Time between arrival to holding stack for aircraft i ,
V i Approach speed of the leading aircraft i , A O T i Apron occupancy time of aircraft i ,
V j Approach speed of the trailing aircraft j , T O T i Taxiway occupancy time of aircraft i ,
μ Mean of normal distribution, β Scale parameter of the distribution,
σ Std. deviation of Normal distribution, θ Threshold parameter of the distribution,
α Shape parameter of the distribution, γ Location parameter of the distribution.
Table 2. Minimum separation rule for consecutive arrivals and departures in VFR and IFR circumstances [21,22,31].
SequenceTrailing Aircraft Type
Arrival–Arrival
(Nautical Miles)
Departure–Departure
(Seconds)
Maximum
Takeoff Weight (in Tons)
Leading
Aircraft Type
DCA&B DCA&B
IFRVFRIFRVFRIFRVFR IFRVFRIFRVFRIFRVFR
>300000Heavy (D)42.753.664.5 12090120120120120
[12500, 300000]Large (C)31.931.942.7 606060606050
<12500Small and
Medium (A&B)
31.931.931.9 605060456035
Table 3. Statistical distributions and the relevant fit test results for the input parameters in the chosen airport.
ParameterAircraft Type
A & BCD
DistributionFit Results
(p-Value|AD **)
DistributionFit Results
(p-Value|AD)
DistributionFit Results
(p-Value|AD)
Approach
Speed (m/s)
N (52, 3) *0.175 | 1.52N (68, 5)>0.250 | 0.66N (75, 7)>0.250 | 1.18
Landing
ROT (s)
N (54, 10)>0.250 | 0.55N (60, 8)>0.250 | 0.78N (65, 5)0130 | 1.73
Departure
ROT (s)
N (55, 3)>0.250 | 1.03N (49, 5)0.130 | 1.73N (43, 7)0.240 | 1.28
TOT (s)N (200, 12)0.133 | 1.71N (180, 13)>0.250 | 0.41N (173, 10)>0.250 | 0.66
TBAH (h)W (24.07, 0.7, 0)0.207 | 1.40LN (3.91, 413, 0)>0.250 | 0.51G (11.40, 1.20, 0)>0.250 | 0.70
AOT (s)N (2700, 80)>0.250 | 0.88N (3300, 95)>0.250 | 0.83N (4000, 122)0.118 | 1.81
* N μ , σ : normal distribution; W α , β , θ : Weibull distribution; L N γ , β , θ : lognormal distribution; G α , β ,   θ : gamma distribution. ** Anderson–Darling statistic.
Table 4. Airport throughput comparison between the historical input data of the real system performance and the proposed simulation digital twin using statistical methods.
Service CapacityAircraft Types
Small and Medium (A&B)Large (C)Heavy (D)All Types
Real System728448415346746
Estimated by Digital Twin *
Average726.084482.561537.126745.76
Std. Dev.21.3523.8423.4226.33
p-value (Wilcoxon hypothesis test)0.4210.5480.5740.830
* Based on a 25-run sample.
Table 5. Summary of the KPIs obtained by the proposed simulation model under the improved scenarios.
StatisticsCurrent StatusScenario IScenario IIScenario III
Throughput *AWT (s)ThroughputAWT (s)ThroughputAWT (s)ThroughputAWT (s)
Mean156,0124112.00166,9553864.15183,0903579.25199,7193386.80
Median156,0144112.00166,9583864.00183,0463580.00199,7113387.00
Std. Dev.41.581.0836.670.93299.685.6648.611.74
Mean RI7.01%6.03%17.36%12.96%28.02%17.64%
* Floored to the nearest integer.
Table 6. Results of one-way ANOVA and the Tukey grouping method for comparing the existing status with the three proposed scenarios from the throughput aspect.
ANOVASourceDFSSMSFP
Scenarios321,868,471,8747,289,490,625306,133.740.000
Error761,809,67123811--
Total7921,870,281,545---
Summary of StatisticsS = 154.3R-Sq = 99.99%R-Sq(adj) = 99.99%
Tukey
Grouping
ScenarioNMean*Group**Pooled St. Dev.
Scenario III20199,720A154
Scenario II20183,090B
Scenario I20166,955C
Current20156,012D
* Sorted in descending order. ** Scenarios that do not share a letter are significantly different.
Table 7. Results of one-way ANOVA and the Tukey grouping method for comparing the existing status with the three proposed scenarios from the waiting time aspect.
ANOVASourceDFSSMSFP
Scenarios 36,086,176 2,028,725 218,544.480.000
Error76705 9--
Total796,086,882---
Summary of StatisticsS = 3.047 R-Sq = 99.99%R-Sq(adj) = 99.99%
Tukey
Grouping
ScenarioNMean*Group**Pooled St. Dev.
Scenario III203,386.80D3.05
Scenario II203,579.25C
Scenario I203,864.15B
Current204,112.00A
* Sorted in ascending order. ** Scenarios that do not share a letter are significantly different.
Disclaimer/Publisher’s Note: The statements, opinions and data contained in all publications are solely those of the individual author(s) and contributor(s) and not of MDPI and/or the editor(s). MDPI and/or the editor(s) disclaim responsibility for any injury to people or property resulting from any ideas, methods, instructions or products referred to in the content.