
A Study on the Key Factors for the Sustainable Development of Shared Mobility Based on TDM Theory: The Case Study from China


Abstract
:1. Introduction
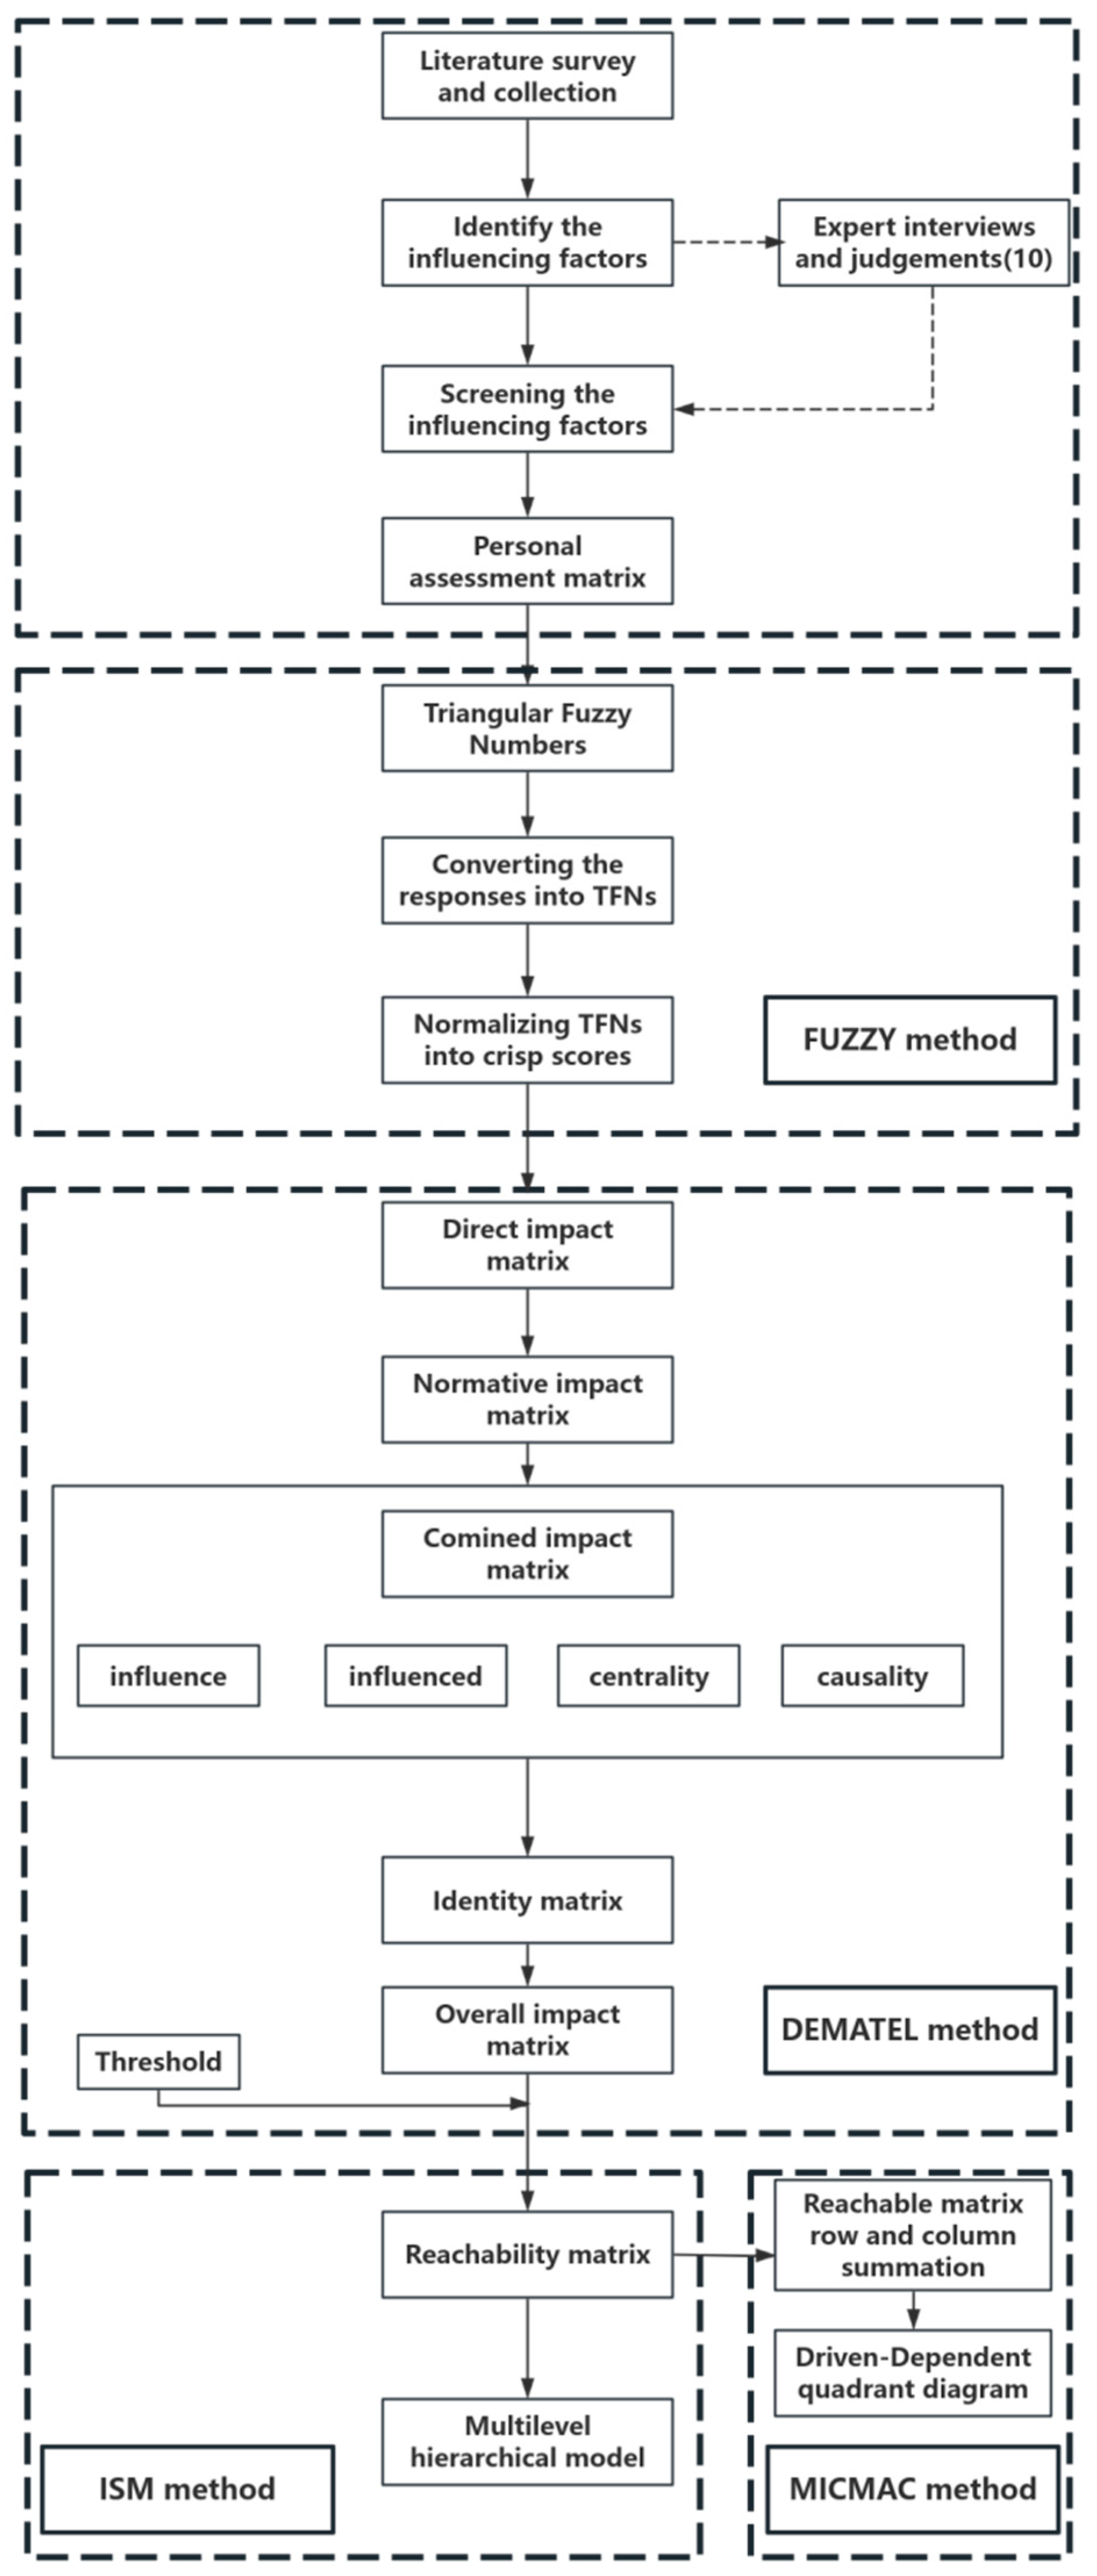
2. Research Methods
2.1. Triangular Fuzzy Numbers
2.2. DEMATEL
2.3. ISM
2.4. MICMAC
3. Factors Affecting the Sustainable Development of Shared Mobility
4. Results
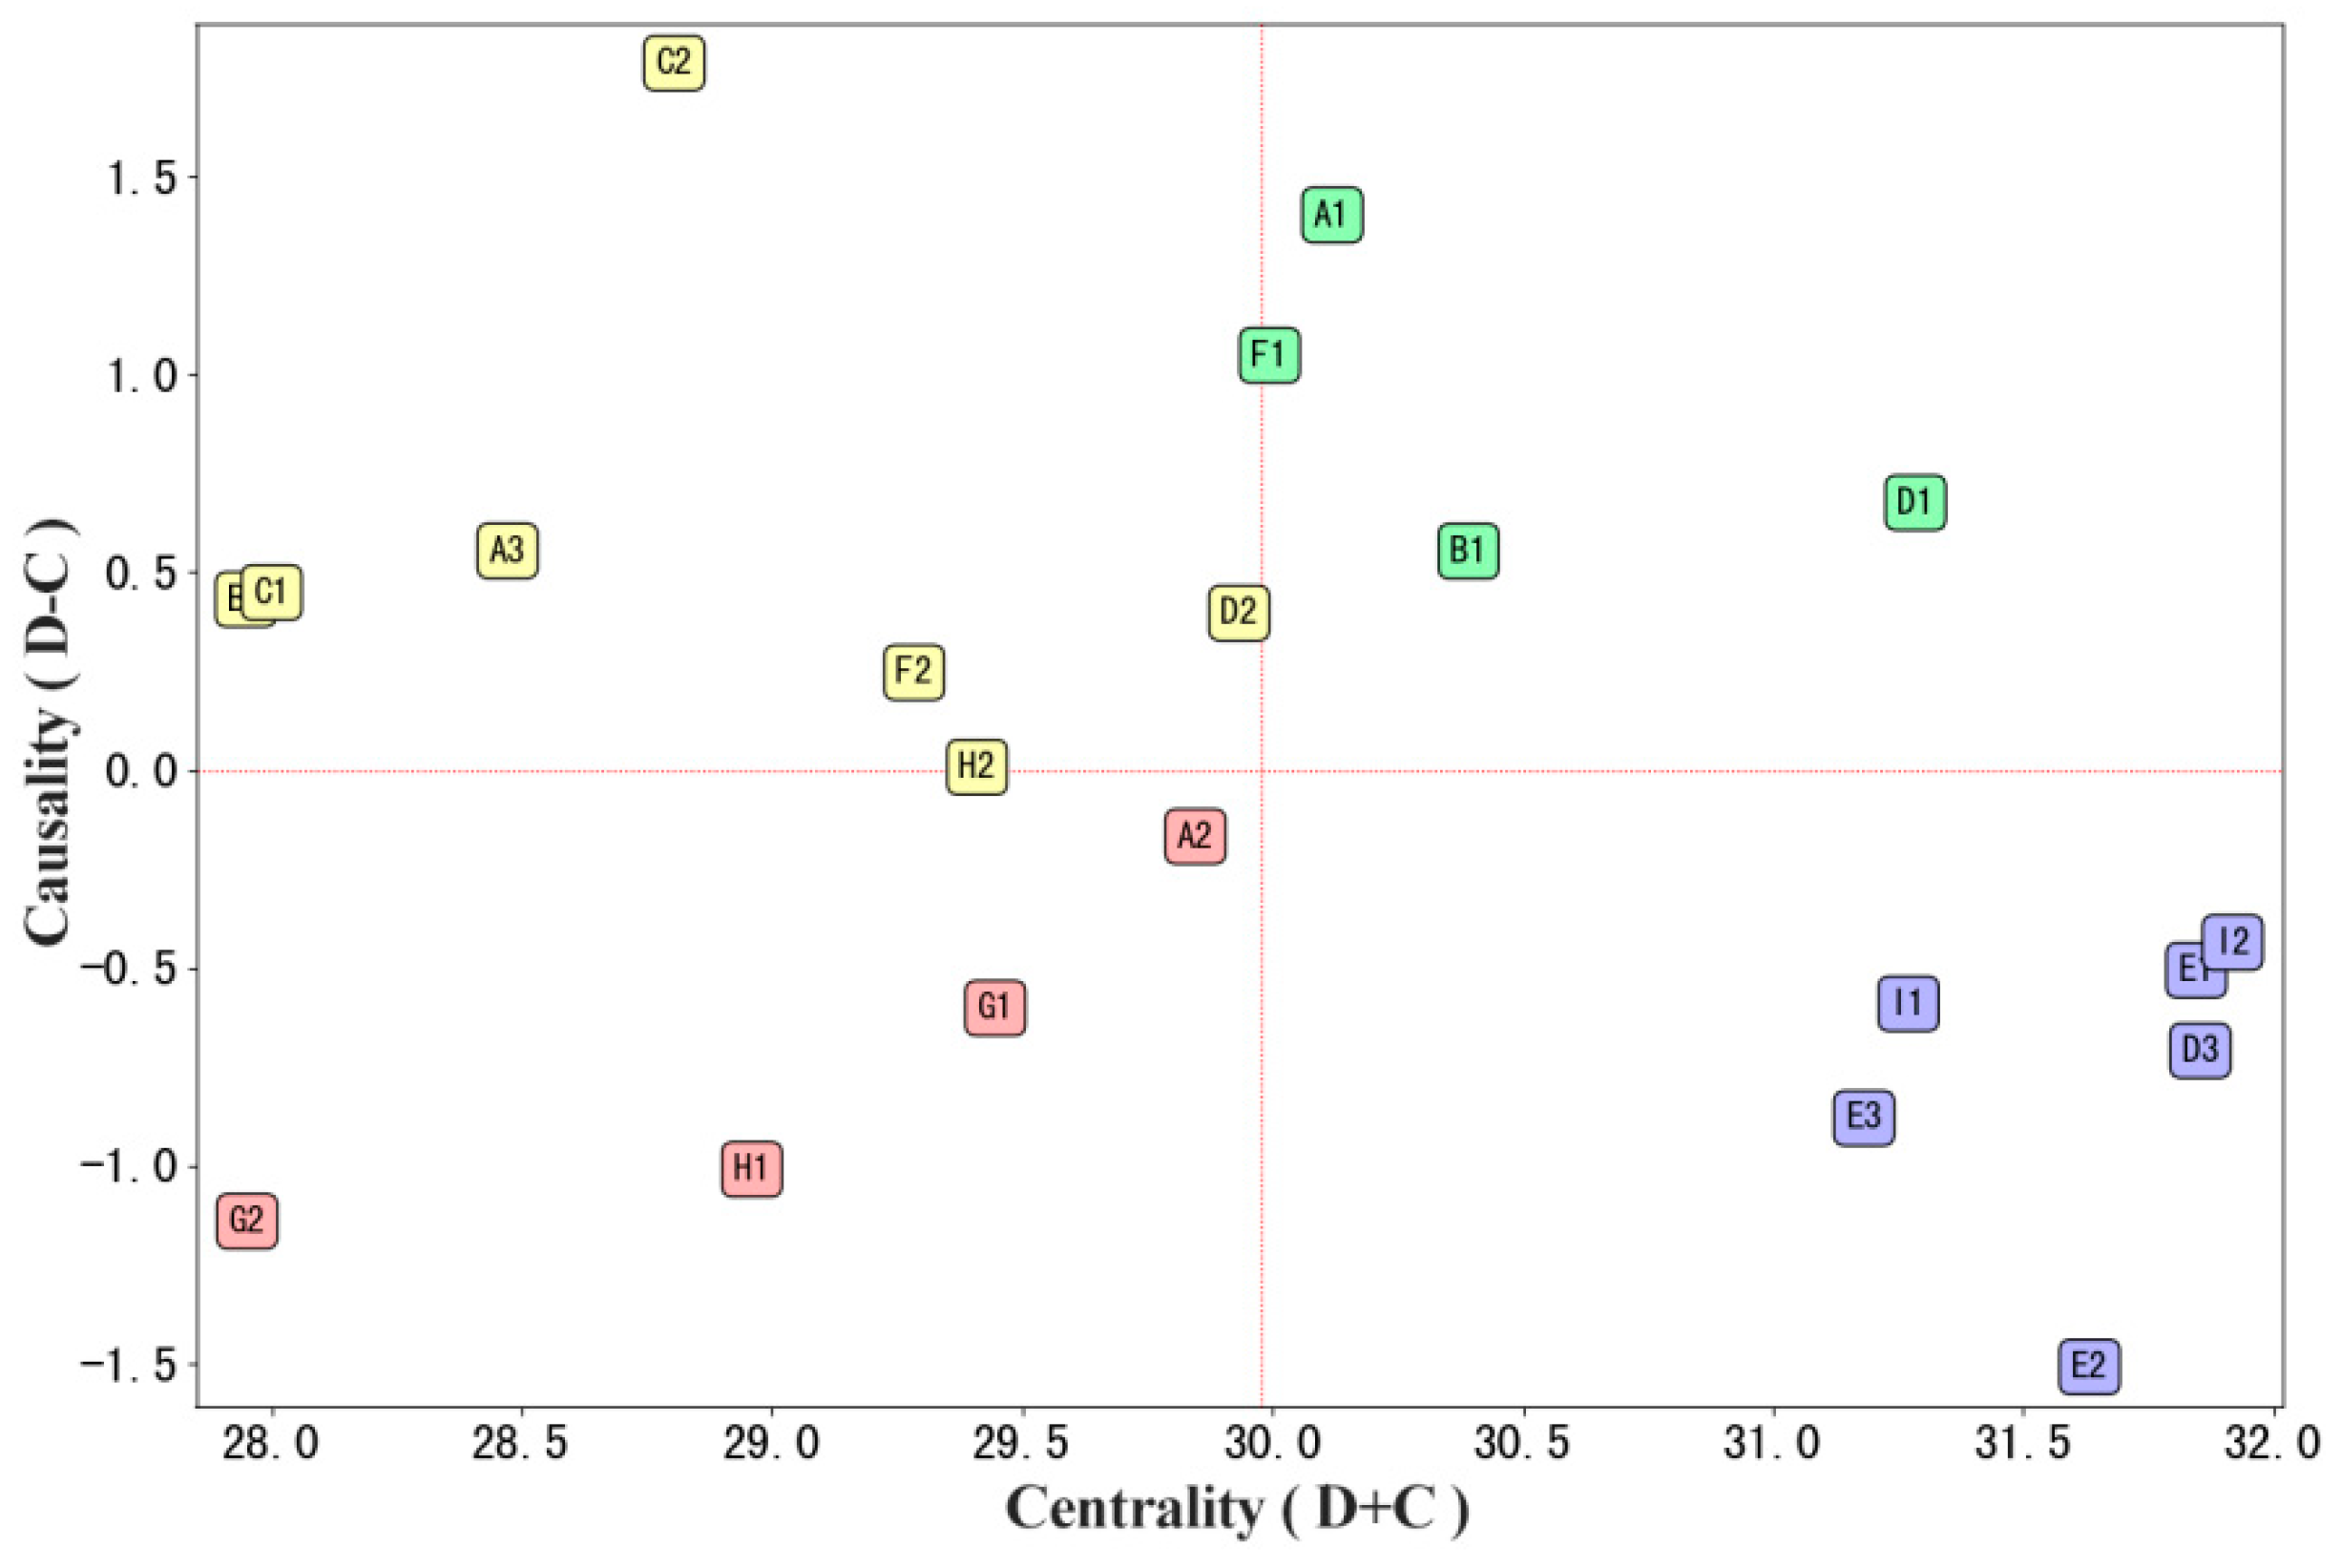
4.1. FUZZY-DEMATEL Result Analysis
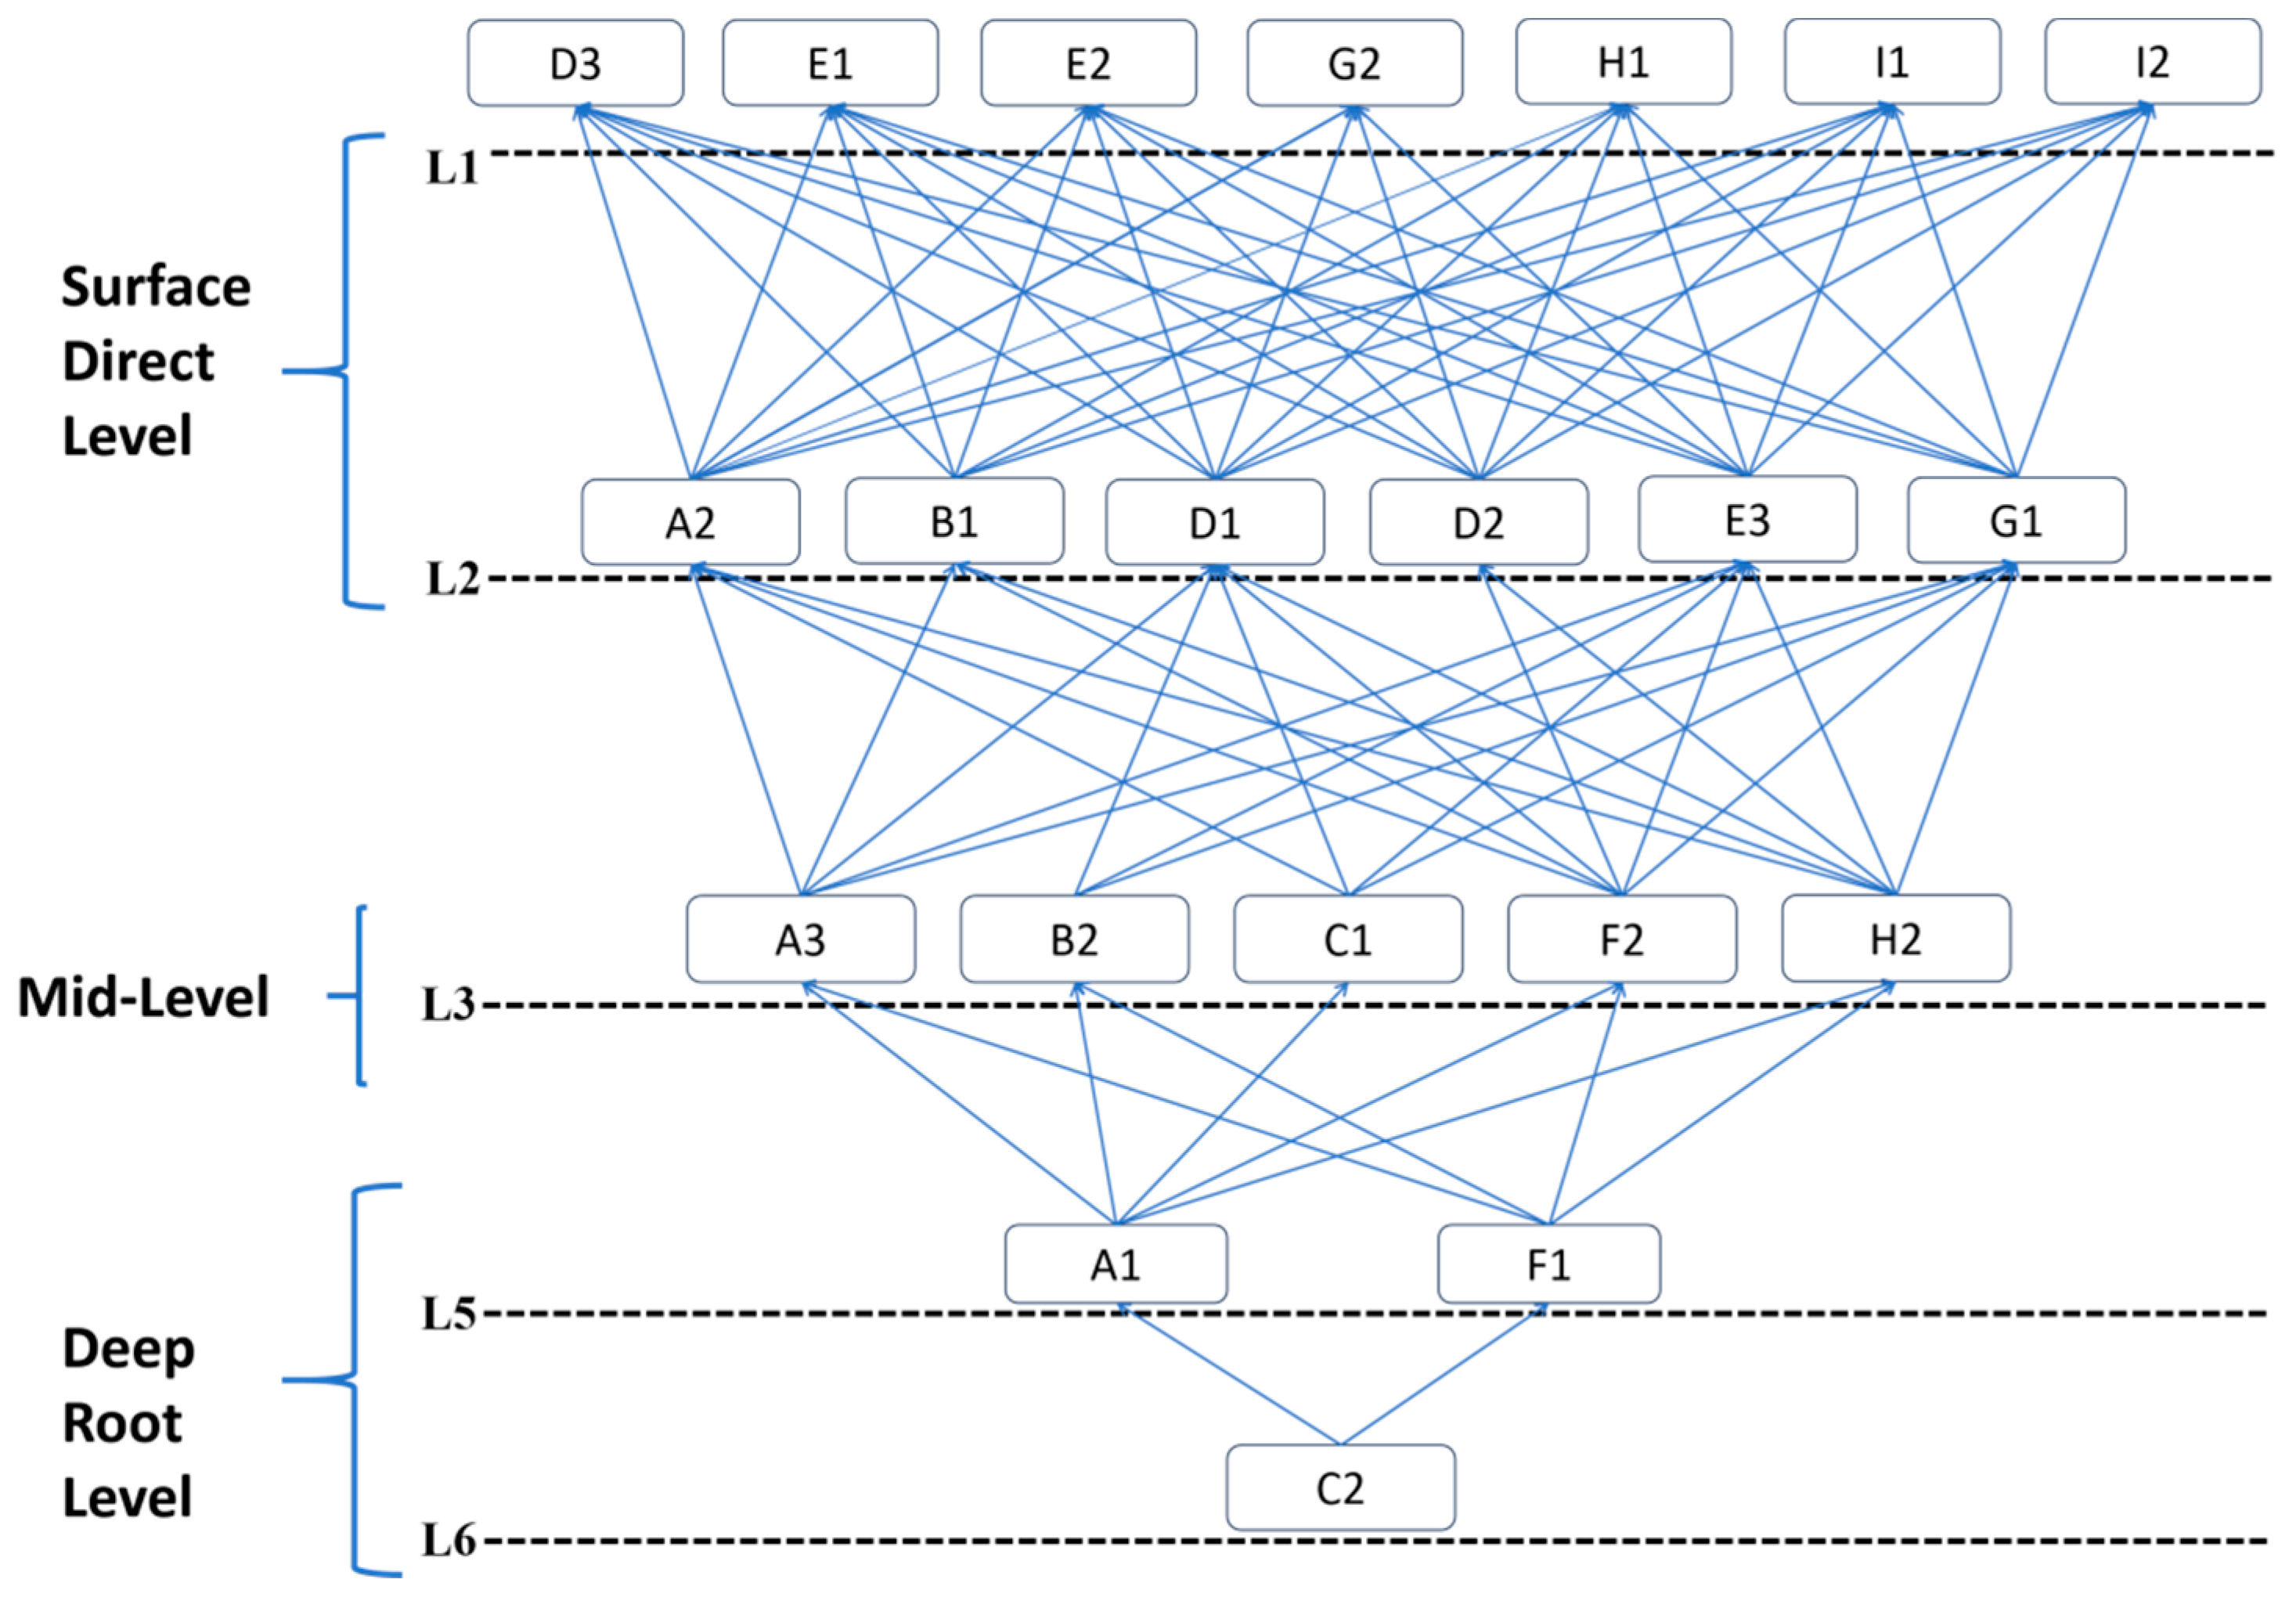
4.2. ISM Result Analysis
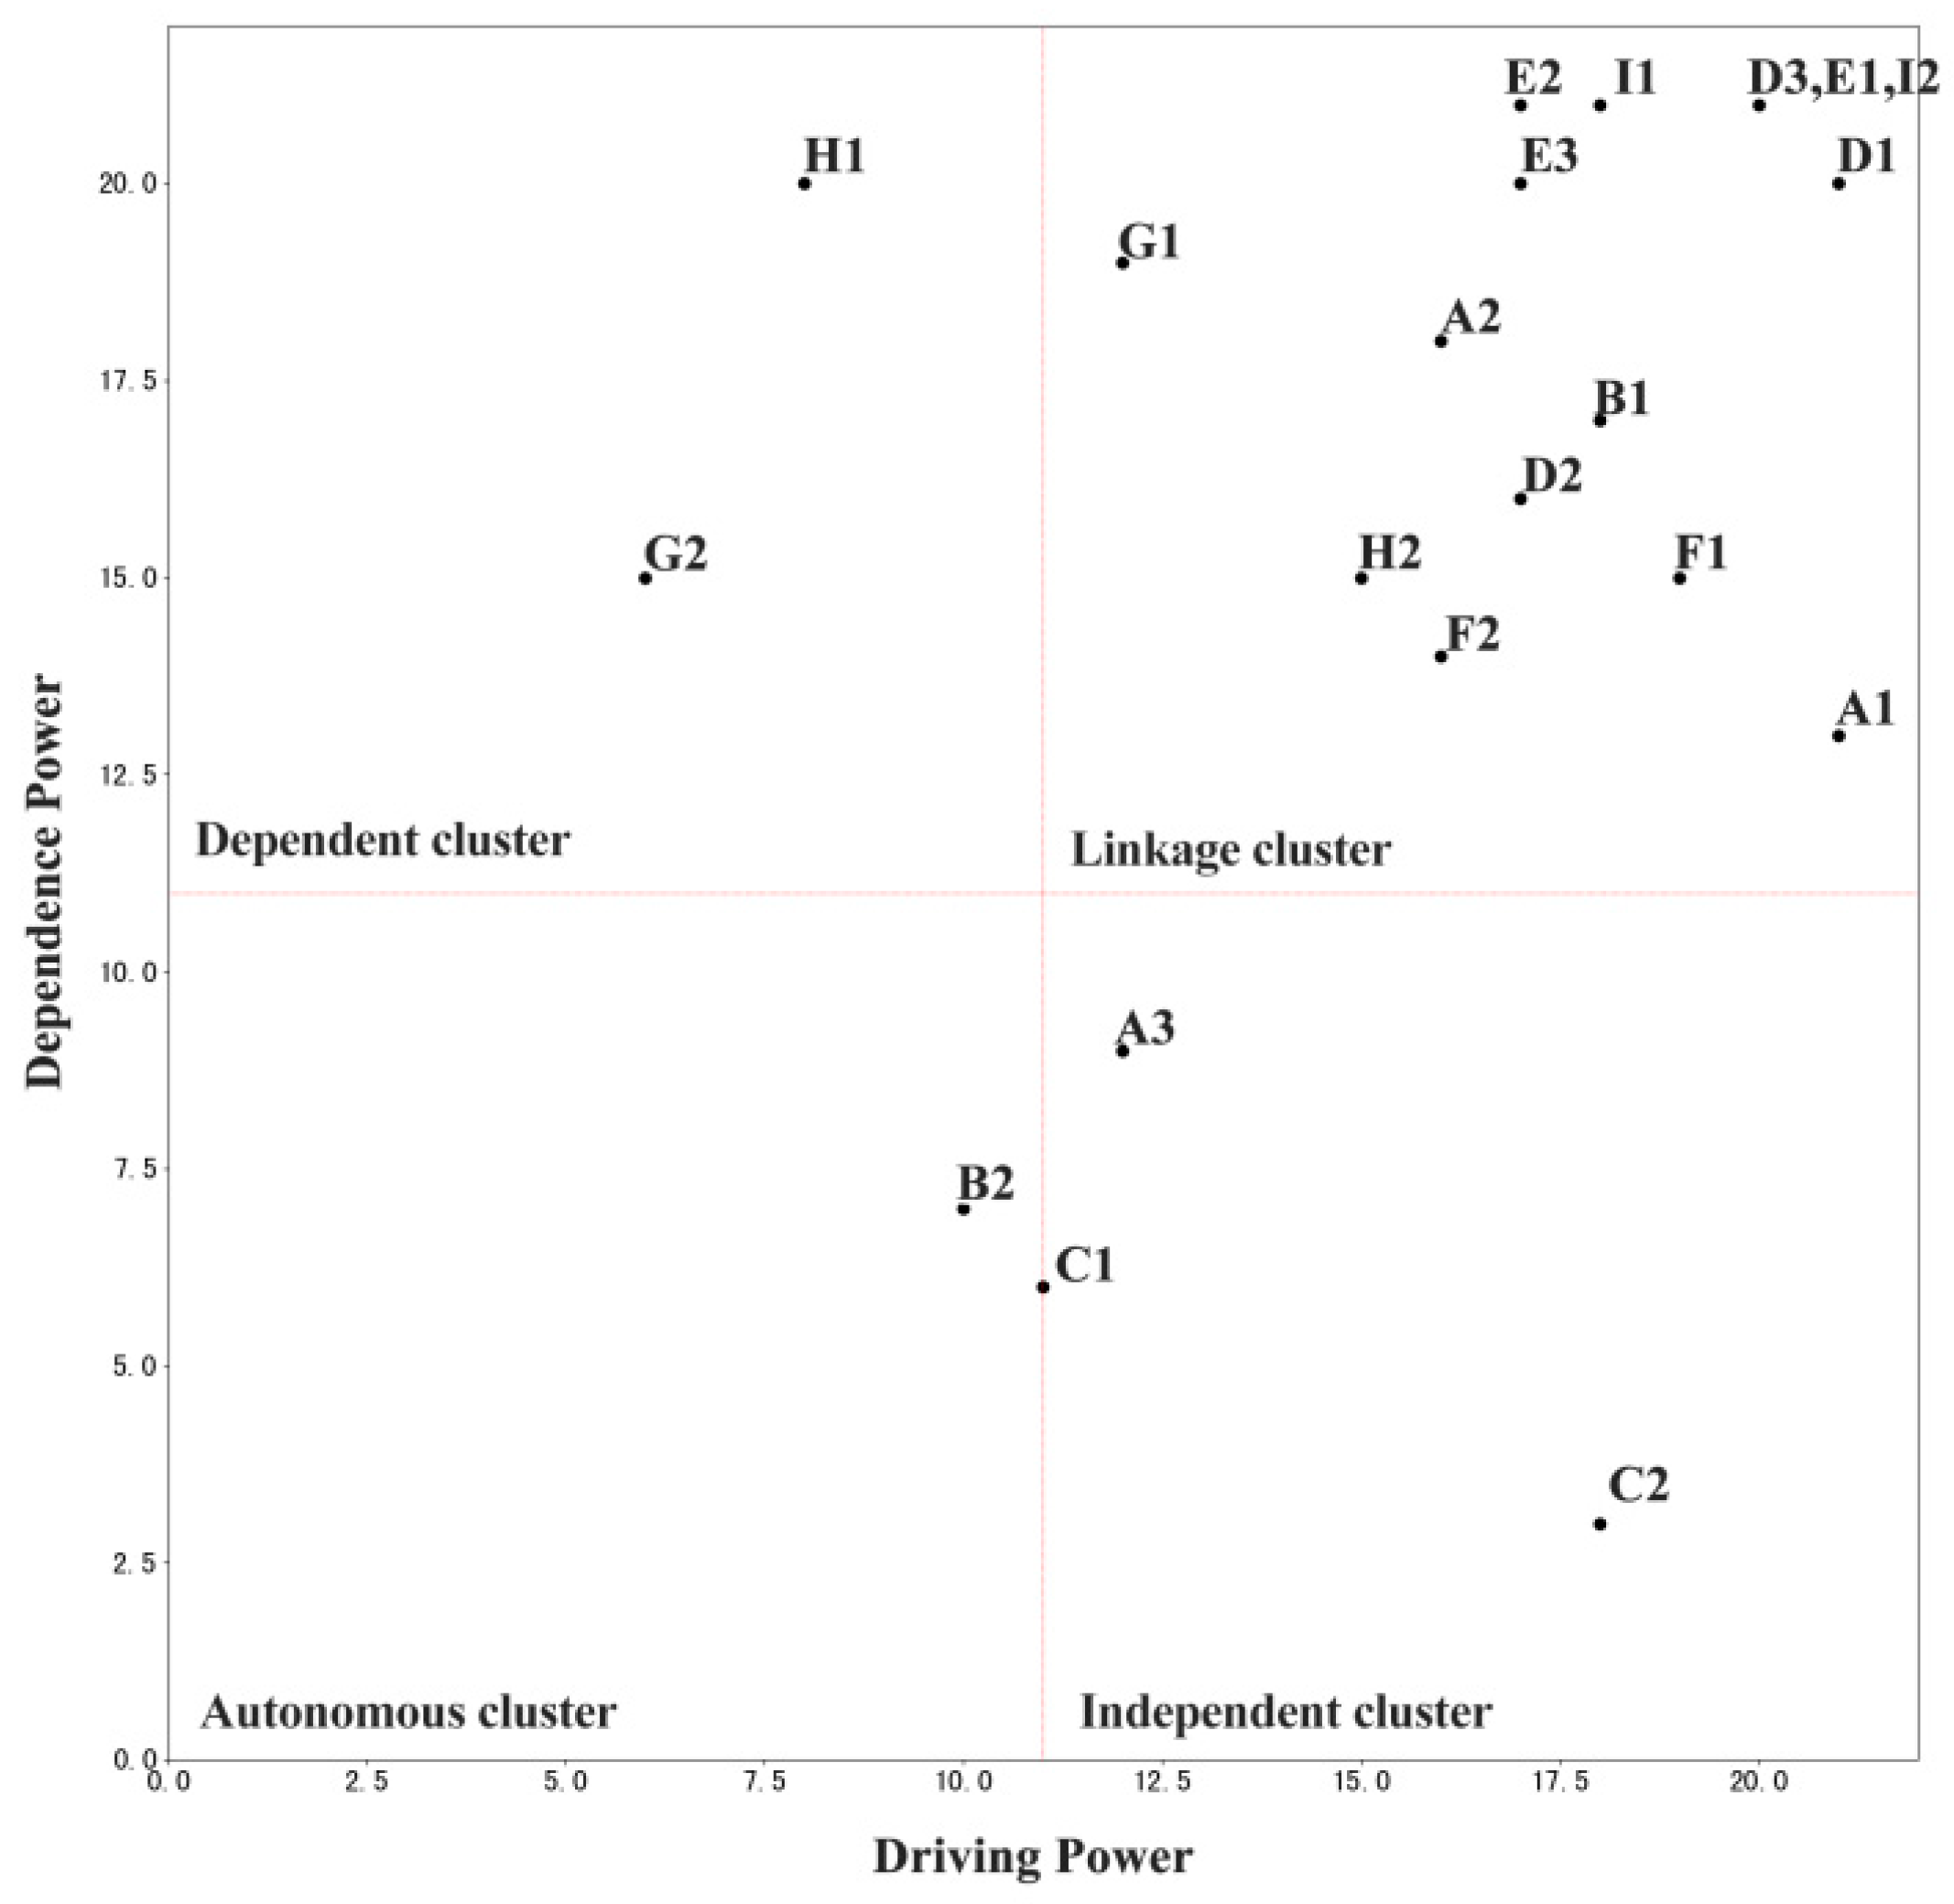
4.3. MICMAC Result Analysis
5. Discussion
6. Conclusions
6.1. Theoretical Significance
6.2. Key Factors That Require Attention
6.3. Research Limitations and Future Possibilities
Author Contributions
Funding
Informed Consent Statement
Data Availability Statement
Acknowledgments
Conflicts of Interest
References
- Wu, J.; Liao, H.; Wang, J.-W.; Chen, T. The role of environmental concern in the public acceptance of autonomous electric vehicles: A survey from China. Transp. Res. Part F Traffic Psychol. Behav. 2019, 60, 37–46. [Google Scholar] [CrossRef]
- Shaheen, S.; Chan, N. Mobility and the sharing economy: Potential to facilitate the first-and last-mile public transit connections. Built Environ. 2016, 42, 573–588. [Google Scholar] [CrossRef]
- Javadinasr, M.; Asgharpour, S.; Rahimi, E.; Choobchian, P.; Mohammadian, A.K.; Auld, J. Eliciting attitudinal factors affecting the continuance use of E-scooters: An empirical study in Chicago. Transp. Res. Part F Traffic Psychol. Behav. 2022, 87, 87–101. [Google Scholar] [CrossRef]
- Karlı, R.G.Ö.; Karlı, H.; Çelikyay, H.S. Investigating the acceptance of shared e-scooters: Empirical evidence from Turkey. Case Stud. Transp. Policy 2022, 10, 1058–1068. [Google Scholar] [CrossRef]
- Julio, R.; Monzon, A.; Susilo, Y.O. Identifying key elements for user satisfaction of bike-sharing systems: A combination of direct and indirect evaluations. Transportation 2024, 51, 407–438. [Google Scholar] [CrossRef]
- Jin, F.; Yao, E.; An, K. Analysis of the potential demand for battery electric vehicle sharing: Mode share and spatiotemporal distribution. J. Transp. Geogr. 2020, 82, 102630. [Google Scholar] [CrossRef]
- Fu, X.-m. Does heavy ICT usage contribute to the adoption of ride-hailing app? Travel Behav. Soc. 2020, 21, 101–108. [Google Scholar] [CrossRef]
- Wang, H.; Chen, B.; Xiong, W.; Yang, L.; Zhu, D. Multiple pathways to public-private partnerships for urban public service delivery: A cross-city comparison of bicycle-sharing service in China. Urban Policy Res. 2019, 37, 474–488. [Google Scholar] [CrossRef]
- Shi, J.; Wu, Z.; Jin, J. Reform Beijing to a public transit oriented city–from the view of transportation equity. J. Adv. Transp. 2011, 45, 96–106. [Google Scholar] [CrossRef]
- Li, F.; Guo, X.; Zhou, L.; Wu, J.; Li, T. A capacity matching model in a collaborative urban public transport system: Integrating passenger and freight transportation. Int. J. Prod. Res. 2022, 60, 6303–6328. [Google Scholar] [CrossRef]
- Hu, W.; Dong, J.; Hwang, B.-G.; Ren, R.; Chen, Z. Is mass rapid transit applicable for deep integration of freight-passenger transport? A multi-perspective analysis from urban China. Transp. Res. Part A Policy Pract. 2022, 165, 490–510. [Google Scholar] [CrossRef]
- Cao, M.; Ma, S.; Huang, M.; Lü, G.; Chen, M. Effects of free-floating shared bicycles on urban public transportation. ISPRS Int. J. Geo-Inf. 2019, 8, 323. [Google Scholar] [CrossRef]
- Campbell, A.A.; Cherry, C.R.; Ryerson, M.S.; Yang, X. Factors influencing the choice of shared bicycles and shared electric bikes in Beijing. Transp. Res. Part C Emerg. Technol. 2016, 67, 399–414. [Google Scholar] [CrossRef]
- Wang, J.; Huang, J.; Dunford, M. Rethinking the utility of public bicycles: The development and challenges of station-less bike sharing in China. Sustainability 2019, 11, 1539. [Google Scholar] [CrossRef]
- Ren, X.; Chen, Z.; Liu, C.; Dan, T.; Wu, J.; Wang, F. Are vehicle on-demand and shared services a favorable solution for the first and last-mile mobility: Evidence from China. Travel Behav. Soc. 2023, 31, 386–398. [Google Scholar] [CrossRef]
- Yao, D.; He, S.; Wang, Z. A new ride-sharing model incorporating the passengers’ efforts. Nav. Res. Logist. 2021, 68, 397–411. [Google Scholar] [CrossRef]
- Xu, D.; Huang, G.; Zhang, W.; Xu, W. The complementary effect of ride-sharing on public transit: Evidence from a natural experiment. Ind. Manag. Data Syst. 2023, 123, 1911–1935. [Google Scholar] [CrossRef]
- Dong, X.; Wang, Y.; Li, X.; Zhong, Z.; Shen, X.; Sun, H.; Hu, B. Understanding the influencing factors of taxi ride-sharing: A case study of Chengdu, China. Transp. Res. Part A Policy Pract. 2023, 176, 103819. [Google Scholar] [CrossRef]
- Shui, C.; Szeto, W. A review of bicycle-sharing service planning problems. Transp. Res. Part C-Emerg. Technol. 2020, 117, 102648. [Google Scholar] [CrossRef]
- Ferrero, F.; Perboli, G.; Rosano, M.; Vesco, A. Car-sharing services: An annotated Review. Sustain. Cities Soc. 2018, 37, 501–518. [Google Scholar] [CrossRef]
- Nikitas, A.; Wallgren, P.; Rahe, U. Public bicycles: How the concept of human-oriented “mobility sharing” technology can influence travel behaviour norms and reshape design education. In Proceedings of the 16th International conference on Engineering and Product Design Education (E&PDE14), Enschede, The Netherlands, 4–5 September 2014; pp. 159–164. [Google Scholar]
- Yunus, E.; Susilo, D.; Riyadi, S.; Indrasari, M.; Putranto, T.D. The effectiveness marketing strategy for ride-sharing transportation: Intersecting social media, technology, and innovation. Entrep. Sustain. Issues 2019, 7, 1424. [Google Scholar] [CrossRef] [PubMed]
- Cohen, B.; Kietzmann, J. Ride on! Mobility business models for the sharing economy. Organ. Environ. 2014, 27, 279–296. [Google Scholar] [CrossRef]
- Su, Y.-S.; Oh, E.-T.; Liu, R.-J. Establishing standardization and an innovation ecosystem for the global bicycle industry—The case of Taiwan. IEEE Trans. Eng. Manag. 2021, 70, 1574–1586. [Google Scholar] [CrossRef]
- Lempert, R.; Zhao, J.; Dowlatabadi, H. Convenience, savings, or lifestyle? Distinct motivations and travel patterns of one-way and two-way carsharing members in Vancouver, Canada. Transp. Res. Part D Transp. Environ. 2019, 71, 141–152. [Google Scholar] [CrossRef]
- Yang, H.; Huo, J.; Pan, R.; Xie, K.; Zhang, W.; Luo, X. Exploring built environment factors that influence the market share of ridesourcing service. Appl. Geogr. 2022, 142, 102699. [Google Scholar] [CrossRef]
- Li, X.; Zhang, Y.; Sun, L.; Liu, Q. Free-floating bike sharing in jiangsu: Users’ behaviors and influencing factors. Energies 2018, 11, 1664. [Google Scholar] [CrossRef]
- Prieto, M.; Baltas, G.; Stan, V. Car sharing adoption intention in urban areas: What are the key sociodemographic drivers? Transp. Res. Part A Policy Pract. 2017, 101, 218–227. [Google Scholar] [CrossRef]
- Hjorteset, M.A.; Böcker, L. Car sharing in Norwegian urban areas: Examining interest, intention and the decision to enrol. Transp. Res. Part D Transp. Environ. 2020, 84, 102322. [Google Scholar] [CrossRef]
- Chen, Z.; van Lierop, D.; Ettema, D. Travel satisfaction with dockless bike-sharing: Trip stages, attitudes and the built environment. Transp. Res. Part D Transp. Environ. 2022, 106, 103280. [Google Scholar] [CrossRef]
- Middleton, S.; Schroeckenthaler, K.; Papayannoulis, V.; Gopalakrishna, D. Analysis of Travel Choices and Scenarios for Sharing Rides; Federal Highway Administration, Office of Operations: Brooklyn, NY, USA, 2021.
- Gao, Y.; Chen, J. The risk reduction and sustainable development of shared transportation: The Chinese online car-hailing policy evaluation in the digitalization era. Sustainability 2019, 11, 2596. [Google Scholar] [CrossRef]
- Duran-Rodas, D.; Chaniotakis, E.; Antoniou, C. Built environment factors affecting bike sharing ridership: Data-driven approach for multiple cities. Transp. Res. Rec. 2019, 2673, 55–68. [Google Scholar] [CrossRef]
- Deng, Y.; Zhao, P. The determinants of shared bike use in China. Transportation 2023, 50, 1–23. [Google Scholar] [CrossRef]
- Yan, X.; Zhao, X.; Han, Y.; Van Hentenryck, P.; Dillahunt, T. Mobility-on-demand versus fixed-route transit systems: An evaluation of traveler preferences in low-income communities. Transp. Part A Policy Pract. 2021, 148, 481–495. [Google Scholar] [CrossRef]
- Xia, X.; Jiang, H.; Wang, J. Analysis of user satisfaction of shared bicycles based on SEM. J. Ambient. Intell. Humaniz. Comput. 2022, 13, 1587–1601. [Google Scholar] [CrossRef]
- Olsson, S.R.; Elldér, E. Are bicycle streets cyclist-friendly? Micro-environmental factors for improving perceived safety when cycling in mixed traffic. Accid. Anal. Prev. 2023, 184, 107007. [Google Scholar] [CrossRef]
- Noland, R.B.; Smart, M.J.; Guo, Z. Bikeshare trip generation in New York city. Transp. Res. Part A Policy Pract. 2016, 94, 164–181. [Google Scholar] [CrossRef]
- Mouratidis, K.; Peters, S.; van Wee, B. Transportation technologies, sharing economy, and teleactivities: Implications for built environment and travel. Transp. Res. Part D Transp. Environ. 2021, 92, 102716. [Google Scholar] [CrossRef]
- Khajehshahkoohi, M.; Davoodi, S.R.; Shaaban, K. Factors affecting the behavioral intention of tourists on the use of bike sharing in tourism areas. Res. Transp. Bus. Manag. 2022, 43, 100742. [Google Scholar] [CrossRef]
- Chen, Z.; Van Lierop, D.; Ettema, D. Perceived accessibility: How access to dockless bike-sharing impacts activity participation. Travel Behav. Soc. 2022, 27, 128–138. [Google Scholar] [CrossRef]
- Xin, F.; Chen, Y.; Wang, X.; Chen, X. Cyclist satisfaction evaluation model for free-floating bike-sharing system: A case study of Shanghai. Transp. Res. Rec. 2018, 2672, 21–32. [Google Scholar] [CrossRef]
- Li, W.; Yang, Y.; Cheng, L.; Meng, X.; Zhang, F.; Ji, Y. Understanding adoption intent and behavioral response to shared electric bicycles: A survey in Ningbo, China. Transp. Res. Rec. 2023, 2677, 1311–1326. [Google Scholar] [CrossRef]
- Christoforou, Z.; de Bortoli, A.; Gioldasis, C.; Seidowsky, R. Who is using e-scooters and how? Evidence from Paris. Transp. Res. Part D Transp. Environ. 2021, 92, 102708. [Google Scholar] [CrossRef]
- Kopplin, C.S.; Brand, B.M.; Reichenberger, Y. Consumer acceptance of shared e-scooters for urban and short-distance mobility. Transp. Res. Part D Transp. Environ. 2021, 91, 102680. [Google Scholar] [CrossRef]
- Eccarius, T.; Lu, C.-C. Adoption intentions for micro-mobility–Insights from electric scooter sharing in Taiwan. Transp. Res. Part D Transp. Environ. 2020, 84, 102327. [Google Scholar] [CrossRef]
- Li, R.; Krishna Sinniah, G.; Li, X. The factors influencing resident’s intentions on e-bike sharing usage in China. Sustainability 2022, 14, 5013. [Google Scholar] [CrossRef]
- Pan, L.; Xia, Y.; Xing, L.; Song, Z.; Xu, Y. Exploring use acceptance of electric bicycle-sharing systems: An empirical study based on PLS-SEM analysis. Sensors 2022, 22, 7057. [Google Scholar] [CrossRef]
- Reck, D.J.; Haitao, H.; Guidon, S.; Axhausen, K.W. Explaining shared micromobility usage, competition and mode choice by modelling empirical data from Zurich, Switzerland. Transp. Res. Part C Emerg. Technol. 2021, 124, 102947. [Google Scholar] [CrossRef]
- Nikiforiadis, A.; Paschalidis, E.; Stamatiadis, N.; Raptopoulou, A.; Kostareli, A.; Basbas, S. Analysis of attitudes and engagement of shared e-scooter users. Transp. Res. Part D Transp. Environ. 2021, 94, 102790. [Google Scholar] [CrossRef]
- Hosseinzadeh, A.; Algomaiah, M.; Kluger, R.; Li, Z. Spatial analysis of shared e-scooter trips. J. Transp. Geogr. 2021, 92, 103016. [Google Scholar] [CrossRef]
- Jiao, J.; Bai, S. Understanding the shared e-scooter travels in Austin, TX. ISPRS Int. J. Geo-Inf. 2020, 9, 135. [Google Scholar] [CrossRef]
- Safdar, M.; Jamal, A.; Al-Ahmadi, H.M.; Rahman, M.T.; Almoshaogeh, M. Analysis of the influential factors towards adoption of car-sharing: A case study of a megacity in a developing country. Sustainability 2022, 14, 2778. [Google Scholar] [CrossRef]
- Lopez-Carreiro, I.; Monzon, A.; Lois, D.; Lopez-Lambas, M.E. Are travellers willing to adopt MaaS? Exploring attitudinal and personality factors in the case of Madrid, Spain. Travel Behav. Soc. 2021, 25, 246–261. [Google Scholar] [CrossRef]
- Nastjuk, I.; Herrenkind, B.; Marrone, M.; Brendel, A.B.; Kolbe, L.M. What drives the acceptance of autonomous driving? An investigation of acceptance factors from an end-user’s perspective. Technol. Forecast. Soc. Chang. 2020, 161, 120319. [Google Scholar] [CrossRef]
- Min, Q.; Xing-Fu, X. Identifying key elements in a car-sharing system for constructing a comprehensive car-sharing model. J. Intell. Fuzzy Syst. 2020, 38, 2297–2309. [Google Scholar] [CrossRef]
- del Mar Alonso-Almeida, M. Carsharing: Another gender issue? Drivers of carsharing usage among women and relationship to perceived value. Travel Behav. Soc. 2019, 17, 36–45. [Google Scholar] [CrossRef]
- Narayanan, S.; Antoniou, C. Shared mobility services towards Mobility as a Service (MaaS): What, who and when? Transp. Res. Part A Policy Pract. 2023, 168, 103581. [Google Scholar] [CrossRef]
- Ye, X.; Sui, X.; Wang, T.; Yan, X.; Chen, J. Research on parking choice behavior of shared autonomous vehicle services by measuring users’ intention of usage. Transp. Res. Part F Traffic Psychol. Behav. 2022, 88, 81–98. [Google Scholar] [CrossRef]
- Ye, J.; Wang, D.; Zhang, H.; Yang, H. What kind of people use carsharing for commuting? Case study in Shanghai. Transp. Res. Rec. 2019, 2673, 770–778. [Google Scholar] [CrossRef]
- Burghard, U.; Scherrer, A. Sharing vehicles or sharing rides-Psychological factors influencing the acceptance of carsharing and ridepooling in Germany. Energy Policy 2022, 164, 112874. [Google Scholar] [CrossRef]
- Zhao, D.; Yuan, Z.; Chen, M.; Yang, S. Differential pricing strategies of ride-sharing platforms: Choosing customers or drivers? Int. Trans. Oper. Res. 2022, 29, 1089–1131. [Google Scholar] [CrossRef]
- Wang, Y.; Gu, J.; Wang, S.; Wang, J. Understanding consumers’ willingness to use ride-sharing services: The roles of perceived value and perceived risk. Transp. Res. Part C Emerg. Technol. 2019, 105, 504–519. [Google Scholar] [CrossRef]
- Abbasi, M.; Mamdoohi, A.R.; Sierpiński, G.; Ciari, F. Usage intention of shared autonomous vehicles with dynamic ride sharing on long-distance trips. Sustainability 2023, 15, 1649. [Google Scholar] [CrossRef]
- Brown, A.E. Who and where rideshares? Rideshare travel and use in Los Angeles. Transp. Res. Part A Policy Pract. 2020, 136, 120–134. [Google Scholar] [CrossRef]
- Alemi, F.; Circella, G.; Handy, S.; Mokhtarian, P. What influences travelers to use Uber? Exploring the factors affecting the adoption of on-demand ride services in California. Travel Behav. Soc. 2018, 13, 88–104. [Google Scholar] [CrossRef]
- Ayaz, A.; Waheed, A.; Saleem, H.; Abid, M.M. Travelers’ attitude towards carpooling in Islamabad. J. Eng. Appl. Sci. 2021, 68, 23. [Google Scholar] [CrossRef]
- Li, L.; Li, G.; Liang, S. Does government supervision suppress free-floating bike sharing development? Evidence from Mobike in China. Inf. Technol. Dev. 2021, 27, 802–826. [Google Scholar] [CrossRef]
- Gilbert, R.; Irwin, N.; Hollingworth, B.; Blais, P. Sustainable transportation performance indicators (STPI). Transp. Res. Board (TRB) CD ROM 2003, 2003. [Google Scholar]
- Meyer, M.D. A Toolbox for Alleviating Traffic Congestion and Enhancing Mobility; Federal Highway Administration: Brooklyn, NY, USA, 1997.
- Bamberg, S.; Fujii, S.; Friman, M.; Gärling, T. Behaviour theory and soft transport policy measures. Transp. Policy 2011, 18, 228–235. [Google Scholar] [CrossRef]
- Piras, F.; Sottile, E.; Meloni, I. Modal share change following implementation of travel demand management strategies. Transp. Res. Rec. 2018, 2672, 731–741. [Google Scholar] [CrossRef]
- Seik, F.T. An advanced demand management instrument in urban transport: Electronic road pricing in Singapore. Cities 2000, 17, 33–45. [Google Scholar] [CrossRef]
- Gärling, T.; Fujii, S. Travel behavior modification: Theories, methods, and programs. In Expand. Expanding Sphere of Travel Behaviour Research: Selected Papers from the 11th International Conference on Travel Behaviour Research; Emerald Group Publishing: Bingley, UK, 2009; pp. 97–128. [Google Scholar]
- Stopher, P.R. Reducing road congestion: A reality check. Transp. Policy 2004, 11, 117–131. [Google Scholar] [CrossRef]
- Möser, G.; Bamberg, S. The effectiveness of soft transport policy measures: A critical assessment and meta-analysis of empirical evidence. J. Environ. Psychol. 2008, 28, 10–26. [Google Scholar] [CrossRef]
- Li, M.Z. The role of speed–flow relationship in congestion pricing implementation with an application to Singapore. Transp. Res. Part B Methodol. 2002, 36, 731–754. [Google Scholar] [CrossRef]
- Hess, D.B. Effect of free parking on commuter mode choice: Evidence from travel diary data. Transp. Res. Rec. 2001, 1753, 35–42. [Google Scholar] [CrossRef]
- Mees, P. A centenary review of transport planning in Canberra, Australia. Prog. Plan. 2014, 87, 1–32. [Google Scholar] [CrossRef]
- Bueno, P.C.; Gomez, J.; Peters, J.R.; Vassallo, J.M. Understanding the effects of transit benefits on employees’ travel behavior: Evidence from the New York-New Jersey region. Transp. Res. Part A Policy Pract. 2017, 99, 1–13. [Google Scholar] [CrossRef]
- McKnight-Slottee, M.; Bae, C.-H.C.; McCormack, E. Site-Specific Transportation Demand Management: Case of Seattle’s Transportation Management Program, 1988–2015. Transp. Res. Rec. 2022, 2676, 573–583. [Google Scholar] [CrossRef]
- Wang, Y.; Geng, K.; May, A.D.; Zhou, H. The impact of traffic demand management policy mix on commuter travel choices. Transp. Policy 2022, 117, 74–87. [Google Scholar] [CrossRef]
- Farahmand, Z.H.; Gkiotsalitis, K.; Geurs, K.T. Mobility-as-a-Service as a transport demand management tool: A case study among employees in the Netherlands. Case Stud. Transp. Policy 2021, 9, 1615–1629. [Google Scholar] [CrossRef]
- Ma, F.; Shi, W.; Yuen, K.F.; Sun, Q.; Guo, Y. Multi-stakeholders’ assessment of bike sharing service quality based on DEMATEL–VIKOR method. Int. J. Logist. Res. Appl. 2019, 22, 449–472. [Google Scholar] [CrossRef]
- Xie, Y.; Xiao, H.; Shen, T.; Han, T. Investigating the Influencing Factors of User Experience in Car-Sharing Services: An Application of DEMATEL Method. In HCI in Mobility, Transport, and Automotive Systems. Driving Behavior, Urban and Smart Mobility: Second International Conference, MobiTAS 2020, Held as Part of the 22nd HCI International Conference, HCII 2020, Copenhagen, Denmark, 19–24 July 2020; Proceedings, Part II 22; Springer: Berlin/Heidelberg, Germany, 2020; pp. 359–375. [Google Scholar]
- Lo, H.-W.; Fang, T.-Y.; Lin, S.-W. Integrating technological and strategic analysis: Evaluating the key determinants of transportation sustainability in taipei Mass Rapid Transit using the Rough-Fermatean DEMATEL approach. Socio-Econ. Plan. Sci. 2024, 94, 101948. [Google Scholar] [CrossRef]
- Asadi, S.; Nilashi, M.; Iranmanesh, M.; Ghobakhloo, M.; Samad, S.; Alghamdi, A.; Almulihi, A.; Mohd, S. Drivers and barriers of electric vehicle usage in Malaysia: A DEMATEL approach. Resour. Conserv. Recycl. 2022, 177, 105965. [Google Scholar] [CrossRef]
- He, Y.; Kang, J.; Pei, Y.; Ran, B.; Song, Y. Research on influencing factors of fuel consumption on superhighway based on DEMATEL-ISM model. Energy Policy 2021, 158, 112545. [Google Scholar] [CrossRef]
- Liang, Y.; Wang, H.; Zhao, X. Analysis of factors affecting economic operation of electric vehicle charging station based on DEMATEL-ISM. Comput. Ind. Eng. 2022, 163, 107818. [Google Scholar] [CrossRef]
- Alqershy, M.T.; Shi, Q. Barriers to Social Responsibility Implementation in Belt and Road Mega Infrastructure Projects: A Hybrid Fuzzy DEMATEL-ISM-MICMAC Approach. Buildings 2023, 13, 1561. [Google Scholar] [CrossRef]
- Liu, W.; Hu, Y.; Huang, Q. Research on Critical Factors Influencing Organizational Resilience of Major Transportation Infrastructure Projects: A Hybrid Fuzzy DEMATEL-ISM-MICMAC Approach. Buildings 2024, 14, 1598. [Google Scholar] [CrossRef]
- Mohammadfam, I.; Khajevandi, A.A.; Dehghani, H.; Babamiri, M.; Farhadian, M. Analysis of factors affecting human reliability in the mining process design using Fuzzy Delphi and DEMATEL methods. Sustainability 2022, 14, 8168. [Google Scholar] [CrossRef]
- Wu, W.-W.; Lee, Y.-T. Developing global managers’ competencies using the fuzzy DEMATEL method. Expert Syst. Appl. 2007, 32, 499–507. [Google Scholar] [CrossRef]
- Mandal, A.; Deshmukh, S. Vendor selection using interpretive structural modelling (ISM). Int. J. Oper. Prod. Manag. 1994, 14, 52–59. [Google Scholar] [CrossRef]
- Liu, X.; Yan, X.; Liu, F.; Wang, R.; Leng, Y. A trip-specific model for fuel saving estimation and subsidy policy making of carpooling based on empirical data. Appl. Energy 2019, 240, 295–311. [Google Scholar] [CrossRef]
- Yu, B.; Ma, Y.; Xue, M.; Tang, B.; Wang, B.; Yan, J.; Wei, Y.-M. Environmental benefits from ridesharing: A case of Beijing. Appl. Energy 2017, 191, 141–152. [Google Scholar] [CrossRef]
- Shaheen, S.A.; Cohen, A.P. Carsharing and personal vehicle services: Worldwide market developments and emerging trends. Int. J. Sustain. Transp. 2013, 7, 5–34. [Google Scholar] [CrossRef]
- Hong, Z.; Chen, Y.; Mahmassani, H.S.; Xu, S. Commuter ride-sharing using topology-based vehicle trajectory clustering: Methodology, application and impact evaluation. Transp. Res. Part C Emerg. Technol. 2017, 85, 573–590. [Google Scholar] [CrossRef]
- Yin, Y.; Yu, Z.; Wang, H.; Ye, J. Sharing transport in high education area of Ningbo: Examining users’ characteristics and driving determinants. J. Clean. Prod. 2021, 306, 127231. [Google Scholar] [CrossRef]
- Steffen, J.; Hook, H.; Witlox, F. Improving interest in public, active, and shared travel modes through nudging interventions. Transp. Res. Part F Traffic Psychol. Behav. 2024, 103, 353–367. [Google Scholar] [CrossRef]
- Taniguchi, A.; Fujii, S.; Azami, T.; Ishida, H. Persuasive communication aimed at public transportation-oriented residential choice and the promotion of public transport. Transportation 2014, 41, 75–89. [Google Scholar] [CrossRef]
- Rastogi, R. Promotion of non-motorized modes as a sustainable transportation option: Policy and planning issues. Curr. Sci. 2011, 1340–1348. [Google Scholar]
- Sun, F.; Chen, P.; Jiao, J. Promoting public bike-sharing: A lesson from the unsuccessful Pronto system. Transp. Res. Part D Transp. Environ. 2018, 63, 533–547. [Google Scholar] [CrossRef] [PubMed]
- Chen, S.-Y. Eco-friendly value or others’ environmental norms? Arguing the environmental using psychology of bike-sharing for the general public. Transp. Lett. 2019, 11, 425–435. [Google Scholar] [CrossRef]
- Chevalier, A.; Charlemagne, M.; Xu, L. Bicycle acceptance on campus: Influence of the built environment and shared bikes. Transp. Res. Part D Transp. Environ. 2019, 76, 211–235. [Google Scholar] [CrossRef]
- Gamble, J.; Snizek, B.; Nielsen, T.S. From people to cycling indicators: Documenting and understanding the urban context of cyclists’ experiences in Quito, Ecuador. J. Transp. Geogr. 2017, 60, 167–177. [Google Scholar] [CrossRef]
- Caravaggi, L.; Imbroglini, C.; Lei, A. Rome’s GRAB—Great bicycle ring route—As complex landscape infrastructure. Sustainability 2022, 14, 1023. [Google Scholar] [CrossRef]
- Gkoumas, K.; Marques dos Santos, F.L.; Stepniak, M.; Pekár, F. Research and innovation supporting the European sustainable and smart mobility strategy: A technology perspective from recent European Union projects. Appl. Sci. 2021, 11, 11981. [Google Scholar] [CrossRef]
- Zhu, J.; Xie, N.; Cai, Z.; Tang, W.; Chen, X. A comprehensive review of shared mobility for sustainable transportation systems. Int. J. Sustain. Transp. 2023, 17, 527–551. [Google Scholar] [CrossRef]
- Chen, Y.; He, K.; Deveci, M.; Coffman, D.M. Health impacts of bike sharing system–A case study of Shanghai. J. Transp. Health 2023, 30, 101611. [Google Scholar] [CrossRef]
- Otero, I.; Nieuwenhuijsen, M.J.; Rojas-Rueda, D. Health impacts of bike sharing systems in Europe. Environ. Int. 2018, 115, 387–394. [Google Scholar] [CrossRef]
- Wilhoit, E.D.; Kisselburgh, L.G. Collective action without organization: The material constitution of bike commuters as collective. Organ. Stud. 2015, 36, 573–592. [Google Scholar] [CrossRef]
- Ricci, M. Bike sharing: A review of evidence on impacts and processes of implementation and operation. Res. Transp. Bus. Manag. 2015, 15, 28–38. [Google Scholar] [CrossRef]
- Mavlutova, I.; Kuzmina, J.; Uvarova, I.; Atstaja, D.; Lesinskis, K.; Mikelsone, E.; Brizga, J. Does car sharing contribute to urban sustainability from user-motivation perspectives? Sustainability 2021, 13, 10588. [Google Scholar] [CrossRef]
- Manca, F.; Sivakumar, A.; Polak, J.W. The effect of social influence and social interactions on the adoption of a new technology: The use of bike sharing in a student population. Transp. Res. Part C Emerg. Technol. 2019, 105, 611–625. [Google Scholar] [CrossRef]
- Wang, T.; Li, H.; Xiao, B.; Wei, D. Policy Analysis and Implementation Impact of government subsidies on shared-bikes operation mode using system dynamics methodology: A case of Mobike in China. Simulation 2021, 97, 589–599. [Google Scholar] [CrossRef]
- Tirachini, A.; Chaniotakis, E.; Abouelela, M.; Antoniou, C. The sustainability of shared mobility: Can a platform for shared rides reduce motorized traffic in cities? Transp. Res. Part C Emerg. Technol. 2020, 117, 102707. [Google Scholar] [CrossRef]
- Cantelmo, G.; Amini, R.E.; Monteiro, M.M.; Frenkel, A.; Lerner, O.; Tavory, S.S.; Galtzur, A.; Kamargianni, M.; Shiftan, Y.; Behrischi, C. Aligning users’ and stakeholders’ needs: How incentives can reshape the carsharing market. Transp. Policy 2022, 126, 306–326. [Google Scholar] [CrossRef]
- Schönauer, R.; Stubenschrott, M.; Huang, W.; Rudloff, C.; Fellendorf, M. Modeling concepts for mixed traffic: Steps toward a microscopic simulation tool for shared space zones. Transp. Res. Rec. 2012, 2316, 114–121. [Google Scholar] [CrossRef]
- Caulfield, B.; O’Mahony, M.; Brazil, W.; Weldon, P. Examining usage patterns of a bike-sharing scheme in a medium sized city. Transp. Res. Part A Policy Pract. 2017, 100, 152–161. [Google Scholar] [CrossRef]
- Wu, X.; Lin, J.; Yang, Y.; Guo, J. A digital decision approach for scheduling process planning of shared bikes under Internet of Things environment. Appl. Soft Comput. 2023, 133, 109934. [Google Scholar] [CrossRef]
- Zhuang, D.; Jin, J.G.; Shen, Y.; Jiang, W. Understanding the bike sharing travel demand and cycle lane network: The case of Shanghai. Int. J. Sustain. Transp. 2021, 15, 111–123. [Google Scholar] [CrossRef]
- Foletta, N.; Nielson, C.; Patton, J.; Parks, J.; Rees, R. Green shared lane markings on urban arterial in Oakland, California: Evaluation of super sharrows. Transp. Res. Rec. 2015, 2492, 61–68. [Google Scholar] [CrossRef]
- Larsen, J. Bicycle parking and locking: Ethnography of designs and practices. Mobilities 2017, 12, 53–75. [Google Scholar] [CrossRef]
- Van der Spek, S.C.; Scheltema, N. The importance of bicycle parking management. Res. Transp. Bus. Manag. 2015, 15, 39–49. [Google Scholar] [CrossRef]
- Chen, Z.; Hu, Y.; Li, J.; Wu, X. Optimal deployment of electric bicycle sharing stations: Model formulation and solution technique. Netw. Spat. Econ. 2020, 20, 99–136. [Google Scholar] [CrossRef]
- Shen, Y.; Zhang, H.; Zhao, J. Integrating shared autonomous vehicle in public transportation system: A supply-side simulation of the first-mile service in Singapore. Transp. Res. Part A Policy Pract. 2018, 113, 125–136. [Google Scholar] [CrossRef]
- Bi, H.; Ye, Z.; Zhang, Y. Analysis of the integration usage patterns of multiple shared mobility modes and metro system. Transp. Res. Rec. 2021, 2675, 876–894. [Google Scholar] [CrossRef]
- Ghosh, S.; Varakantham, P.; Adulyasak, Y.; Jaillet, P. Dynamic repositioning to reduce lost demand in bike sharing systems. J. Artif. Intell. Res. 2017, 58, 387–430. [Google Scholar] [CrossRef]
- Pfrommer, J.; Warrington, J.; Schildbach, G.; Morari, M. Dynamic vehicle redistribution and online price incentives in shared mobility systems. IEEE Trans. Intell. Transp. Syst. 2014, 15, 1567–1578. [Google Scholar] [CrossRef]
- Zhang, D.; Yu, C.; Desai, J.; Lau, H.; Srivathsan, S. A time-space network flow approach to dynamic repositioning in bicycle sharing systems. Transp. Res. Part B Methodol. 2017, 103, 188–207. [Google Scholar] [CrossRef]
- Chang, X.; Feng, Z.; Wu, J.; Sun, H.; Wang, G.; Bao, X. Understanding and predicting the short-term passenger flow of station-free shared bikes: A spatiotemporal deep learning approach. IEEE Intell. Transp. Syst. Mag. 2021, 14, 73–85. [Google Scholar] [CrossRef]
- Barnett, J.; Gizinski, N.; Mondragón-Parra, E.; Siegel, J.; Morris, D.; Gates, T.; Kassens-Noor, E.; Savolainen, P. Automated vehicles sharing the road: Surveying detection and localization of pedalcyclists. IEEE Trans. Intell. Veh. 2020, 6, 649–664. [Google Scholar] [CrossRef]
- Di Dio, S.; La Gennusa, M.; Peri, G.; Rizzo, G.; Vinci, I. Involving people in the building up of smart and sustainable cities: How to influence commuters’ behaviors through a mobile app game. Sustain. Cities Soc. 2018, 42, 325–336. [Google Scholar] [CrossRef]
- Du, M.; Cheng, L.; Li, X.; Yang, J. Investigating the influential factors of shared travel behavior: Comparison between app-based third taxi service and free-floating bike sharing in Nanjing, China. Sustainability 2019, 11, 4318. [Google Scholar] [CrossRef]
- Kaviti, S.; Venigalla, M.M.; Lucas, K. Travel behavior and price preferences of bikesharing members and casual users: A Capital Bikeshare perspective. Travel Behav. Soc. 2019, 15, 133–145. [Google Scholar] [CrossRef]
- Zhi, D.; Sun, H.; Lv, Y.; Xu, G. Quantifying the comprehensive benefit of the bike-sharing system under cycling behavior differences. J. Clean. Prod. 2022, 379, 134660. [Google Scholar] [CrossRef]
- Rodriguez, D.B.; Shoked, N. Comparative Local Government Law in Motion: How Different Local Government Law Regimes Affects Global Cities’ Bike Share Plans. Fordham Urb. LJ 2014, 42, 123. [Google Scholar]
- Castellanos, S.; Wright, K.; Grant-Muller, S. Governing shared mobility: A comparison of the public policy goals being pursued in three cities. Transportation 2024, 1–28. [Google Scholar] [CrossRef]
- Li, M.; Zeng, Z.; Wang, Y. An innovative car sharing technological paradigm towards sustainable mobility. J. Clean. Prod. 2021, 288, 125626. [Google Scholar] [CrossRef]
- Zhang, D.; Shi, Y.; Li, W. China’s sharing economy of mobility industry: From perspective of industrial ecosystem. Sustainability 2019, 11, 7130. [Google Scholar] [CrossRef]
- Narang, N.K. Mentor’s Musings on Standardization Imperatives for the Connected Vehicles for Seamless Integration in Sustainable Mobility. IEEE Internet Things Mag. 2022, 5, 4–8. [Google Scholar] [CrossRef]
- Gansterer, M.; Hartl, R.F.; Wieser, S. Assignment constraints in shared transportation services. Ann. Oper. Res. 2021, 305, 513–539. [Google Scholar] [CrossRef]
- Shaheen, S.A.; Guzman, S.; Zhang, H. Bikesharing in Europe, the Americas, and Asia: Past, present, and future. Transp. Res. Rec. 2010, 2143, 159–167. [Google Scholar] [CrossRef]
- Mao, G.; Hou, T.; Liu, X.; Zuo, J.; Kiyawa, A.-H.I.; Shi, P.; Sandhu, S. How can bicycle-sharing have a sustainable future? A research based on life cycle assessment. J. Clean. Prod. 2021, 282, 125081. [Google Scholar] [CrossRef]
- Luo, H.; Kou, Z.; Zhao, F.; Cai, H. Comparative life cycle assessment of station-based and dock-less bike sharing systems. Resour. Conserv. Recycl. 2019, 146, 180–189. [Google Scholar] [CrossRef]
- Lai, X.; Sun, Z.; Liu, J.; Wu, G. Resource recycle efficiency improvement analysis for sharing bicycles: Value chain perspective. J. Clean. Prod. 2020, 255, 120284. [Google Scholar] [CrossRef]
- Zhang, Z.; Guo, Y.; Feng, L. Externalities of dockless bicycle-sharing systems: Implications for green recovery of the transportation sector. Econ. Anal. Policy 2022, 76, 410–419. [Google Scholar] [CrossRef]
- Zhang, B.; Yi, Y.; Fletcher-Chen, C.C.-Y.; Zou, P.; Wang, Z. Sustainable operations in electric vehicles’ sharing: Behavioral patterns and carbon emissions with digital technologies. Ann. Oper. Res. 2023, 1–24. [Google Scholar] [CrossRef]
- Zhou, Y.; Yu, Y.; Wang, Y.; He, B.; Yang, L. Mode substitution and carbon emission impacts of electric bike sharing systems. Sustain. Cities Soc. 2023, 89, 104312. [Google Scholar] [CrossRef]
- Eren, E.; Uz, V.E. A review on bike-sharing: The factors affecting bike-sharing demand. Sustain. Cities Soc. 2020, 54, 101882. [Google Scholar] [CrossRef]
- Hu, J.-W.; Creutzig, F. A systematic review on shared mobility in China. Int. J. Sustain. Transp. 2022, 16, 374–389. [Google Scholar] [CrossRef]
- Lou, L.; Li, L.; Yang, S.-B.; Koh, J. Promoting user participation of shared mobility in the sharing economy: Evidence from chinese bike sharing services. Sustainability 2021, 13, 1533. [Google Scholar] [CrossRef]
- Ban, S.; Hyun, K.H. Designing a user participation-based bike rebalancing service. Sustainability 2019, 11, 2396. [Google Scholar] [CrossRef]
- Huétink, F.J.; van der Vooren, A.; Alkemade, F. Initial infrastructure development strategies for the transition to sustainable mobility. Technol. Forecast. Soc. Chang. 2010, 77, 1270–1281. [Google Scholar] [CrossRef]
- Arbeláez Vélez, A.M. Environmental impacts of shared mobility: A systematic literature review of life-cycle assessments focusing on car sharing, carpooling, bikesharing, scooters and moped sharing. Transp. Rev. 2024, 44, 634–658. [Google Scholar] [CrossRef] [PubMed]
- Sushil. Interpreting the interpretive structural model. Glob. J. Flex. Syst. Manag. 2012, 13, 87–106. [Google Scholar] [CrossRef]
- Yen, B.T.; Tseng, W.-C.; Chiou, Y.-C.; Lan, L.W.; Mulley, C.; Burke, M. Effects of two fare policies on public transport travel behaviour: Evidence from South East Queensland, Australia. J. East. Asia Soc. Transp. Stud. 2015, 11, 425–443. [Google Scholar]
- Gärling, T.; Schuitema, G. Travel demand management targeting reduced private car use: Effectiveness, public acceptability and political feasibility. J. Soc. Issues 2007, 63, 139–153. [Google Scholar] [CrossRef]
- Yen, B.T.; Mulley, C.; Meza, G. How do soft factors influence take-up of gamified travel demand management schemes in public transport: An investigation in Gold Coast, Australia. Res. Transp. Bus. Manag. 2023, 47, 100954. [Google Scholar] [CrossRef]
- Brög, W.; Erl, E.; Ker, I.; Ryle, J.; Wall, R. Evaluation of voluntary travel behaviour change: Experiences from three continents. Transp. Policy 2009, 16, 281–292. [Google Scholar] [CrossRef]
- Ruiz, T.; García-Garcés, P. Variations on timing decisions after participating in Travel Behavior Change Programs. Procedia-Soc. Behav. Sci. 2014, 160, 625–633. [Google Scholar] [CrossRef]
- Black, C.S.; Schreffler, E.N. Understanding transport demand management and its role in delivery of sustainable urban transport. Transp. Res. Rec. 2010, 2163, 81–88. [Google Scholar] [CrossRef]
- Babb, C.; Smith, B. The Travel Demand Management Matrix: An International Review of Tdm Instruments; The University of Western Australia: Crawley, Australia, 2014. [Google Scholar]
- Turoń, K.; Czech, P.; Tóth, J. Safety and Security Aspects in Shared Mobility Systems. Sci. J. Silesian Univ. Technol. Ser. Transp. 2019, 104, 169–175. [Google Scholar] [CrossRef]
- Peters, A.S.; Brown, S.A.; Chang, K.; Thorton, K.N.; Shinohara, K.; Beddoes, K.D. Refinement and dissemination of a digital platform for sharing transportation education materials. In Proceedings of the 2015 ASEE Annual Conference & Exposition, Seattle, WA, USA, 14–17 June 2015; pp. 26, 1321–1326. [Google Scholar]
- Shi, X.; Wang, Y.; Lv, F.; Liu, W.; Seng, D.; Lin, F. Finding communities in bicycle sharing system. J. Vis. 2019, 22, 1177–1192. [Google Scholar] [CrossRef]
- Braun, L.M.; Rodriguez, D.A.; Cole-Hunter, T.; Ambros, A.; Donaire-Gonzalez, D.; Jerrett, M.; Mendez, M.A.; Nieuwenhuijsen, M.J.; de Nazelle, A. Short-term planning and policy interventions to promote cycling in urban centers: Findings from a commute mode choice analysis in Barcelona, Spain. Transp. Res. Part A Policy Pract. 2016, 89, 164–183. [Google Scholar] [CrossRef]
- Zaman, H.; Habib, K.M.N. Commuting mode choice in the context of travel demand management (TDM) policies: An empirical investigation in Edmonton, Alberta. Can. J. Civ. Eng. 2011, 38, 433–443. [Google Scholar] [CrossRef]
- May, A.D. Encouraging good practice in the development of Sustainable Urban Mobility Plans. Case Stud. Transp. Policy 2015, 3, 3–11. [Google Scholar] [CrossRef]
- Liu, Z.; Li, R.; Dai, J. Effects and feasibility of shared mobility with shared autonomous vehicles: An investigation based on data-driven modeling approach. Transp. Res. Part A Policy Pract. 2022, 156, 206–226. [Google Scholar] [CrossRef]
- Yue, J.; Long, Y.; Wang, S.; Liang, H. Optimization of Shared Electric Scooter Deployment Stations Based on Distance Tolerance. ISPRS Int. J. Geo-Inf. 2024, 13, 147. [Google Scholar] [CrossRef]
- Li, X.-Y.; Huang, S.-W.; Lin, Q.; Lu, Q.-J.; Zhang, Y.-S. A study on the factors influencing the intention and behavior deviation of rural residents in waste separation—Based on LOGIT-ISM-MICMAC combination model. Sustainability 2022, 14, 15481. [Google Scholar] [CrossRef]

| Investment Entity | Mobility Mode | Mobility Case | Mobility Characteristics | Recommend |
|---|---|---|---|---|
| Government | Public bicycles | Municipal public bicycle | Swipe card rental, fixed pick-up and change points. The number is small. | Wang H [8] |
| Public bus | Bus BRT | The number of buses in the city is enormous, and the lines cover the entire corner, providing great convenience for residents to travel. However, rush hour is crowded, and it cannot take passengers at any time and everywhere. | Shi J [9] | |
| Public rail transit | Subway Light rail | Efficient, fast, large volume, and can effectively alleviate urban traffic congestion. The construction cost is high, the cycle is long, and a lot of money and time needs to be invested in planning and construction. | Li F [10], Hu W [11] | |
| Company | Shared bicycles | Meituan Bike Hello Bike Green Orange Bike | Helps to reduce carbon emissions and protect the environment. Convenient, fast, and economical. However, the shared bicycles are parked at will, affecting urban order and beauty. Due to frequent use and improper maintenance, some shared bicycles have been damaged, affecting the user experience. | Cao M [12] |
| Shared electric vehicles | DIDI Green orange Liubike | Does not produce exhaust emissions and helps to reduce air pollution and reduce carbon emissions, in line with the concept of green travel. Sharing electric vehicles can help alleviate urban traffic congestion and improve road efficiency. The battery life of shared electric vehicles is limited, the battery capacity is generally small, and the driving range is limited. | Campbell A A [13], Wang J [14] | |
| Shared car | Shouqi Gofun Panda car | Car sharing reduces the need for private cars and helps alleviate the problem of urban traffic congestion. While car sharing offers a convenient rental service, parking and picking up may still be inconvenient in some areas or periods. | Ren X [15] | |
| Individual | Ride sharing | Didi Chuxing Cao Cao Chuxing | Carpooling realizes the sharing of vehicle seat resources, which helps to reduce the empty driving rate and improve the efficiency of vehicle use. Once the carpooling scheme is determined, both passengers and owners need to travel according to the agreed time and route, and the flexibility is relatively poor. | Yao D [16] |
| Private ride | Carpooling groups through social software (WeChat, QQ) | The relatively fixed ride area is convenient for people to use the relatively fixed ride area, and the ride time is relatively flexible. Because social software carpooling involves communication and interaction between strangers, there are certain security risks. | Xu D [17], Dong X [18] |
| Release Time | Policy Issuing Unit | Policy Name | Main Content |
|---|---|---|---|
| 2023 | Ministry of Transport | Some opinions on promoting the healthy and sustainable development of urban public transport | Urban public transportation is an important part of the urban comprehensive transportation system, which is intensive and efficient, green, and produces low carbon emissions. Give priority to the development of urban public transport, promote shared transportation modes, and alleviate urban traffic congestion. |
| 2022 | Scientific Research Institute of Ministry of Transport | China Shared Mobility Development Report | From a multidisciplinary perspective, in the form of an annual report, this paper objectively describes the development of the main types of shared mobility in China, points out existing problems, puts forwards countermeasures and suggestions, provides readers with a more three-dimensional overall picture of shared mobility, and provides decision support for promoting the development of the shared mobility industry. |
| 2022 | The State Council | The 14th Five-Year Plan for the development of a modern comprehensive transportation system | The healthy development of the northern share car, car sharing, and embroidery and final goods delivery platform in the Tiang district to prevent disorderly expansion. We will accelerate the development of new models and new business forms of “internet plus” efficient logistics. |
| 2020 | National Development and Reform Commission | Opinions on Supporting the Healthy Development of New Business Forms and Models, Activating the Consumer Market, and Expanding Employment | China encourages intelligent product upgrading and business model innovation in shared mobility, food delivery, group buying, online medicine purchase, shared accommodation, cultural tourism, and other fields, develops new ways of living consumption, and cultivates high-end online brands. |
| 2019 | The State Council | Outline for Building a Powerful Country in Transportation | By 2035, China will basically build transportation power and form a “national 123 travel and transportation circle”, with convenient and smooth passenger connection transportation and efficient and economical multimodal transport of goods. The development level of intelligent, safe, green, and shared transportation has been significantly improved. |
| 2019 | National Development and Reform Commission | Green Industry Guidance Catalogue (2019 edition) | Carry out the construction and operation of shared transportation facilities, including the construction and operation of public rental bicycles, internet rental bicycles, internet rental electric bicycles, internet rental cars, car time-sharing rental systems, three-dimensional parking facilities and equipment, and bicycle parking facilities. |
| 2017 | Ministry of Transport | Guiding Opinions on Encouraging and Regulating the Development of Internet Rental Bicycles | The guidelines affirm the positive role of the development of internet rental bicycles (commonly known as “shared bicycles”) in facilitating the short distance travel of the masses and building a green and low-carbon transportation system. The guidelines propose to encourage and regulate the development of shared bicycles in accordance with the basic principles of “service-oriented reform and innovation, standardized and orderly territorial management, and multiparty governance”. |
| The Main Categories of Shared Mobility | Influencing Factors of User Behavior | ||
|---|---|---|---|
| Psychological Factors | Situational Factors | Sociodemographic Characteristics | |
| Shared bicycles | Moral standards [35], Time perception [30], Health benefits [36], Safety perception [37] | Developed infrastructure [33], close to other public transportation [38], Information and Communication Technology (ICT) [34], Environmental Protection [39] | 1. The use of shared bicycles by tourists in scenic spots mainly depends on behavioral control and attitude [40]. 2. Male users are more willing to use shared bicycles [41]. 3. The user is young, highly educated, and has a clear willingness to use [27]. 4. Company employees and college students are the main users [42]. |
| Shared electric vehicles | Attitude [43], Saving time [44], Enjoyment [45], Subjective norms [46], Usability [47], Reliability [3] | Low cost [48], Higher fleet density [49] | 1. Elderly and female users have a lower willingness to use it [50,51]. 2. Highly educated communities use it more commonly [52]. |
| Shared car | Waiting time [53], Innovative personality traits [54], Environmental awareness [29] | Privacy concerns [55], Price [56], Business and personal interests [57], Regulatory framework [32], Shared Mobility services [58], Parking conventions [59] | The usage rate is higher among males than females [29]. People in higher education are more willing to use shared cars [28]. Young people use it more frequently than older people [25]. Residents living in the suburbs often use shared cars [60]. |
| Ride Sharing | Trust (peer ratings, members’ personal information, and trip amounts) [31], Social experience (Sharing a ride with like-minded people) [61] | Price [62], Consumption habits [63], Travel distance [64], City and population density [65], Environmental protection [66] | Low income and disadvantaged transportation groups prefer to use Ride Sharing [26]. Young and highly educated individuals use ride hailing services [66]. Women are more inclined to use carpooling services than men [67]. |
| Expert Evaluation | Influence Value | Triangular Fuzzy Number |
|---|---|---|
| No impact | 0 | (0, 0, 0.25) |
| Very low impact | 1 | (0, 0.25, 0.5) |
| Low impact | 2 | (0.25, 0.5, 0.75) |
| High impact | 3 | (0.5, 0.75, 1.0) |
| Very High impact | 4 | (0.75, 1.0, 1.0) |
| Num. | Factors | Explanation | Recommend |
|---|---|---|---|
| 1 | Shared mobility education | Increase the content of environmental protection and green travel, cultivate environmental awareness, and develop the habit of green travel. | Yin Y [99], Steffen J [100], Nikitas A [21] |
| 2 | Shared mobility publicity | Promote the contribution of shared mobility to environmental protection through multiple channels such as media, social platforms, and community activities, and enhance the public’s environmental awareness and willingness to use. | Yunus E [22], Taniguchi A [101], Rastogi R [102], Sun F [103] |
| 3 | Shared mobility “environment” information | Add green landscape, environmental protection information, green travel information, etc., to remind users of the environmental significance of choosing shared mobility. | Chen S Y [104], Chevalier A [105], Gamble J [106] |
| 4 | Shared mobility health database | Research and development of shared mobility technology, the implementation of healthy city healthy travel data, and promoting the development of health-friendly cities. | Caravaggi L [107], Gkoumas K [108], Zhu J [109] |
| 5 | Improve health | By promoting shared mobility, especially the benefits of shared bicycles on cardiovascular health, weight loss, and physical fitness, more users will be attracted to choose shared mobility. | Chen Y [110], Otero I [111] |
| 6 | Community organization and advocacy | Organize community shared mobility activities to enhance residents’ recognition and interest in shared mobility. | Wilhoit E D [112], Cohen B [23], Ricci M [113]. |
| 7 | Organizational interaction | Strengthen the sustainable development of urban travel through social, organizational, social media, and other interactive ways. | Mavlutova I [114], Manca F [115] |
| 8 | Financial subsidy | The government provides financial subsidies or tax incentives to reduce the cost of shared mobility and attract more users. | Wang T [116], Cohen B [23] |
| 9 | Shared mobility rewards | Develop a green shared mobility plan, allowing users to accumulate travel rewards through shared mobility, which can be exchanged for rewards or concessions. | Tirachini A [117], Cantelmo G [118] |
| 10 | Transportation planning and measures | Supporting urban transportation planning and transportation measures, supporting shared mobility and green travel. | Schönauer R [119], Caulfield B [120], Wu X [121] |
| 11 | Dedicated lane | Build and maintain high-quality shared mobility lanes, especially shared bike lanes, to meet the demand for green travel and ensure cycling safety. | Zhuang D [122], Foletta N [123] |
| 12 | Parking facility | Set up intelligent parking points, provide convenient parking services, and reduce the problem of disorderly parking of shared mobility tools. | Larsen J [124], Van der Spek S C [125], Chen Z [126] |
| 13 | Integration of transportation facilities | The integrated use of a variety of transportation means provides convenient transfer services and improves user travel efficiency. | Shen Y [127], Bi H [128] |
| 14 | Operation technology of shared mobility | Develop various operational technologies to cope with shared mobility and promote the implementation of shared mobility and green travel from the technical level. | Ghosh S [129], Ricci M [113], Pfrommer J [130], Zhang D [131], |
| 15 | User detection technology | Big data is used to detect users, optimize the delivery and scheduling strategies of shared mobility tools, and improve resource utilization efficiency. | Chang X [132], Barnett J [133] |
| 16 | The use effect of the application | Shared mobility application effect evaluation and improvement. | Di Dio S [134], Du M [135] |
| 17 | Diversified payment methods | Provides a variety of payment methods for the convenient use of users, and effectively improves the efficiency of enterprises. | Kaviti S [136], Zhi D [137] |
| 18 | Promulgation of laws and regulations | Relevant policies and regulations formulated by the government play a decisive role in the legality, operation norms, and safety standards of shared mobility. The stability and foresight of policies directly affect the long-term development of the industry. | Rodriguez D B [138], Castellanos S [139] |
| 19 | Cross-industry cooperation | The cross-border cooperation between shared mobility and urban planning, public transportation, energy, real estate, and other fields will help form a more complete transportation ecosystem and promote resource sharing and efficient use. | Li M [140], Zhang D [141] |
| 20 | Standardization and normalization | The establishment of unified industry standards and norms will help improve service quality, reduce vicious competition, and promote the healthy and orderly development of the shared mobility market. | Narang N K [142], Su Y S [24] |
| 21 | Cost control | Shared mobility platforms need to effectively control operating costs, including vehicle acquisition, maintenance, insurance, personnel salaries, and technology research and development investment. By adopting more efficient vehicle scheduling algorithms, optimizing vehicle configuration, reducing energy consumption, and other means, unit operating costs can be reduced and profitability improved. | Campbell A A [13], Gansterer M [143] |
| 22 | Internationalization strategy and globalization layout | With the in-depth development of globalization, the shared mobility platform has begun to implement the internationalization strategy and a global layout. They enter overseas markets and expand their business by setting up branches abroad, partnering with or acquiring local companies. | Shaheen S A [144] |
| 23 | Recycling and reuse | Establish the recycling and reuse mechanism of shared mobility tools to reduce resource waste. | Mao G [145], Luo H [146], Lai X [147] |
| 24 | Low-carbon operation | Reduce carbon emissions during operations and establish sustainable operating mechanisms. | Zhang Z [148], Zhang B [149], Zhou Y [150] |
| 25 | User feedback | Establish an effective user feedback mechanism to solve user problems in time and improve user satisfaction. | Eren E [151], Hu J W [152] |
| 26 | User participation | Users are invited to participate in the design and service of shared mobility tools to enhance the sense of belonging and enthusiasm of users. | Lou L [153], Ban S [154] |
| Expert | Department | Working Years | Familiarity |
|---|---|---|---|
| Mr. Zhang | Traffic management department | 8 | More familiar |
| Mr. Wang | Traffic management department | 6 | Very familiar |
| Ms. Li | Traffic management department | 5 | Very familiar |
| Mr. Zhang | Traffic police group | 7 | More familiar |
| Ms. Zhao | Traffic police group | 4 | Familiar |
| Mr. Sun | Didi Chuxing | 3 | Familiar |
| Mr. Qian | Didi Chuxing | 6 | Very familiar |
| Mr. Li | Gofun | 5 | Very familiar |
| Mr. Wang | Meituan | 4 | Familiar |
| Mr. Zhou | Meituan | 7 | More familiar |
| Dimensions | Coding | Factors |
|---|---|---|
| 1. Shared mobility education | A1 | Shared mobility education |
| A2 | Shared mobility publicity | |
| A3 | Shared mobility “environment” information | |
| 2. Travel health | B1 | Shared mobility health database |
| B2 | Improve health | |
| 3. Community organization | C1 | Community organization and advocacy |
| C2 | Organizational interaction | |
| 4. Government policies and incentives | D1 | Financial subsidy |
| D2 | Shared mobility rewards | |
| D3 | Transportation planning and measures | |
| 5. Infrastructure construction | E1 | Dedicated lane |
| E2 | Parking facility | |
| E3 | Integration of transportation facilities | |
| 6. Intelligent technology | F1 | Operation technology of shared mobility |
| F2 | User detection technology | |
| 7. APP function optimization | G1 | The use effect of the application |
| G2 | Diversified payment methods | |
| 8. Social responsibility | H1 | Recycling and reuse |
| H2 | Low-carbon operation | |
| 9. User behavior | I1 | User feedback |
| I2 | User participation |
| Gender | Number | Percentage |
|---|---|---|
| Male | 18 | 60% |
| Female | 12 | 40% |
| Age group | ||
| 18 to 25 | 11 | 37% |
| 26–35 | 7 | 23% |
| Over 35 | 12 | 40% |
| Educational background | ||
| Junior college | 1 | 3% |
| Undergraduate course | 19 | 63% |
| Master’s degree or above | 10 | 34% |
| income | ||
| 1000–3000. | 1 | 3% |
| 3000–5000. | 8 | 27% |
| More than 5000 | 21 | 70% |
| The number of shared mobility services used per week | ||
| 1–5 times | 17 | 57% |
| 6 to 10 times | 10 | 33% |
| More than 10 times | 3 | 10% |
| Position | ||
| Public officer in traffic management department | 10 | 33% |
| Manager of shared mobility operating company | 10 | 33% |
| Shared mobility research expert | 10 | 33% |
| A1 | A2 | A3 | B1 | B2 | C1 | C2 | D1 | D2 | D3 | E1 | E2 | E3 | F1 | F2 | G1 | G2 | H1 | H2 | I1 | I2 | |
|---|---|---|---|---|---|---|---|---|---|---|---|---|---|---|---|---|---|---|---|---|---|
| A1 | 0 | 0.75 | 0.70 | 0.71 | 0.66 | 0.64 | 0.68 | 0.67 | 0.73 | 0.66 | 0.78 | 0.70 | 0.82 | 0.73 | 0.73 | 0.72 | 0.63 | 0.72 | 0.65 | 0.68 | 0.79 |
| A2 | 0.73 | 0 | 0.76 | 0.62 | 0.62 | 0.67 | 0.71 | 0.73 | 0.68 | 0.63 | 0.75 | 0.66 | 0.70 | 0.62 | 0.52 | 0.45 | 0.54 | 0.65 | 0.56 | 0.75 | 0.88 |
| A3 | 0.70 | 0.69 | 0 | 0.62 | 0.54 | 0.53 | 0.59 | 0.81 | 0.52 | 0.76 | 0.77 | 0.62 | 0.83 | 0.48 | 0.52 | 0.57 | 0.57 | 0.80 | 0.61 | 0.67 | 0.76 |
| B1 | 0.62 | 0.61 | 0.66 | 0 | 0.62 | 0.52 | 0.59 | 0.76 | 0.62 | 0.69 | 0.80 | 0.81 | 0.80 | 0.79 | 0.82 | 0.67 | 0.69 | 0.67 | 0.76 | 0.66 | 0.69 |
| B2 | 0.58 | 0.61 | 0.51 | 0.61 | 0 | 0.59 | 0.62 | 0.67 | 0.66 | 0.64 | 0.76 | 0.69 | 0.59 | 0.45 | 0.55 | 0.68 | 0.63 | 0.69 | 0.70 | 0.69 | 0.75 |
| C1 | 0.58 | 0.68 | 0.60 | 0.64 | 0.58 | 0 | 0.60 | 0.64 | 0.68 | 0.71 | 0.63 | 0.69 | 0.70 | 0.55 | 0.55 | 0.63 | 0.55 | 0.69 | 0.56 | 0.75 | 0.69 |
| C2 | 0.62 | 0.66 | 0.61 | 0.64 | 0.60 | 0.68 | 0 | 0.73 | 0.71 | 0.75 | 0.73 | 0.84 | 0.77 | 0.55 | 0.59 | 0.70 | 0.62 | 0.73 | 0.72 | 0.70 | 0.74 |
| D1 | 0.62 | 0.62 | 0.60 | 0.69 | 0.53 | 0.62 | 0.72 | 0 | 0.87 | 0.80 | 0.83 | 0.86 | 0.73 | 0.76 | 0.72 | 0.72 | 0.69 | 0.67 | 0.72 | 0.73 | 0.83 |
| D2 | 0.64 | 0.70 | 0.61 | 0.68 | 0.64 | 0.71 | 0.63 | 0.66 | 0 | 0.66 | 0.73 | 0.76 | 0.73 | 0.59 | 0.61 | 0.73 | 0.78 | 0.55 | 0.68 | 0.73 | 0.78 |
| D3 | 0.66 | 0.71 | 0.62 | 0.74 | 0.73 | 0.66 | 0.67 | 0.68 | 0.57 | 0 | 0.84 | 0.83 | 0.83 | 0.75 | 0.65 | 0.53 | 0.69 | 0.64 | 0.76 | 0.76 | 0.64 |
| E1 | 0.59 | 0.69 | 0.77 | 0.74 | 0.63 | 0.60 | 0.55 | 0.71 | 0.68 | 0.88 | 0 | 0.88 | 0.90 | 0.64 | 0.78 | 0.67 | 0.52 | 0.72 | 0.69 | 0.70 | 0.69 |
| E2 | 0.62 | 0.66 | 0.61 | 0.68 | 0.63 | 0.76 | 0.66 | 0.70 | 0.61 | 0.83 | 0.81 | 0 | 0.73 | 0.69 | 0.60 | 0.73 | 0.55 | 0.57 | 0.70 | 0.69 | 0.64 |
| E3 | 0.62 | 0.67 | 0.55 | 0.61 | 0.67 | 0.63 | 0.55 | 0.69 | 0.74 | 0.83 | 0.79 | 0.75 | 0 | 0.60 | 0.58 | 0.83 | 0.67 | 0.66 | 0.66 | 0.74 | 0.72 |
| F1 | 0.67 | 0.66 | 0.62 | 0.72 | 0.63 | 0.59 | 0.53 | 0.68 | 0.61 | 0.79 | 0.82 | 0.87 | 0.69 | 0 | 0.68 | 0.75 | 0.78 | 0.73 | 0.64 | 0.73 | 0.73 |
| F2 | 0.66 | 0.62 | 0.48 | 0.80 | 0.53 | 0.59 | 0.52 | 0.68 | 0.53 | 0.79 | 0.63 | 0.68 | 0.66 | 0.68 | 0 | 0.76 | 0.72 | 0.69 | 0.64 | 0.78 | 0.75 |
| G1 | 0.48 | 0.55 | 0.52 | 0.70 | 0.50 | 0.54 | 0.52 | 0.70 | 0.72 | 0.80 | 0.65 | 0.69 | 0.67 | 0.64 | 0.77 | 0 | 0.75 | 0.61 | 0.56 | 0.77 | 0.73 |
| G2 | 0.62 | 0.60 | 0.53 | 0.58 | 0.60 | 0.55 | 0.49 | 0.60 | 0.77 | 0.55 | 0.52 | 0.66 | 0.51 | 0.61 | 0.62 | 0.66 | 0 | 0.51 | 0.48 | 0.74 | 0.72 |
| H1 | 0.77 | 0.77 | 0.61 | 0.64 | 0.55 | 0.67 | 0.56 | 0.63 | 0.64 | 0.68 | 0.57 | 0.59 | 0.63 | 0.62 | 0.62 | 0.52 | 0.53 | 0 | 0.69 | 0.64 | 0.53 |
| H2 | 0.64 | 0.80 | 0.75 | 0.59 | 0.63 | 0.58 | 0.64 | 0.62 | 0.60 | 0.68 | 0.68 | 0.73 | 0.64 | 0.70 | 0.66 | 0.52 | 0.60 | 0.84 | 0 | 0.58 | 0.69 |
| I1 | 0.70 | 0.67 | 0.66 | 0.66 | 0.69 | 0.55 | 0.59 | 0.64 | 0.63 | 0.76 | 0.73 | 0.76 | 0.69 | 0.72 | 0.71 | 0.77 | 0.70 | 0.63 | 0.70 | 0 | 0.80 |
| I2 | 0.70 | 0.72 | 0.66 | 0.69 | 0.66 | 0.61 | 0.59 | 0.72 | 0.66 | 0.71 | 0.70 | 0.82 | 0.76 | 0.72 | 0.68 | 0.83 | 0.78 | 0.69 | 0.64 | 0.80 | 0 |
| Influencing Degree | Influenced Degree | Centrality Degree | Causality Degree | Rank | Factor Attribute | |
|---|---|---|---|---|---|---|
| A1 | 15.76 | 14.36 | 30.12 | 1.40 | 9 | Causality factor |
| A2 | 14.84 | 15.01 | 29.85 | −0.17 | 12 | Outcome factor |
| A3 | 14.51 | 13.96 | 28.47 | 0.55 | 18 | Causality factor |
| B1 | 15.47 | 14.92 | 30.39 | 0.55 | 8 | Causality factor |
| B2 | 14.19 | 13.76 | 27.95 | 0.43 | 21 | Causality factor |
| C1 | 14.22 | 13.78 | 28.00 | 0.45 | 19 | Causality factor |
| C2 | 15.30 | 13.51 | 28.81 | 1.79 | 17 | Causality factor |
| D1 | 15.98 | 15.30 | 31.29 | 0.68 | 5 | Causality factor |
| D2 | 15.17 | 14.77 | 29.93 | 0.40 | 11 | Causality factor |
| D3 | 15.57 | 16.28 | 31.85 | −0.71 | 2 | Outcome factor |
| E1 | 15.67 | 16.18 | 31.85 | −0.51 | 3 | Outcome factor |
| E2 | 15.06 | 16.57 | 31.63 | −1.51 | 4 | Outcome factor |
| E3 | 15.15 | 16.03 | 31.18 | −0.88 | 7 | Outcome factor |
| F1 | 15.52 | 14.47 | 29.99 | 1.05 | 10 | Causality factor |
| F2 | 14.77 | 14.52 | 29.28 | 0.25 | 15 | Causality factor |
| G1 | 14.42 | 15.02 | 29.45 | −0.60 | 13 | Outcome factor |
| G2 | 13.41 | 14.55 | 27.95 | −1.14 | 20 | Outcome factor |
| H1 | 13.98 | 14.98 | 28.96 | −1.01 | 16 | Outcome factor |
| H2 | 14.71 | 14.70 | 29.41 | 0.01 | 14 | Causality factor |
| I1 | 15.34 | 15.93 | 31.27 | −0.59 | 6 | Outcome factor |
| I2 | 15.74 | 16.18 | 31.92 | −0.44 | 1 | Outcome factor |
| A1 | A2 | A3 | B1 | B2 | C1 | C2 | D1 | D2 | D3 | E1 | E2 | E3 | F1 | F2 | G1 | G2 | H1 | H2 | I1 | I2 | |
|---|---|---|---|---|---|---|---|---|---|---|---|---|---|---|---|---|---|---|---|---|---|
| A1 | 1 | 1 | 1 | 1 | 1 | 1 | 1 | 1 | 1 | 1 | 1 | 1 | 1 | 1 | 1 | 1 | 1 | 1 | 1 | 1 | 1 |
| A2 | 1 | 1 | 0 | 1 | 0 | 0 | 0 | 1 | 1 | 1 | 1 | 1 | 1 | 1 | 0 | 1 | 1 | 1 | 1 | 1 | 1 |
| A3 | 0 | 1 | 1 | 1 | 0 | 0 | 0 | 1 | 0 | 1 | 1 | 1 | 1 | 0 | 0 | 1 | 0 | 1 | 0 | 1 | 1 |
| B1 | 1 | 1 | 1 | 1 | 0 | 0 | 0 | 1 | 1 | 1 | 1 | 1 | 1 | 1 | 1 | 1 | 1 | 1 | 1 | 1 | 1 |
| B2 | 0 | 0 | 0 | 0 | 1 | 0 | 0 | 1 | 0 | 1 | 1 | 1 | 1 | 0 | 0 | 1 | 0 | 1 | 0 | 1 | 1 |
| C1 | 0 | 1 | 0 | 0 | 0 | 1 | 0 | 1 | 0 | 1 | 1 | 1 | 1 | 0 | 0 | 1 | 0 | 1 | 0 | 1 | 1 |
| C2 | 1 | 1 | 0 | 1 | 0 | 0 | 1 | 1 | 1 | 1 | 1 | 1 | 1 | 1 | 1 | 1 | 1 | 1 | 1 | 1 | 1 |
| D1 | 1 | 1 | 1 | 1 | 1 | 1 | 1 | 1 | 1 | 1 | 1 | 1 | 1 | 1 | 1 | 1 | 1 | 1 | 1 | 1 | 1 |
| D2 | 1 | 1 | 0 | 1 | 0 | 0 | 0 | 1 | 1 | 1 | 1 | 1 | 1 | 1 | 1 | 1 | 1 | 1 | 1 | 1 | 1 |
| D3 | 1 | 1 | 1 | 1 | 1 | 1 | 0 | 1 | 1 | 1 | 1 | 1 | 1 | 1 | 1 | 1 | 1 | 1 | 1 | 1 | 1 |
| E1 | 1 | 1 | 1 | 1 | 1 | 1 | 0 | 1 | 1 | 1 | 1 | 1 | 1 | 1 | 1 | 1 | 1 | 1 | 1 | 1 | 1 |
| E2 | 1 | 1 | 0 | 1 | 0 | 0 | 0 | 1 | 1 | 1 | 1 | 1 | 1 | 1 | 1 | 1 | 1 | 1 | 1 | 1 | 1 |
| E3 | 1 | 1 | 0 | 1 | 0 | 0 | 0 | 1 | 1 | 1 | 1 | 1 | 1 | 1 | 1 | 1 | 1 | 1 | 1 | 1 | 1 |
| F1 | 1 | 1 | 1 | 1 | 1 | 0 | 0 | 1 | 1 | 1 | 1 | 1 | 1 | 1 | 1 | 1 | 1 | 1 | 1 | 1 | 1 |
| F2 | 0 | 1 | 0 | 1 | 0 | 0 | 0 | 1 | 1 | 1 | 1 | 1 | 1 | 1 | 1 | 1 | 1 | 1 | 1 | 1 | 1 |
| G1 | 0 | 1 | 0 | 1 | 0 | 0 | 0 | 1 | 1 | 1 | 1 | 1 | 1 | 0 | 0 | 1 | 0 | 1 | 0 | 1 | 1 |
| G2 | 0 | 0 | 0 | 0 | 0 | 0 | 0 | 0 | 0 | 1 | 1 | 1 | 0 | 0 | 0 | 0 | 1 | 0 | 0 | 1 | 1 |
| H1 | 0 | 0 | 0 | 0 | 0 | 0 | 0 | 1 | 0 | 1 | 1 | 1 | 1 | 0 | 0 | 0 | 0 | 1 | 0 | 1 | 1 |
| H2 | 0 | 1 | 0 | 1 | 0 | 0 | 0 | 1 | 1 | 1 | 1 | 1 | 1 | 1 | 1 | 1 | 0 | 1 | 1 | 1 | 1 |
| I1 | 1 | 1 | 1 | 1 | 0 | 0 | 0 | 1 | 1 | 1 | 1 | 1 | 1 | 1 | 1 | 1 | 1 | 1 | 1 | 1 | 1 |
| I2 | 1 | 1 | 1 | 1 | 1 | 1 | 0 | 1 | 1 | 1 | 1 | 1 | 1 | 1 | 1 | 1 | 1 | 1 | 1 | 1 | 1 |
| Factor | Factor (Algebra) | Reachable Set | Antecedent Set | Intersection Set | Level |
|---|---|---|---|---|---|
| A1 | 1 | 1,2,3,4,5,6,7,8,9,10,11,12,13,14,15,16,17,18,19,20,21 | 1,2,4,7,8,9,10,11,12,13,14,20,21 | 1,2,4,7,8,9,10,11,12,13,14,20,21 | IV |
| A2 | 2 | 1,2,4,8,9,10,11,12,13,14,16,17,18,19,20,21 | 1,2,3,4,6,7,8,9,10,11,12,13,14,15,16,19,20,21 | 1,2,4,8,9,10,11,12,13,14,16,19,20,21 | II |
| A3 | 3 | 2,3,4,8,10,11,12,13,16,18,20,21 | 1,3,4,8,10,11,14,20,21 | 3,4,8,10,11,20,21 | III |
| B1 | 4 | 1,2,3,4,8,9,10,11,12,13,14,15,16,17,18,19,20,21 | 1,2,3,4,7,8,9,10,11,12,13,14,15,16,19,20,21 | 1,2,3,4,8,9,10,11,12,13,14,15,16,19,20,21 | II |
| B2 | 5 | 5,8,10,11,12,13,16,18,20,21 | 1,5,8,10,11,14,21 | 5,8,10,11,21 | III |
| C1 | 6 | 2,6,8,10,11,12,13,16,18,20,21 | 1,6,8,10,11,21 | 6,8,10,11,21 | III |
| C2 | 7 | 1,2,4,7,8,9,10,11,12,13,14,15,16,17,18,19,20,21 | 1,7,8 | 1,7,8 | V |
| D1 | 8 | 1,2,3,4,5,6,7,8,9,10,11,12,13,14,15,16,17,18,19,20,21 | 1,2,3,4,5,6,7,8,9,10,11,12,13,14,15,16,18,19,20,21 | 1,2,3,4,5,6,7,8,9,10,11,12,13,14,15,16,18,19,20,21 | II |
| D2 | 9 | 1,2,4,8,9,10,11,12,13,14,15,16,17,18,19,20,21 | 1,2,4,7,8,9,10,11,12,13,14,15,16,19,20,21 | 1,2,4,8,9,10,11,12,13,14,15,16,19,20,21 | II |
| D3 | 10 | 1,2,3,4,5,6,8,9,10,11,12,13,14,15,16,17,18,19,20,21 | 1,2,3,4,5,6,7,8,9,10,11,12,13,14,15,16,17,18,19,20,21 | 1,2,3,4,5,6,8,9,10,11,12,13,14,15,16,17,18,19,20,21 | I |
| E1 | 11 | 1,2,3,4,5,6,8,9,10,11,12,13,14,15,16,17,18,19,20,21 | 1,2,3,4,5,6,7,8,9,10,11,12,13,14,15,16,17,18,19,20,21 | 1,2,3,4,5,6,8,9,10,11,12,13,14,15,16,17,18,19,20,21 | I |
| E2 | 12 | 1,2,4,8,9,10,11,12,13,14,15,16,17,18,19,20,21 | 1,2,3,4,5,6,7,8,9,10,11,12,13,14,15,16,17,18,19,20,21 | 1,2,4,8,9,10,11,12,13,14,15,16,17,18,19,20,21 | I |
| E3 | 13 | 1,2,4,8,9,10,11,12,13,14,15,16,17,18,19,20,21 | 1,2,3,4,5,6,7,8,9,10,11,12,13,14,15,16,18,19,20,21 | 1,2,4,8,9,10,11,12,13,14,15,16,18,19,20,21 | II |
| F1 | 14 | 1,2,3,4,5,8,9,10,11,12,13,14,15,16,17,18,19,20,21 | 1,2,4,7,8,9,10,11,12,13,14,15,19,20,21 | 1,2,4,8,9,10,11,12,13,14,15,19,20,21 | IV |
| F2 | 15 | 2,4,8,9,10,11,12,13,14,15,16,17,18,19,20,21 | 1,4,7,8,9,10,11,12,13,14,15,19,20,21 | 4,8,9,10,11,12,13,14,15,19,20,21 | III |
| G1 | 16 | 2,4,8,9,10,11,12,13,16,18,20,21 | 1,2,3,4,5,6,7,8,9,10,11,12,13,14,15,16,19,20,21 | 2,4,8,9,10,11,12,13,16,20,21 | II |
| G2 | 17 | 10,11,12,17,20,21 | 1,2,4,7,8,9,10,11,12,13,14,15,17,20,21 | 10,11,12,17,20,21 | I |
| H1 | 18 | 8,10,11,12,13,18,20,21 | 1,2,3,4,5,6,7,8,9,10,11,12,13,14,15,16,18,19,20,21 | 8,10,11,12,13,18,20,21 | I |
| H2 | 19 | 2,4,8,9,10,11,12,13,14,15,16,18,19,20,21 | 1,2,4,7,8,9,10,11,12,13,14,15,19,20,21 | 2,4,8,9,10,11,12,13,14,15,19,20,21 | III |
| I1 | 20 | 1,2,3,4,8,9,10,11,12,13,14,15,16,17,18,19,20,21 | 1,2,3,4,5,6,7,8,9,10,11,12,13,14,15,16,17,18,19,20,21 | 1,2,3,4,8,9,10,11,12,13,14,15,16,17,18,19,20,21 | I |
| I2 | 21 | 1,2,3,4,5,6,8,9,10,11,12,13,14,15,16,17,18,19,20,21 | 1,2,3,4,5,6,7,8,9,10,11,12,13,14,15,16,17,18,19,20,21 | 1,2,3,4,5,6,8,9,10,11,12,13,14,15,16,17,18,19,20,21 | I |
| Driving Power | Dependence Power | |
|---|---|---|
| A1 | 21 | 13 |
| A2 | 16 | 18 |
| A3 | 12 | 9 |
| B1 | 18 | 17 |
| B2 | 10 | 7 |
| C1 | 11 | 6 |
| C2 | 18 | 3 |
| D1 | 21 | 20 |
| D2 | 17 | 16 |
| D3 | 20 | 21 |
| E1 | 20 | 21 |
| E2 | 17 | 21 |
| E3 | 17 | 20 |
| F1 | 19 | 15 |
| F2 | 16 | 14 |
| G1 | 12 | 19 |
| G2 | 6 | 15 |
| H1 | 8 | 20 |
| H2 | 15 | 15 |
| I1 | 18 | 21 |
| I2 | 20 | 21 |
Disclaimer/Publisher’s Note: The statements, opinions and data contained in all publications are solely those of the individual author(s) and contributor(s) and not of MDPI and/or the editor(s). MDPI and/or the editor(s) disclaim responsibility for any injury to people or property resulting from any ideas, methods, instructions or products referred to in the content. |
© 2024 by the authors. Licensee MDPI, Basel, Switzerland. This article is an open access article distributed under the terms and conditions of the Creative Commons Attribution (CC BY) license (https://creativecommons.org/licenses/by/4.0/).
Share and Cite
Wang, M.; Zhang, Q.; Hu, J.; Shao, Y. A Study on the Key Factors for the Sustainable Development of Shared Mobility Based on TDM Theory: The Case Study from China. Systems 2024, 12, 403. https://doi.org/10.3390/systems12100403
Wang M, Zhang Q, Hu J, Shao Y. A Study on the Key Factors for the Sustainable Development of Shared Mobility Based on TDM Theory: The Case Study from China. Systems. 2024; 12(10):403. https://doi.org/10.3390/systems12100403
Chicago/Turabian StyleWang, Min, Qiaohe Zhang, Jinqi Hu, and Yixuan Shao. 2024. "A Study on the Key Factors for the Sustainable Development of Shared Mobility Based on TDM Theory: The Case Study from China" Systems 12, no. 10: 403. https://doi.org/10.3390/systems12100403