Article

Evaluation of the Smart Logistics Based on the SLDI Model: Evidence from China

1
School of Management, Changchun University, Changchun 130022, China
2
School of Economics and Management, Changchun Sci-Tech University, Changchun 130600, China
*
Author to whom correspondence should be addressed.
Systems 2024, 12(10), 405; https://doi.org/10.3390/systems12100405
Submission received: 18 August 2024 / Revised: 26 September 2024 / Accepted: 28 September 2024 / Published: 30 September 2024

Abstract

:
Smart logistics (SL) reflects the digital transformation of the logistics industry, which is key for economic development. Most evaluations are based on the application of technology in SL, and few studies have evaluated SL from a comprehensive perspective. The paper builds the SL development index (SLDI) model from five dimensions based on the driving force, pressure, state, impact, and response (DPSIR) model and identifies the indicator weight by the entropy weight technique. The paper employs the ETDK method, a combined quantitative approach that incorporates entropy weight (E), the technique for order preference by similarity to an ideal solution (TOPSIS) (T), the Dagum Gini coefficient (D), and Kernel density estimation (K), to calculate the closeness degree, analyze spatial-temporal differentiation, and explain the distribution characteristics using data from China spanning 2013 to 2021. The findings show that (1) The SL evaluation is multidimensional and cannot be evaluated only based on technical indicators. A comprehensive evaluation indicator system is necessary. (2) A combined quantitative approach can measure SL development from multiple perspectives and get a clearer picture of the characteristics and regional differences of SL. (3) Influenced by economic development, infrastructure, regional clusters, location, talent, etc., the overall SL development is improving yearly, but SL development in different regions is unbalanced and has different distribution characteristics. The SLDI model developed in this paper will provide a more scientific and reasonable tool for comprehensively evaluating SL. The findings are helpful in proposing suggestions and optimization approaches for subsequent research on SL evaluation and development.

Graphical Abstract

1. Introduction

SL, also called “intelligent logistics” or “logistics 4.0” [1], is a promising solution for the growing complexity and volume of logistics operations by combining online and offline channels [2]. SL plays an important role in ensuring customer satisfaction and increasing competitive advantage [3], brings opportunities to solve problems such as high costs and low efficiency [4], and aims at the successful implementation of intelligent and lean supply chains [5]. Four characteristics, including intelligence, flexibility, integration, and self-organization, differ from traditional logistics [1]. SL is the subject of several studies that look at all its subdomains: improving management, optimizing transport routes, applying logistics solutions, and improving the reception of raw materials and the preparation of orders [6]. SL can be efficiently deployed through the integration of information technology (IT), such as cyber-physical systems (CPS), the Internet of Things (IoT), and the Physical Internet (PI). Additionally, leveraging artificial intelligence (AI), machine learning (ML), and deep learning (DL) is crucial for achieving success in digital transformation processes [7,8] and enhances logistics performance [9,10].
In recent years, researchers have conducted studies on SL development, SL technology, and obstacles in SL, with the majority of them focusing on the application of IT in SL and its effectiveness evaluation. At present, there is no widely acceptable definition for SL. In the related literature, SL usually refers to different logistics operations, including inventory, transport, or order management, which are managed in an intelligent way, such as product tracking and environmental sensing, problem recognition, and automatic decision-making and execution [11]. The combination of the IoT, big data, cloud computing, and AI will make improvements and optimization in logistics processes [12]. Ding et al. (2020) believe that intelligent logistics is an efficient way to deal with changing customer expectations [13]. Brunetti et al. (2024) present the SL node concept, combining the physical infrastructure of logistics nodes with digital systems, including data sharing, supporting infrastructure, and connected and automated transport technologies to enhance collaboration [14]. Issaoui et al. (2022) propose an advanced shipping system consisting of the delivery prediction model and a hybrid optimization model, which can optimize the distribution chain and reduce costs [15]. McFarlane et al. (2016) construct a customer-oriented SL mode that includes closeness, flexibility, and accessibility [11]. Researchers realize the significance of SL and explore the factors and problems of SL development. Liu et al. (2022) propose five major factors influencing intelligent logistics transformation problems, including inherent risks of transformation, difficulties in organizational adjustment, market obstacles, market drivers, and social factors [16]. Stanislawsk and Szymonik (2021) explore the barriers to SL implementation. Results show that the barriers have an important negative impact on the implementation of intelligent systems in logistics; internal barriers are more negative than external ones [17].
Most of the literature related to SL is on the application of technology. Strategic and tactical process optimization, cyber-physical systems in logistics, predictive maintenance, hybrid decision support systems, improvement of operational processes in logistics, and intelligent transport logistics are the main research contents regarding the application of AI, ML, and DL in the area of SL [5]. Fu and Zhu (2019) propose a blockchain-based framework for SL and establish a big data analytics center to gather and analyze relevant data. The analysis results, abstract information, and corresponding data sources are then broadcast, recorded, and securely stored within the blockchain system [18]. Ding et al. (2020) address the key technical issues of IoT, foster its application in logistics, and collaborate to advance information, communication technologies, and management systems [13]. Song et al. (2021) believe that the features of IoT help to promote SL development and review how IoT technologies are applied in the realm of SL from the perspectives of logistics transportation, warehousing, loading/unloading, carrying, distribution processing, distribution, and information processing [4]. Alshdadi and Irshad propose a novel PUF-enabled drone access control mechanism, PDAC-SL, for SL [19]. Khatib and Barco (2021) propose a system for exploiting the application-specific optimization capabilities of 5G networks to meet the demands of SL [20].
Some studies focus on the SL evaluation. Tao and Ding (2023) establish an evaluation index system based on three dimensions of intelligence, collaboration capabilities, and innovation capabilities, using the combined principal component analysis and data envelopment analysis (DEA). Findings indicate that redundant inputs/outputs in some SL parks hinder DEA effectiveness, and gaps in the collaborative innovation level lead to the failure to realize the overall coordinated development [21]. Li et al. (2022) evaluate SL from different perspectives, including enterprise performance, cost, and technical level [22]. Huo et al. (2024) assess SL with the indicators of logistics economy, logistics infrastructure, logistics volume, and intelligence [23]. Göçmen (2021) evaluates the smart airport based on standards including environmental effects, docking and navigation, object detection, and protection, communications and integration, and terminology. The results show that the object detection and protection standard affects a safe and smart system [24]. Liu et al. (2020) constructed an evaluation system that consists of 3 level-1 indicators, 10 level-2 indicators, and 24 level-3 indicators to evaluate the intelligent logistics ecological chain based on hybrid numerical decision-making [25]. Wang et al. (2022) evaluate the intelligent logistics storage space with an adaptive model considering factors such as psychology, behavior, and physiology of the workers [26]. Wang (2022) assesses the intelligent logistics distribution system to improve logistics distribution efficiency and management quality with an expectation-maximization algorithm [27]. Liu et al. (2020) built a risk evaluation system, the TOPSIS method, to evaluate the risks of different SL ecological chains and achieve better global optimal risk control [28].
SL has received widespread attention, and its importance is beyond doubt. SL development is the result of the integration of various aspects such as technology, infrastructure, talent, capital, and so on. However, most existing research evaluates SL development primarily from a technical perspective or just from one aspect of SL, such as distribution, storage, and other activities. Furthermore, there is no unified calculation method to evaluate SL from a comprehensive perspective at present. From this point of view, it is very necessary to carry out relevant research on SL evaluation, whether in filling the gaps of theoretical research or providing a referable quantitative evaluation method for SL development. Therefore, this article will use a combined quantitative method to conduct a comprehensive evaluation of SL development from multiple dimensions, encompassing technology, infrastructure, talent, capital, policy, service, and economic and social benefits.
The research question focuses on how to conduct a comprehensive evaluation of SL from different dimensions. The research goal is to scientifically and rationally evaluate the SL of China. In order to accomplish the goal, we develop a comprehensive evaluation indicator system, determine the indicator weight, and use a combined quantitative approach.
Compared with the previous literature, the contributions of this paper include the following two aspects: First, this study constructs the SLDI model, which is a complete evaluation system of SL based on the DPSIR model and provides a new idea for the study of SL. Second, different from previous studies, which only focus on technology application in SL, this study considers the different dimensions and proposes an ETDK method based on entropy weight–TOPSIS method, Dagum Gini coefficient, and Kernel density estimation to evaluate various aspects of SL. In this paper, the weight of each index is calculated by adopting the entropy weight technique, the closeness degree is calculated based on the entropy weight–TOPSIS method, the spatial-temporal differentiation is analyzed through the Dagum Gini coefficient, and the distribution characteristics are explained by Kernel density estimation. The analysis process makes the evaluation result more in line with the real situation.
The rest of the study is organized as follows. Section 2 constructs an evaluation model and describes the evaluation methods and data. Section 3 shows the main results, Section 4 is dedicated to discussion, and Section 5 concludes this paper.

2. Methodology

Based on the DPSIR model, the paper constructs the SLDI model and evaluates SL with data from China. The evaluation process of the SL mainly includes four steps: selecting indicators, setting the indicator weights, identifying the ETDK method, and choosing data. Figure 1 illustrates the research design.

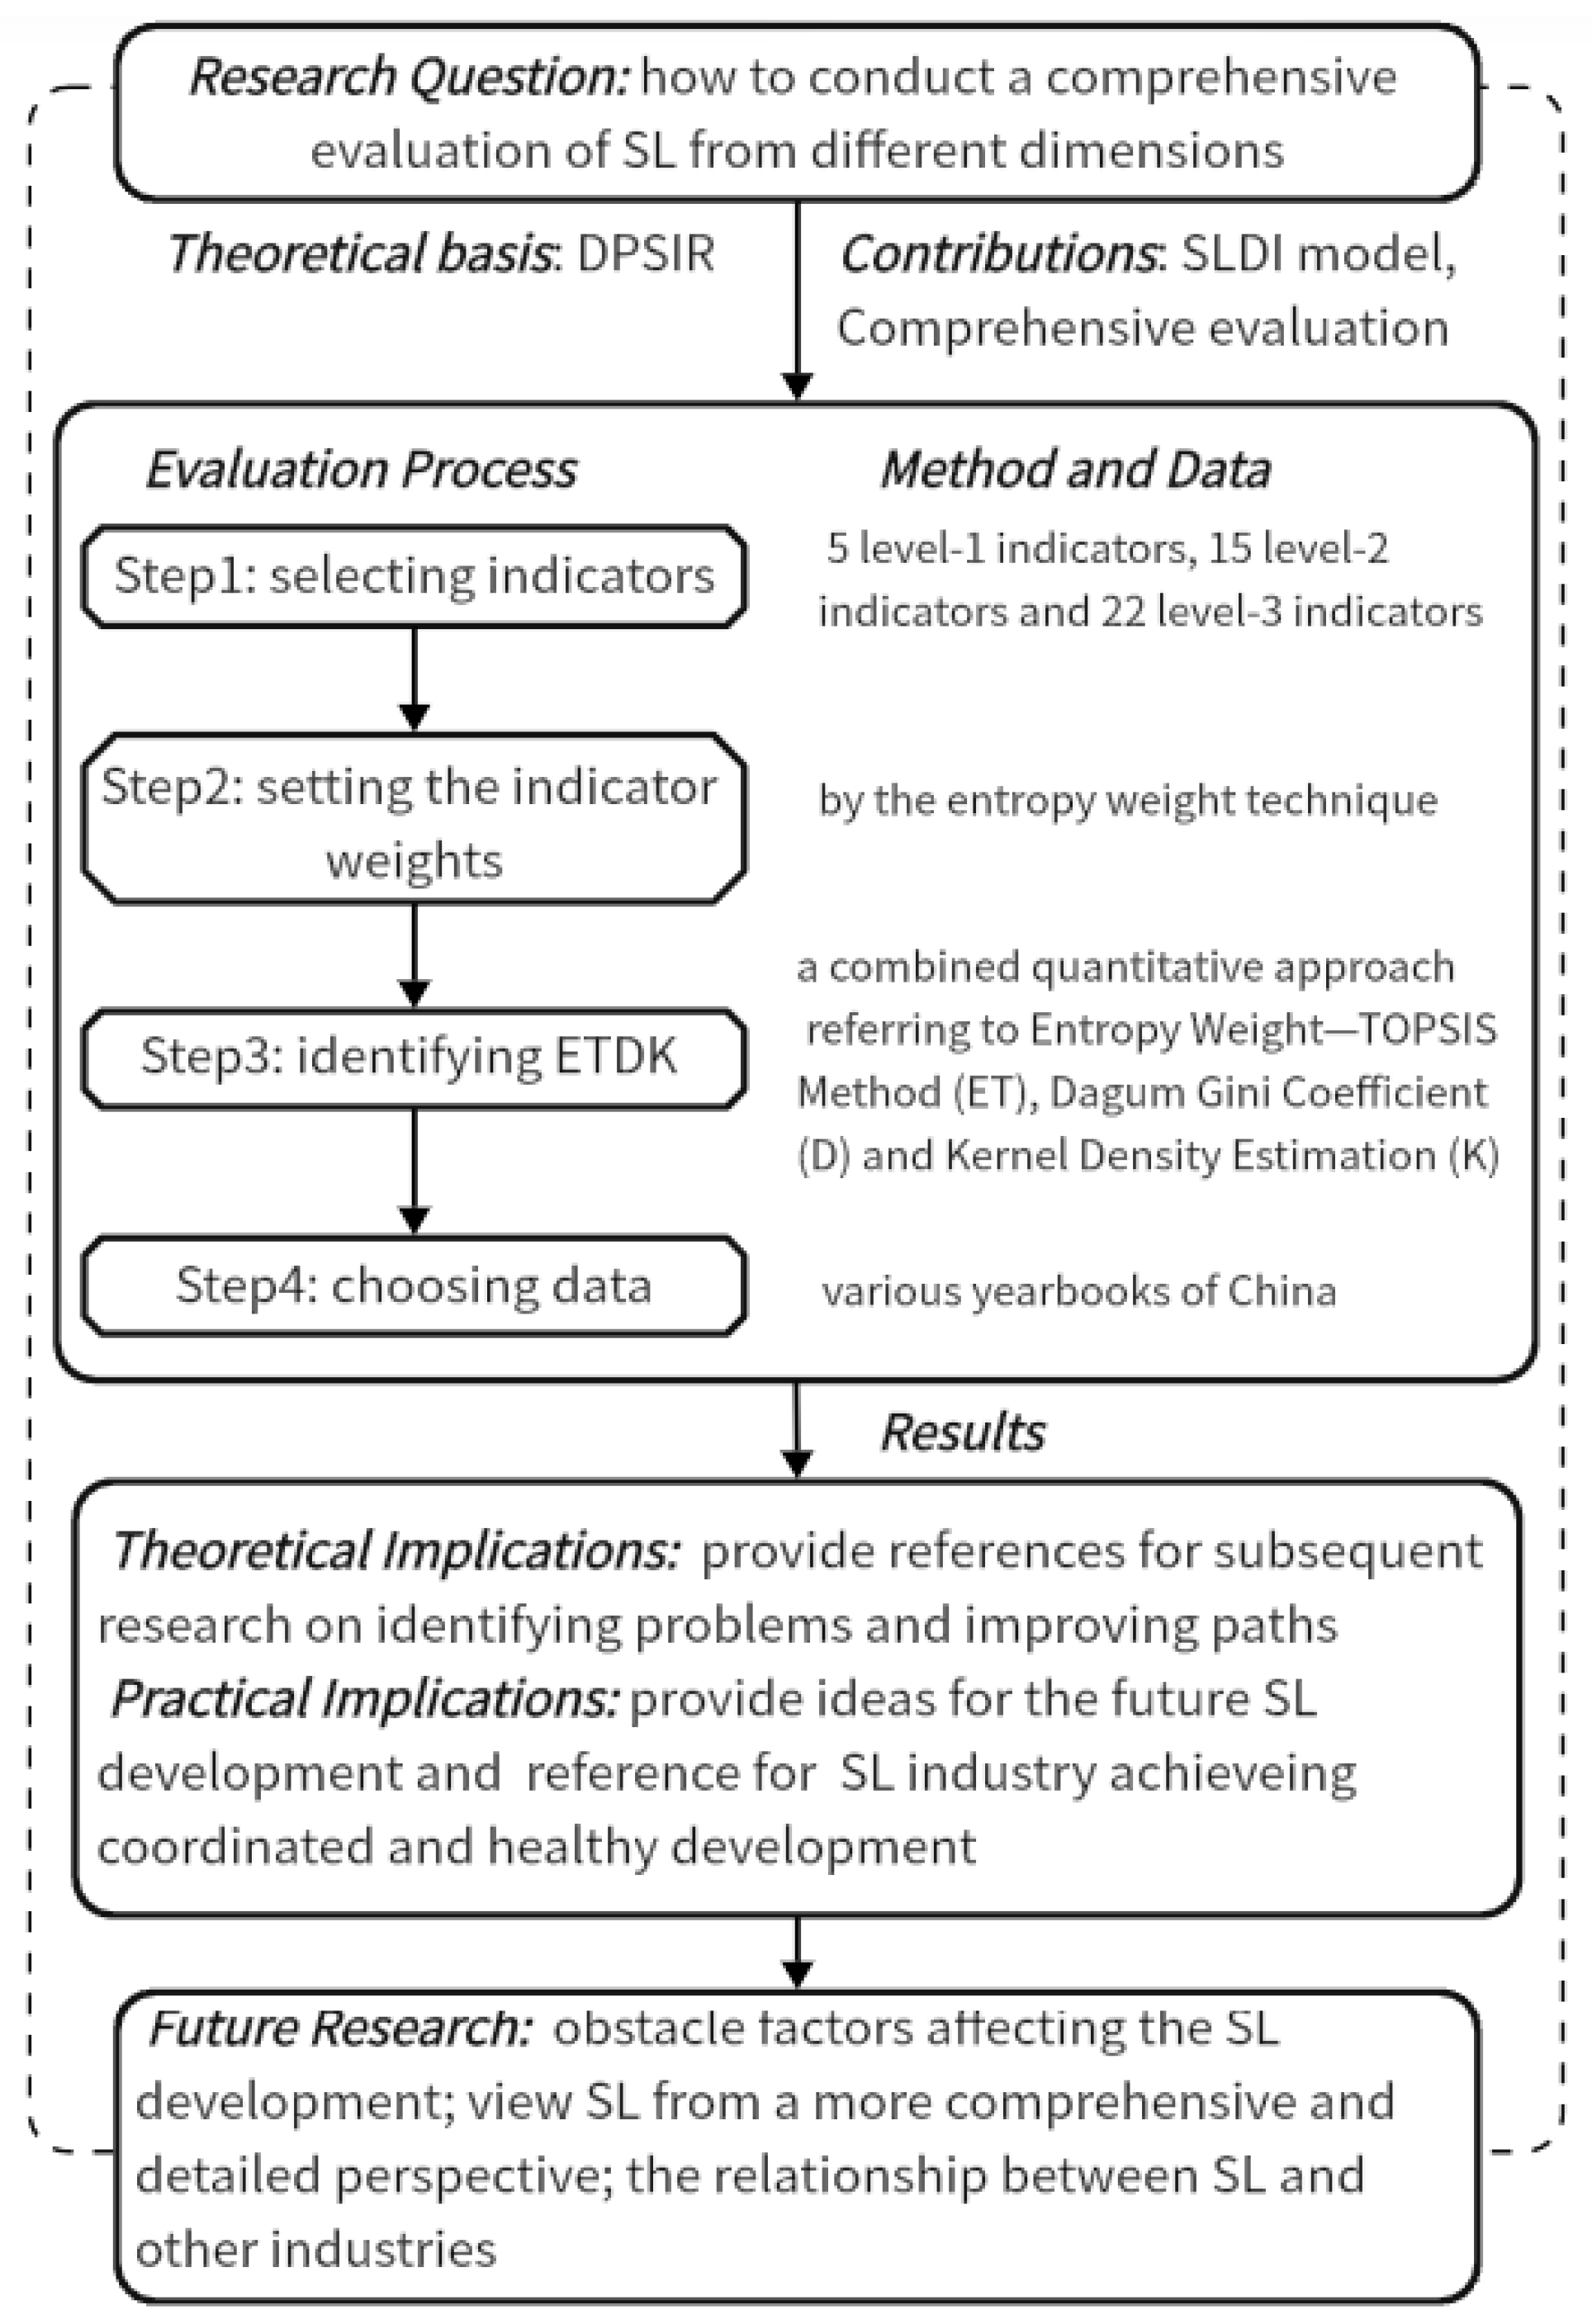
2.1. Construction of the SLDI Model

2.1.1. Selection of Indicators

As an evaluation model, the DPSIR model of intervention is mainly used to evaluate the geographical environment, and many scholars have also applied it to cross-border areas. Zhang (2020) assessed smart ports with the DPSIR [29]. Wei and Ji (2019) evaluated the development of regional logistics using the DPSIR model [30]. Based on the research of these scholars and guided by the concept underlying the DPSIR model, this article constructed the SLDI model based on the five dimensions of driving force (D), pressure (P), state (S), impact (I), and response (R). Empirical analysis is conducted through the connection of these five dimensions.
Driving force usually refers to factors that cause changes in subjects. The driving force of SL development mainly originates from the economic environment and the industrial structure. According to input-output theory and economic growth theory, labor, capital, and technology are the sources of economic growth [31]. In the driving force dimension, we choose personnel input, capital input, industrial structure, and information network popularity as the level 2 indicators. For personnel input, it should be measured by indicators such as staff salary, training cost, welfare, etc. However, due to the availability of data, the article chooses the average salary of urban non-private employment in the logistics industry to measure the input of manpower cost in the logistics industry. For capital input, we choose investment in fixed assets in the logistics industry because the indicator represents the behavior of long-term capital investment in the process of production and operation to increase production capacity, raise the technological level, and improve production conditions. For industrial structure, we use the proportion of the logistics industry value-added to the tertiary industry value-added, which can represent the relative importance of the logistics industry in the tertiary industry and its degree of contribution to the growth of the tertiary industry. For information network popularity, we refer to the National Informatization Development Report (2023) and select the size of internet broadband users, the number of IPv4 addresses, and the number of computers used in the logistics industry that are representative of the popularization and development of the information network in the sample period.
Pressure refers to the pressure imposed on the research subject under the action of the driving force. For the logistics industry, the initial stage of smart development is bound to face the pressures of lack of high-level talents, low technical level, and increased development costs. In the pressure dimension, we choose talent pressure, technical pressure, and cost pressure as the level 2 indicators. For talent pressure, the proportion of talents with a bachelor’s degree or above in the logistics industry is chosen. A low proportion of high-level practitioners will lead to greater pressure on talents in the development of SL and vice versa. For technical pressure, the technology market transaction volume was chosen. The technology market connects science and technology with the economy. The technology market turnover can measure the transformation of scientific and technological achievements. Lower turnover in the technology market indicates lower effectiveness in transforming scientific and technological achievements into real productivity. Insufficient science and technology innovation means greater technological pressure on SL development and vice versa. For cost pressure, social logistics cost is chosen. One of the purposes of SL is to reduce costs with advanced technology. Higher costs mean more pressure on SL.
The state reflects the development status of the research object. The most intuitive effects of the development of the logistics industry are the levels of logistics service, express delivery service, and postal service [32]. In the state dimension, we choose the service level and technical level as the level 2 indicators. For service level, turnover of freight traffic, express volume, and total postal service volume are chosen based on the points above. For the technical level, e-commerce sales volume and several valid invention patents in the electronics and communication equipment manufacturing industry are chosen. The former represents the development level of e-commerce logistics, and the latter represents the standard of industry research and technology used to measure SL.
Impact refers to the final influence on the research object under the combined actions of driving force, pressure, and state. The impact dimension measures the positive changes in all aspects of SL. In the impact dimension, we choose industry operation, industry website popularity degree, IT benefits, and green development. For industry operation, we choose the logistics industry value-added index, which reflects the overall economic development of the logistics industry. For the degree of industry website popularity, the number of enterprise websites and the number of enterprises with e-commerce transactions can reflect the scale of the use of websites in the logistics industry. For IT benefits, we choose information transmission, software, and IT services revenue, which represents the profitability and market value of the IT industry and reflects the IT benefits of the logistics industry. For green development, we choose carbon emissions, which is the key to green logistics.
Response refers to the positive measures taken by people to improve the aforementioned problems of the research subjects. Indicators in the response dimension typically provide effective feedback on the 4 dimensions of driver, pressure, state, and impact. In the response dimension, we choose technology input and policy response. For technology input, we choose R&D investment and R&D personnel in electronics & communication equipment manufacturing due to the significant function in technology innovation. For policy response, we choose the proportion of transportation expenditure in the total expenditure in the financial expenditure, which reflects policy-level input and support for SL development.
The basic idea underlying the evaluation system is summarized in the following: In the economic environment, industry structure driver (D) and SL development that faces talent pressure, technology pressure, and cost pressure (P) impose higher requirements on SL service level and technical level (S). Such higher requirements are also imposed on the logistics industry operation, as well as on the impact of smart and green development (I). Therefore, the government takes corresponding measures to respond to the above indicators (R), with the goal of realizing efficient SL and healthy development.

2.1.2. Determination of the Weight

In this paper, the weight is determined by the entropy weight technique. First, the original data matrix, which contains M evaluation objects, is constructed, where each M corresponds to N evaluation indexes. In the original data matrix A = a i j m × n , a i j represents the value of the jth index of the ith evaluation object. Second, the data of the original matrix are standardized, and the matrix becomes B = b i j m × n . For the positive indicator, it is calculated by b i j = a i j a j m i n a j m a x a j m i n , for the negative indicator, it is calculated by b i j   = a j m a x a i j a j m a x a j m i n . Third, the proportion of the jth index in the ith year is calculated by p i j = b i j 1 n b i j . Fourth, the entropy value of the jth index is calculated according to e j   = − 1 ln n i = 1 n p i j ln p i j . Finally, the weight of the evaluation index w j   =   g j j = 1 m g j is determined.
In conclusion, the SLDI model, including 5 level-1 indicators, 15 level-2 indicators, and 22 level-3 indicators, is constructed based on the DPSIR model. All the indicators make up the original data matrix. The weight is determined by the entropy weight technique, as shown in Table 1.

2.2. ETDK Method

The paper employs the ETDK method, which is a combined quantitative approach referring to the Entropy Weight—TOPSIS Method (ET), Dagum Gini Coefficient (D), and Kernel Density Estimation (K). The following will provide a detailed explanation of the method.

2.2.1. Entropy Weight—TOPSIS Method

The entropy weight—TOPSIS method is a combination of information entropy and TOPSIS evaluation. In this method, the relative weight of indicators is objectively determined by the entropy weight method. SL development level in each region is ranked by the TOPSIS method [33].
First, the indicators in the standardized matrix are weighed to form a weighted matrix c i j = b i j w j . Second, the positive ideal solution C +   =   C 1 + , C 2 + , · · · , C n + and the negative ideal solution C   =   C 1 , C 2 , · · · , C n are determined. Again, the distance to each evaluated object d i * = j = 1 n c i j c j + 2 , i = 1, 2, …, m and the negative ideal solution distance d i 0 = j = 1 n c i j c j 2 , i = 1, 2, …, m are calculated. Third, the relative closeness of each object to be evaluated f i = d i 0 d i 0 + d i * , i = 1, …, m is calculated, and then, f i is ordered from small to large to identify the priority order of each evaluation object.

2.2.2. Dagum Gini Coefficient

The Dagum Gini coefficient is usually used to measure the income of a country or region, and it is used to examine spatial imbalances. The spatial difference derived from Gini coefficient analysis consists of inter-regional difference, intra-regional difference, and hypervariable density. The formulae are presented as follows:
G a a = i = 1 n a j = 1 n a y a i y a j 2 n 2 y ¯
G a b = i = 1 n a j = 1 n a y a i y b j n a n b y ¯ a + y ¯ b
G w = a = 1 k G a a P a S a
G n b = a = 2 k b = 1 a 1 G a b P b S a + P a S b ) D a b
G t = a = 2 k b = 1 a 1 G a b P b S a + P a S b ) ( 1 D a b )
where G w , G n b , and G t represent within-group differences, between-group differences, and super variable density, respectively. These reflect the contribution of the overall gap because of the presence of the cross-term when dividing molecular populations. G a a   a n d   G a b represent the Gini coefficient of group a and the Gini coefficient between groups a and b, respectively [34]. P a = n a n ,   S a = n a y ¯ a n y ¯ D a b reflect the relative effect between groups a and b.

2.2.3. Kernel Density Estimation

Kernel density estimation is an important non-parametric estimation method [35]. The method is primarily employed to examine the spatial distribution patterns and evolutionary processes of random variables. It can also be effectively utilized to investigate the spatial distribution of non-equilibrium problems [36]. Kernel density estimation can describe the distribution characteristics of SL in China with a continuous density curve. The expression formula is:
λ ^ h p = h 2 n 1 h 2 k ( p p i h )
where λ ^ h p is the density value of point p , k ( p p i h ) is the weight function, p p i is the distance between the points requiring density valuation, and h is the search radius.

2.3. Data from China

Empowered by modern information technologies, China’s logistics industry and digital economy have been deeply transformed. For example, as the world’s first full-process unmanned warehouse, JingDong “Asia One” unmanned warehouse uses a variety of technologies such as 3D visual recognition, automatic packaging, AI, and IoT. Suning uses unattended warehouses, unmanned trucks, unmanned delivery vehicles, and smart storage, thus penetrating the whole industrial chain. So, the paper will choose data from China as an example and analyze SL development to provide a basis for SL development in the future.
In this paper, the panel data from 30 provinces, autonomous regions, and municipalities directly under the central government of China are studied, Hong Kong Special Administrative Regions of China, Macao Special Administrative Regions of China, Xizang Autonomous Region of China, and Taiwan Province of China are excluded from the study due to data availability. The research data are from China Statistical Yearbook [37,38,39,40,41,42,43,44,45], China Population and Employment Statistical Yearbook [46,47,48,49,50,51,52,53,54], China Energy Statistical Yearbook [55,56,57,58,59,60,61,62,63], China Statistical Yearbook of the Tertiary Industry [64,65,66,67,68,69,70,71,72], China Statistics Yearbook on High Technology Industry [73,74,75,76,77,78,79,80,81], Finance Yearbook of China [82,83,84,85,86,87,88,89,90], and China Stock Market & Accounting Research Database (https://data.csmar.com/, accessed on 5 May 2023). China’s yearbooks are compiled by the National Bureau of Statistics of China, which is one of the most authoritative statistical data in China, so the data of the indicators in the paper are real and reliable. Because certain data can not be obtained directly, the logistics industry uses the number of computers, talents in the logistics industry, e-commerce sales in the logistics industry, the number of enterprises with websites, and the number of enterprises with e-commerce trading activities. These numbers are converted according to the number of the national logistics industry and the proportion of the total number of provinces in the national total.
In reference to Ma (2016) [91], carbon emissions data are calculated according to the formula C = C i = E i × N C V i × C E F i × C O F i from the 2006 National Greenhouse Gas Inventories. The consumption of ith energy is E i , N C V i is the average low calorific of ith energy, C E F i is the carbon emission factor provided by the Intergovernmental Panel on Climate Change (IPCC), C O F i is the carbon oxidation factor, which defaults to 1 according to IPCC. Because the logistics industry is not divided separately into industrial classifications for national economic activities, relevant data from the transportation, storage, and postal industries are analyzed. The Internet of Things is an important technical means of SL. For this study, the relevant data from the electronic and communication equipment manufacturing industry, information transmission, computer service, and software industry are selected to measure the technical level of the IoT industry.
Given the availability of data and the feasibility of empirical research, the indicators selected in the article can only try to maximize the presentation of the quality of SL development under the premise that empirical measurement can be achieved.

3. Results

3.1. Closeness Degree Analysis

The TOPSIS method is a sorting method close to the ideal solution by comparing each solution with the positive ideal solution and the negative ideal solution; a solution closest to the positive ideal solution and at the same time far away from the negative ideal solution is selected and is considered to be optimal. Since there is no uniform standard for measuring SL development level, it is impossible to judge the advantages and disadvantages of SL development in the sample period by comparing the development level index of the regions with the recognized standard level. Therefore, the article chooses the entropy weight-TOPSIS method to measure the relative closeness degree of the SL development state of the 30 regions in China concerning the optimal solution and the worst solution, compare their relative closeness degree, and rank them sequentially so as to measure the relative advancement and backwardness of SL development. Based on the TOPSIS model, the data for each level 1 indicator is treated as a separate matrix, e.g., the Driving Force Index in the first column is measured by a matrix of data from D11–D43 for each region during the sample period. The relative closeness degrees of the five dimensions and the overall index are calculated. As shown in Table 2, the closeness degrees of each dimension are named after the corresponding index.
Judging from the relative closeness degrees presented in Table 2, the comprehensive development status of SL in China from 2013 to 2021 followed an increasing trend year by year. This trend indicates that China’s SL has made great progress with the development of the Chinese economy. Although the world economic environment was turbulent in 2017 and 2018, the economic growth was weak, and China began to face the challenge of COVID-19 at the end of 2019; the development process of SL was still not affected. This result highlights the potential for the development of SL in China.
Specifically, the driving force index is increasing, indicating that the development of China’s SL is in full swing and fully invests in personnel, capital, information resources, and other aspects to ensure SL development. The pressure index followed an overall upward trend during the sample period and was closer to the optimal solution. Influenced by the strategic achievements of reducing associated costs and increasing the efficiency of the logistics industry, the total cost of social logistics in China accounted for 18% of GDP in 2013, which decreased to 14.9% in 2016 and dropped further to 14.6% in 2021. According to the index data, the number of logistics industry talents during the sample period, as well as the overall increase and the pressure of logistics talents and technology, gradually decreased. This decrease was coupled with the observed reduction and increase in the efficiency of the social logistics industry. Consequently, the pressure of SL was eased to a certain extent in 2013–2021. The state index after 2014 followed a downward trend and then increased year by year. This trend indicates that the development state of SL in China has steadily increased over recent years. For the impact index, the overall trend is increasing, indicating that the development of China’s SL has a positive impact on the operation of the logistics industry and the popularity of websites. It also improves the benefits brought by the development of IT and effectively reduces the industry’s carbon emissions so that China’s logistics industry will increasingly develop toward green development. The response index fluctuated slightly during the sample period, but after 2016, the overall trend was increasing. This development indicates that the technical investment and governmental support for the IoT technology and equipment industry were beneficial for SL development in China.

3.2. Horizontal Regional Difference Analysis

The same method was also applied to identify the relative closeness degrees of SL in provinces (municipalities and autonomous regions) from 2013 to 2021. SL development was measured by closeness degrees to the ideal state (i.e., relative closeness degrees). The results are shown in Table 3. According to the average closeness degrees of each region, Guangdong ranked first, followed by Beijing, Jiangsu, Zhejiang, and Shanghai in the Yangtze River Delta region. At the last places are Jilin, Heilongjiang, Hainan, and some certain western and northeastern regions. The overall development level is high in the east and low in the west of China. The development status of SL is inseparable from the regional economic level. In the eastern region, the “Yangtze River Delta Economic Belt” and the “Beijing-Tianjin-Hebei” region lead SL development. The reason for their leading role is their active economic environment, openness and development of innovative ideas, and their high level of related industrial bases. These benefits lead to strong market demand and technical conditions needed for SL development, as well as sufficient power development. However, Hainan—which belongs to China’s east and is adjacent to Guangdong province—ranks low, which is partially the result of its geographical location. Although Hainan province has high-speed railway lines and expressways, as well as faultless internal transportation, it lacks land transportation connecting it to other provinces. Therefore, it is difficult for Hainan to be affected by the development radiation of Guangdong province across the sea. In addition, Hainan is sparsely populated, ranking 28th among China’s provinces. The total population and education level directly affect the quality of talent.
Regional clusters such as “Yangtze River Delta” and “Beijing-Tianjin-Hebei” have made significant contributions to SL. However, the feasibility of sharing risks and resources among different regions may face some obstacles. Therefore, the realization of strategic partnerships in the different regions requires the establishment of a clear cooperation agreement and benefit distribution mechanism to ensure the fairness and sustainability of cooperation.
China’s central region is densely populated, which is why it is easier for provinces located in the center to attract labor-intensive industries rather than capital-intensive and technology-intensive industries. Moreover, as a major national grain-producing area, agriculture is highly developed, while the development of high-tech industries is lacking. Therefore, although the central region has a solid foundation for the logistics market, the economic and industrial environment for smart development is not without fault. The SL level of Hubei province ranked ninth. Fueled by the Hubei logistics industry as the three leading industry development strategies and its unique location advantage (Wuhan is China’s “west, south, north” axis), policy and location advantages provide a solid foundation for the development of Hubei logistics wisdom. The western region of China is large and sparsely populated, and its geographical environment is relatively complex. This affects the investment scale of logistics infrastructure, leading to a low density of transportation facilities and the weakness of information infrastructure in this region. In addition, with the generally low level of education and the brain drain caused by economic and regional factors, various factors restrict the logistics modernization in China’s western region.
However, the successful experience of developed regions is not always directly replicable. Although the degree of SL development among the backward regions is relatively close, it is necessary to take into account the differences in the external environment for industrial development and to apply the experience of the developed regions flexibly according to local conditions.

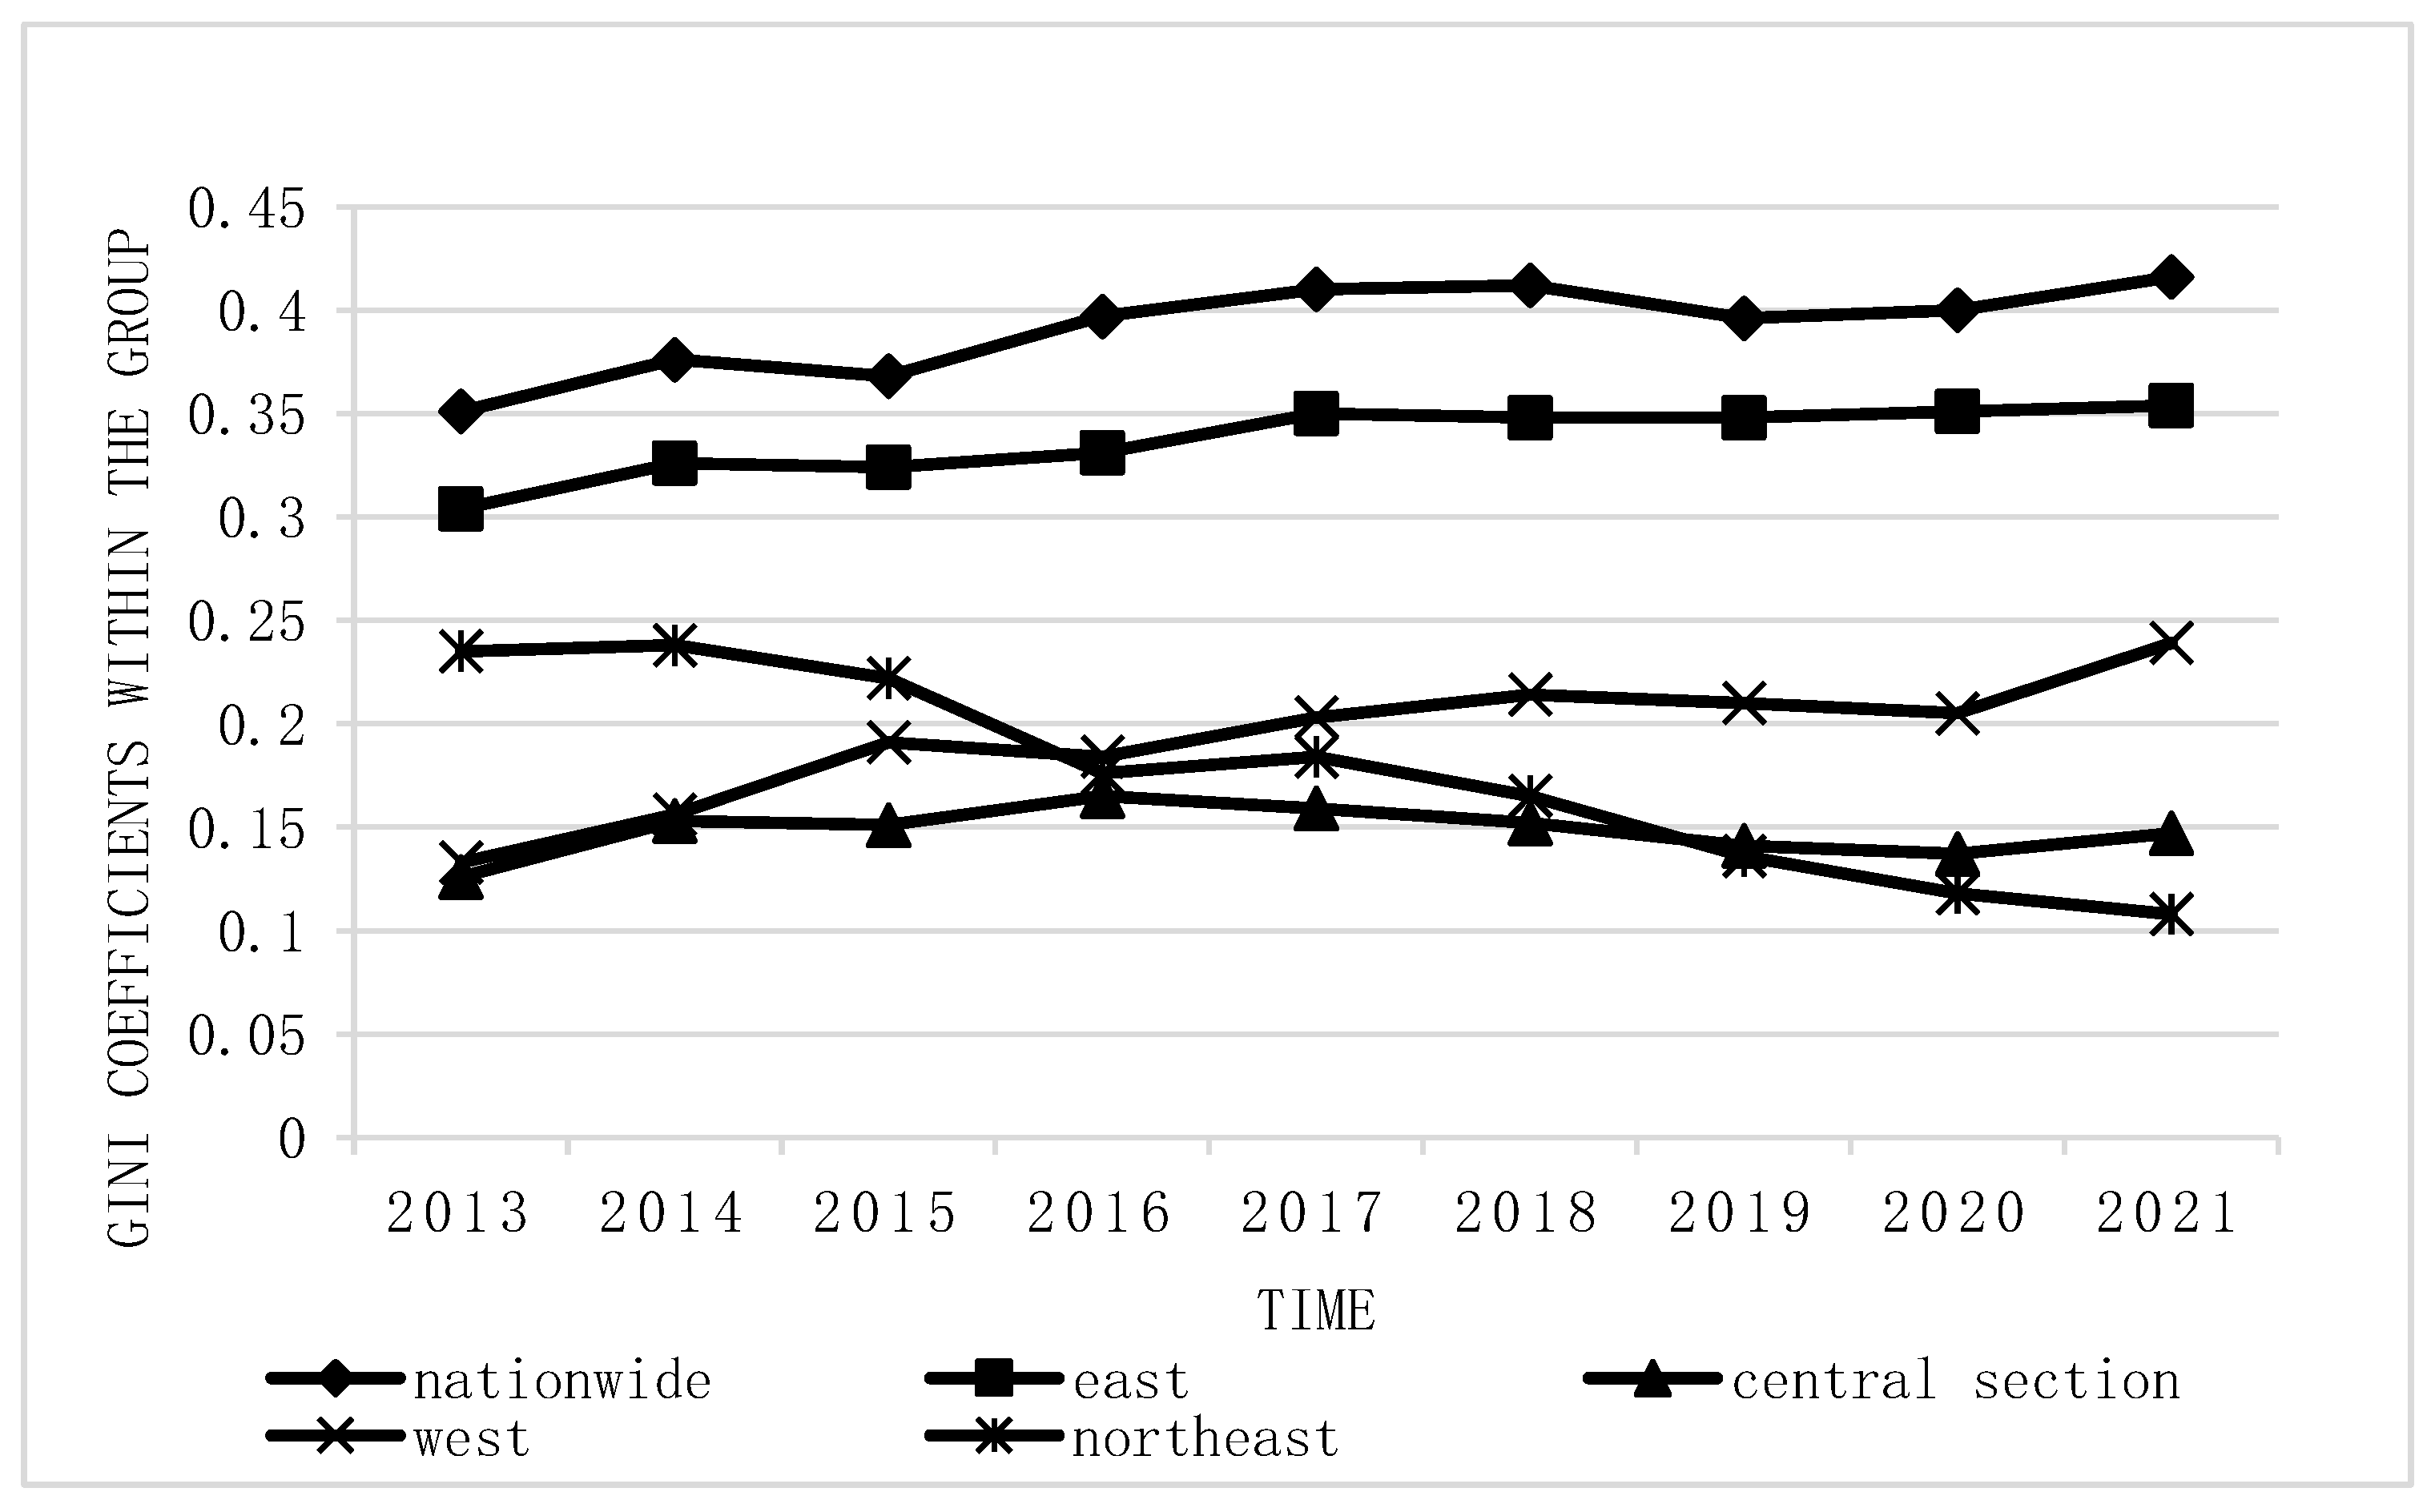
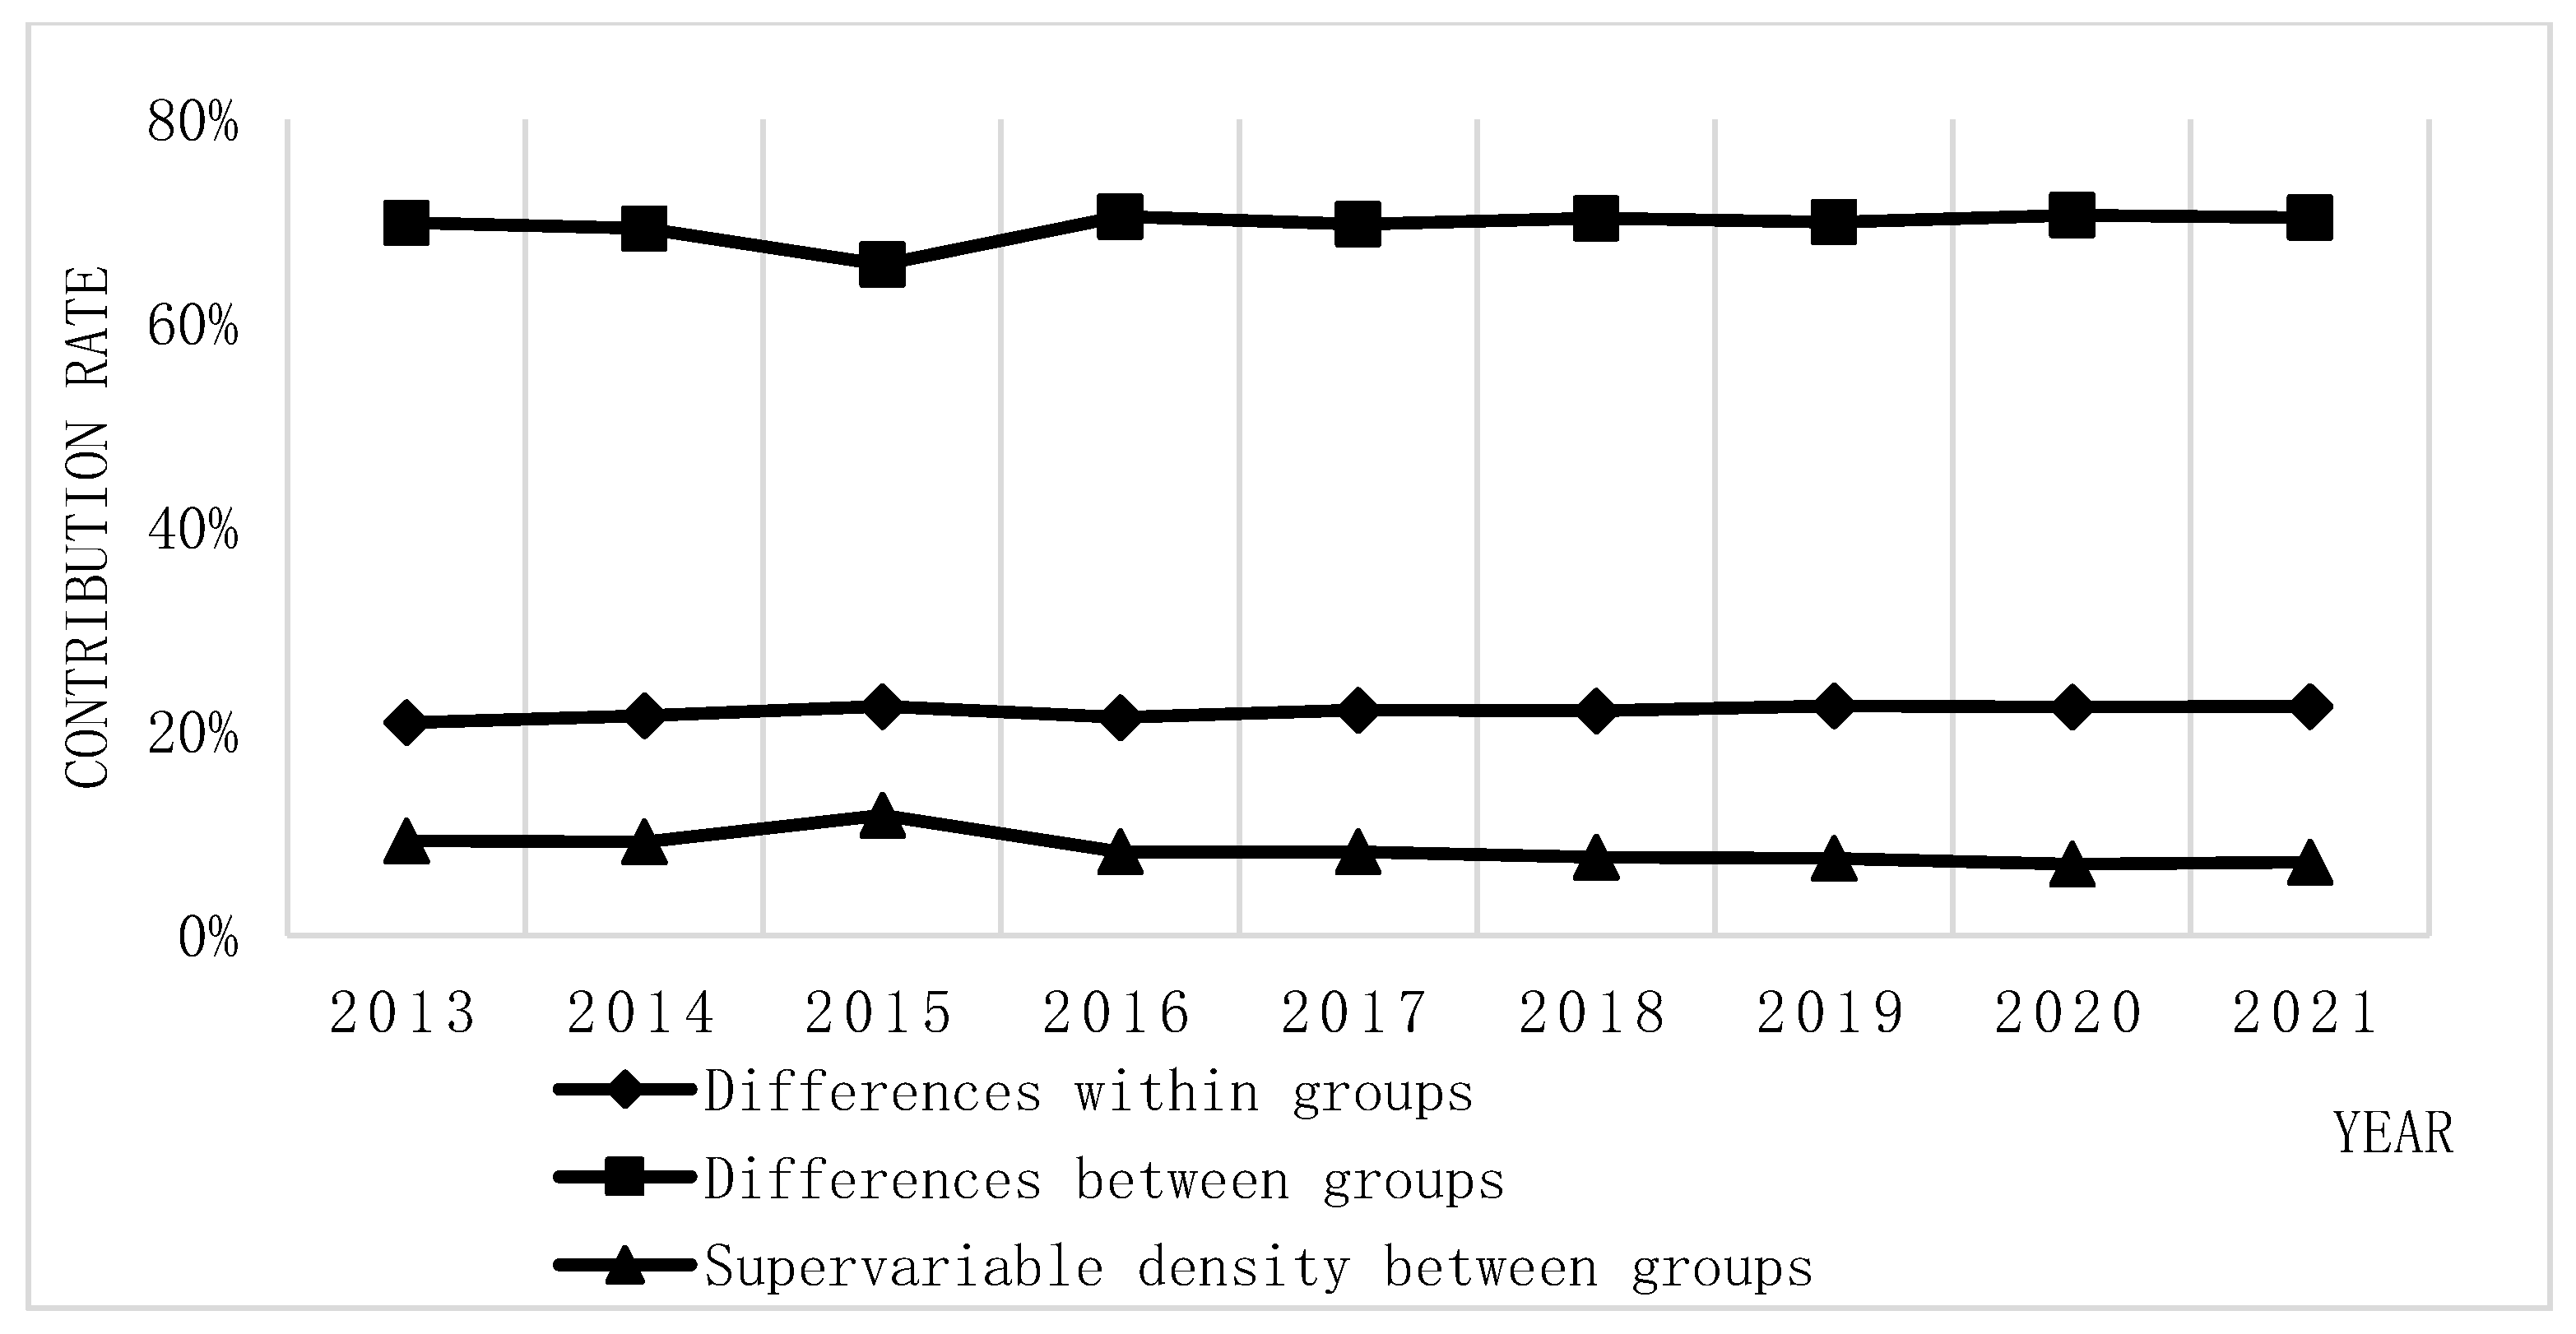
3.3. Spatial-Temporal Differentiation Analysis of SL Development in China

There are four regions in China: the eastern, central, western, and northeastern regions. The eastern region includes Beijing, Tianjin, Hebei, Shanghai, Jiangsu, Zhejiang, Fujian, Shandong, Guangdong, and Hainan; the central region includes Shanxi, Anhui, Jiangxi, Henan, Hubei, and Hunan; the western region includes Inner Mongolia, Guangxi, Chongqing, Sichuan, Guizhou, Yunnan, Shanxi, Gansu, Qinghai, Ningxia, and Xinjiang, and the northeastern region includes Liaoning, Jilin, and Heilongjiang.

3.3.1. Development Difference of SL in Each Region

The Dagum Gini coefficient was used to calculate the development difference of SL among the four regions, as shown in Figure 2. Overall, the national Gini coefficient is higher than the value of the four regions, i.e., the difference within the national group is always higher than the difference within each region. Although the national Gini coefficient does not change much within each year, it follows a slow upward trend. This trend indicates that the regional imbalance of SL development is severe and that the degree of imbalance is gradually deepening. From the perspective of each region, the group differences between the four defined regions are smaller than the overall national differences. This result indicates that the imbalance of SL in the region is relatively lower than that of China as a whole. In the eastern region, the Gini coefficient is the highest, and the overall coefficient is rising, indicating that the difference of SL is the largest in the eastern region and follows a trend of intensification. The reason is the leading SL development in Guangdong, Beijing, Jiangsu, Zhejiang, and Shanghai (in the eastern region) and the apparent optimization trend over the sample period.
The SL infrastructures of several regions are relatively faultless, the scale of the logistics market is large, and these regions already have the basic conditions and potential for the optimization of SL development. In contrast, the SLDI in Tianjin, Hebei, and Hainan is low, and the trend is relatively flat. In particular, the SLDI of Tianjin and Hainan in 2021 is only 14%. Tianjin is located in the hinterland of the Beijing-Tianjin-Hebei region. Although it has a beneficial geographical location and surrounding economic environment, these advantages (such as spatial proximity to Beijing, Shandong, and other provinces) also impose a substantial “siphon effect”. However, Hainan is hindered by limited transportation conditions, a low level of specialization, and a weak SL development foundation. The central region has the lowest Gini coefficient, and the trend is stable, i.e., the imbalance of SL is the lowest in the central region. The economic development level between provinces in the central region does not differ from the industrial structure. The regional distribution is relatively concentrated and geographically connected, and the degree of economic connectivity is higher. The transportation layout and logistics development level influence and radiate each other. Therefore, the difference in SL development is small. From 2013 to 2018, the intra-group difference in the western region increased significantly and gradually exceeded that of the northeastern region. This result indicates that SL development in the western region is not only low, but the unbalanced development situation is also intensifying.
The western region has a large geographical span and sparse population, and Qinghai, Ningxia, Xinjiang, and other places are remote. Economic development is recessive, and because of the poor transportation infrastructure and lack of added value for information, SL development is also recessive. However, among these provinces, Chongqing, Sichuan, Guizhou, Yunnan, Shanxi, and other areas are relatively developed in tourism, and their corresponding transportation foundation is highly developed.

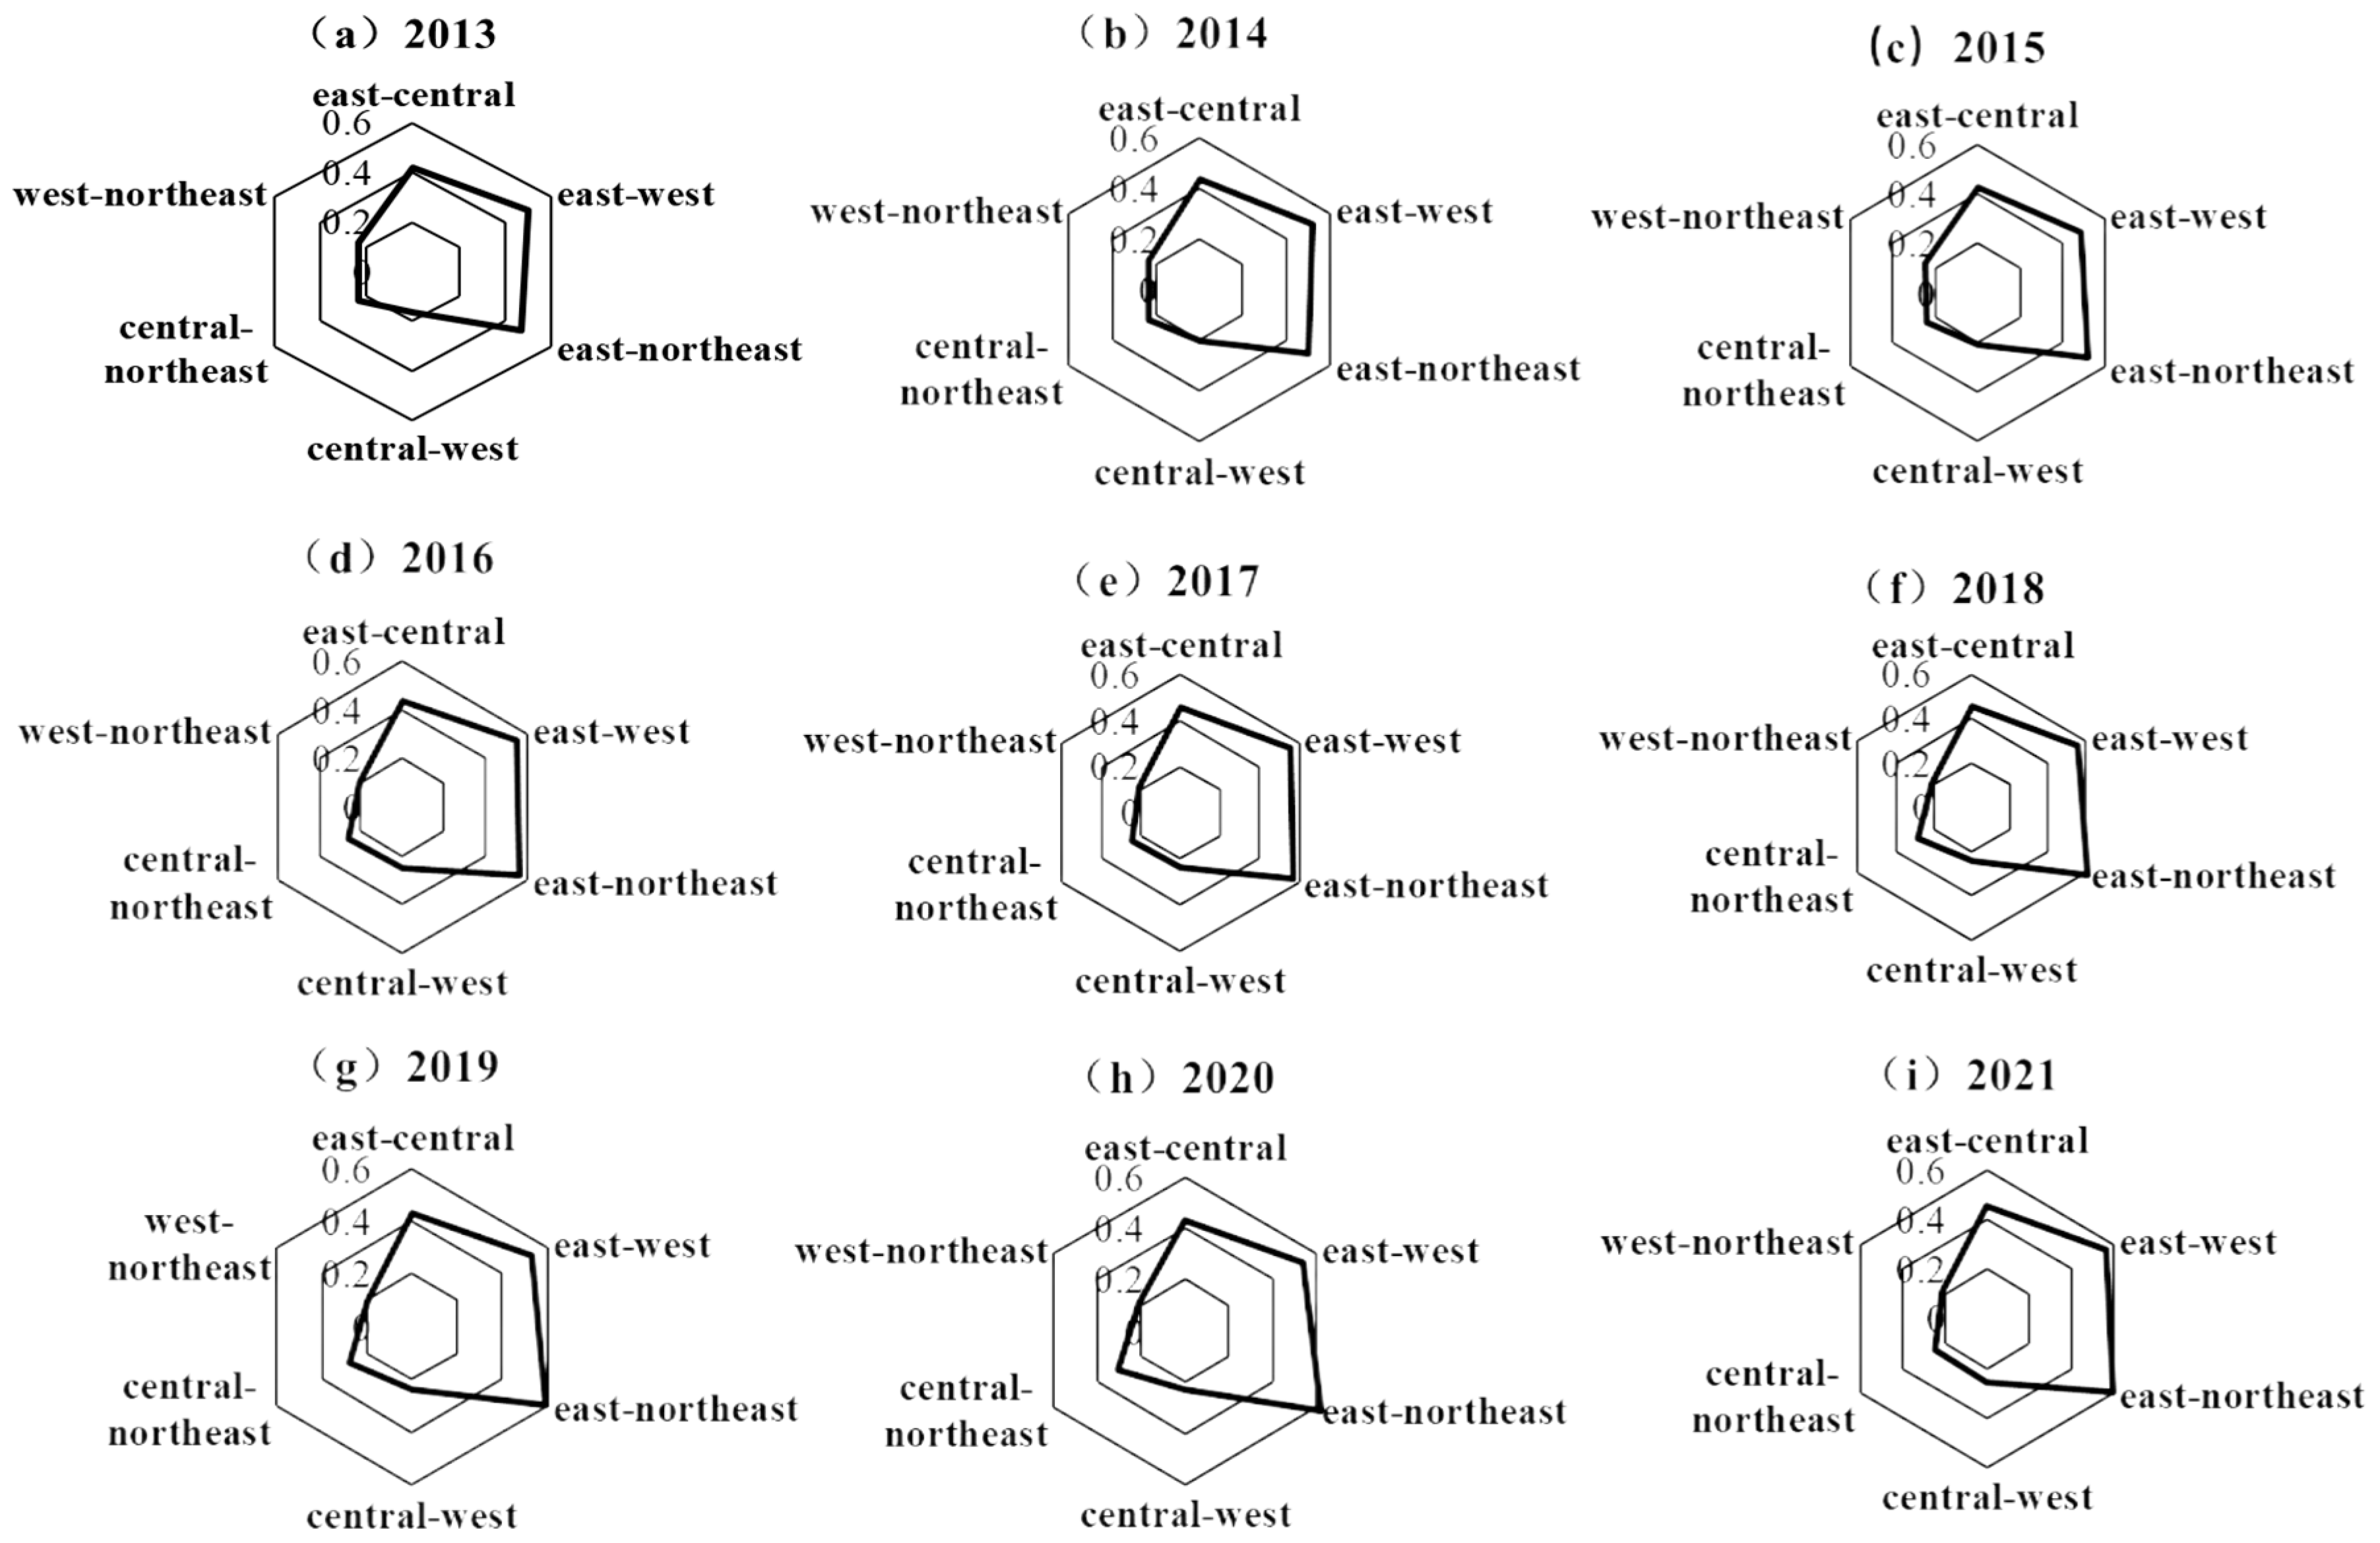
3.3.2. Differences in SL Development among Different Regions

The difference in SL development between the four regions was calculated using the Dagum Gini coefficient, as shown in Figure 3. The findings indicate that the degree and direction of the change in SL development between the four regions differ, and the differentiation trend of each region is clear. This large difference between the four regions originates from the comparison between the eastern regions and other regions, which confirms that the overall SL development in the eastern region is better than in other regions. This result is basically consistent with the spatial pattern of logistics development in China [92]. The most significant difference was found between the eastern region and the northeastern region. The reason is the large difference in the industrial structures of these two regions. Because of the economic structure and geographical factors, the industrial structure of the northeastern region is single, and the loss of talent is severe. Eastern regions are dominated by secondary and tertiary industries. The IT industry, new energy automotive industry, and smart equipment and robot industry are newly generated. Therefore, SL development differs between the northeastern region and the eastern region.
According to the time-varying trend of regional differences, the Gini coefficients of eastern, western, and northeastern regions are slowly increasing. Although the economic structures of western and northeastern regions are currently undergoing strategic transformation, they constantly optimize the development of the logistics industry. The logistics foundation and intellectualization of the western and northeastern regions are still severely behind those of the eastern region, and SL development is lower than in the eastern region. Therefore, to improve SL in the future, capital, technology, talent, policy, and other beneficial resources should focus on flowing to the central, western, and northeast regions of China. Through this directed flow, the development of China’s SL can be balanced, and the overall development can truly be achieved.
However, it should also be noted that, for the developed regions, the popularization of intelligent technology applications can effectively reduce costs and increase efficiency, but for less developed regions, overly high-end intelligent technologies are not fully applied, and it may be that relatively gradual technological upgrades are more in line with their needs. Therefore, the application of intelligent technology not only complies with the direction of industry development but also needs to combine with the region’s own situation. In terms of policy guidance, it is necessary to pay attention to whether the speed of intelligent technology innovation and policy constraints can be reasonably matched. Excessive regulation may limit the direction, speed, and activity of technological updating while lagging regulations will leave regulatory gaps.
The overall difference in SL development during the sample period can be decomposed into intra-group contributions, between-group contributions, and hypervariable density between groups, as shown in Figure 4. The contribution rate of regional differences from 2013 to 2021 exceeded 60%, with an average of 69.6%. This result indicates that the overall difference in SL development in China mainly lies in the differences between these four regions. Reducing the differences between eastern regions and other regions should be the focus of the coordinated development of SL in China in the future. The different contribution rates within the group did not change significantly over the sample period, indicating that the difference in SL development in the region needs to be optimized and narrowed. The contribution rate of super variable density among groups decreased from 9.3% in 2013 to 7.2% in 2021. This decrease indicates that the overlapping data in each region contributes the least to the overall difference, further indicating that the division into four regions is reasonable and can effectively distinguish different types of regions [35].

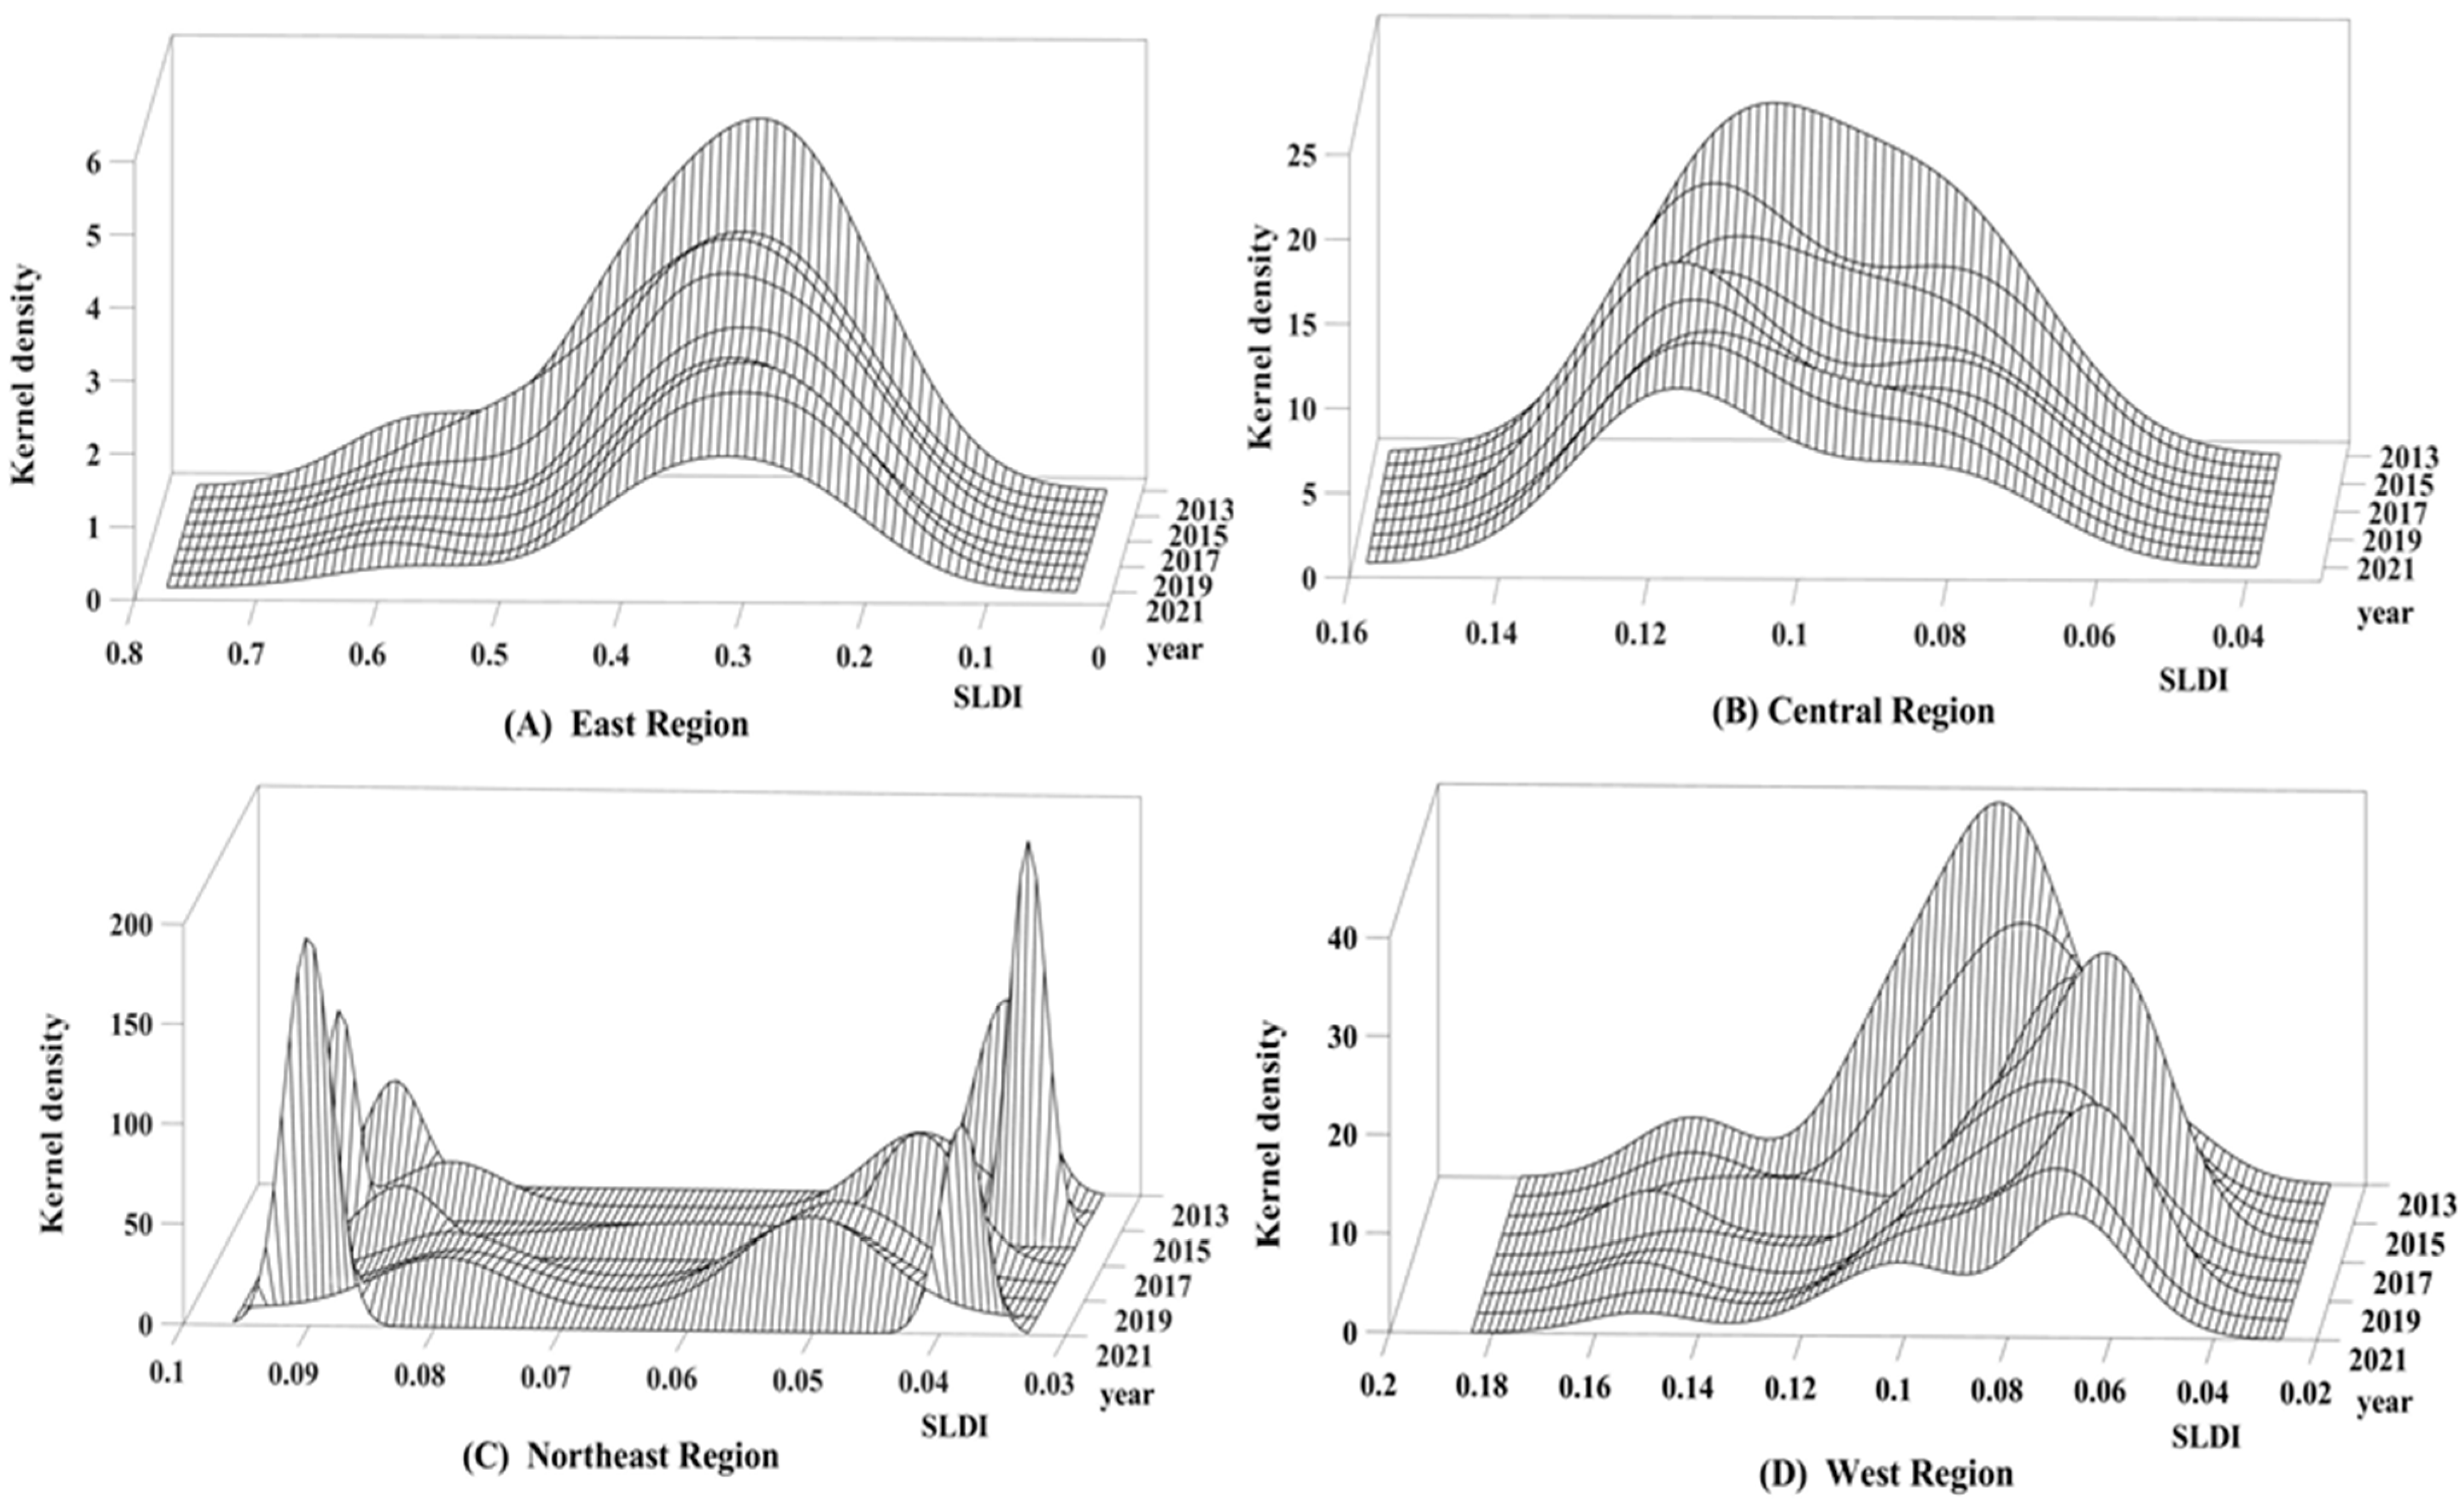
3.4. Distribution Characteristics of SL Development

Kernel density estimation was used to describe the distribution characteristics of SL development in China overall and in the four defined regions during the sample period, as shown in Figure 5 and Figure 6, respectively. The distribution location, main peak distribution pattern, distribution ductility, and number of wave peaks were analyzed. The specific characteristics are summarized in Table 4.
  • Distribution Position
As shown in Figure 4 and Figure 5, the Kernel density curve of the national total, eastern, and central regions showed a small shift to the left during the sample period. This small shift implies that the optimization of SL development in the region has achieved certain results and that the development trend is relatively stable. The curve of northeastern and western regions fluctuates from right to left, indicating that SL development in these regions fluctuated over the study period. The emergence of a short right shift in the curve implies that SL development in the region faces great pressure. The information transmitted by the position of the nuclear density curve can be corroborated with the previous analysis.
  • Distribution Pattern of Main Peaks
In Figure 4, the main peak height of the Kernel density curve at the national level decreases while the width increases. This result indicates that the dispersion of SL development in various provinces and cities across China is deepening. As shown in Figure 5, the eastern, central, and western regions also performed similarly to the national level. The height of the main peak in northeast China first decreased and then increased, while the width first increased and then decreased. This result indicates that the absolute difference in SL development in the three provinces included in this region expands first and then shrinks.
  • Distribution Malleability
In Figure 4 and Figure 5, the Kernel density distribution curves of the whole country, the eastern region, and the western region show a significant left tail phenomenon. This implies that SL development in certain provinces and cities in the focal region is significantly higher than that of other provinces and cities in the same region. Moreover, the distribution of the Kernel density curve is extended and widened, and its convergence is poor. This means that the gap between the extreme value and the average value in the region did not narrow gradually during the sample period, and the pressure of the balanced SL development in the region is strong. The distribution curve in the central region presents a right tail, and the distribution is extended and widened, meaning that SL development in certain regions is far lower than that of other regions, and the convergence is poor.
  • Number of Peaks
As shown in Figure 4, the distribution curve at the national level has excessive peak distribution during the sample period, which means that there is multi-polarization in SL development across China. Figure 5 shows that the eastern, central, and northeastern regions show a modal situation, as well as regional SL development polarization. The central and eastern regions show a weakening trend of polarization characteristics, while the eastern region shows the contrary. Because of the distance between the main peak and the side peak in the northeastern region, the area there shows a more apparent spatial polarization phenomenon. In 2021, two peaks are present, and the curve moves away from the average level. The bimodal phenomenon in the western region was more pronounced in the early stage of the sample and gradually developed into a single main peak and multiple peaks. The left peak was lower than the right peak, the wave of the left peak gradually converged to the average level, and the degree of differentiation in the region improved.

4. Discussions

In this paper, the entropy weight-TOPSIS method was used to calculate SL development in China overall and its provinces for 2013–2021. The following five dimensions were analyzed: driving force, pressure, state, impact, and response. The spatial and regional differences, as well as the evolution, were summarized using the Dagum Gini coefficient and Kernel density estimation. This study shows that China’s SL is doing well, but the regional imbalance of SL development in China is severe, and the degree of imbalance is gradually deepening. SL development in the eastern region is significantly higher than in other regions.
At present, there are few studies on the SL evaluation from a comprehensive perspective. To the best of our knowledge, the literature focuses on the topic of IT applications in SL and their effectiveness evaluation. There is a general consensus that SL is critical for economic development, efficiency enhancement, cost reduction, and customer satisfaction [1,2,11,13,16,18,21,25]. Meanwhile, researchers study different technologies, such as IoT, AI, ML, Blockchain, etc., applied in SL and their effectiveness [4,5,7,9,10,13,18]. Also, some studies focus on the evaluation of SL, such as intelligent logistics park evaluation [21], smart ports evaluation, SL distribution evaluation [22,26], and intelligent logistics storage space evaluation [27]. These documents provide support for understanding how IT has been applied in SL and how SL is evaluated. However, it generally lacks an in-depth analysis of the SL comprehensive evaluation, which leads to a lack of a comprehensive understanding of SL and a comparison of the differences in SL development in different regions. On this basis, this paper provides a new research perspective and expands on previous literature. First, unlike other studies, this paper focuses on comprehensive evaluation rather than one aspect. Second, the SLDI model this paper constructs reflects various aspects of SL development. It is necessary to establish an evaluation system like SLDI to make the whole assessment. Third, this paper analyzes the time and region differences using data from China. Through the comparison, we can better understand the reasons for the differences and provide references for analyzing the differences in SL in other regions.
In terms of method, researchers employ various approaches. However, most studies only use one or two methods. These methods support the analysis of problems in SL development. However, it generally lacks a method combination that can analyze SL from different dimensions. On this basis, this paper provides a new research method combination (ETDK), which calculates the indicator weight and closeness degree and analyzes the region’s differences and distribution characteristics. The ETDK will provide references for future research that evaluates subjects from different perspectives.
Based on the results, we propose countermeasures to promote SL development. First, the driving forces for development should be strengthened. The supply of professional talents in the logistics industry and the investment in capital and information networks should be increased. Further, the innovation environment should be continually improved to activate the development and trade of IT. The strategic achievements of cost reduction and efficiency increases in the logistics industry should be strengthened, and the industrial structure of the logistics industry in the tertiary industry should be optimized. Second, smart technology should be deeply applied. Based on improving the operation efficiency of the logistics industry, smart technologies and equipment such as the Internet of Things, cloud computing, automatic vehicles, and autonomous mobile robots should be fully and reasonably integrated. This can expand the application scenarios of the SL technology. Third, policy guidance and implementation should be strengthened. Relevant departments need to reasonably guide the development direction of SL, formulate targeted guidance policies, integrate short-term governance with long-term goals, and better support the optimized SL development.

5. Conclusions

The paper establishes the SLDI model based on the DPSIR model and evaluates SL using the ETDK method with data from China. It indicates that the evaluation system should be multidimensional and reflect various aspects of SL development. The empirical results show that (1) SL development in China overall and in most provinces was close to the ideal level. The eastern region is far ahead, and the development of the central region is relatively stable. The development of the western region and the northeastern region shows a recessive trend, and the optimization pressure is relatively high. The driving force of SL in China is significantly enhanced. The development pressure of SL has been alleviated to a certain extent. The development state of SL has been optimized, but there is still great room for further improvement. SL development has a beneficial impact on the logistics industry. However, the response degree is unstable. The development state of SL is very important and plays a key role in the overall progress. (2) The qualitative difference of SL is the largest in the eastern region. The overall development shows the distribution pattern of “high in the east, low in the west, and low in the northeast”. The imbalance in SL development in China is mainly the result of differences between the four regions. (3) The performances of the whole country and that of the eastern and central regions are similar. Moreover, the absolute difference in SL development has increased over the sample period. In the central region, several provinces and cities have low levels, and the gap between high and low levels has not been effectively alleviated in the sample period. The absolute difference in SL development in the three northeastern provinces is fluctuating, and the polarization phenomenon is always severe. The possibility of extreme values in the western region is continuously decreasing, and the polarization phenomenon gradually weakens.
Theoretically, compared with previous studies, this paper uses scientific methods to construct an evaluation indicator system for SL development, which helps to grasp the status of the development of the industry and its spatial distribution and provides a status quo reference for future research on SL, so that the theoretical results can be immersed in reality, and it is convenient for scholars to propose optimization paths and model innovations that are more practical and valuable references for subsequent research on identifying problems and improving paths. Practically, we can understand the status quo and coordination of national and regional SL development and help the regional logistics industry identify its own positioning. A systematic and comprehensive understanding of SL helps to provide a reference for the guidelines and policies to promote SL development. The analysis of the evolution trend of its spatial pattern can provide ideas for future SL development and references for the SL industry achieving coordinated and healthy development.
However, this study still has some shortcomings and limitations. The paper explains the dynamic evolution of national and regional SL development, but it does not dig deep into the specific factors affecting SL development in each region. The analysis of SL development is only from the perspective of the industry, without considering the mutual influence and role of the logistics industry and other industries.
Future research in the field of SL should focus on the following aspects. (1) Further identify the main obstacle factors affecting SL development on the basis of mastering the pattern of SL. (2) More accurate indicator data should be used to link SL development with the current state of the economy and other industries so as to view SL from a more comprehensive and detailed perspective. (3) Scholars should note that SL can help various industries reduce costs and increase efficiency by improving the efficiency of logistics operations and optimizing the supply chain. Research that is more closely and deeply connected to the current situation is more meaningful in guiding practice.

Author Contributions

Conceptualization, Y.L. and J.Z.; Conceived and designed the analysis, J.Z.; methodology, J.Z.; data curation, J.Z.; writing—original draft preparation, J.Z.; writing—review and editing, Y.L.; visualization, Y.L.; supervision, Y.L.; project administration, Y.L.; funding acquisition, Y.L. All authors have read and agreed to the published version of the manuscript.

Funding

This research was funded by the Project of Jilin Provincial Department of Education, grant number JJKH20220614SK, and the Project of Changchun Science and Technology Bureau, grant number 22CF02.

Data Availability Statement

The research data are from the China Statistical Yearbook (https://www.stats.gov.cn/sj/ndsj/, accessed on 16 April 2023), the China Population and Employment Statistical Yearbook, the China Energy Statistical Yearbook, the China Tertiary Industry Statistical Yearbook, the China High-tech Statistical Yearbook, the China Financial Statistical Yearbook, and the China Stock Market & Accounting Research Database (CSMAR) (https://data.csmar.com/csmar.html#/index, accessed on 16 April 2023).

Conflicts of Interest

The authors identify and declare that there are no personal circumstances or interests that may be perceived as inappropriately influencing the representation or interpretation of reported research results. The funders had no role in the design of the study; in the collection, analyses, or interpretation of data; in the writing of the manuscript; or in the decision to publish the results.

References

  1. Feng, B.; Ye, Q. Operations Management of Smart Logistics: A Literature Review and Future Research. Front. Eng. Manag. 2021, 8, 344–355. [Google Scholar] [CrossRef]
  2. Tang, X. Research on Smart Logistics Model Based on Internet of Things Technology. IEEE Access 2020, 8, 151150–151159. [Google Scholar] [CrossRef]
  3. Stević, Ž.; Korucuk, S.; Karamaşa, Ç.; Demir, E.; Zavadskas, E.K. A Novel Integrated Fuzzy-Rough MCDM Model for Assessment of Barriers Related to Smart Logistics Applications and Demand Forecasting Method in the COVID-19 Period. Int. J. Inf. Technol. Decis. Mak. 2022, 21, 1647–1678. [Google Scholar] [CrossRef]
  4. Song, Y.; Yu, F.R.; Zhou, L.; Yang, X.; He, Z. Applications of the Internet of Things (iot) in Smart Logistics: A Comprehensive Survey. IEEE Internet Things J. 2021, 8, 4250–4274. [Google Scholar] [CrossRef]
  5. Woschank, M.; Rauch, E.; Zsifkovits, H. A Review of Further Directions for Artificial Intelligence, Machine Learning, and Deep Learning in Smart Logistics. Sustainability 2020, 12, 3760. [Google Scholar] [CrossRef]
  6. Issaoui, Y.; Khiat, A.; Bahnasse, A.; Ouajji, H. Toward Smart Logistics: Engineering Insights and Emerging Trends. Arch. Computat. Methods Eng. 2021, 28, 3183–3210. [Google Scholar] [CrossRef]
  7. Cioffi, R.; Travaglioni, M.; Piscitelli, G.; Petrillo, A.; de Felice, F. Artificial Intelligence and Machine Learning Applications in Smart Production: Progress, Trends, and Directions. Sustainability 2020, 12, 492. [Google Scholar] [CrossRef]
  8. Zsifkovits, H.; Woschank, M. Smart Logistics–Technologiekonzepte und Potentiale. BHM Berg Hüttenmännische Monatshefte 2019, 164, 42–45. [Google Scholar] [CrossRef]
  9. Lee, C.K.M.; Lv, Y.; Ng, K.K.H.; Ho, W.; Choy, K.L. Design and Application of Internet of Things—Based Warehouse Management System for Smart Logistics. Int. J. Prod. Res. 2018, 56, 2753–2768. [Google Scholar] [CrossRef]
  10. Zhou, F.; Yu, K.; Xie, W.; Lyu, J.; Zheng, Z.; Zhou, S. Digital Twin-Enabled Smart Maritime Logistics Management in the Context of Industry 5.0. IEEE Access 2024, 12, 10920–10931. [Google Scholar] [CrossRef]
  11. McFarlane, D.; Giannikas, V.; Lu, W. Intelligent Logistics: Involving the Customer. Comput. Ind. 2016, 81, 105–115. [Google Scholar] [CrossRef]
  12. Lagorio, A.; Cimini, C.; Pinto, R.; Cavalieri, S. 5G in Logistics 4.0: Potential Applications and Challenges. Procedia Comput. Sci. 2023, 217, 650–659. [Google Scholar] [CrossRef]
  13. Ding, Y.; Jin, M.; Li, S.; Feng, D. Smart Logistics Based on the Internet of Things Technology: An Overview. Int. J. Logist. Res. Appl. 2020, 24, 323–345. [Google Scholar] [CrossRef]
  14. Brunetti, M.; Mes, M.; Lalla-Ruiz, E. Smart Logistics Nodes: Concept and Classification. Int. J. Logist. Res. Appl. 2024, 27, 1–37. [Google Scholar] [CrossRef]
  15. Issaoui, Y.; Khiat, A.; Haricha, K.; Bahnasse, A.; Ouajji, H. An Advanced System to Enhance and Optimize Delivery Operations in a Smart Logistics Environment. IEEE Access 2022, 10, 6175–6193. [Google Scholar] [CrossRef]
  16. Liu, W.; Zhang, J.; Shi, Y.; Tae-Woo Lee, P.; Liang, Y. Intelligent Logistics Transformation Problems in Efficient Commodity Distribution. Transp. Res. Part E Logist. Transp. Rev. 2022, 163, 102735. [Google Scholar] [CrossRef]
  17. Stanislawski, R.; Szymonik, A. Assessment of Barriers to the Implementation of Intelligent (Smart) Logistics on the Example of Selected Systems Among Manufacturing Companies in Poland. Eur. Res. Stud. J. 2021, XXIV, 480–508. [Google Scholar] [CrossRef]
  18. Fu, Y.; Zhu, J. Operation Mechanisms for Intelligent Logistics System: A Blockchain Perspective. IEEE Access 2019, 7, 144202–144213. [Google Scholar] [CrossRef]
  19. Alshdadi, A.; Irshad, A. PDAC-SL: A PUF-Enabled Drone Access Control Technique for Smart Logistics. Alex. Eng. J. 2024, 107, 747–756. [Google Scholar] [CrossRef]
  20. Khatib, J.; Barco, R. Optimization of 5G Networks for Smart Logistics. Energies 2021, 14, 1758. [Google Scholar] [CrossRef]
  21. Tao, J.; Ni, S.; Ding, T. Research on Collaborative Innovation Evaluation of Intelligent Logistics Park. IEEE Trans. Eng. Manag. 2023, 70, 4048–4061. [Google Scholar] [CrossRef]
  22. Li, H.; Lu, L.; Yang, L. Study on the Extension Evaluation of Smart Logistics Distribution of Fresh Agricultural Products Based on the Perspective of Customers. J. Intell. Fuzzy Syst. 2022, 43, 615–626. [Google Scholar] [CrossRef]
  23. Huo, Y.F.; Tang, H.Y.; Hu, H.J. Construction of an Evaluation Index System for the Development Level of Regional Smart Logistics. Logist. Technol. 2024, 43, 151–160. [Google Scholar]
  24. Göçmen, E. Smart Airport: Evaluation of Performance Standards and Technologies for a Smart Logistics Zone. Transp. Res. Rec. 2021, 7, 480–490. [Google Scholar] [CrossRef]
  25. Liu, W.; Wang, S.; Dong, D.; Wang, J. Evaluation of the Intelligent Logistics Eco-index: Evidence from China. J. Clean. Prod. 2020, 274, 123127. [Google Scholar] [CrossRef]
  26. Wang, Z. Evaluation and Analysis of Intelligent Logistics Distribution Using the Expectation-Maximization Algorithm Calculation Model. Math. Probl. Eng. 2022, 2022, 5001467. [Google Scholar] [CrossRef]
  27. Wang, X.; He, S.; Zhang, X.; An, Y. On the Thermal Field Characteristics and Evaluation Method of Intelligent Logistics Storage Space. Int. J. Heat Technol. 2022, 40, 1340–1347. [Google Scholar] [CrossRef]
  28. Liu, W.; Wei, W.; Yan, X.; Dong, D.; Chen, Z. Sustainability Risk Management in A Smart Logistics Ecological Chain: An Evaluation Framework Based on Social Network Analysis. J. Clean. Prod. 2020, 276, 124189. [Google Scholar] [CrossRef]
  29. Zhang, X. Construction of an Evaluation Index System for Smart Ports. Port Sci. Technol. 2020, 42, 1–3. [Google Scholar]
  30. Wei, G.; Ji, X. Comprehensive Evaluation of the Logistics Development Level in the Beijing-Tianjin-Hebei Region. J. Comm. Econ. 2019, 38, 101–103. [Google Scholar]
  31. Ma, R.; Luo, H.; Wang, H.; Wang, T. Study on the Evaluation Index System and Measurement of High-quality Regional Economic Development in China. China Soft Sci. 2019, 34, 60–67. [Google Scholar]
  32. Meng, M.; Wang, Y.; Ye, F. Research on High-Quality Development Level Measurement and Spatial Distribution Characteristics of China’s Logistics Industry. J. Ind. Technol. Econ. 2022, 40, 103–110. [Google Scholar]
  33. Zhu, Y.; He, H.; Zhang, W.; Du, S. Assessment of Water Resources Vulnerability in Changchun City Based on the DPSIR-TOPSIS Model. Bull. Soil Water Conserv. 2022, 42, 1–7. [Google Scholar]
  34. Hu, W.; Xi, N.; Wang, W.; Zhu, R.; Xiao, J. Spatial Differences and Dynamic Evolution of Health Human Resources Distribution in China: An Empirical Study Based on Dagum’s Gini Coefficient Decomposition and Kernel Density Estimation. Chin. J. Health Policy 2022, 15, 17–23. [Google Scholar]
  35. Zhang, Z.; Zhang, T.; Feng, D. Research on the Regional Difference, Dynamic Evolution, and Convergence of Carbon Emission Intensity in China. J. Quant. Technol. Econ. 2022, 39, 67–87. [Google Scholar]
  36. Zhu, Z.; Yang, F.; Li, W. Analysis of the Three-Dimensional Innovation Ecosystem and Level Measurement of New-Quality Productivity. Yunnan Univ. Financ. Econ. J. 2024, 40, 1–14. [Google Scholar]
  37. National Bureau of Statistics of China. China Statistical Yearbook; China Statistics Press: Beijing, China, 2014. [Google Scholar]
  38. National Bureau of Statistics of China. China Statistical Yearbook; China Statistics Press: Beijing, China, 2015. [Google Scholar]
  39. National Bureau of Statistics of China. China Statistical Yearbook; China Statistics Press: Beijing, China, 2016. [Google Scholar]
  40. National Bureau of Statistics of China. China Statistical Yearbook; China Statistics Press: Beijing, China, 2017. [Google Scholar]
  41. National Bureau of Statistics of China. China Statistical Yearbook; China Statistics Press: Beijing, China, 2018. [Google Scholar]
  42. National Bureau of Statistics of China. China Statistical Yearbook; China Statistics Press: Beijing, China, 2019. [Google Scholar]
  43. National Bureau of Statistics of China. China Statistical Yearbook; China Statistics Press: Beijing, China, 2020. [Google Scholar]
  44. National Bureau of Statistics of China. China Statistical Yearbook; China Statistics Press: Beijing, China, 2021. [Google Scholar]
  45. National Bureau of Statistics of China. China Statistical Yearbook; China Statistics Press: Beijing, China, 2022. [Google Scholar]
  46. National Bureau of Statistics of China. China Population and Employment Statistical Yearbook; China Statistics Press: Beijing, China, 2014. [Google Scholar]
  47. National Bureau of Statistics of China. China Population and Employment Statistical Yearbook; China Statistics Press: Beijing, China, 2015. [Google Scholar]
  48. National Bureau of Statistics of China. China Population and Employment Statistical Yearbook; China Statistics Press: Beijing, China, 2016. [Google Scholar]
  49. National Bureau of Statistics of China. China Population and Employment Statistical Yearbook; China Statistics Press: Beijing, China, 2017. [Google Scholar]
  50. National Bureau of Statistics of China. China Population and Employment Statistical Yearbook; China Statistics Press: Beijing, China, 2018. [Google Scholar]
  51. National Bureau of Statistics of China. China Population and Employment Statistical Yearbook; China Statistics Press: Beijing, China, 2019. [Google Scholar]
  52. National Bureau of Statistics of China. China Population and Employment Statistical Yearbook; China Statistics Press: Beijing, China, 2020. [Google Scholar]
  53. National Bureau of Statistics of China. China Population and Employment Statistical Yearbook; China Statistics Press: Beijing, China, 2021. [Google Scholar]
  54. National Bureau of Statistics of China. China Population and Employment Statistical Yearbook; China Statistics Press: Beijing, China, 2022. [Google Scholar]
  55. National Bureau of Statistics of China. China Energy Statistical Yearbook; China Statistics Press: Beijing, China, 2014. [Google Scholar]
  56. National Bureau of Statistics of China. China Energy Statistical Yearbook; China Statistics Press: Beijing, China, 2015. [Google Scholar]
  57. National Bureau of Statistics of China. China Energy Statistical Yearbook; China Statistics Press: Beijing, China, 2016. [Google Scholar]
  58. National Bureau of Statistics of China. China Energy Statistical Yearbook; China Statistics Press: Beijing, China, 2017. [Google Scholar]
  59. National Bureau of Statistics of China. China Energy Statistical Yearbook; China Statistics Press: Beijing, China, 2018. [Google Scholar]
  60. National Bureau of Statistics of China. China Energy Statistical Yearbook; China Statistics Press: Beijing, China, 2019. [Google Scholar]
  61. National Bureau of Statistics of China. China Energy Statistical Yearbook; China Statistics Press: Beijing, China, 2020. [Google Scholar]
  62. National Bureau of Statistics of China. China Energy Statistical Yearbook; China Statistics Press: Beijing, China, 2021. [Google Scholar]
  63. National Bureau of Statistics of China. China Energy Statistical Yearbook; China Statistics Press: Beijing, China, 2022. [Google Scholar]
  64. National Bureau of Statistics of China. China Statistical Yearbook of the Tertiary Industry; China Statistics Press: Beijing, China, 2014. [Google Scholar]
  65. National Bureau of Statistics of China. China Statistical Yearbook of the Tertiary Industry; China Statistics Press: Beijing, China, 2015. [Google Scholar]
  66. National Bureau of Statistics of China. China Statistical Yearbook of the Tertiary Industry; China Statistics Press: Beijing, China, 2016. [Google Scholar]
  67. National Bureau of Statistics of China. China Statistical Yearbook of the Tertiary Industry; China Statistics Press: Beijing, China, 2017. [Google Scholar]
  68. National Bureau of Statistics of China. China Statistical Yearbook of the Tertiary Industry; China Statistics Press: Beijing, China, 2018. [Google Scholar]
  69. National Bureau of Statistics of China. China Statistical Yearbook of the Tertiary Industry; China Statistics Press: Beijing, China, 2019. [Google Scholar]
  70. National Bureau of Statistics of China. China Statistical Yearbook of the Tertiary Industry; China Statistics Press: Beijing, China, 2020. [Google Scholar]
  71. National Bureau of Statistics of China. China Statistical Yearbook of the Tertiary Industry; China Statistics Press: Beijing, China, 2021. [Google Scholar]
  72. National Bureau of Statistics of China. China Statistical Yearbook of the Tertiary Industry; China Statistics Press: Beijing, China, 2022. [Google Scholar]
  73. National Bureau of Statistics of China. China Statistics Yearbook on High Technology Industry; China Statistics Press: Beijing, China, 2014. [Google Scholar]
  74. National Bureau of Statistics of China. China Statistics Yearbook on High Technology Industry; China Statistics Press: Beijing, China, 2015. [Google Scholar]
  75. National Bureau of Statistics of China. China Statistics Yearbook on High Technology Industry; China Statistics Press: Beijing, China, 2016. [Google Scholar]
  76. National Bureau of Statistics of China. China Statistics Yearbook on High Technology Industry; China Statistics Press: Beijing, China, 2017. [Google Scholar]
  77. National Bureau of Statistics of China. China Statistics Yearbook on High Technology Industry; China Statistics Press: Beijing, China, 2018. [Google Scholar]
  78. National Bureau of Statistics of China. China Statistics Yearbook on High Technology Industry; China Statistics Press: Beijing, China, 2019. [Google Scholar]
  79. National Bureau of Statistics of China. China Statistics Yearbook on High Technology Industry; China Statistics Press: Beijing, China, 2020. [Google Scholar]
  80. National Bureau of Statistics of China. China Statistics Yearbook on High Technology Industry; China Statistics Press: Beijing, China, 2021. [Google Scholar]
  81. National Bureau of Statistics of China. China Statistics Yearbook on High Technology Industry; China Statistics Press: Beijing, China, 2022. [Google Scholar]
  82. Editorial Committee of Finance Yearbook of China. Finance Yearbook of China; China State Finance Magazine: Beijing, China, 2014. [Google Scholar]
  83. Editorial Committee of Finance Yearbook of China. Finance Yearbook of China; China State Finance Magazine: Beijing, China, 2015. [Google Scholar]
  84. Editorial Committee of Finance Yearbook of China. Finance Yearbook of China; China State Finance Magazine: Beijing, China, 2016. [Google Scholar]
  85. Editorial Committee of Finance Yearbook of China. Finance Yearbook of China; China State Finance Magazine: Beijing, China, 2017. [Google Scholar]
  86. Editorial Committee of Finance Yearbook of China. Finance Yearbook of China; China State Finance Magazine: Beijing, China, 2018. [Google Scholar]
  87. Editorial Committee of Finance Yearbook of China. Finance Yearbook of China; China State Finance Magazine: Beijing, China, 2019. [Google Scholar]
  88. Editorial Committee of Finance Yearbook of China. Finance Yearbook of China; China State Finance Magazine: Beijing, China, 2020. [Google Scholar]
  89. Editorial Committee of Finance Yearbook of China. Finance Yearbook of China; China State Finance Magazine: Beijing, China, 2021. [Google Scholar]
  90. Editorial Committee of Finance Yearbook of China. Finance Yearbook of China; China State Finance Magazine: Beijing, China, 2022. [Google Scholar]
  91. Ma, Y. Research on Spatial Spillover Effects of Total Factor Productivity in China’s Regional Logistics Industry from a Low-carbon Perspective. Macroeconomics 2016, 62, 90–101+144. [Google Scholar]
  92. Zhang, B.; Gao, J.; Tan, X.; Meng, L.; Yu, Y. Evaluation of High-Quality Development Level and Regional Difference Evolution of China’s Logistics Industry. Econ. Geogr. 2023, 43, 111–120. [Google Scholar]
Figure 1. Research design.
Systems 12 00405 g001
Figure 2. Changes of differences in the group of SL development in China.
Systems 12 00405 g002
Figure 3. Changes of inter-group differences in SL development in China.
Systems 12 00405 g003
Figure 4. Contribution rate of differences in SL development in China.
Systems 12 00405 g004
Figure 5. Kernel density chart of the SLDI in China from 2013 to 2021.
Systems 12 00405 g005
Figure 6. Kernel density chart of the SLDI by region from 2013 to 2021.
Systems 12 00405 g006
Table 1. SLDI model and indicator weight.
Level 1 IndicatorsLevel 2 IndicatorsLevel 3 IndicatorsUnitIndicator Nature
Driving force
D
(0.1857)
Personnel input D1 (0.0146)The average wage of employed personnel in non-private units in logistics towns D11 (0.0146)Yuan+
Capital input D2 (0.0261)Logistics industry fixed assets investment D21 (0.0261)100 million+
Industrial structure D3 (0.0125)Proportion of the logistics industry value-added in the tertiary industry value-added D31 (0.0125)%+
Information network popularity D4 (0.1325)Size of Internet broadband users D41 (0.0284)Ten thousand households+
Number of IPv4 addresses D42 (0.0567)Ten thousand+
Number of computers used in the logistics industry D43 (0.0474)Piece+
Pressure
P
(0.1058)
Talent pressure P1 (0.0333)Proportion of talents with bachelor’s degree or above P11 (0.0333)%+
Technical pressure P2 (0.0721)Technology market transaction volume P21 (0.0721)Ten thousand yuan+
Cost pressure P3 (0.0004)Social logistics cost P31 (0.0004)Billions of yuan
State
S
(0.3459)
Service level S1 (0.1764)Turnover of freight traffic S11 (0.0410)Billion tons per kilometer+
Express volume S12 (0.0782)Ten thousand pieces+
Total postal service volume S13 (0.0572)Billions of yuan+
Technical level S2 (0.1695)E-commerce sales volume S21 (0.0565)Billions of yuan+
Number of valid invention patents in the electronics and communication equipment manufacturing industry S22 (0.113)Piece+
Impact
I
(0.1749)
Industry operation I1 (0.0027)Logistics industry value-added index I11 (0.0027)%+
Industry website popularity degree I2 (0.0826)The number of enterprise websites I21 (0.0393)Individual+
Number of enterprises with e-commerce transactions I22 (0.0433)Individual+
IT benefit I3 (0.0849)Information transmission, software, and IT services revenue I31 (0.0849)Billions of yuan+
Green development I4 (0.0047)Carbon emissions I41 (0.0047)Ten thousand tons
Response
R
(0.1877)
Technology input R1 (0.1741)R&D investment in electronics & communication equipment manufacturing R11 (0.0883)Ten thousand yuan+
R&D personnel in electronics & communication equipment manufacturing industry R12 (0.0858)Person+
Policy response R2 (0.0136)Proportion of transportation expenditure in the total expenditure in the financial expenditure R21 (0.0136)%+
Note: In this table, the index nature “+” is a positive index, where the larger the value, the better; “−” is a negative index, where the smaller the value, the better.
Table 2. Index and relative closeness degrees of the five dimensions of China’s SL from 2013 to 2021.
YearDriving Force IndexPressure IndexState IndexImpact IndexResponse IndexRelative
Closeness Degrees
20130.10960.10600.06740.17340.11080.0777
20140.13640.10730.08000.18840.11510.0897
20150.13970.11980.06390.21320.10030.0931
20160.15670.12690.07280.21850.08740.0996
20170.19540.13230.08480.21830.09210.1105
20180.21680.14690.09460.22380.09690.1208
20190.23460.16600.10890.18950.09980.1223
20200.24560.18440.11620.18950.11920.1318
20210.28460.21250.13340.25350.12670.1632
Table 3. SLDI in all provinces (municipalities and autonomous regions) of China from 2013 to 2021.
Area201320142015201620172018201920202021Average Closeness DegreeRanking
Beijing0.1800.2610.1970.2190.3020.3200.3120.3200.4220.2812
Tianjin0.0680.0660.0740.0760.0770.0880.0880.0920.1130.08216
Hebei0.0800.0880.0810.0880.0980.1060.1100.1250.1330.10112
Shanxi0.0390.0400.0430.0440.0450.0520.0580.0620.0690.05022
Inner Mongolia0.0450.0450.0410.0440.0470.0500.0530.0540.0610.04925
Liaoning0.0880.0960.0880.0790.0870.0810.0790.0750.0900.08514
Jilin0.0350.0400.0350.0380.0430.0450.0490.0450.0910.04726
Heilongjiang0.0330.0350.0360.0380.0400.0400.0440.0490.0530.04128
Shanghai0.1210.1550.1620.1750.1920.2100.2170.2250.3040.1965
Jiangsu0.1910.2110.2250.2390.2510.2630.2450.2770.3700.2523
Zhejiang0.1490.1700.1830.2110.2240.2500.2640.3040.3560.2354
Anhui0.0750.0880.0900.1000.1010.1090.1140.1210.1520.10610
Fujian0.0810.0850.0920.1060.1140.1260.1200.1250.1500.1118
Jiangxi0.0440.0450.0470.0500.0560.0640.0710.0780.0910.06120
Shandong0.1140.1370.1410.1690.1810.2060.1830.1950.2640.1776
Henan0.0680.0820.0830.0940.1040.1150.1190.1310.1470.10511
Hubei0.0670.0820.0890.1030.1060.1180.1230.1290.1580.1089
Hunan0.0550.0640.0660.0770.0810.0920.0930.1040.1230.08415
Guangdong0.2990.3460.3810.4450.5090.5660.5640.6170.7760.5001
Guangxi0.0420.0440.0430.0490.0530.0620.0680.0810.1050.06119
Hainan0.0300.0340.0310.0330.0360.0360.0410.0420.0620.03829
Chongqing0.0440.0500.0540.0620.0670.0740.0760.0810.1090.06918
Sichuan0.0750.0910.0950.1160.1270.1470.1480.1530.1840.1267
Guizhou0.0410.0510.0420.0460.0540.0600.0570.0600.0620.05321
Yunnan0.0540.0620.0550.0590.0740.0810.0930.0980.1030.07517
Shanxi0.0500.0620.1160.0670.0760.0840.0900.1000.1300.08613
Gansu0.0370.0420.0580.0380.0420.0470.0500.0510.0550.04727
Qinghai0.0560.0530.0490.0440.0370.0450.0470.0600.0580.05023
Ningxia0.0270.0310.0390.0350.0370.0370.0420.0450.0450.03830
Xinjiang0.0420.0360.0560.0440.0530.0510.0520.0540.0600.05024
Table 4. Evolution characteristics of SL development in China overall as well as in four different regions as defined in Section 4.
RegionDistribution PositionDistribution Pattern of Main PeakDistribution DuctilityNumber of Peaks
NationwideLeftThe height decreases and the width increasesLeft tail, extension, and wideningMulti-peak or double-peak
EastLeftThe height decreases and the width increasesLeft tail, extension, and wideningSingle peak or double peak
CenterLeftThe height decreases and the width increasesRight tail, extension, and wideningDoublet
NortheastFirst right, then leftThe height decreases first and then increases; the width first increases and then decreasesNo significant tailing is presentDoublet
WestFirst right, then leftThe height increases and the width decreasesLeft tail, extension, and wideningDouble peak or multi-peak
Disclaimer/Publisher’s Note: The statements, opinions and data contained in all publications are solely those of the individual author(s) and contributor(s) and not of MDPI and/or the editor(s). MDPI and/or the editor(s) disclaim responsibility for any injury to people or property resulting from any ideas, methods, instructions or products referred to in the content.

