Abstract
With the continuous evolution of international trade, the global market has been steadily expanding while also facing increasing challenges, particularly in relation to the introduction of environmental policies such as carbon barriers. Our research explores how China’s power battery manufacturers can adapt their export strategies to the EU’s carbon barrier policies. Additionally, we examine the roles of government regulations, research institutions, and manufacturers in either facilitating or hindering compliance with carbon reduction objectives. Using evolutionary game theory, we construct models involving government entities, manufacturers, and research institutions to systematically analyze market evolution, strategic interactions, and outcomes among these stakeholders. Our analysis focuses on understanding the competitive dynamics faced by exporting countries under stringent environmental policies and provides strategic insights to guide export strategies. Taking the EU’s carbon barrier policy as a case study, we explore Chinese battery manufacturers’ adaptive strategies and decision-making processes as they respond to shifting market demands and regulatory environments. The findings not only offer valuable insights into exporting countries but also provide policymakers with information on international trade and industrial policy design. Furthermore, we validate our model through numerical simulations and conduct sensitivity analyses on key parameters. The results underscore the importance of governmental adoption of punitive and incentive policies, revealing their substantial impact on stakeholder behavior. Additionally, the study highlights how participants’ pre-cooperation losses and post-cooperation gains influence participation rates and the speed at which stakeholder consensus is reached. By offering a novel approach with which to address carbon barrier challenges, this research contributes valuable perspectives on environmental regulations’ strategic and policy implications in global trade.
1. Introduction
In recent years, the power battery industry has emerged as a vital domain in the energy transition and the rapid development of the automotive sector [1]. The worldwide power battery market is experiencing significant growth, with the European Union (EU) market standing out as a crucial sales destination. In 2022, Europe recorded 2.6 million new energy vehicle sales, representing 28% of the entire European automobile market. This demonstrated the importance of this region for global power battery producers. According to SNE Research, the market share of power batteries produced in China in the EU rose from 14.9% in 2020 to 34% in 2023. However, Chinese power battery companies face significant challenges in the EU market [2].
These challenges stem from the EU’s rigorous requirements for product quality, safety, and environmental standards, particularly regarding carbon footprint transparency and digital battery passports. As a global leader in climate change mitigation, the EU has imposed stringent policies that affect numerous companies involved in supplying parts and exporting vehicles. The limited accumulation of comprehensive lifecycle carbon footprint data among battery companies [3] has created a substantial bottleneck for Chinese firms entering the European market. The absence of robust carbon accounting practices exacerbates these challenges, potentially impacting many suppliers of power batteries to the EU and creating barriers to market access.
In order to address these issues, Chinese power battery enterprises need to develop strategic export approaches and strengthen technology and system management to mitigate trade risks. Given the inconsistencies in the standard carbon footprint database and the lack of international recognition [4], coordinated efforts involving governments, enterprises, and research institutions are essential. The implementation of the EU Battery Act introduces stricter requirements for carbon footprint tracking, necessitating a coordinated approach to developing carbon accounting systems, supported by government policies and technological innovations [5]. Collaboration among stakeholders is critical, with government agencies, manufacturers, and research institutions playing distinct yet interconnected roles. The interaction between technical innovation and sustainability remains crucial [6], and research institutions are uniquely positioned to support the development of carbon accounting models, unlike third-party testing agencies. These institutions can aid in policy formulation by developing advanced carbon tracking methods. A transition from “noncooperation” to “cooperation” among these entities is necessary for sustaining the competitive advantage of China’s power battery industry in the global market. Government departments, despite having limited resources, must enhance supervision to ensure compliance. Manufacturers, driven by profit maximization, must shift away from cost-cutting practices that ignore environmental responsibilities. Research institutions require greater talent and funding to fulfill their roles effectively. This study proposes a synergistic governance system led by the government, with active participation from producer enterprises and research institutions. This involves delineating responsibilities: governments should provide policy support, enterprises should offer practical experience, and research institutions should drive technological innovation, collectively enhancing the industry’s global competitiveness.
Most of the existing research on power batteries predominantly emphasizes recycling and waste management, often overlooking the multifaceted impacts of new regulatory frameworks such as the European Union’s carbon barrier policies. For instance, Savaskan, Bhattacharya, and Van Wassenhove [7] examined recycling pathways for power batteries and concluded that the dealer-as-recycler model is optimal when all other conditions are equal. Kaushal, Nema, and Chaudhary [8] employed a noncooperative game theory approach to manage e-waste and battery recycling more effectively. Furthermore, Golmohammadzadeh, Faraji, and Rashchi [9] found that organic acid leaching technology is a more environmentally friendly alternative to conventional hydrometallurgy for power battery recycling, while bioleaching technology has shown both environmental and economic benefits [10]. Tan, Tian, Xu, and Li [11] focused on the reverse supply chain, applying a multi-objective optimization approach that involves using an improved version of non-dominated sorting genetic algorithm-II to address global optimization challenges. Despite these advancements, there remains a significant research gap concerning the strategic behavior of and interactions among key stakeholders—such as manufacturers, governments, and research institutions—when confronted with stringent carbon restrictions in international trade. Studies have yet to comprehensively address the complexities introduced by these carbon barriers or explore how market participants can adapt their strategies to achieve sustainable growth. To fill this gap, our research develops an evolutionary game model that captures the dynamic decision-making behaviors of key stakeholders in the context of maximizing the advancement of individual and collective interests under carbon constraints. We also conduct simulation analyses to investigate how various factors influence stakeholder behavior, ultimately identifying the steady-state conditions of system evolution. By addressing these research questions, our study provides a novel approach to understanding and navigating the challenges posed by carbon restrictions in the global power battery market:
RQ1. How can Chinese power battery manufacturers effectively adjust their export strategies to comply with the European Union’s carbon barrier policies?
RQ2. What are the key interactions among government bodies, manufacturers, and research institutions that influence these strategic adjustments?
This research focuses on the import and export dynamics and policies affecting Chinese power battery companies and aims to offer strategic insights grounded in rigorous academic analysis. Specifically, our contribution related to two main areas. First, we develop a dynamic evolutionary game framework to analyze strategic decision-making among key stakeholders, including the government, manufacturers, and research institutions. This framework provides a theoretical basis for understanding how cooperation can be promoted to collectively address the challenges posed by carbon barriers. By modeling these strategic interactions, we offer insights that can inform the design of policies aimed at enhancing collaboration and improving compliance with international environmental standards. Second, this study integrates research institutions into the evolutionary game model, highlighting their role in advancing carbon footprint research and contributing to the development of more sustainable practices in the power battery industry. This integration emphasizes the importance of a multi-stakeholder approach, where research institutions provide scientific inputs that support informed policymaking and industry practices. Ultimately, our findings propose a collaborative policy mechanism that aligns government regulations, industrial practices, and research initiatives to effectively tackle carbon barriers. Additionally, the insights gained from this research have broader implications, offering a reference point for other countries facing similar environmental and trade challenges.
The remainder of this paper is structured in the following manner. Section 2 provides a literature review. Section 3 presents analysis of the interests of each participating subject. Section 4 presents the model’s construction and analytical solution. Section 5 uses MATLAB for simulation analysis. Section 6 provides a summary of the conversation and then suggests potential future study directions.
2. Literature Review
2.1. Response Strategies of Enterprises in Overseas Competition
Facing intense competition in international markets, companies worldwide have developed adaptive strategies based on their environments to ensure global competitiveness. First, a differentiated competitive approach is essential. Companies need to gain a deeper understanding of the needs and preferences of their target markets and customize their products, services, and marketing strategies to stand out from their peers. Japanese plywood manufacturers, confronted with alterations in raw material availability, have implemented a differentiation strategy, prioritizing certification and operating in areas with reduced competition [12]. Singapore’s shipbuilding companies are facing intense competition from foreign shipyards with lower operating expenses, and it is recommended that they implement lean manufacturing to save costs and enhance manufacturing quality standards [13]. Second, it is vital to build a strong international brand image. By investing in branding and marketing, companies may foster trust and recognition in global marketplaces, enhancing the value of their products and strengthening their competitive edge. The brand value generated for commercial clients can enhance competitiveness via marketing [14]. In addition, establishing a robust business culture helps to enhance international competitiveness. Silwal [15] surveyed and analyzed Nepalese firms and found that firm culture has a significant impact. Corporate innovation and uncertainty avoidance exert a significant direct influence on financial success, whereas market culture has an indirect effect on financial performance.
Recent research on international trade and economic development has increasingly highlighted the role of innovation, digital transformation, and policy measures in shaping global economic dynamics. Sánchez-Sellero and Bataineh [16] explore the interaction between innovation efforts and foreign direct investment (FDI) in Spanish firms, focusing on outcomes like patents, new products, and processes. Using data from the Spanish Panel for Technological Innovation and official foreign investment statistics, this study employs logistic regression models to show how R&D expenditures, external collaboration, and public funding enhance the absorption of FDI and facilitate innovation. This investigation provides a foundation for understanding how investment and innovation policies interact to yield economic benefits. Luo and Qu [17] examine China’s export trade and its impact on high-quality economic development. Using a comprehensive economic indicator system and dynamic panel threshold models, the research reveals that export trade promotes economic advancement through improved coordination and openness, particularly when regional absorptive capacities are above a certain threshold. These studies underscore the significance of strategic trade and innovation policies in fostering economic growth, laying the groundwork for further exploration into how external economic factors influence innovation and economic outcomes.
Beyond traditional trade and innovation frameworks, emerging research emphasizes the growing relevance of carbon barriers and digital transformation in the energy and trade sectors. Li and Tan [18] explore how digital transformation influences the Greater Bay Area’s position within the global value chain. Through the application of a three-tier nested input–output model and empirical analysis, their research demonstrates that digital transformation significantly enhances both technological innovation and export value, thereby improving the region’s competitiveness in global markets. Importantly, the study highlights the fact that cities such as Hong Kong and Macao gain more substantial benefits from digital advancements than cities in the Pearl River Delta, emphasizing the necessity of developing customized digital strategies to optimize regional gains. It examines the effects of China’s “dual circulation” economic strategy on cross-border e-commerce, focusing particularly on B2B export trade. Utilizing a system dynamics model, their study evaluates the impact of various policies, including infrastructure investment, tax regulations, and the regulatory environment, on trade growth. The findings offer valuable insights for government policy and strategic planning, identifying critical factors that facilitate the development of cross-border trade and highlighting the importance of coordinating policy measures to promote sustainable economic growth [19].
Furthermore, continuous innovation and adaptation are key to the attainment of a solid market position. Innovation refers to the planned and intentional investment behaviors of organizations, characterized by risk and uncertainty, as outlined by Ye et al. [20]. In reaction to evolving market conditions, firms must demonstrate flexibility in adjusting their strategy, actively pursue new growth prospects, and retain agility in order to rapidly adapt to changes. Establishing Chinese national brands in foreign markets and fostering green technical advancements can augment China’s worldwide competitiveness [21]. Soriano, Villano, Fleming, and Battese [22] found that small food firms in Australia face fierce market competition and that their innovations in overseas operations continue to increase. Zhou and Tang [23] described the adaptation of the current model of green supply chain management to the present worldwide landscape.
To address carbon barriers specifically, recent studies have analyzed how environmental regulations influence trade and investment, particularly in the energy sector. Evolutionary game theory has emerged as a valuable tool for modeling strategic interactions among stakeholders, such as governments, energy producers, and manufacturers. This approach has been used to explore how policies promoting carbon neutrality impact market dynamics and innovation. In this context, several studies (Perera [24], Wang et al. [25] and Sun et al. [26]) have demonstrated the effectiveness of evolutionary game theory in assessing cooperative and competitive behaviors in carbon markets, highlighting mechanisms that encourage stakeholders to adopt sustainable practices.
2.2. Difficulties Faced by Power Battery Enterprises
As the market for electric vehicles continues to expand at a staggering rate, power battery companies are facing many difficulties. First, technological competition is fierce, and there are technical barriers. Power battery charge and discharge platforms can collapse at extremely low ambient temperatures [27,28], resulting in less energy and battery power being accessible. Li et al. [29] pointed out that sodium, which is used as a medium, assumes an important role in power batteries. However, the problem of the high-rate storage of sodium ions in lithium titanate has still not been solved. At the same time, consumers’ low-carbon preferences increasingly influence business decisions [30]. Due to the simultaneous influence of carbon-related legislation and customers’ limited understanding of carbon issues, power battery makers have invested in carbon reduction technology, resulting in increased costs [31,32]. In addition, supply chain management is also a challenge. The large-scale recycling of used power batteries is still a very difficult problem. A variety of metal materials are used in power batteries for new energy vehicles [33]. Reuse will have an immediate influence on the supply situation of these metals, as well as the price trends of power batteries [34]. Companies must have a strong and dependable supply chain structure to guarantee the uninterrupted provision of raw materials and outputs. Zhao et al. [35] examined the price and carbon reduction strategies of manufacturers and retailers within two supply chains in a competitive context. The research indicated that vertical collaboration between producers and retailers can reduce selling prices and enhance the rate at which carbon emissions are reduced. Nonetheless, horizontal collaboration between two producers may adversely affect retailers’ revenues and consumer welfare. Implementing a closed-loop supply chain management strategy throughout the battery production phase of electric cars can diminish raw material usage and thereby mitigate environmental externalities, as outlined by Li et al. (2020). Moreover, the policy environment also affects enterprises. Different countries and regions have different policies and regulations, and enterprises need to adapt to and comply with relevant regulations [36]. Furthermore, market risks and uncertainties are challenges. The development of the electric vehicle market is influenced by a number of factors. The cap-and-trade policy significantly influences the profitability of contemporary enterprises [37]. Therefore, for businesses to survive in the intensely competitive market, the challenges encountered by local and overseas power battery firms demand constant innovation and the adaptive development of changing goals [38].
2.3. Power Battery-Related Research
There are many different research directions being pursued in relation to power batteries. On the one hand, there is a need to strengthen technological research and development and innovation capabilities and continuously improve product quality and performance to meet the needs of the international market. Guo et al. [39] proposed a joint estimation algorithm with higher accuracy and initial value errors in the convergence of state of charge estimation for power batteries. Jaafar et al. [40] used system modeling to estimate the performance of power battery systems. Uddin et al. [41] developed a comprehensive battery degradation model designed to minimize battery degradation. Patil et al. [42] computed the heating curves for various driving cycles and presented a control approach designed to keep the temperature of the battery within a specific range in order to minimize the amount of power being generated by parasitic effects. On the other hand, there is a need to manage power batteries. The key to the power battery industry’s continued growth and sustainability lies in the development of technology that is efficient in terms of recycling materials [34]. The environmental viability of repurposing electric car batteries for stationary purposes beyond their life cycle has been examined [43]. Zeng et al. [44] examined the safety concerns linked to the recycling and disposal of spent lithium batteries and suggested an extensive management approach that includes pertinent laws, regulations, and recycling technology. Turner and Nugent [45] studied the influence of ERP systems on power battery recycling efficiency and management costs and concluded that the effective implementation of ERP systems can help to promote the sustainable reuse of power batteries. Cheng et al. [46] employ the Stackelberg game method to comparatively assess the influence of various governmental processes on the advantages of each participant prior to and during their involvement in power battery traceability management. Enhancing collaboration with external entities and actively engaging in the formulation of international standards and industry regulations helps bolster the reputation and competitiveness of firms. Kamyabi et al. [47] developed the optimization of closed-loop supply chains for lead–acid power batteries by the integration of mathematical planning and system dynamics. In summary, it seems that there is a lack of multiparty subject-related strategy analyses for power batteries under carbon barriers.
Table 1 summarizes the differences between our study and the existing literature reviewed previously. Specifically, while most previous studies on power batteries or corporate coping strategies for overseas competition have not considered the issue of power battery export trade in the context of carbon barriers, our study develops an evolutionary game model, providing a unique perspective on operations and export strategies. It further enhances the literature on power batteries by offering insights on establishing coordination within the framework of environmental sustainability.

Table 1.
Comparison between our study and related literature.
3. Analysis of the Interests of the Participating Subjects
3.1. Analysis of Government Interests
Taking into consideration the development of the power battery business in the face of carbon barriers, the government assumes the role of offering guidance and supervision to various actors with interests in the industry’s development process. First, the government aims to promote economic growth and increase employment opportunities by developing the power battery industry. More investment and technological innovation are needed to increase the production capacity and quality level of domestic power batteries. Second, the government has high expectations that power battery firms will be able to undertake carbon footprint certification. This is because the government is concerned about the conservation of the environment and the promotion of sustainable growth. To promote industry, the authorities need to assure the accuracy and transparency of their carbon footprint statistics. Third, the government also ensures the continued growth of the power battery business while ensuring the safety of any products that are manufactured by formulating supportive policies and regulatory measures. The government benefits not only from governing, but also from social respect.
3.2. Analysis of Power Battery Manufacturers
As producers of power batteries, power battery manufacturers are the main target of government regulation. The market for electric vehicles has grown quickly, increasing the demand for power batteries. While this growth has led to significant profit margins and economic opportunities, it has also brought forth various challenges, including the recently implemented carbon barrier rules of the European Union. Thus, improving the carbon footprint of power batteries is the primary duty of the government in exercising control over producer enterprises and will become the social responsibility of producer firms. Power battery manufacturers are typical profit-oriented entities. Manufacturers are typically profit-oriented enterprises that often prioritize financial gains over technological advancement and carbon emission management. They also frequently fail to assess the carbon footprints of each step in the supply chain, resulting in lost resources and many obstacles. To that end, the government has enacted rules to interfere with the conduct of power battery producers, rewarding firms that make good changes and penalizing enterprises that behave poorly. Companies consistently aim to comply with essential government regulations and address global environmental pressures at minimal costs to maximize their profits.
3.3. Analysis of Research Institutions
As independent third-party organizations, research institutions’ participation in refining the carbon footprint of power batteries can improve the efficiency of government regulations. Research reputation and influence are also concerns of research organizations. In keeping with the spirit of science, research organizations hope to build a good reputation for delivering high-quality research results, thereby attracting more partners and resources. As a result, research institutes prioritize transparency in the research process and thoroughly illustrate the scientific character of their research techniques and data. Moreover, with the EU’s increasingly stringent criteria for green and low-carbon transformation in the electric vehicle battery industry, the government is expected to intensify regulatory efforts, prompting research institutes to align with relevant policy directions. Research institutes will also pay attention to the relevant policy directions and choose research directions that meet the needs of the society, so as to enhance the social impact of the research results. Nevertheless, the human resource costs associated with research institutions’ participation in collaborations lead to limited engagement, subsequently impeding the progress in terms of reducing the carbon footprint.
Based on the analysis above, the interests of different subjects are clarified, and the interrelationships among the various subjects of interest are determined. This can lay the foundation that enables subjects to improve their carbon footprints. Figure 1 illustrates the link among the tripartite topics under consideration.
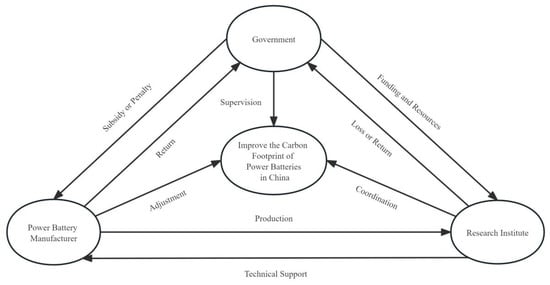
Figure 1.
A diagram showing participation in the tripartite relationship.
4. Evolutionary Game Model Construction and Solution
4.1. Model Assumption
Based on the purpose of the study, this paper identifies the main bodies involved in improving the carbon footprint of power batteries as the government, power battery manufacturers, and research institutions. Among them, the government serves as both the organizer and leader. It can direct and encourage other major entities to carry out activities relating to the carbon footprint by developing policies and implementing other actions. The primary implementation body is power battery manufacturers. They are primarily in charge of developing and executing a management system for the whole supply chain, as well as monitoring and recognizing the carbon footprint of each link. Research organizations provide technical and talent support, which is an important source of carbon accounting and the construction of other methodologies. An evolutionary game model is created to conduct a comprehensive study of the evolutionary trajectory and the influencing mechanisms among the three parties.
Evolutionary game theory is a theory used to analyze stakeholder strategy interactions and their evolution by constructing mathematical models to simulate the dynamic process of strategy selection under different scenarios, revealing long-term equilibrium and stability in market and policy environments. This approach can effectively identify key factors, help to optimize decision-making, and improve the overall adaptability and sustainability of the system.
In this section, the participant strategy space and the elements that influence it are assumed, and the parameter expressions are built up in order to conduct an analysis of the dynamic development process and the stability of the parties’ selection strategy [51]. The research framework offers a new approach and direction for the development of carbon footprint analysis by grounding it in a primary perspective, considering current circumstances, and addressing research demands. In Table 2, the model parameters and the interpretations of those parameters are shown [52].
Table 2.
Model parameters and description.
Assumption 1:
All game participants are boundedly rational, including the government, power battery manufacturers, and research institutions.
Assumption 2:
Two strategic choices are available to the government: strictly supervise or do not strictly supervise. The government’s basic income is R0, strict supervision costs are C1, and no strict supervision costs are C2. Power battery makers who actively adjust will receive transfer payments (subsidies), B1. Government incentives in the case of synergies between research institutions are indicated by B2. When the research institution reduces the carbon footprint of the collaborative power battery, the government actively regulates its revenue, denoted as R2, whereas the loss incurred without strict supervision is represented as S1.
Assumption 3:
The power cell producer strategy choices are positive and negative adjustments. The basic gain of the producer is R3. The incremental cost incurred when power battery manufacturers actively adjust their strategies is denoted as P. This adjustment leads to revenue generation, represented as R6, and government revenue, denoted as R1. In the negative adjustment, the government imposes punitive fines (F) on power battery manufacturers, with a portion (a) allocated as revenue for the government. The additional revenue for power battery manufacturers under collaborative research institutions or strict government regulation is given by N.
Assumption 4:
The strategic choices of research institutions are coordinated and uncoordinated. The basic income of research institutions is R7. The cost of collaborative research institutions is C3, which can earn R5 of revenue. Power battery manufacturers actively adjust the revenue of R4. The loss incurred when research institutions do not cooperate with power battery manufacturers is represented by S2. Additionally, S3 denotes the losses resulting from either a lack of coordination among research institutions or negative adjustments made by power battery manufacturers.
Assumption 5:
The likelihood that the government opts for stringent regulation is x (0 < x < 1), whereas the likelihood of lenient regulation is 1 − x; the likelihood that the power battery manufacturer chooses to make positive adjustments is y (0 < y < 1), and the probability of negative adjustments is 1 − y; the likelihood of a research institution choosing coordinated is z (0 < z < 1), and the likelihood of choosing uncoordinated is 1 − z.
4.2. Model Analysis
Utilizing the proposed assumptions and the data shown in the fundamental symbol table, we may formulate the revenue matrix for the three topics under diverse settings, encompassing stringent and lenient monitoring, favorable and unfavorable modifications, and coordinated and uncoordinated tactics. Table 3 displays this matrix.
Table 3.
Tripartite benefits matrix for participating subjects.
4.3. Model Building and Solving
The evolutionary game matrix is utilized to compute the expected and average returns for the government, power battery producers, and research institutes. This is followed by the formulation of replication dynamic equations for each entity.
4.3.1. Government Side
E11 and E12 denote the return function for either strict government regulation or a more lenient regulatory approach. denotes the average payoff, which can be obtained.
The anticipated return function under the government’s strong oversight plan is shown in Formula (1):
E11 = y*z*(R0 − C1 + R1 − B1 − B2 + R2 − S1) + y*(1 − z)
*(R0 − C1 + R1 − B1) + (1 − y)*z*(R0 − C1 + aF − B2) + (1 − y)*(1 − z)*(R0 − C1 + aF),
*(R0 − C1 + R1 − B1) + (1 − y)*z*(R0 − C1 + aF − B2) + (1 − y)*(1 − z)*(R0 − C1 + aF),
The anticipated return function of the government when adopting the “not strict supervision” policy is presented in Equation (2):
E12 = y*z*(R0 − C2 + R1 − B1 − B2 + R2 − S1) + y*(1 − z)*
(R0 − C2 + R1 − B1)+(1 − y)*z*(R0 − C2 − B2)+(1 − y)*(1 − z)*(R0 − C2),
(R0 − C2 + R1 − B1)+(1 − y)*z*(R0 − C2 − B2)+(1 − y)*(1 − z)*(R0 − C2),
Equation (3) shows the government’s anticipated average return function:
According to evolutionary game theory [53], the government F(x) replicates the dynamic equations for “strict supervision” behavior. This is shown in Equations (4) and (5):
The solution obtained by making F(x) = dx/dt = 0 may be the equilibrium point of the evolutionary process:
- (1)
- When y = y* = (C2 − C1 + F*a)/(F*a), F(x) = 0 indicates that all points on the x-axis are in a steady state, i.e., the government’s strategic decision remains constant at this point.
- (2)
- When y≠ (C2 − C1 + F*a)/(F*a), we obtain x = 0 and x = 1 as the two possible equilibrium state points of F(x). The replicated dynamic equations’ stability theorem defines an evolutionary game stable strategy point (ESS) as (dF(x))/dx < 0.
When F(x) is used to find the derivative, Equation (6) is utilized:
a. When 0 < y < (C2 − C1 + F*a)/(F*a), (dF(x))/dx is less than 0 at x = 0 and greater than 0 at x=1. At this point, x=0 is the equilibrium point in the evolution of government behavior, i.e., the government will tend to choose the strategy of “no strict supervision”.
b. When ( C2 − C1 + F*a)/(F*a) < y < 1, (dF(x))/dx is greater than 0 when x = 0 and less than 0 when x=1. At this time, x = 1 is the equilibrium point of the evolution of government behavior, i.e., the government will tend to choose the “strict supervision” strategy.
Based on the above analysis and expressing the above conclusion in a three-dimensional coordinate system, the dynamic tendency of governmental behaviors may be observed, as illustrated in Figure 2 below:

Figure 2.
Trends in the dynamic evolution of government.
4.3.2. Power Battery Manufacturers Side
Using E21 and E22 to represent the manufacturer’s expected returns of positive or negative adjustments and to represent the average return, we can obtain the following:
The expected return function of the power battery manufacturer choosing the “positive adjustment” strategy is shown in Formula (7):
The expected return function of the power battery manufacturer choosing the “negative adjustment” strategy is shown in Formula (8):
The method of calculating the average expected return function of power battery producers is shown in Equation (9):
The replica dynamic equation of the power battery manufacturer can be obtained using Equations (10) and (11):
Let F(y) = dy/dt= 0. The solution that is achieved may represent the point at which the evolution process reaches equilibrium:
(1) When z = z*= (B1 − P + R6 + S2 + F*x)/(S2-R4), F(y) = 0 means that the points on the y-axis are in a stable condition; specifically, the manufacturer’s strategic decisions remain constant throughout time.
(2) When z≠ (B1 − P + R6 + S2 + F*x)/(S2 − R4), the two potential equilibrium state points of F(y) are y=0 and y = 1. In accordance with the stability theorem of replicating dynamic equations, the point at which (dF(y))/dy is equal to zero is understood to be the stable strategy point (ESS) of the evolutionary game.
In order to use F(y) to find the derivative, Equation (12) can be utilized:
a. When 0 < z < (B1 − P + R6 + S2 + F*x)/(S2 − R4)(dF(y))/dy is less than 0 when y = 0, and greater than 0 when y=1. At this time, y=0 is the equilibrium point of the producer’s behavior evolution; specifically, the producer will tend to choose the strategy of “negative adjustment”.
b. When (B1 − P + R6 + S2 + F*x)/(S2 − R4) < z < 1, (dF(y))/dy is greater than 0 at y = 0 and less than 0 at y = 1. Y = 1 represents the equilibrium point in the progression of producer behaviors, indicating that producers are inclined to adopt a “positive adjustment” strategy.
On the basis of the analysis shown here and the expression of the conclusion presented above in a three-dimensional coordinate system, it is possible to derive the dynamic evolution trend in the behaviors of the manufacturer, as shown in Figure 3 below:

Figure 3.
Dynamic evolution trends of power battery manufacturers.
4.3.3. Research Institutions Side
Denoting the coordination and uncoordinated payoff functions of E31 and E32, with denoting the average payoff.
It is demonstrated in Equation (13) that the expected return function of a research organization choosing the “coordination” method is as follows:
The expected payoff function of the demand side of the research organization when choosing the “uncoordinated” strategy is shown in Equation (14):
The following Equation (15) may be used to obtain the average anticipated return function of the research organizations:
It is possible to obtain the replication dynamic equation of the entity that is undertaking the investigation, as shown in Equations (16) and (17):
The solution obtained by making F(z) = dz/dt = 0 may be the equilibrium point of the evolutionary process:
(1) When x = x* = (B2 − C4 + R5 + S3*y)/R8, F(z) = 0 denotes that every point on the z-axis is in a stable state, meaning that the research organization’s strategic options do not evolve with time.
(2) When x≠ (B2 − C4 + R5 + S3*y)/R8, we obtain z = 0 and z = 1 as the two possible equilibrium points for F(z). The stability theorem of reproducing dynamic equations states that the stable strategy point (ESS) of an evolutionary game occurs when (dF(z))/dz ≤ 0.
When finding the derivative of F(z), Formula (18) can be utilized:
a. When 0 < x < (B2 − C4 + R5 + S3*y)/R8, (dF(z))/dz is less than 0 when z = 0, and greater than 0 when z = 1. The equilibrium points of research institutions’ behavioral evolution is at z = 0, meaning that these institutions will typically select the “uncoordinated” approach.
b. When (B2 − C4 + R5 + S3*y)/R8 < z < 1, (dF(z))/dz is greater than 0 when z = 0, and less than 0 when z = 1. At this time, z = 1 is the equilibrium point of the behavior evolution of research institutions; that is, research institutions will tend to choose the “coordination” strategy.
The dynamic evolution trend of the manufacturer’s behaviors can be determined by applying the aforementioned analysis and conveying the aforementioned conclusion in a three-dimensional coordinate system, as illustrated in Figure 4:

Figure 4.
Dynamic evolution trends of research institutions.
4.4. Analysis of Equilibrium Strategies in Evolutionary Game Models
From the above study, a three-dimensional dynamic system of the evolutionary game can be derived. This is shown in Formula (19):
From Fx(x,y,z) = 0, Fy(x,y,z) = 0, and Fz(x,y,z) = 0, it can be seen that there are 8 pure strategy equilibria in the evolutionary system: E1(0,0,0), E2(1,0,0), E3(0,1,0), E4(0,0,1), E5(1,1,0), E6(0,1,1), E7(1,0,1), and E8(1,1,1).
According to the method of Friedman [54,55], the Jacobian matrix of a differential system can be obtained by analyzing the stability of the equilibrium point using the eigenvalues of the system. This is seen in Formula (20):
The results calculated separately using the partial derivative formula are as follows, as shown in Formulas (21)–(29):
4.5. Sensitivity Analysis
Sensitivity analysis is a method used to systematically assess the impact of uncertainty factors on outcomes. It works by varying specific parameters to observe the effect of changes on the final output or decision results. When performing strategic stability analysis, sensitivity analysis can help decision-makers identify which parameters are critical to the stability of strategic decisions, allowing for more targeted adjustments and optimizations when formulating policies or strategies. Additionally, setting specific parameters is crucial. Firstly, it enhances decision accuracy. By identifying the parameters that have the greatest impact on strategic stability, decision-makers can adjust these parameters more precisely to achieve the desired strategic outcomes, reducing unnecessary resource waste. Secondly, it helps to understand the asymmetry of influence. Certain parameters may have a much greater impact on strategic stability than others. Understanding this asymmetry can help decision-makers to focus resources and attention on the most critical factors, avoiding strategic errors due to neglecting key variables. Thirdly, it aids in managing uncertainty and risk. Strategic decisions often come with uncertainties, and some parameter changes may lead to significant fluctuations in strategic stability due to their uncertain nature. Sensitivity analysis allows for improved evaluation of the potential impacts of these uncertainty factors on strategic stability under different scenarios, thereby developing more robust risk management measures. Fourth, it is necessary to enhance adaptability and flexibility. In the ever-changing international environment, model parameters will change as the business operating environment changes. Continuous sensitivity analysis helps decision-makers to adjust strategies in a timely manner, enhancing adaptability to external changes and the flexibility of strategies.
To comprehensively investigate the evolution of strategies among the government, power battery manufacturers, and research institutions during distinct developmental phases, such as the early expansion phase, characterized by rapid and uncoordinated growth, and the mature stage, marked by stabilized policies and well-established industry practices, this article employs MATLAB software to simulate equilibrium strategies. Considering that E1 is in and out of the beginning of the savage growth period and E7 is the ideal period of maturity, this section focuses on analyzing the early development stage (E2) and the later development stage (E8) to illustrate the strategic shifts and stability achieved by the government, power battery manufacturers, and research institutions. The early development stage (E2) is selected to capture the initial period of strategic adjustments and uncoordinated growth, where stakeholders are beginning to navigate emerging challenges and opportunities. In contrast, the later development stage (E8) represents a more mature phase where strategies have evolved, and a higher level of stability has been reached. By examining these two contrasting phases, we can better understand the progression and outcomes of strategic decision-making over time. Through simulation methods, we aim to gain deeper insights into how various factors influence the strategic choices of these entities. It is further analyzed to assess sensitivity.
The stability of the eight pure strategy equilibrium points that exist in the evolutionary system is analyzed using the eigenvalue analysis method of the Jacobian matrix. An equilibrium point is classified as a system evolutionary stable strategy (ESS) if all of its eigenvalues are less than 0, and as an unstable point if at least one of its eigenvalues is greater than 0. Table 4 displays the stability analyses of the eight pure strategy equilibrium points.
Table 4.
Stability analysis of pure strategy equilibria.
The aforementioned stability conditions for the eight equilibria indicate that the disparity between benefits and costs influences the selection of the three subjects. According to the circular economy life cycle theory, the evolution of the optimal carbon footprint process is categorized into four phases: the beginning stage, the predevelopment stage, the late development stage, and the maturity stage. We present an analysis of the stability of the equilibrium point at each phase.
During the initial stage of carbon footprint improvement, most power battery manufacturers choose passive strategies due to high costs out of profit considerations. Because of considerations such as flawed rules, economic advantages, and regulatory costs, the government prefers not to impose stringent monitoring. Research institutions adopt uncoordinated strategies due to conflicting goals and interests. This stage reflects the difficulty in achieving cooperation among the subjects due to information asymmetry and insufficient incentives. However, with the strengthening of regulation and technological advances, the strategic choices of the participating parties will evolve, which will promote the determination of measurable reductions in emissions per unit of exported product. As a result, this phase and equilibrium point E1 (0, 0, 0) match. As seen, three conditions need to be met for the point to be stable: ① C2 < C1 − F*a. The cost of “not strictly supervising” is less than the cost of “strictly supervising”, and the government tends to choose “not strictly supervising”. ② B2 + R5 < C3. When the revenue of the research organization cannot cover the input cost, the research organization will choose “not coordinated”. ③ B1 + R6 + S2 < P. When the cost of adjustment is greater than the benefits, the producer chooses “negative adjustment”, and the system evolution path is shown in Figure 5.
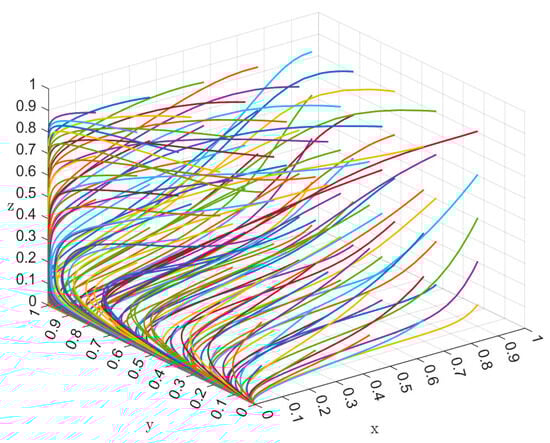
Figure 5.
Initial-stage system evolutionary path.
In an effort to maximize profits, power battery makers neglected to build a carbon reduction system in favor of increasing capacity in the early stages of development. As the EU’s policy requirements for imported batteries become more stringent, the entry costs for companies are gradually increasing. The government will actively strengthen supervision. However, considering funding constraints and ambiguous domestic carbon accounting regulations, research institutes have chosen to remain passive and wait for government intervention rather than conduct carbon accounting research. This stage reflects the lag in the development of the carbon footprint caused by the short-term profit orientation of enterprises, the strengthening of government supervision and the lack of incentives from research institutions. This requires further improvement in the regulatory system, the expansion of financial support, and the establishment of technical standards to promote the power battery industry to realize further development. This means that the equilibrium points E2 (1, 0, 0) corresponds to this stage. Three things need to happen in order for this point to stabilize: ① C1 − F*a < C2. When the expense of stringent governmental oversight is lower than that of lenient regulation, the government typically opts for “strict supervision”. ② B1 + F + R6 + S2 < P. When the incremental cost of the manufacturer’s active adjustment is greater than the corresponding benefit, the manufacturer will tend to choose the “negative adjust” strategy. ③ B2 + R5 < C3 + R8. When the research institutions collaborate and the benefits are less than the cost of collaboration, the research institution chooses the “uncoordinated” strategy. The system evolution route is displayed in Figure 6 below.
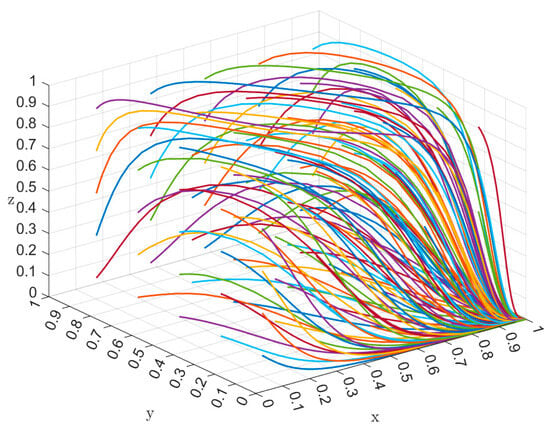
Figure 6.
The system evolution path in the early development stage.
In the later stage of development, the government should develop a set of incentives and punishment rules to encourage research on China’s battery carbon footprint standards and methodology as soon as feasible. This would encourage research institutes to actively participate in enhancing carbon footprint studies and will support the implementation of a mutually recognized framework for aligning battery carbon footprints with EU standards. Therefore, this stage is a better stage regarding measurable reductions in emissions per unit of an exported product, corresponding to the equilibrium point E8 (1, 1, 1). For this equilibrium point to reach a stable state, three conditions need to be met: ① C1 < C2. Since “strict supervision” is less expensive than “not strict supervision,” the government typically opts for “strict supervision.” ② P − F < B1 + R4 + R6. The manufacturer’s incremental costs are less than the corresponding benefits, and the manufacturer will tend to choose the “positive adjustment” strategy. ③ C3 + R8 < B2 + R5 + S3. When the research institution’s benefits from different aspects are greater than the costs, the research institution chooses “coordinated” methods, and the system evolution path is shown in Figure 7 below.
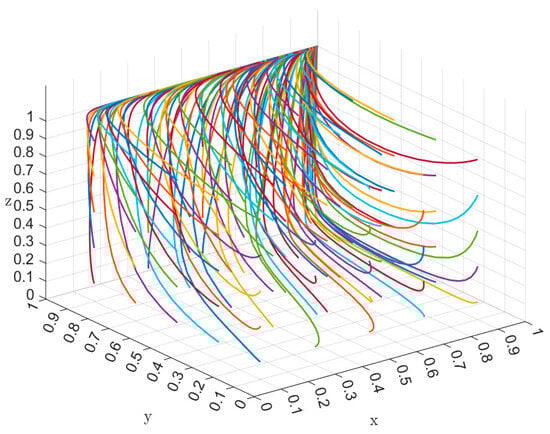
Figure 7.
The evolutionary path of the system in the later stages of development.
Under early guidance and supervision, the government promoted the maturity and growth of the entire industrial chain. As the power battery industry continues to improve and the market becomes increasingly mature, the role of the government should gradually change. In the mature stage of the industry, the government should gradually withdraw from direct management. For the market to be a major player in resource allocation, more autonomy must be granted to it at this point. Meanwhile, the carbon accounting system will also be perfected and matured. The government will shift to the role of “night watchman” and will only make the necessary adjustments to address market failures. Enterprises will proactively respond to carbon barriers to meet market demand. Research institutes will promote technological innovation with the support of enterprises and governments. This stage belongs to the ideal state of carbon footprint perfection, reflecting a high degree of coordination among the government, enterprises, and research institutions on this issue, matching the point of equilibrium E7 (0, 1, 1). For the equilibrium point to reach a stable state, three conditions need to be met: ① C1 < C2. It can be seen that the cost of strict regulation is small. However, at this stage, regardless of the cost, the government will choose to exit when the industrial chain is mature. The independent operation and development of enterprises themselves should be encouraged, while capital and manpower can be freed up to support research and development, innovation, and the development of new technologies. This is the way to drive sustained economic growth. ② P − F < B1 + R4 + R6. When the incremental costs to the producer is less than the benefits it derives from multiple parties, the producer will tend to choose the “positive adjustment” strategy. ③ C3 + S3 < B2 + R5 − R8. When the cost of the research organization is less than the benefit, the research organization will tend to choose the “coordinated” strategy. The system evolution path is shown in Figure 8.
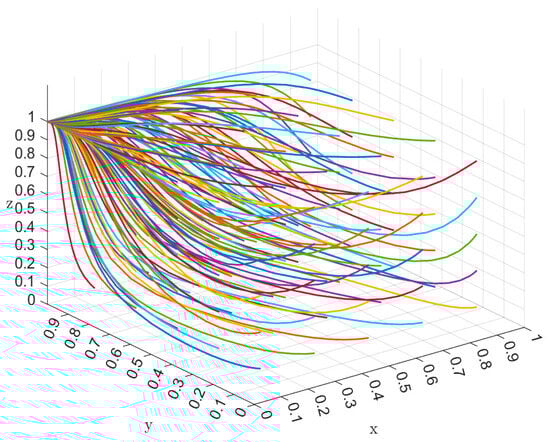
Figure 8.
Mature stage system evolution path.
5. Simulation
5.1. Case Selection
N company is a leading Chinese power battery manufacturer, supplying batteries to major international automakers such as BMW, Volkswagen, and Daimler. Recently, the EU introduced stricter carbon emissions regulations, addressing the carbon footprint of batteries in particular. The new EU carbon barrier policy requires detailed carbon emission reports for all imported batteries, covering the entire supply chain, from raw material extraction to production and transportation. N company invested heavily in research and development to increase the energy density and life cycle of its batteries, reducing the carbon emissions per unit of energy produced. The company also developed environmentally friendly recycling technologies to reuse battery materials, further cutting down the carbon footprint. The green transformation not only ensured its long-term success in the European market but also set a benchmark for China’s power battery industry. Through technological innovation and supply chain optimization, N company successfully reduced production costs and improved its market competitiveness, achieving both environmental and economic benefits.
5.2. E2 (1, 0, 0) Evolution Path Analysis
To verify the system’s stability, i.e., point E2 (1, 0, 0), according to the constraints of the variables and the basic facts of the initial stage of third-party market cooperation, the government leads, and the producers and research institutes do not collaborate, i.e., C1 − C2 − F*a < 0, B2 − C3 + R5 − R8 < 0, B1 + F − P + R6 + S2 < 0. Satisfying the conditions of R0 = 100, C1 = 10, C2 = 15, R1 = 10, R2 = 5, R3 = 500, P = 50, B1 = 10, B2=5, R5 = 10, S1 = 20, S2 = 10, S3 = 50, R6 = 15, F = 8, a = 0.625, N = 5, C3 = 30, R4 = 10, R7 = 50, R8 = 20, this section mixes scenarios and elements to investigate how external influences affect the system’s evolutionary results. To further analyze the changes in the main parameters during the early development stage, we performed a sensitivity analysis for F and B1 via numerical simulation.
- (1)
- The impact of changes in government punishment intensity F on game results
The values of F are adjusted to 8, 18, and 28, while the other parameters remain constant, as seen in Figure 9. As F equals 8, both y and z exhibit a continual decline. The diminished penalty lessens the motivation for power cell manufacturers and research institutions to choose for cooperation. As F grows, the frequency with which they opt not to participate in the plan diminishes. As F equals 28, y and z exhibit constant rises. When the penalty is substantial, both manufacturers and research organizations are inclined to choose the partnership option. Furthermore, x remains fundamentally stable at the same level throughout all three instances (strict supervision). In summary, insufficient punishment adversely affects the evolution of the tripartite participants towards the adoption of the optimal strategy. As the severity of punishment intensifies, the behavioral patterns of the three parties progressively intensify.
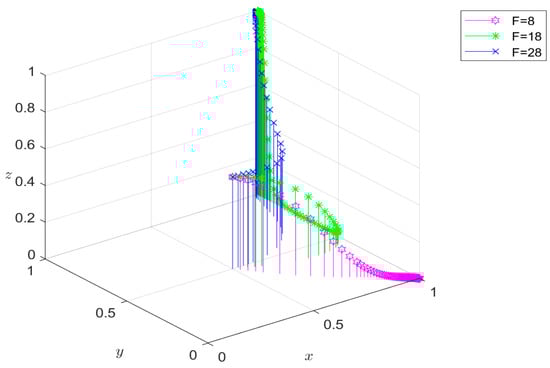
Figure 9.
The impact of government punishment on the evolution of tripartite behavior.
- (2)
- The impact of changes in government subsidies B1 on the game’s outcome
For the subsidies set by the government, the values of B1 are set to 10, 15, and 20, as shown in Figure 10. As evident from the figure, in all three scenarios, x eventually adopts a stabilizing strategy (strict supervision). This suggests that reasonably increased subsidies have little influence on the government’s inclination to regulate itself. When the subsidy is set to 10 and 15, both power cell producers and research institutions refrain from choosing a more stabilizing strategy. In this case, the subsidy is relatively small, and the cost of unilaterally and collaboratively measurable reductions in emissions per unit of exported product of the power battery is relatively large, so neither side is willing to take the risk of proceeding. When the subsidy amount is increased to 20, the stabilizing strategies of producers and research institutes evolve into coordinated strategies, indicating that larger subsidies can bring higher benefits and that producers and research institutes will actively participate. In summary, insufficient subsidies cannot facilitate the evolution of the three participants towards an ideal strategy, but a suitable rise in subsidies can progressively guide their behavioral strategies towards an optimal solution.
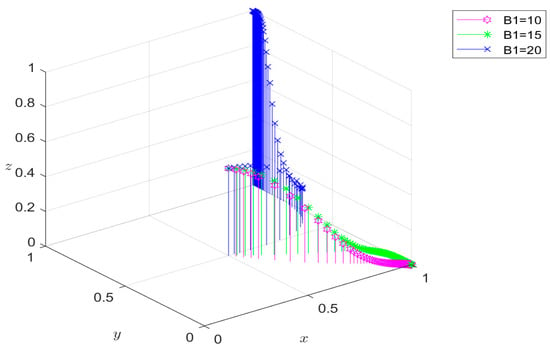
Figure 10.
The influence of government subsidies on the development of tripartite behaviors.
- (3)
- E8 (1, 1, 1) evolution path analysis
When C1 − C2 < 0, P − F − B1 − R4 − R6 < 0, C3 − B2 − R5 + R8 − S3 < 0, the system is stabilized at E8 (1, 1, 1). Similarly, according to the parameter constraints and the basic facts of the third-party market strategy and cooperation stage, the adjustment parameter is initially assigned as follows: R0 = 100, C1 = 10, C2 = 15, R1 = 10, R2 = 5, R3 = 500, P = 50, B1 = 10, B2=5, R5 = 10, S1 = 20, S2 = 40, S3 = 50, R6 = 15, F = 8, a = 0.625, N = 5, C3 = 30, R4 = 20, R7 = 50, and R8 = 20.
5.3. Impact of R4 on the Results
While keeping all other parameters constant and altering only the collaboration of research institutions, we vary the benefits (R4) obtained through the active adjustments made by power battery manufacturers, setting them at 20, 35, and 50. We obtain a simulation diagram illustrating the outcomes of the tripartite strategy depicted in Figure 11, Figure 12 and Figure 13. The picture illustrates that collaboration among research institutes enables power battery manufacturers to derive greater benefits, hence accelerating the development of a stabilization approach. It shows that with the increase in gain, R4, the willingness of producers to choose active synergy rises, and the speed of the three actors becoming cooperative becomes faster. This shows that power battery producers are willing to take the initiative to cooperate with research institutes when facing the carbon footprint problem and jointly seek solutions to promote improvement in the carbon footprint of power batteries in China. As synergistic cooperation becomes stronger, producers have established a stable strategy for consistently coordinated actions. This means that they recognize that carbon footprints are critical to the sustainability of the industry and that they are willing to work toward it. Through collaboration between research institutes and manufacturers, they can work together to develop and innovate technology and find more efficient ways to improve it. Simultaneously, synergistic cooperation can also facilitate the development and adoption of industry standards, contributing to the overall enhancement of industry sustainability.

Figure 11.
Plot of evolutionary trends for R4 = 20.
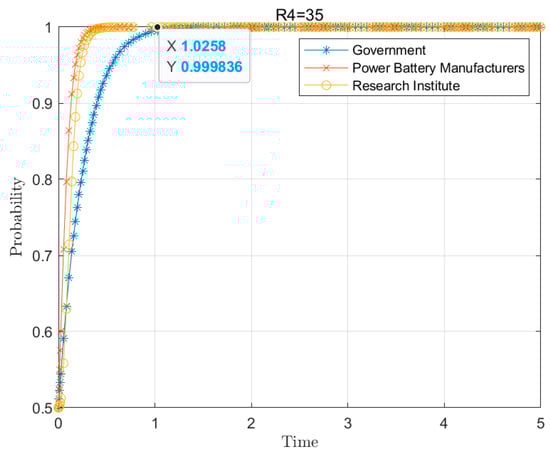
Figure 12.
Plot of evolutionary trends for R4 = 35.
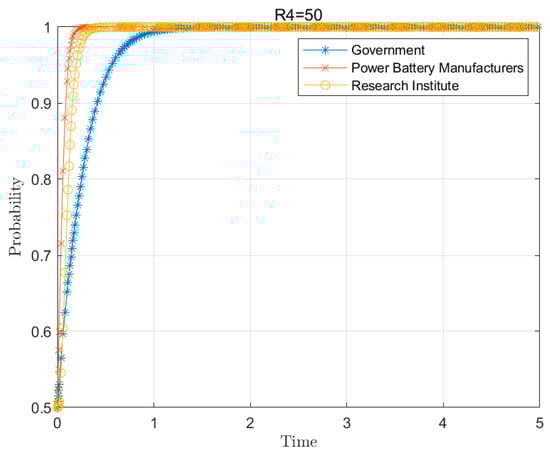
Figure 13.
Plot of evolutionary trends for R4 = 50.
5.4. Effect of S3 on the Results
Our analysis demonstrates that the degree of loss incurred by power battery producers when adopting a negative adjustment strategy, or by research institutions when opting for an uncoordinated approach, significantly influences cooperative behavior among stakeholders. Specifically, keeping other parameters constant, the loss values analyzed are 50, 45, and 40, as illustrated in Figure 14, Figure 15 and Figure 16. The results indicate that higher losses drive a stronger and more explicit intention to cooperate, as stakeholders recognize the substantial cost of non-cooperation and the benefits of taking collective action to mitigate these challenges. As the parameter value S3 decreases, we observe a notable decline in the participation rate of power battery manufacturers and research institutions. This trend suggests that when the perceived losses associated with non-cooperation are lower, stakeholders become less motivated to engage in collaborative efforts. They may either feel that the costs of non-participation are bearable or that they have identified more favorable opportunities elsewhere. This finding highlights the critical role of S3 in influencing stakeholders’ willingness to collaborate and their overall participation rates.
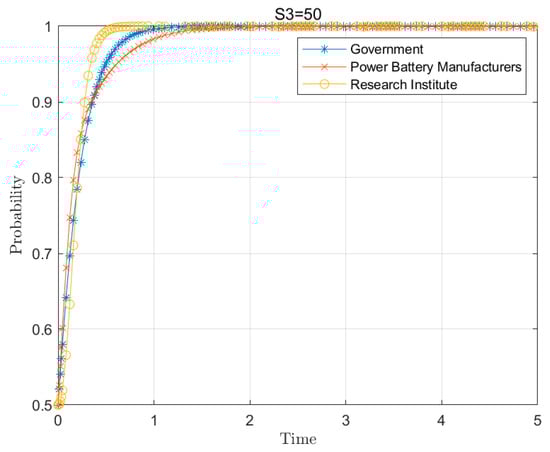
Figure 14.
Plot of evolutionary trends for S3 = 50.
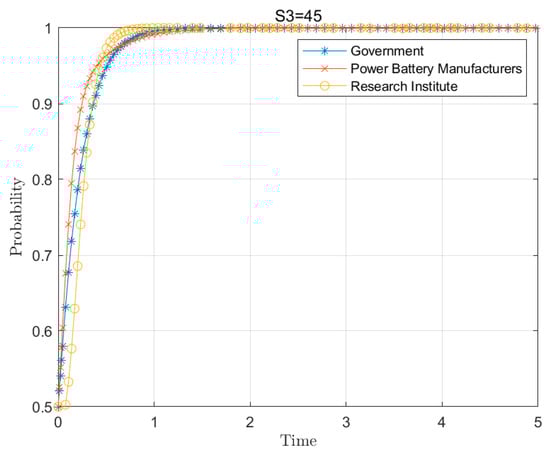
Figure 15.
Plot of evolutionary trends for S3 = 45.
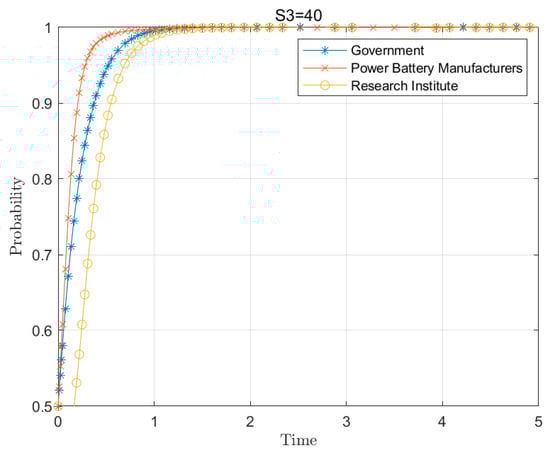
Figure 16.
Plot of evolutionary trends for S3 = 40.
The results underscore the importance of quantifying and understanding the impact of loss values on cooperative behavior. The analysis reveals that higher stakes incentivize cooperation, while lower perceived costs of non-cooperation can lead to strategic hesitation or the pursuit of alternative partnerships. These insights are crucial for designing effective policies and strategies that promote collaboration among key stakeholders in the power battery industry.
6. Discussion and Conclusions
6.1. Discussion
The carbon footprint of a power battery refers to the total quantity of greenhouse gasses and other environmental impacts emitted throughout the entire life cycle of the battery. Battery exporters need to collect and calculate carbon emission data from upstream minerals and materials in the production, recycling, and reuse of batteries, which involves a number of objects and subjects. This paper introduces three topics linked to power batteries to reduce China’s carbon footprint in accordance with new European Union standards. It acts as a roadmap and point of reference for the company’s power battery supply chain’s growth and improvement [55,56,57]. The evolutionary path analysis under the carbon barrier facilitated by the evolutionary game offers a diverse array of solutions for the industry’s sustainable green development [58,59,60].
In this paper, to improve the carbon footprint of power batteries in China, only three subjects are selected for evolutionary analysis, but they are all the main driving subjects. The evolutionary game analysis demonstrates the mutual influence among governments, producers, and research institutions. Government policy and financial support can motivate producers and research institutions to reduce the carbon footprint. The environmental protection measures of manufacturers can provide the government with a basis for better policy implementation and supervision. Research results and technical support from research institutions can help manufacturers achieve their goals. The mutual interaction and conflicts of interest between the parties can be better understood through evolutionary game analysis. This provides applicable policies with a scientific foundation on which to be developed and applied. Simultaneously, evolutionary game analysis can foster collaboration and coordination among all stakeholders, thereby facilitating a collective reduction in the carbon footprint of power batteries in China. This thorough research facilitates a comprehensive understanding of the developmental dynamics of China’s power battery business and serves as a crucial reference for future decision-making. Simulation can improve the prediction and understanding of the results of different strategy choices, thus providing powerful decision support for the governments, enterprises, and research organizations.
The findings from this study on China’s power battery export strategies under carbon barriers offer significant insights that extend to the specific context of power batteries and China’s relationship with the EU. Applying evolutionary game theory to analyze interactions among government bodies, manufacturers, and research institutions under regulatory pressure provides a versatile framework that can be adapted to various industries and international trade scenarios facing sustainability challenges. The findings show extreme universality and generalizability. For one thing, this study contributes to strategic adjustments to regulatory policies. One of the key takeaways from this study relates to how companies adjust their strategies in response to regulatory changes, particularly when faced with new environmental policies. This insight can be generalized to other sectors where firms face increasing pressure from governments to adopt sustainable practices. The evolutionary game framework can be adapted to explore how firms in different markets might respond to incentives and penalties related to a wide range of sustainability issues, such as water use regulations, plastic waste bans, or renewable energy mandates. For another, this study’s simulations show that the intensity of government incentives and penalties directly impacts firms’ decisions to adopt sustainable practices. This finding is generalizable to any context where policy levers are used to influence corporate behavior. Policymakers in other regions or industries can use this model to design more effective incentives to encourage firms to reduce their carbon footprints or other environmental impacts. The model also provides a framework for exploring the tipping points at which companies are more likely to shift from non-compliance to proactive engagement with regard to sustainability goals [61,62,63].
6.2. Conclusions
In this study, we track the evolution of strategies by the Chinese government, power battery manufacturers, and research institutions at different stages of development. Government policy actions, such as subsidies and developments in power battery technology, may have had a significant impact on the course of evolution. Meanwhile, this process also heavily depends on the competitive market strategy, research expenditures, and partner choices of power battery producers and research organizations. We simulated the effects of numerous strategy choices on the subjects using MATLAB software, analyzing the effect of these tactics in different settings and the eventual steady state they may create. Research shows that the severity of government penalties and the degree of subsidies have a great impact on the three stakeholders. Government subsidies and penalties can regulate corporate behavior and enhance the ratio of “coordinated” actions to attain a better evolutionarily stable state, E8 (1,1,1). Appropriate rewards and penalties can promote the standardization of corporate behavior. This can boost the motivation of power battery producers and research institutes to enhance the “coordinated” approach to the power battery carbon footprint in China and raise the proportion of partner companies, resulting in a more stable state. However, excessively small rewards and penalties do not encourage stakeholders to develop the best methods. Moreover, the loss degree from the “uncoordinated” approaches of the participants and the benefits obtained after cooperation affect the participation rate of the three participants and the speed at which consensus is reached.
Therefore, the following conclusions can be reached:
- (1)
- Government policies, particularly penalties for non-compliance and subsidies for sustainable practices, play a pivotal role in influencing manufacturers’ strategic responses to carbon regulations. Governments need to maintain consistent and long-term regulatory policies, and China should strengthen its enforcement mechanisms to encourage faster adoption of green technologies by manufacturers.
- (2)
- Collaboration between manufacturers and research institutions accelerates technological innovation and enables firms to meet carbon reduction targets more efficiently. Power battery manufacturers should invest in long-term partnerships with research institutions to develop carbon accounting methods and adopt advanced low-carbon technologies. Research grants and public–private partnerships should be promoted to support these collaborations.
- (3)
- Inconsistent policy enforcement leads to delays in the adoption of sustainable practices by manufacturers. Chinese regulators should ensure consistency and transparency in the enforcement of carbon reduction policies, providing clearer guidelines and more robust support for manufacturers transitioning to greener practices.
In today’s global market, as environmental issues become increasingly prominent, governments around the world are strengthening regulations and policies for environmental protection. The European Union’s carbon barrier has emerged in this context, requiring imported goods to meet certain carbon emission standards. This places higher demands on global manufacturers, particularly on the battery manufacturing giants, led by China. This study constructs and analyzes an evolutionary game theory model involving government entities, manufacturers, and research institutions to explore how Chinese power battery manufacturers adjust their export strategies in response to this policy challenge, and examine the roles played by relevant governments and research institutions.
From a practical perspective, the findings of this study reveal how Chinese manufacturers can maintain market share and profit margins in the European market while adhering to international environmental protection standards. Manufacturers not only need to invest in more efficient and low-carbon production technologies, but must also continually adjust their products and strategies according to market demands. For example, battery manufacturers may need to implement new production processes, utilize optimized materials to reduce carbon emissions, or improve supply chain management to lower their overall carbon footprint. Furthermore, government entities play a crucial role in driving industrial upgrades and improving environmental quality by formulating and enforcing carbon reduction policies. However, government policies must balance environmental protection requirements with industrial development; overly stringent environmental standards may restrict the growth of certain industries or lead to a sharp increase in production costs, thereby affecting the international competitiveness of goods. Therefore, governments can reduce the economic pressure of corporate transformation by providing subsidies, tax incentives, or technical support. Research institutions serve as a bridge connecting policies and markets, providing technological innovation support to manufacturers and helping them improve production processes and product designs. Through cutting-edge research and development activities, these institutions can continuously explore and promote more environmentally friendly materials and technologies, effectively driving the industry toward a low-carbon and efficient direction.
However, despite the many positive insights and strategic recommendations offered by this study, its practical application and impact still face several challenges. On one hand, the policy and market dynamics vary significantly across different countries and regions, requiring Chinese battery manufacturers to constantly adjust their strategies to adapt to various policy environments worldwide. On the other hand, the research and application of environmentally friendly technologies require substantial capital investment and time, which may be difficult for small and medium-sized enterprises to afford.
In summary, this study not only provides valuable data support and decision-making references for policymakers and industry decision-makers but also demonstrates through model analysis and numerical simulation how policy design influences market behavior and industrial evolution. While challenges abound, it offers a pathway toward cooperation and technological innovation, guiding the market toward a greener and more sustainable future.
6.3. Future Directions
This article examines the carbon footprint improvement process of power battery exports through the use of the evolutionary game strategy. The following issues are worthy of further discussion. First, it is difficult to build an accurate multiparty game model, while reality is complex and changeable. It is challenging to accurately describe the relationship among all parties. Second, information asymmetry may affect decisions, leading to some key information being ignored or one party’s decision being influenced by the other party. Third, diversity of tactics under different policies, strategies and objectives can be considered. This will increase the complexity and uncertainty of model predictions. Subsequent studies can explore the carbon footprint refinement process from more perspectives, adding more influencing factors, periods, and strategy analyses to make the model closer to the complex reality. This research lays the theoretical foundation for this field and puts forward the idea of further deepening the research. It is beneficial to establish a more comprehensive and systematic process analysis framework for carbon accounting improvement.
Author Contributions
Conceptualization, C.L., X.J., K.T., Y.W. and F.X.; methodology, C.L., X.J. and K.T.; software, C.L., X.J., K.T., Y.W. and F.X.; validation, C.L., X.J. and K.T.; formal analysis, C.L., X.J., K.T., Y.W. and F.X.; investigation, C.L. and X.J.; resources, C.L., X.J. and F.X.; data curation, X.J. and K.T.; writing—original draft preparation, C.L., X.J. and K.T.; writing—review and editing, C.L., X.J. and K.T.; visualization, X.J. and K.T.; supervision, K.T.; project administration, K.T.; funding acquisition, C.L. All authors have read and agreed to the published version of the manuscript.
Funding
This research is supported in part by the Macau Science and Technology Development Fund (FDCT), Macau SAR (Grant No. 0008/2022/ITP) and the Faculty Research Grant of Macau University of Science and Technology (Grant No. FRG-24-076-MSB).
Data Availability Statement
The original contributions presented in this study are included in the article. Further inquiries can be directed to the corresponding author.
Conflicts of Interest
The authors declare no conflict of interest.
References
- Mo, T.; Li, Y.; Lau, K.-T.; Poon, C.K.; Wu, Y.; Luo, Y. Trends and Emerging Technologies for the Development of Electric Vehicles. Energies 2022, 15, 6271. [Google Scholar] [CrossRef]
- Wang, L.; Wang, X.; Yang, W.X. Optimal design of electric vehicle battery recycling network—From the perspective of electric vehicle manufacturers. Appl. Energy 2020, 275, 115328. [Google Scholar] [CrossRef]
- Mahmoudian, F.; Lu, J.; Yu, D.; Nazari, J.A.; Herremans, I.M. Inter-and intra-organizational stakeholder arrangements in carbon management accounting. Br. Account. Rev. 2021, 53, 100933. [Google Scholar] [CrossRef]
- Yan, H.-S.; Tan, X.-C.; Zeng, A.; Kong, L. China’s carbon accounting system in the context of carbon neutrality: Current situation, challenges and suggestions. Adv. Clim. Chang. Res. 2023, 14, 23–31. [Google Scholar] [CrossRef]
- Govindan, K.; Seuring, S.; Zhu, Q.; Azevedo, S.G. Accelerating the transition towards sustainability dynamics into supply chain relationship management and governance structures. J. Clean. Prod. 2016, 112, 1813–1823. [Google Scholar] [CrossRef]
- D'adamo, I.; Gastaldi, M.; Ozturk, I. The sustainable development of mobility in the green transition: Renewable energy, local industrial chain, and battery recycling. Sustain. Dev. 2022, 31, 840–852. [Google Scholar] [CrossRef]
- Savaskan, R.C.; Bhattacharya, S.; Van Wassenhove, L.N. Closed-loop supply chain models with product remanufacturing. Manag. Sci. 2004, 50, 239–252. [Google Scholar] [CrossRef]
- Kaushal, R.K.; Nema, A.K.; Chaudhary, J. Strategic exploration of battery waste management: A game-theoretic approach. Waste Manag. Res. 2015, 33, 681–689. [Google Scholar] [CrossRef]
- Golmohammadzadeh, R.; Faraji, F.; Rashchi, F. Recovery of lithium and cobalt from spent lithium ion batteries (LIBs) using organic acids as leaching reagents: A review. Resour. Conserv. Recycl. 2018, 136, 418–435. [Google Scholar] [CrossRef]
- Sethurajan, M.; Gaydardzhiev, S. Bioprocessing of spent lithium ion batteries for critical metals recovery—A review. Resour. Conserv. Recycl. 2021, 165, 105225. [Google Scholar] [CrossRef]
- Tan, K.; Tian, Y.; Xu, F.; Li, C. Research on Multi-Objective Optimal Scheduling for Power Battery Reverse Supply Chain. Mathematics 2023, 11, 901. [Google Scholar] [CrossRef]
- Iwanaga, S.; Tsuzuki, N.; Kuboyama, H. Impact of the change in raw material supply on enterprise strategies of the Japanese plywood industry. J. For. Res. 2018, 23, 325–335. [Google Scholar] [CrossRef]
- Lai, E.; Yun, F.; Arokiam, I.; Joo, J. Barriers Affecting Successful Lean Implementation in Singapore's Shipbuilding Industry: A Case Study. Oper. Supply Chain Manag. -Int. J. 2020, 13, 166–175. [Google Scholar] [CrossRef]
- Gupta, S.; Gallear, D.; Rudd, J.; Foroudi, P. The impact of brand value on brand competitiveness. J. Bus. Res. 2020, 112, 210–222. [Google Scholar] [CrossRef]
- Silwal, P.P. Corporate cultures and financial performance: The mediating role of firm innovation. Cogent Bus. Manag. 2022, 9, 2010480. [Google Scholar] [CrossRef]
- Sánchez-Sellero, P.; Bataineh, M.J. Efforts to Innovate Favouring the Absorption of Foreign Direct Investment So as to Achieve Beneficial Outcomes from Innovation. Systems 2024, 12, 116. [Google Scholar] [CrossRef]
- Luo, H.Y.; Qu, X.E. Export Trade, Absorptive Capacity, and High-Quality Economic Development in China. System 2023, 11, 54. [Google Scholar] [CrossRef]
- Li, X.M.; Tan, M.S. The Impact of Digital Transformation on the Global Value Chain Position of the Guangdong-Hong Kong-Macao Greater Bay Area. System 2024, 12, 223. [Google Scholar] [CrossRef]
- Chen, T.G.; Qiu, Y.W.; Wang, B.; Yang, J.J. Analysis of Effects on the Dual Circulation Promotion Policy for Cross-Border E-Commerce B2B Export Trade Based on System Dynamics during COVID-19. Systems 2022, 10, 13. [Google Scholar] [CrossRef]
- Ye, F.L.; Paulson, N.; Khanna, M. Strategic innovation and technology adoption under technological uncertainty. J. Econ. Dyn. Control 2024, 165, 104879. [Google Scholar] [CrossRef]
- Song, M.; Wang, S. Market competition, green technology progress and comparative advantages in China. Manag. Decis. 2018, 56, 188–203. [Google Scholar] [CrossRef]
- Soriano, F.A.; Villano, R.A.; Fleming, E.M.; Battese, G.E. What’s driving innovation in small businesses in Australia? The case of the food industry. Aust. J. Agric. Resour. Econ. 2019, 63, 39–71. [Google Scholar] [CrossRef]
- Zhou, Z.; Tang, Y. Green Supply Chain Management Model of e-Commerce Enterprises Based on SCOR Model. Mob. Inf. Syst. 2022, 2022, 3191317. [Google Scholar] [CrossRef]
- Perera, R.S. An Evolutionary Game Theory Strategy for Carbon Emission Reduction in the Electricity Market. Int. Game Theory Rev. 2018, 20, 1850008. [Google Scholar] [CrossRef]
- Sun, H.; Gao, G.K.; Li, Z.H. Evolutionary game analysis of enterprise carbon emission regulation based on prospect theory. Soft Comput. 2022, 26, 13357–13368. [Google Scholar] [CrossRef]
- Wang, H.J.; Chen, L.H.; Liu, J. An evolutionary game theory analysis linking manufacturing, logistics, and the government in low-carbon development. J. Oper. Res. Soc. 2022, 73, 1014–1032. [Google Scholar] [CrossRef]
- Senyshyn, A.; Mühlbauer, M.; Dolotko, O.; Ehrenberg, H. Low-temperature performance of Li-ion batteries: The behavior of lithiated graphite. J. Power Sources 2015, 282, 235–240. [Google Scholar] [CrossRef]
- Jaguemont, J.; Boulon, L.; Dubé, Y. A comprehensive review of lithium-ion batteries used in hybrid and electric vehicles at cold temperatures. Appl. Energy 2016, 164, 99–114. [Google Scholar] [CrossRef]
- Li, C.; Li, Z.; He, Y.; Wang, H.; Xu, Y. Construction of Kinetics Pathways in Lithium Titanate Composite Material to Quickly Store Sodium Ion for the Dual-Ion Batteries. ACS Appl. Energy Mater. 2020, 3, 7550–7559. [Google Scholar] [CrossRef]
- Liu, Z.G.; Anderson, T.D.; Cruz, J.M. Consumer environmental awareness and competition in two-stage supply chains. Eur. J. Oper. Res. 2012, 218, 602–613. [Google Scholar] [CrossRef]
- Sana, S.S. Price competition between green and non green products under corporate social responsible firm. J. Retail. Consum. Serv. 2020, 55, 102118. [Google Scholar] [CrossRef]
- Barman, A.; Das, R.; De, P.K.; Sana, S.S. Optimal pricing and greening strategy in a competitive green supply chain: Impact of government subsidy and tax policy. Sustainability 2021, 13, 9178. [Google Scholar] [CrossRef]
- Beaudet, A.; Larouche, F.; Amouzegar, K.; Bouchard, P.; Zaghib, K. Key challenges and opportunities for recycling electric vehicle battery materials. Sustainability 2020, 12, 5837. [Google Scholar] [CrossRef]
- Mayyas, A.; Steward, D.; Mann, M. The case for recycling: Overview and challenges in the material supply chain for automotive li-ion batteries. Sustain. Mater. Technol. 2019, 19, e00087. [Google Scholar] [CrossRef]
- Zhao, X.; Peng, B.; Zheng, C.; Wan, A. Closed-loop supply chain pricing strategy for electric vehicle batteries recycling in China. Environ. Dev. Sustain. 2022, 24, 7725–7752. [Google Scholar] [CrossRef]
- Zhao, T.J.; Xiao, X.; Zhang, B.S. Economic policy uncertainty and corporate social responsibility performance: Evidence from China. Sustain. Account. Manag. Policy J. 2021, 12, 1003–1026. [Google Scholar] [CrossRef]
- Chai, Q.; Xiao, Z.; Zhou, G. Competitive strategies for original equipment manufacturers considering carbon cap and trade. Transp. Res. Part D Transp. Environ. 2020, 78, 102193. [Google Scholar] [CrossRef]
- Xiang, C.; Van Gevelt, T. Political signalling and emissions trading schemes in China: Insights from Guangdong Province. Energy Sustain. Dev. 2022, 71, 307–314. [Google Scholar] [CrossRef]
- Guo, X.; Kang, L.; Yao, Y.; Huang, Z.; Li, W. Joint Estimation of the Electric Vehicle Power Battery State of Charge Based on the Least Squares Method and the Kalman Filter Algorithm. Energies 2016, 9, 100. [Google Scholar] [CrossRef]
- Jaafar, A.; Turpin, C.; Roboam, X.; Bru, E.; Rallieres, O. Energy management of a hybrid system based on a fuel cell and a Lithium Ion battery: Experimental tests and integrated optimal design. Math. Comput. Simul. 2017, 131, 21–37. [Google Scholar] [CrossRef]
- Uddin, K.; Jackson, T.; Widanage, W.D.; Chouchelamane, G.; Jennings, P.A.; Marco, J. On the possibility of extending the lifetime of lithium-ion batteries through optimal V2G facilitated by an integrated vehicle and smart-grid system. Energy 2017, 133, 710–722. [Google Scholar] [CrossRef]
- Patil, K.; Pendse, P.; Mote, A.; Patil, A.; Sarnobat, R. Design and Analysis of Control Strategy for an Efficient Battery Thermal Management System of an Electric Vehicle. Int. J. Veh. Struct. Syst. 2022, 14, 144. [Google Scholar] [CrossRef]
- Ahmadi, L.; Yip, A.; Fowler, M.; Young, S.B.; Fraser, R.A. Environmental feasibility of re-use of electric vehicle batteries. Sustain. Energy Technol. Assess. 2014, 6, 64–74. [Google Scholar] [CrossRef]
- Zeng, X.; Li, J.; Liu, L. Solving spent lithium-ion battery problems in China: Opportunities and challenges. Renew. Sustain. Energy Rev. 2015, 52, 1759–1767. [Google Scholar] [CrossRef]
- Turner, J.M.; Nugent, L.M. Charging up Battery Recycling Policies: Extended Producer Responsibility for Single-Use Batteries in the European Union, Canada, and the United States. J. Ind. Ecol. 2015, 20, 1148–1158. [Google Scholar] [CrossRef]
- Cheng, Y.; Hao, H.; Tao, S.; Zhou, Y. Traceability Management Strategy of the EV Power Battery Based on the Blockchain. Sci. Program. 2021, 2021, 1–17. [Google Scholar] [CrossRef]
- Kamyabi, E.; Moazzez, H.; Kashan, A.H. A hybrid system dynamics and two-stage mixed integer stochastic programming approach for closed-loop battery supply chain optimization. Appl. Math. Model. 2022, 106, 770–798. [Google Scholar] [CrossRef]
- Liu, H.; Lei, M.; Deng, H.; Keong Leong, G.; Huang, T. A dual channel, quality-based price competition model for the WEEE recycling market with government subsidy. Omega 2016, 59, 290–302. [Google Scholar] [CrossRef]
- Jiao, J.; Pan, Z.; Li, J. Effect of carbon trading scheme and technological advancement on the decision-making of power battery closed-loop supply chain. Environ. Sci. Pollut. Res. Int. 2023, 30, 14770–14791. [Google Scholar] [CrossRef]
- Liu, Q.; Zhu, X. Incentive strategies for retired power battery closed-loop supply chain considering corporate social responsibility. Environ. Dev. Sustain. 2024, 26, 19013–19050. [Google Scholar] [CrossRef]
- Yi, Y.; Liu, H. Evolutionary game theory in economic research. J. Bus. Econ. 2005, 8, 8–13. [Google Scholar]
- Han, X.Y.; Khouja, M.; Liu, X. A dynamic model considering consumer green awareness and environmental subsidy. Int. J. Prod. Econ. 2023, 260, 108840. [Google Scholar] [CrossRef]
- Gates, J.M.; Weibull, J.W. Evolutionary game theory. Am. J. Agric. Econ. 1996, 78, 850–853. [Google Scholar] [CrossRef]
- Friedman, D. Evolutionary Games in Economics. Econometrica 1991, 59, 637–666. [Google Scholar] [CrossRef]
- Olson, E.L. Lead market learning in the development and diffusion of electric vehicles. J. Clean. Prod. 2018, 172, 3279–3288. [Google Scholar] [CrossRef]
- Chang, J.-P.; Chen, Z.-S.; Wang, X.-J.; Martínez, L.; Pedrycz, W.; Skibniewski, M.J. Requirement-driven sustainable supplier selection: Creating an integrated perspective with stakeholders' interests and the wisdom of expert crowds. Comput. Ind. Eng. 2023, 175, 108903. [Google Scholar] [CrossRef]
- Lin, B.; Xu, B. How to promote the growth of new energy industry at different stages? Energy Policy 2018, 118, 390–403. [Google Scholar] [CrossRef]
- Tan, K.; Wu, Y.; Xu, F.; Ji, X.; Li, C. Modeling and Analyzing Carbon Emission Market Volatility and Impact: Evidence from Guangdong Province, China. Systems 2024, 12, 458. [Google Scholar] [CrossRef]
- Singh, J.; Pandey, K.K.; Kumar, A.; Naz, F.; Luthra, S. Drivers, barriers and practices of net zero economy: An exploratory knowledge based supply chain multi-stakeholder perspective framework. Oper. Manag. Res. 2022, 16, 1059–1090. [Google Scholar] [CrossRef]
- Tan, K.; Xu, F.; Fang, X.; Li, C. Research on Location Selection for Urban Networks of Less-than-Truckload Express Enterprises Based on Improved Immune Optimization Algorithm. Mathematics 2023, 11, 1543. [Google Scholar] [CrossRef]
- Wang, Q.; Chen, L.; Jia, F.; Luo, Y.; Zhang, Z. The relationship between supply chain integration and sustainability performance: A meta-analysis. Int. J. Logist. Res. Appl. 2022, 27, 1388–1409. [Google Scholar] [CrossRef]
- Tan, K.; Liu, W.; Xu, F.; Li, C. Optimization Model and Algorithm of Logistics Vehicle Routing Problem under Major Emergency. Mathematics 2023, 11, 1274. [Google Scholar] [CrossRef]
- Nikseresht, A.; Golmohammadi, D.; Zandieh, M. Sustainable green logistics and remanufacturing: A bibliometric analysis and future research directions. Int. J. Logist. Manag. 2023, 35, 755–803. [Google Scholar] [CrossRef]
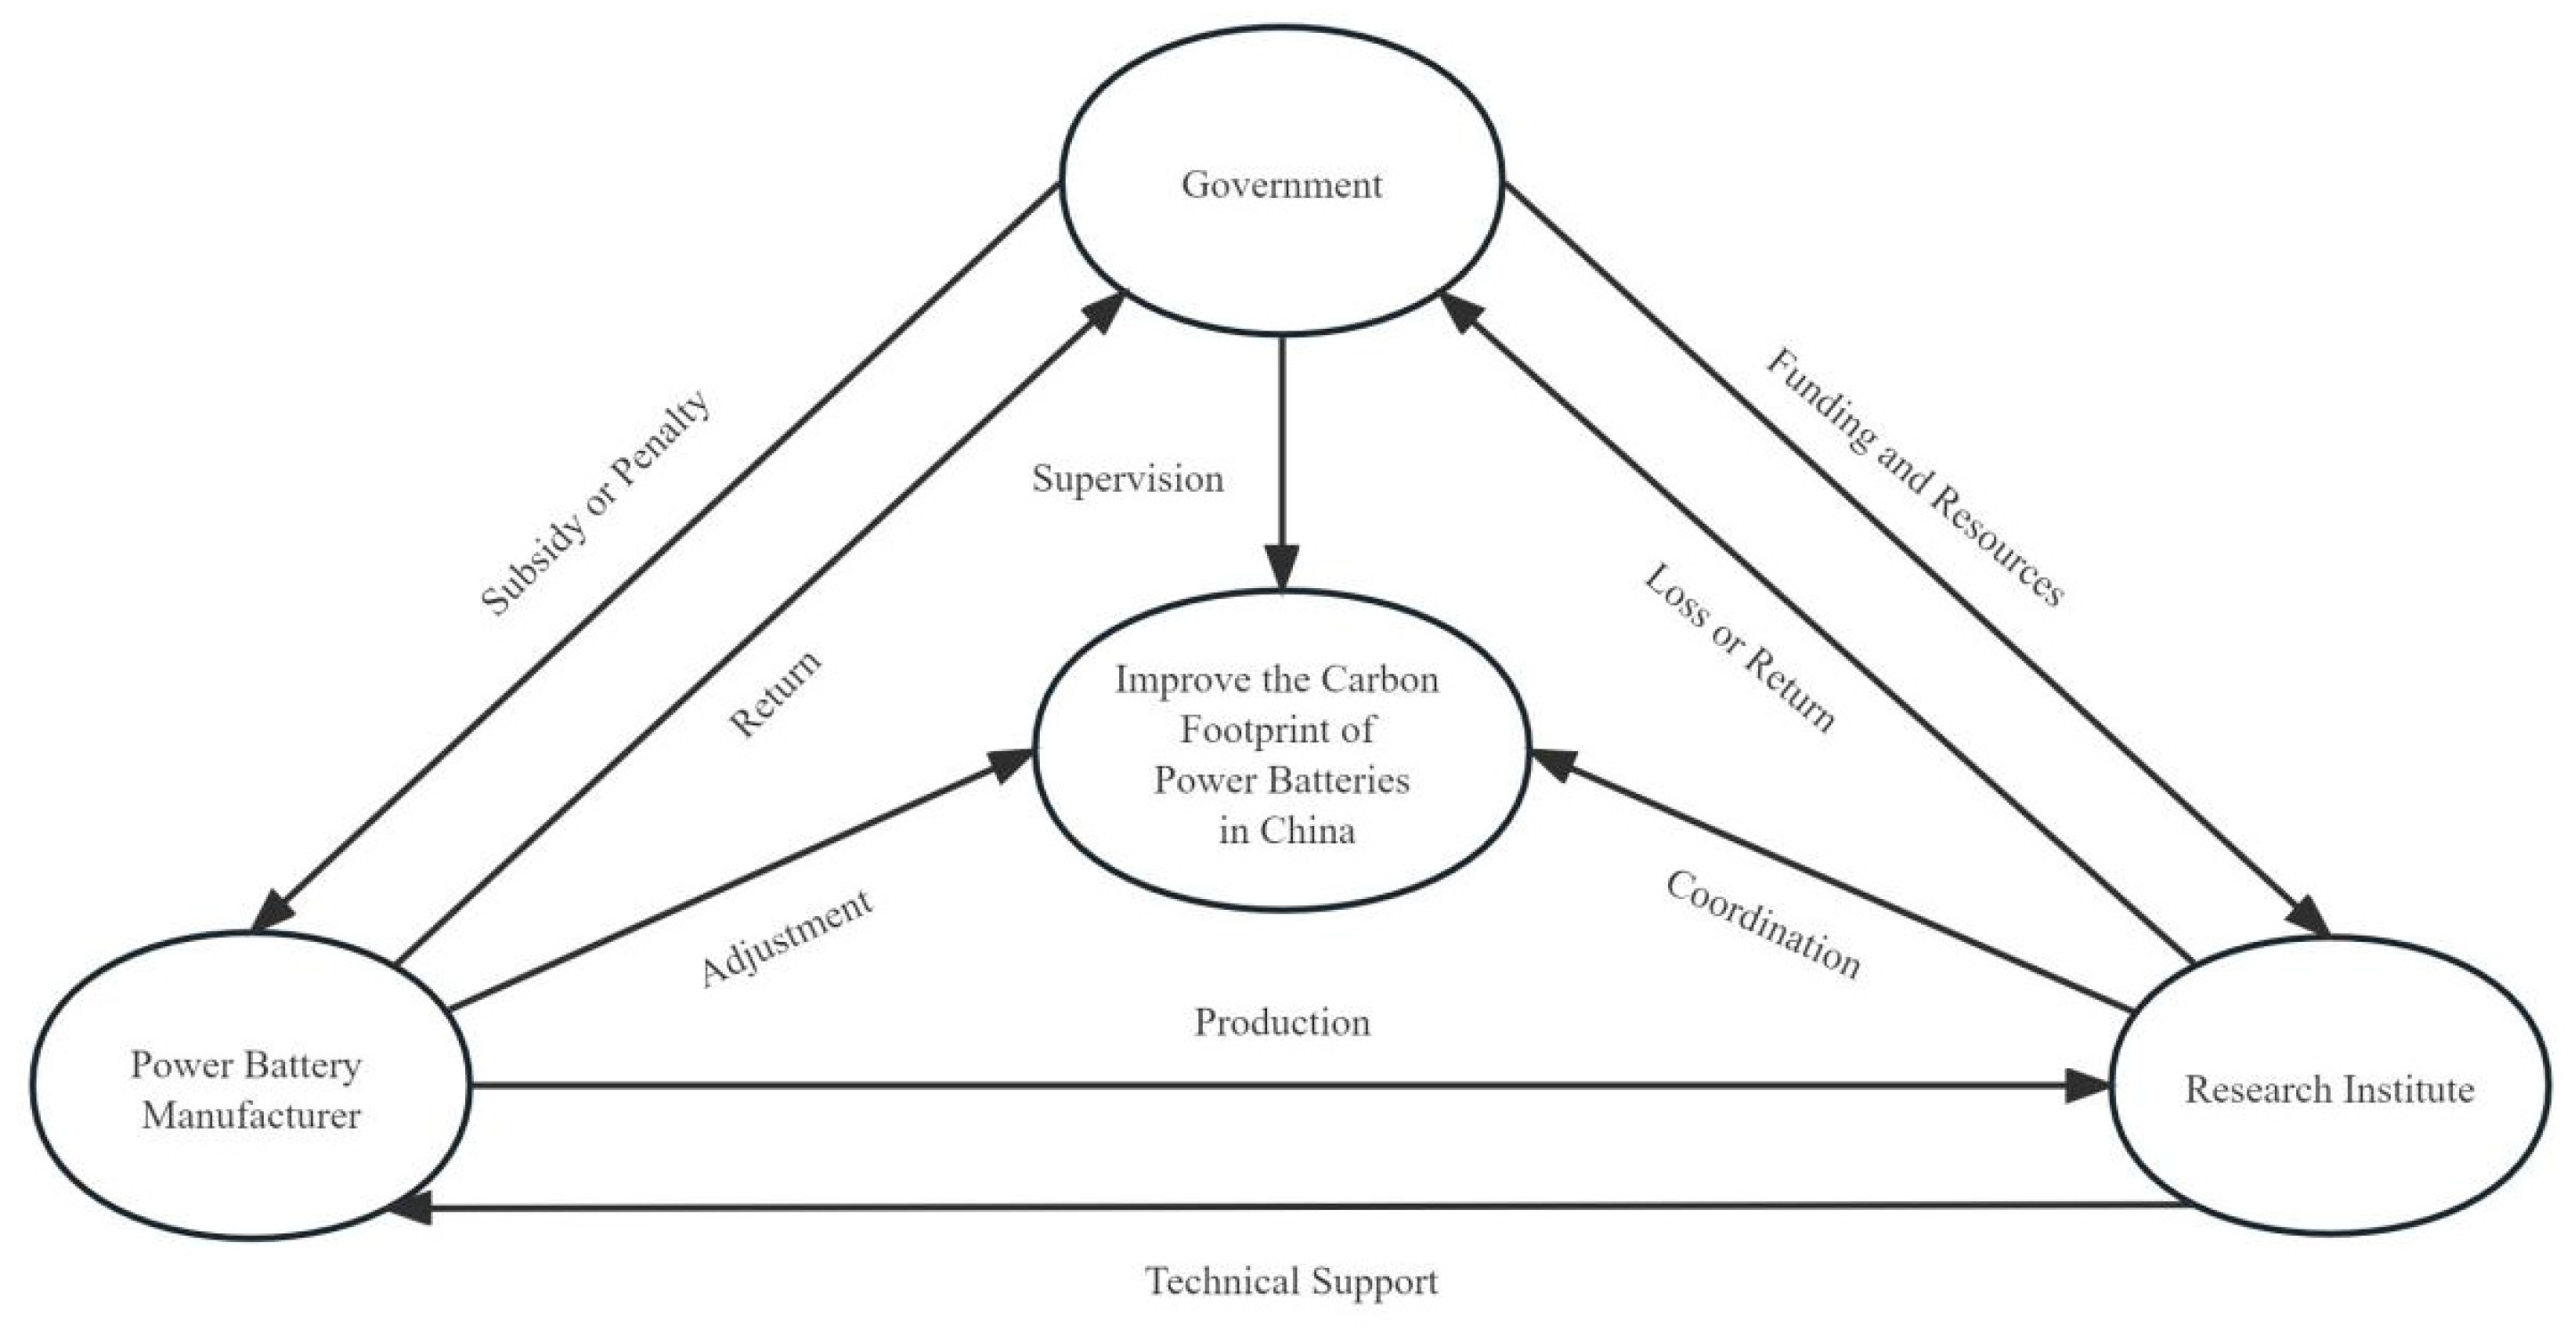


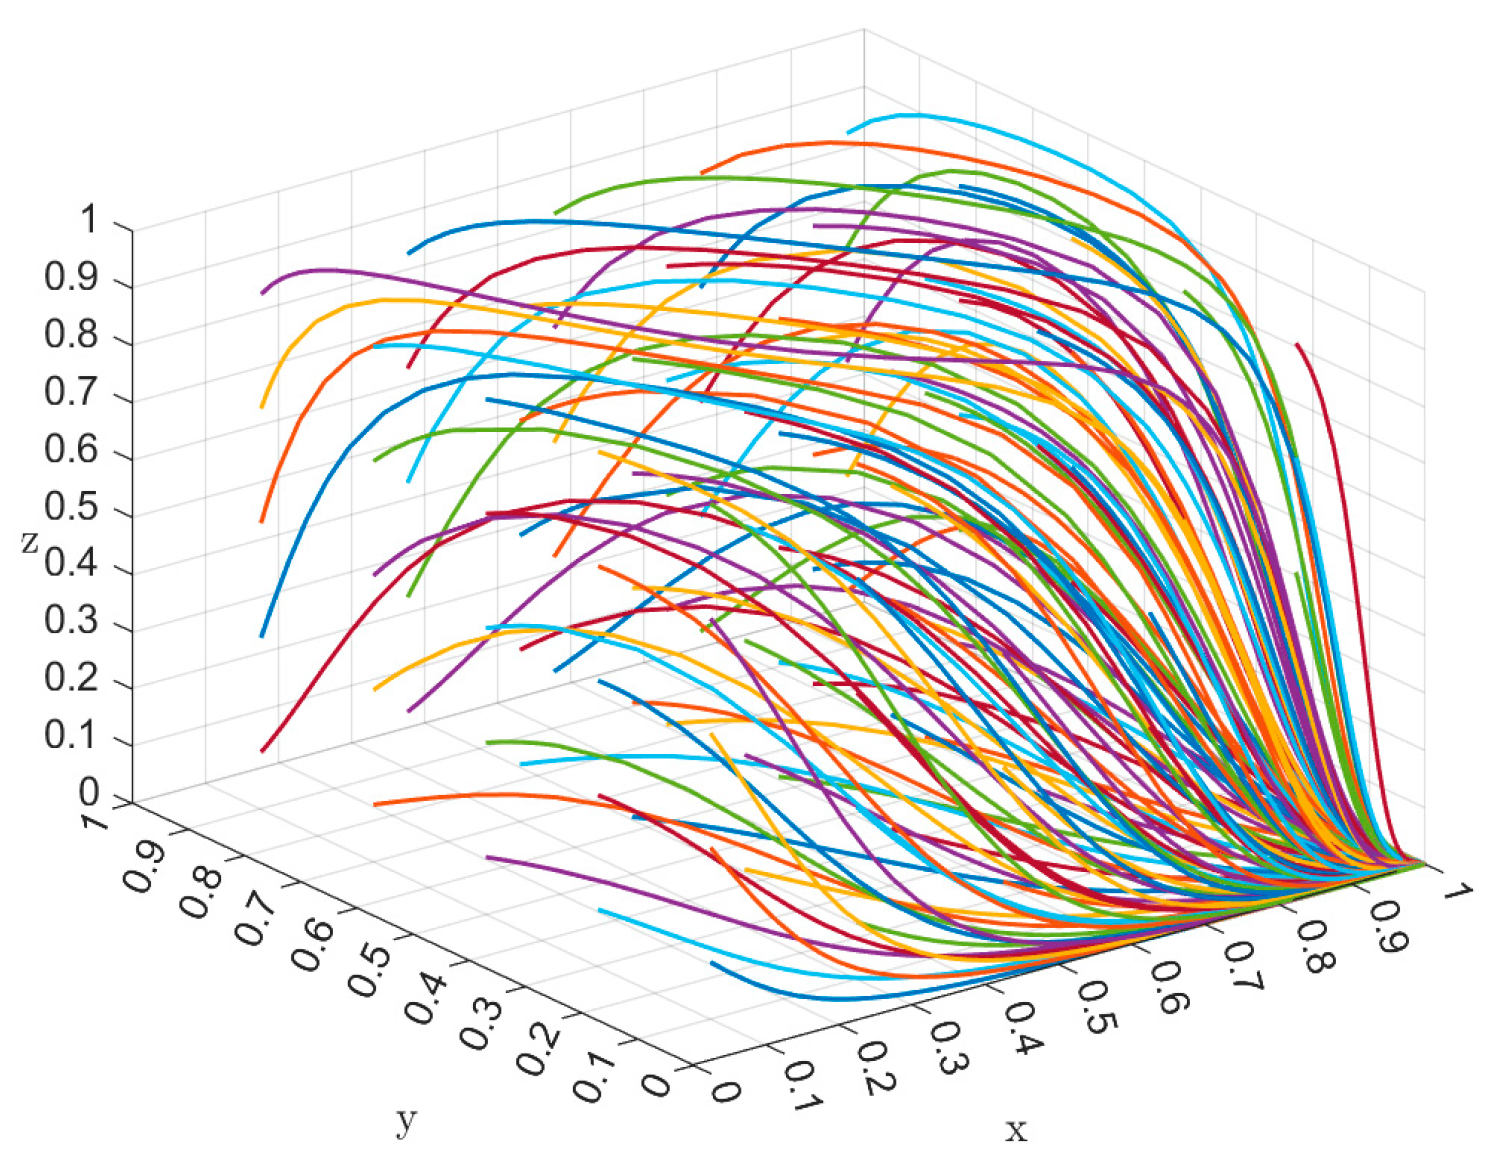
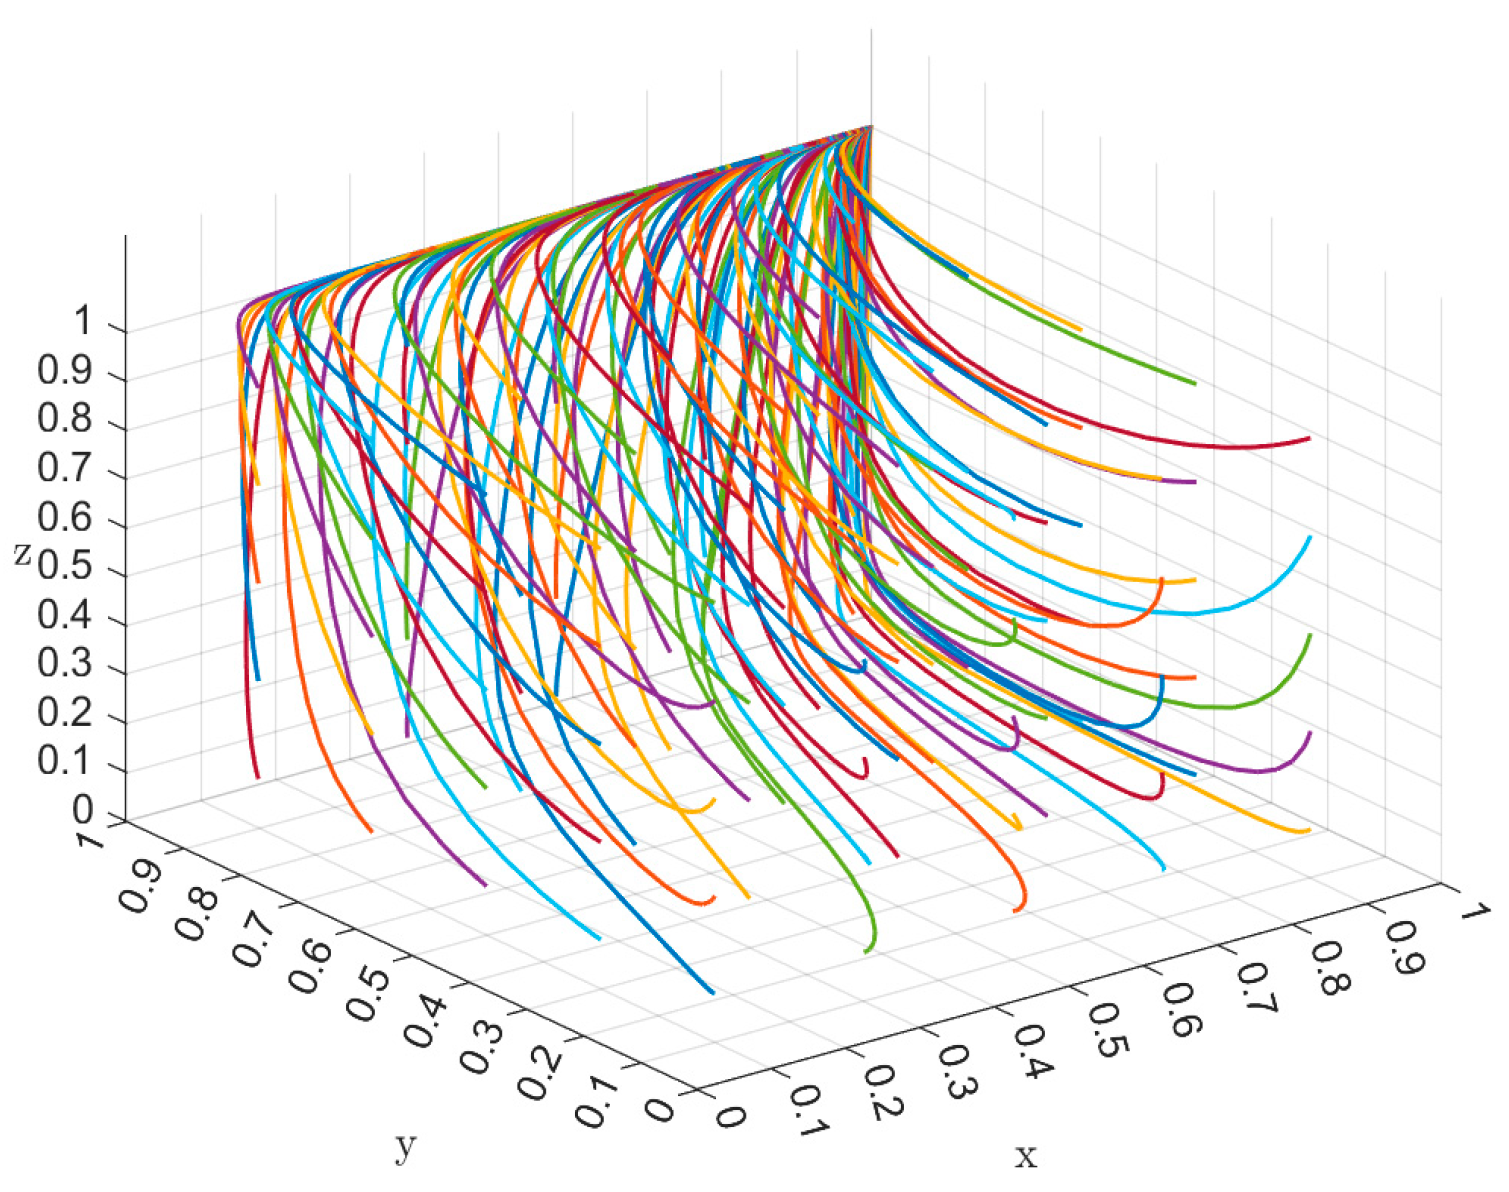

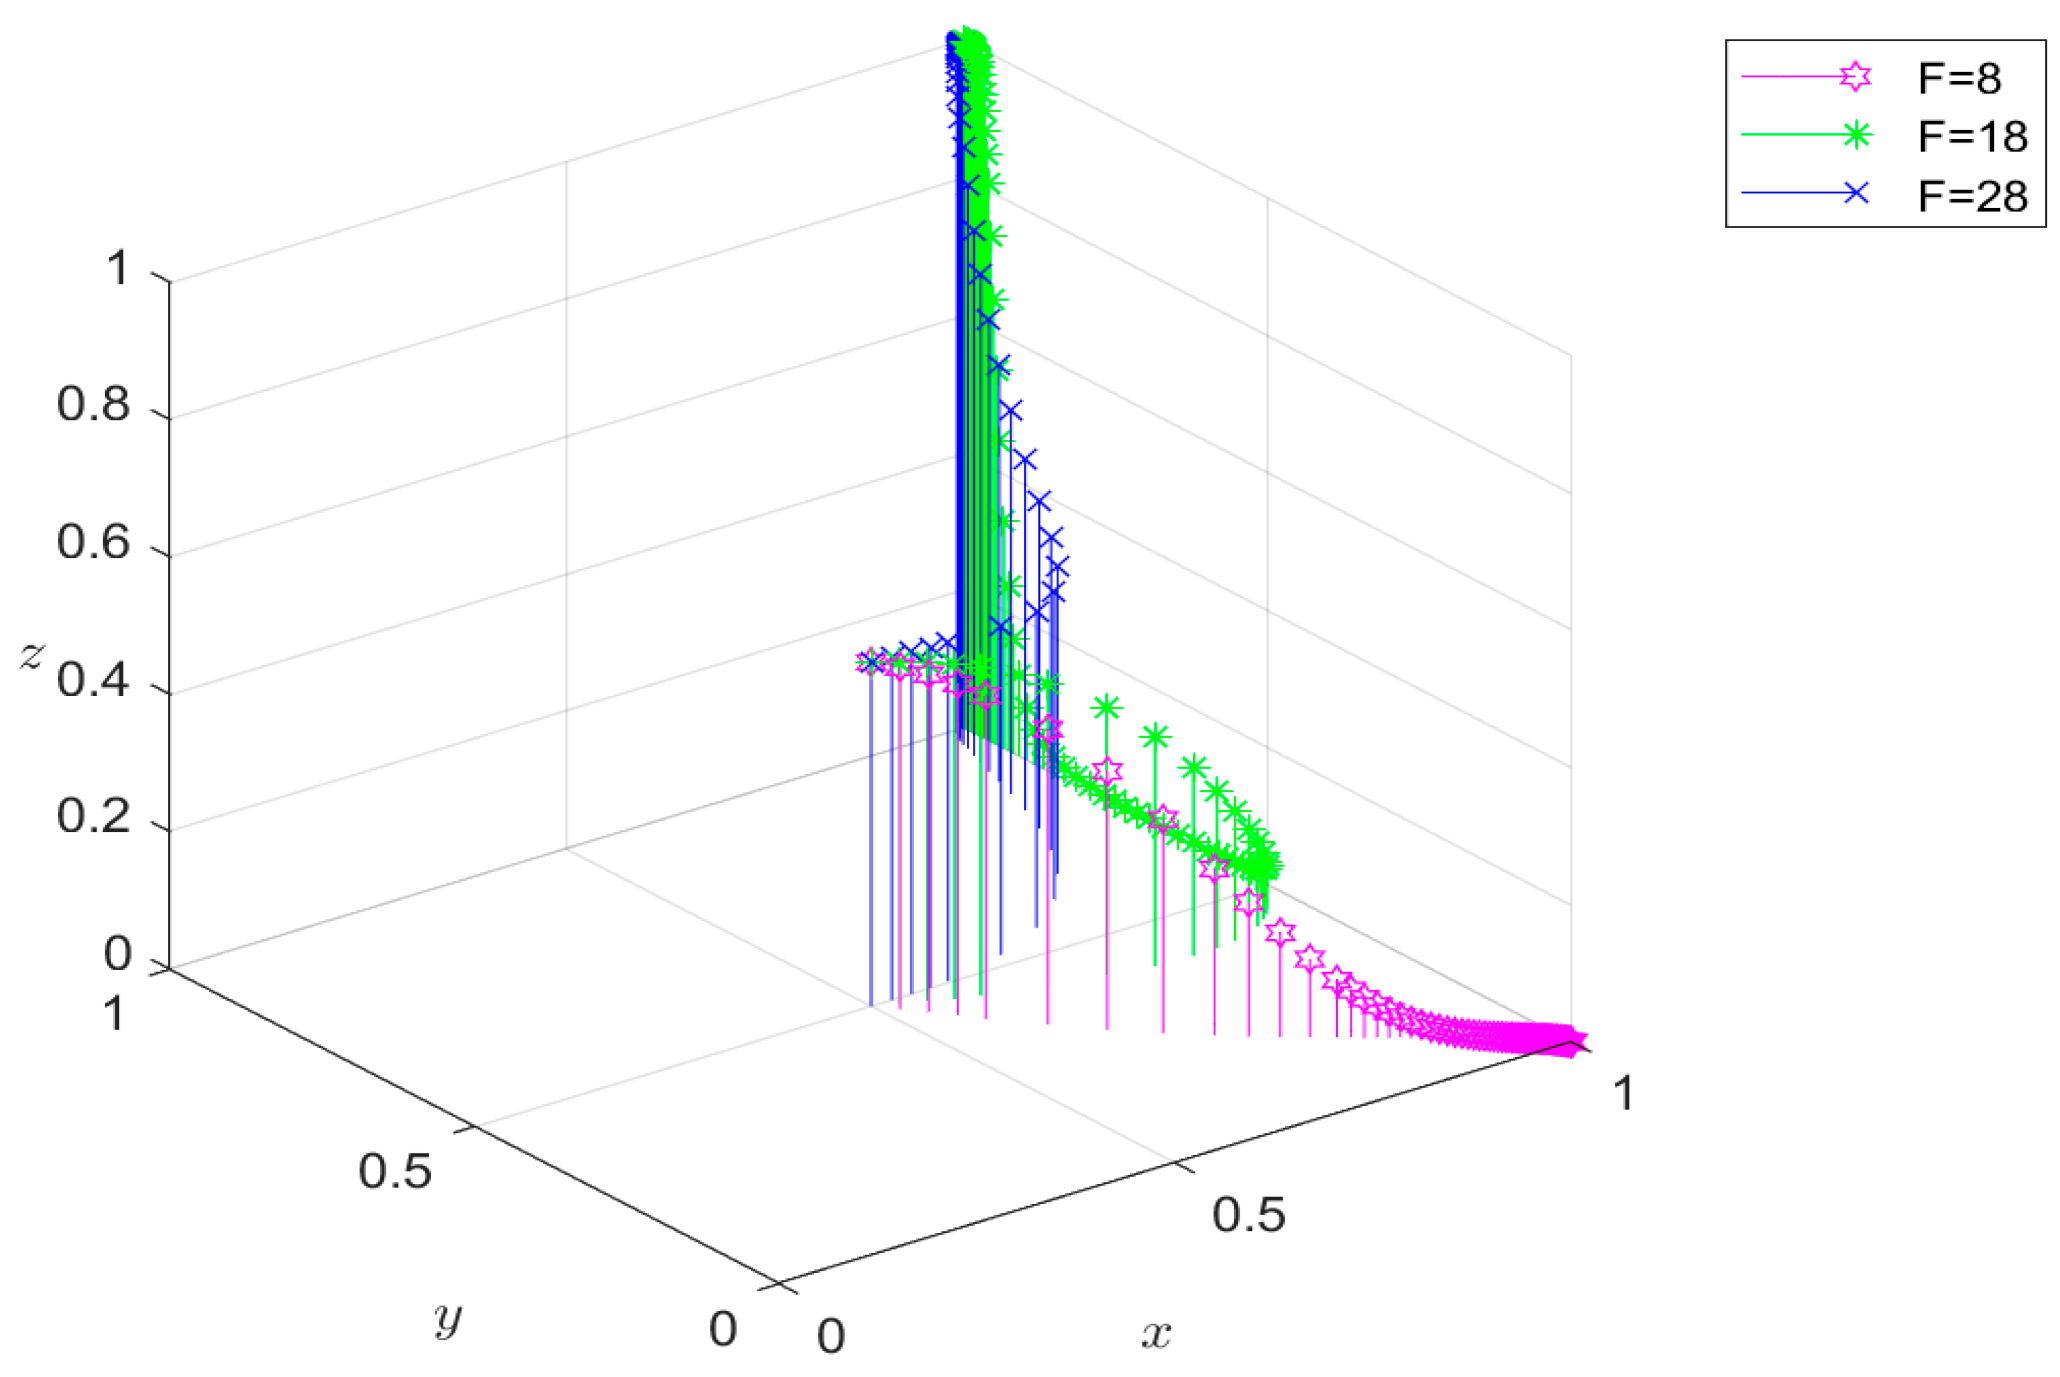


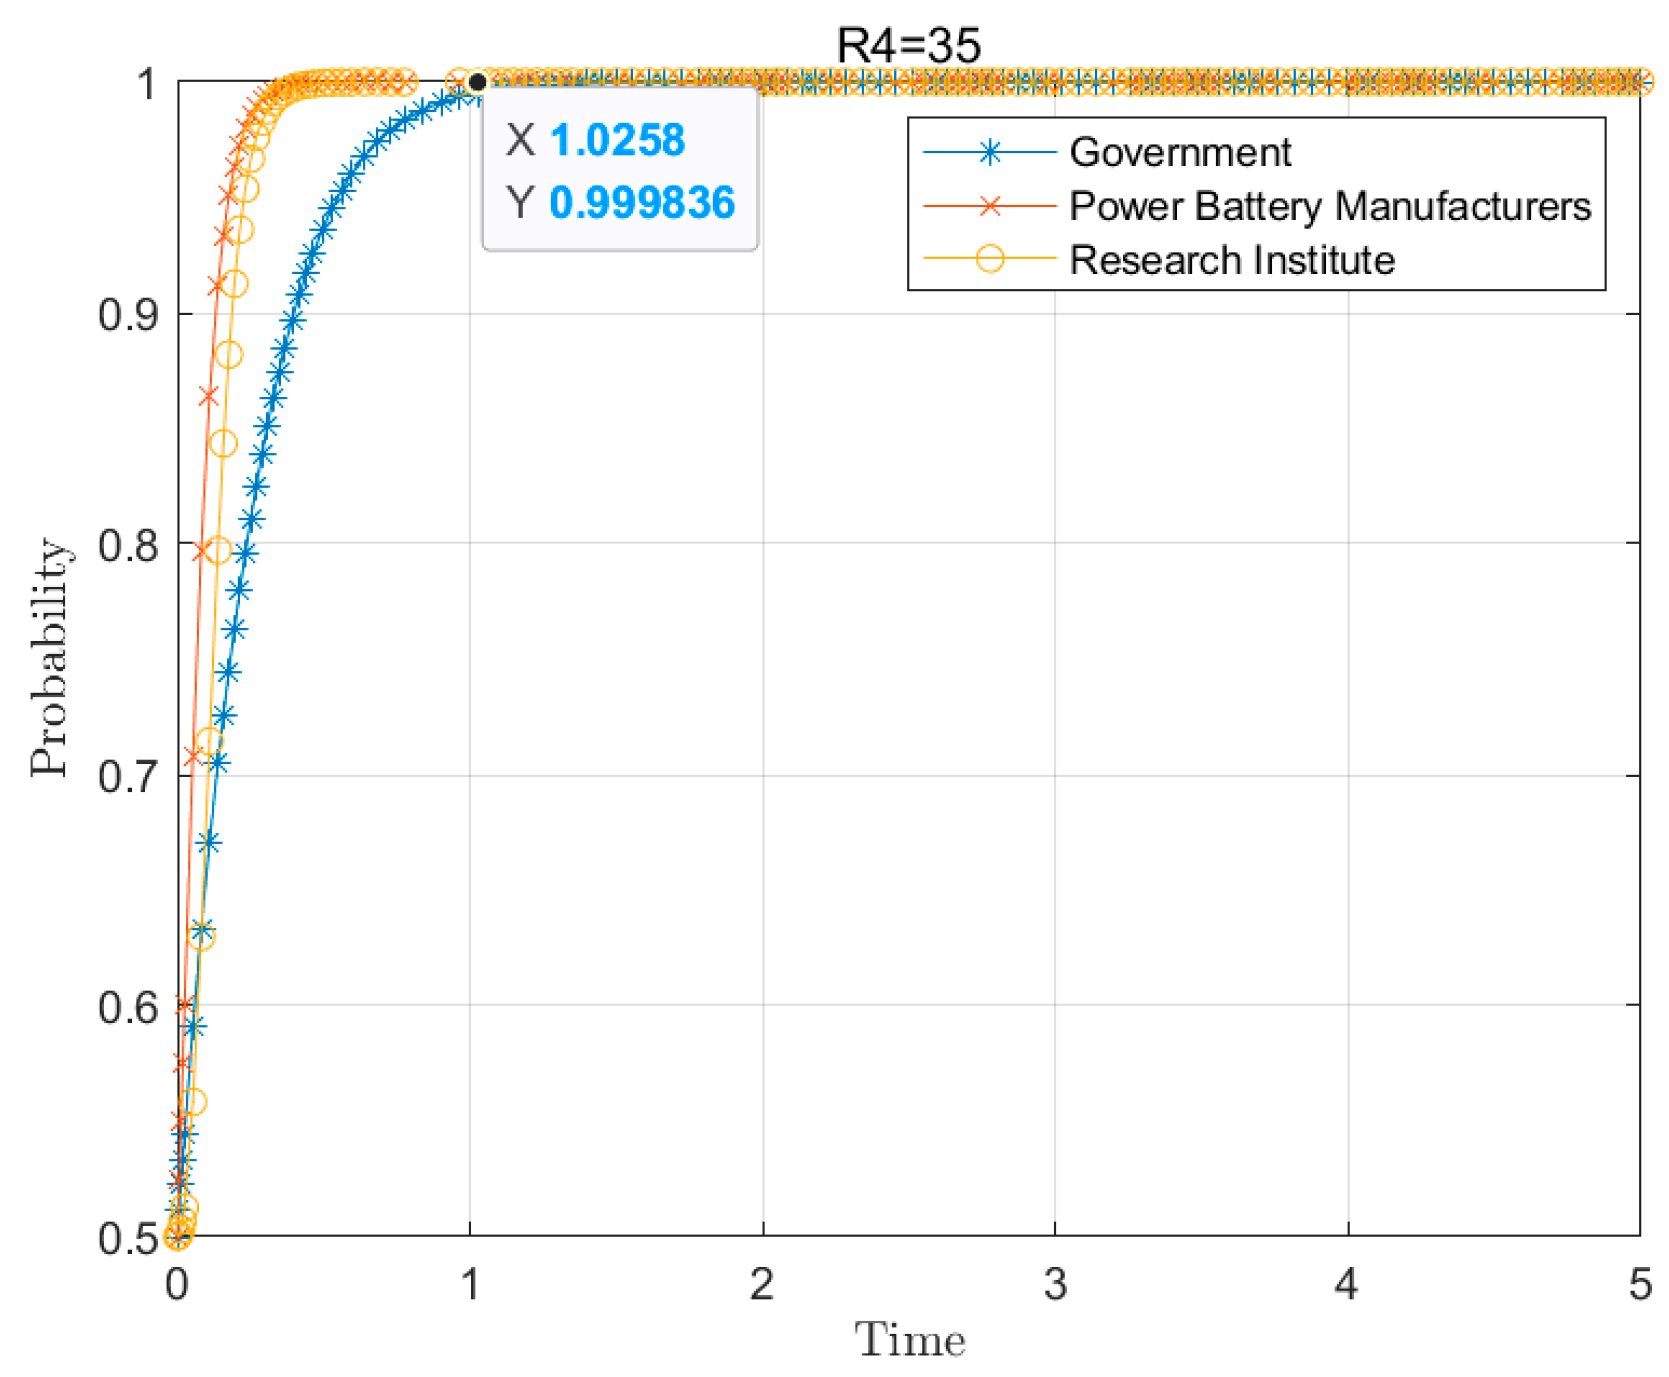
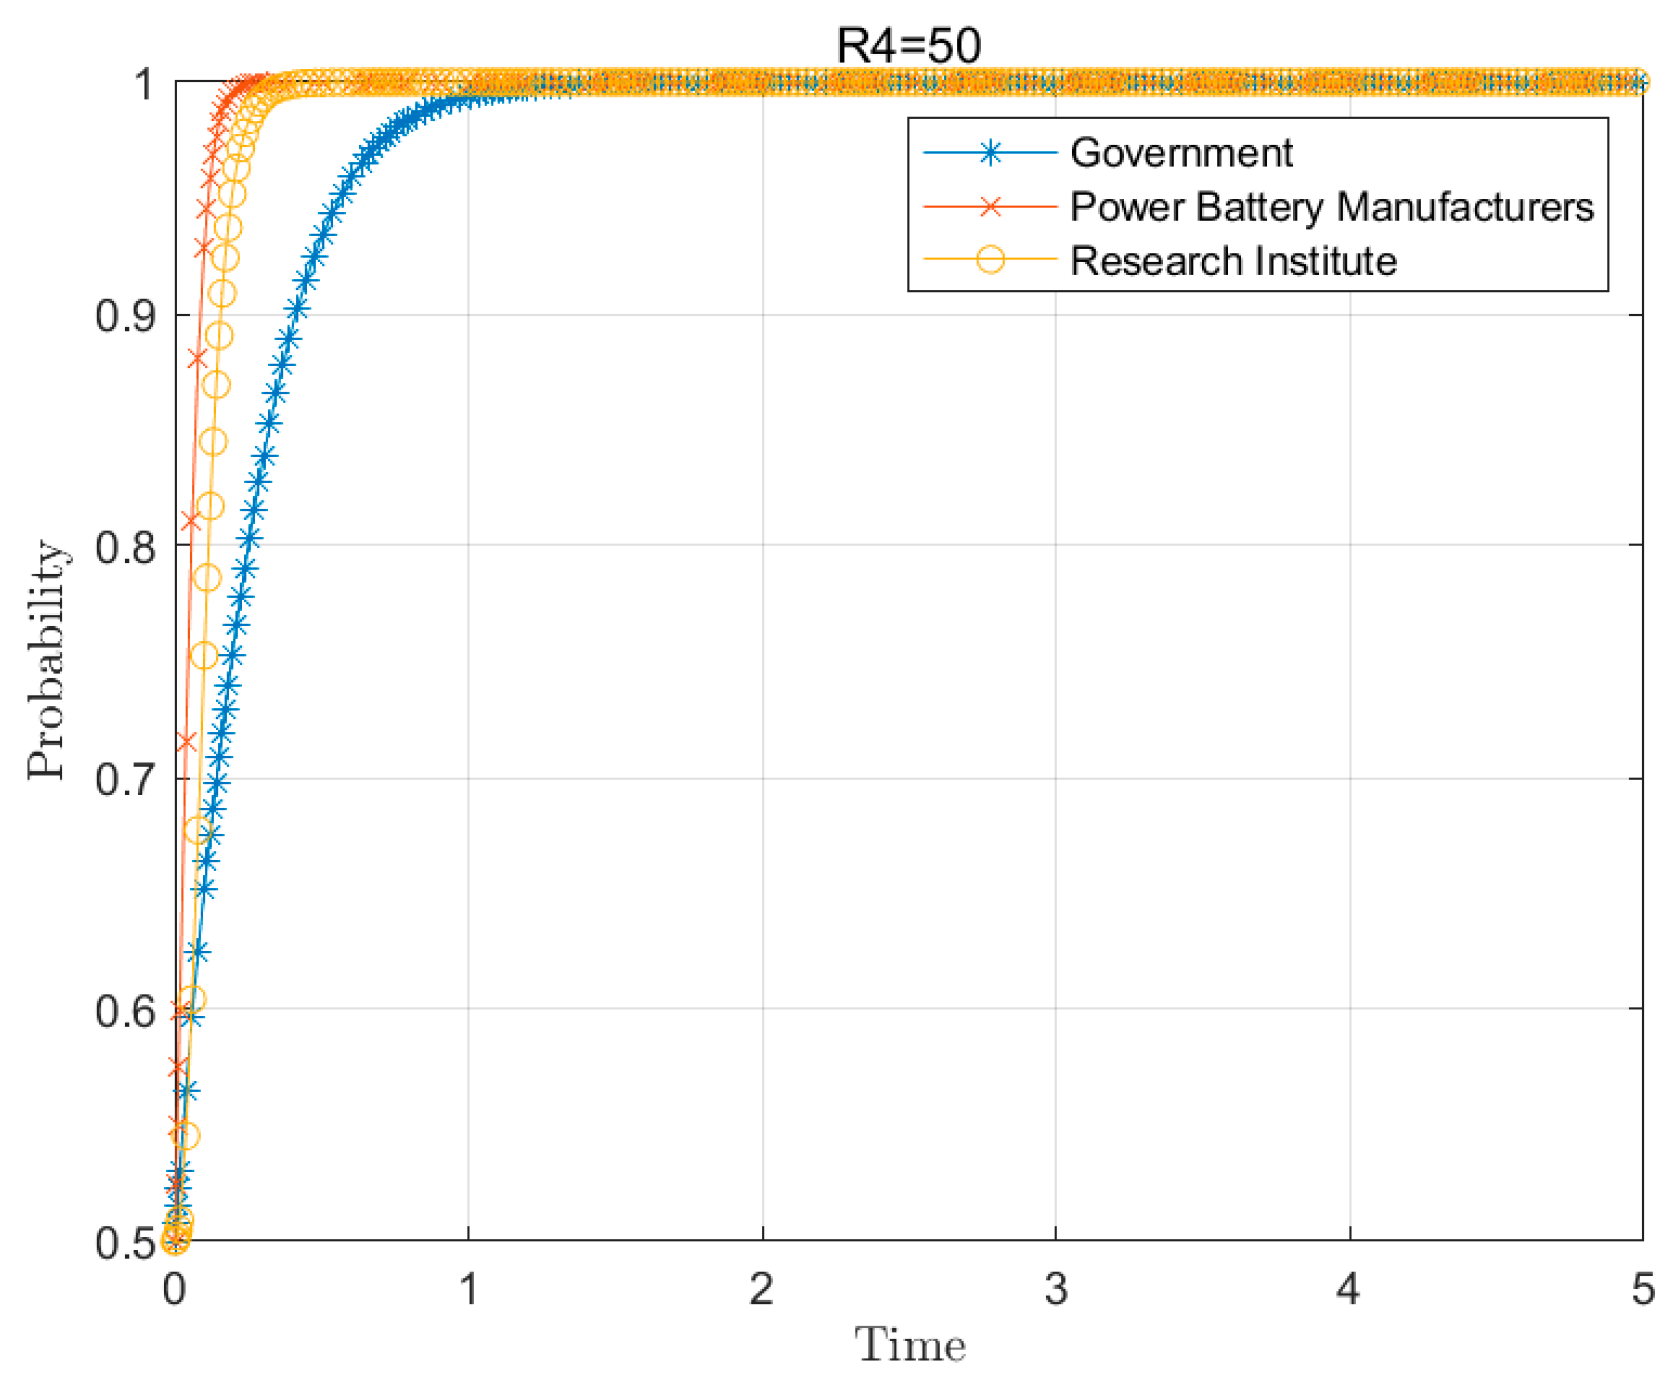

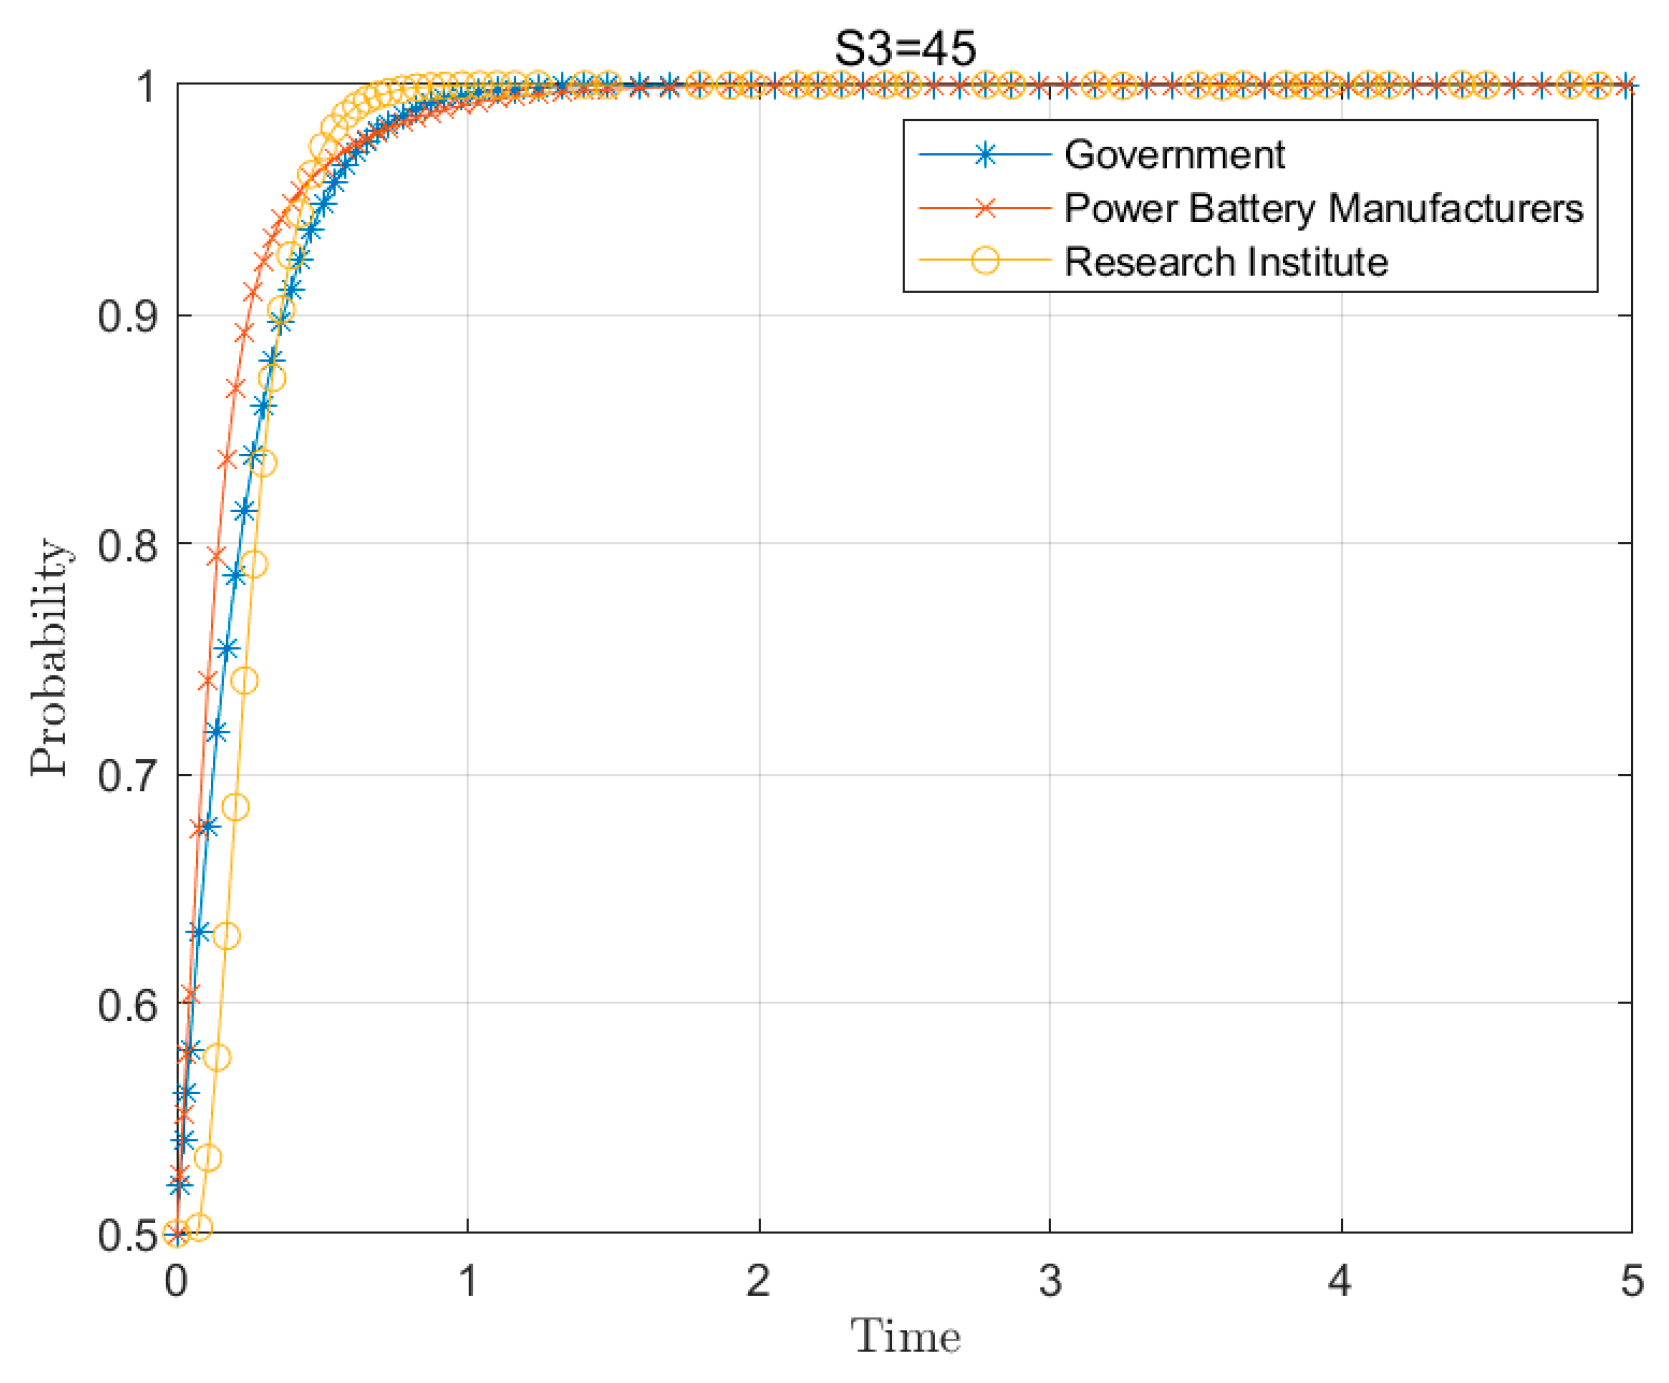
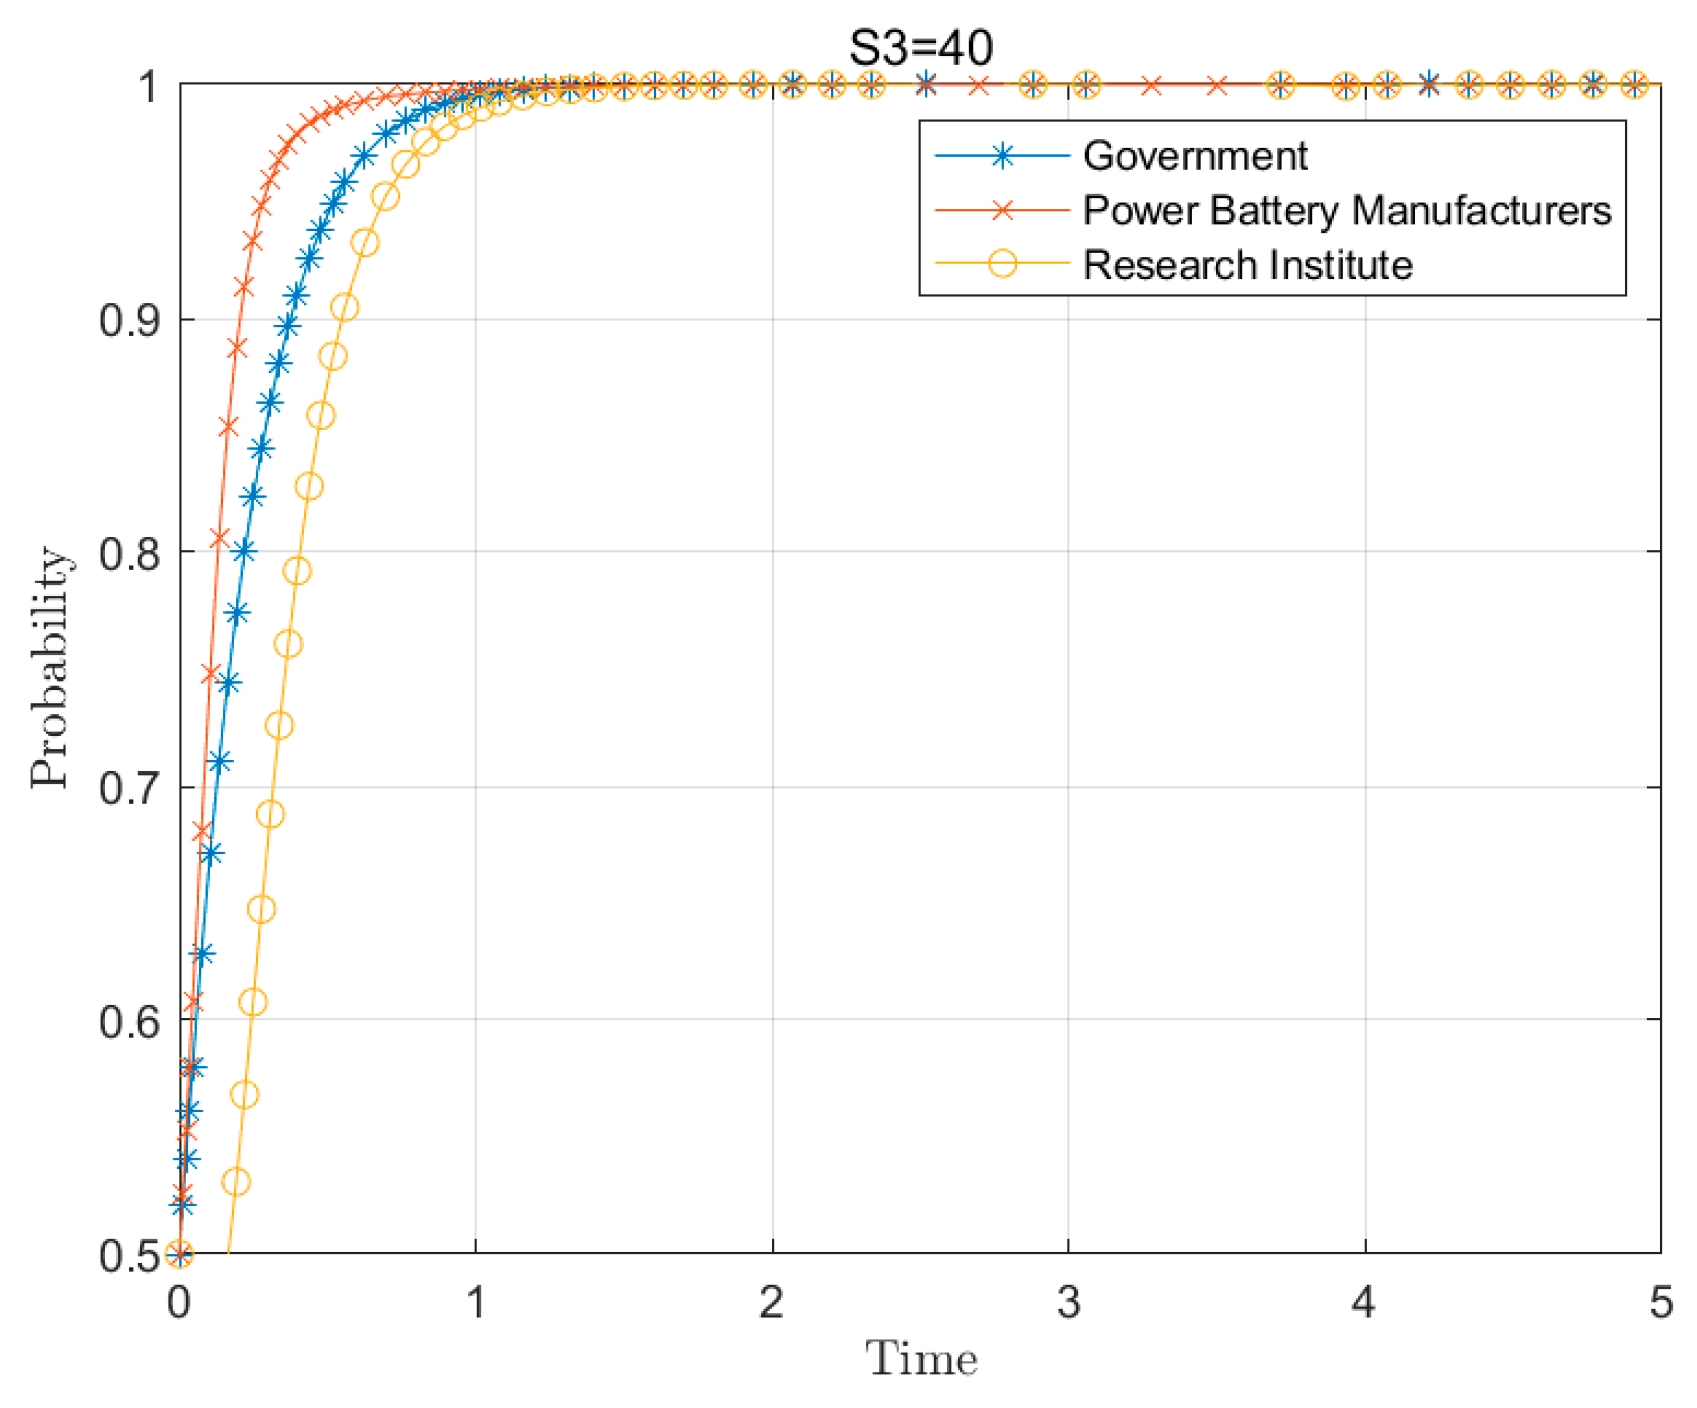
Disclaimer/Publisher’s Note: The statements, opinions and data contained in all publications are solely those of the individual author(s) and contributor(s) and not of MDPI and/or the editor(s). MDPI and/or the editor(s) disclaim responsibility for any injury to people or property resulting from any ideas, methods, instructions or products referred to in the content. |
© 2024 by the authors. Licensee MDPI, Basel, Switzerland. This article is an open access article distributed under the terms and conditions of the Creative Commons Attribution (CC BY) license (https://creativecommons.org/licenses/by/4.0/).