Abstract
Traffic regulations provide a solid foundation for the safety of all road users; however, the ambiguous provisions and unclear safety thresholds within these regulations pose significant challenges to compliance, particularly concerning the safe operation of autonomous vehicles. To address this issue, this paper conducts an in-depth analysis of vehicle emergency braking behavior based on the Aerial Dataset for China Congested Highway and Expressway (AD4CHE). The extraction method for the emergency braking risk scenario of natural driving data is proposed, and the correlation between safe distance, safe speed, and driving safety under the scenario of a slightly congested expressway is elaborated in detail. The safety threshold of ambiguous traffic rules obtained can be used for the digitalization of traffic rules that can support the functional development and traffic safety testing of automated driving systems.
1. Introduction
Safety is the first requirement for the development of road transportation [1]. An analysis of the causes of road accidents shows that more than 90 percent are caused by drivers failing to comply with the traffic rules in China. Adherence to the traffic rules can be an effective means of collision avoidance. The detection and monitoring of minor offenses by roadside equipment can effectively reduce risky driving behaviors and improve road safety conditions [2,3,4]. Autonomous vehicles, designed to improve road safety, are growing rapidly around the world; thus, more and more autonomous vehicles are being tested and operated on roads [5,6]. To ensure the safe integration of autonomous vehicles into the existing traffic system, autonomous vehicles should follow road traffic rules like human drivers [7], which can avoid introducing new traffic risks due to the implementation of differentiated rules and reduce the social acceptance of autonomous driving technology. Road traffic rules are driving behavior constraints based on rich experience in road traffic accident handling and traffic safety management. They are standardized rules described in natural language, with good readability and interpretability, suitable for human drivers to learn and understand, but they cannot be directly applied to autonomous driving systems (ADSs). Ontology-based methods can transform natural language traffic rules into machine-understandable digital traffic rules, which are well applied in the development and testing of ADSs [8,9,10,11]. However, in the process of the digitalization of traffic rules, there are a lot of qualitative descriptions in natural language rules; for example, a lane change must not interfere with the normal movement of other vehicles in the lane. Existing studies highlight the challenges posed by unclear definitions of safety parameters such as following distance, deceleration thresholds, and time to collision (TTC), all of which are crucial for autonomous driving systems. Ambiguities in these regulations not only complicate compliance assessments but also hinder the development of algorithms that simulate human-like driving behavior. Thus, it is urgent to determine the safety threshold of ambiguous traffic rules to achieve a quantitative description of traffic rules, which is also one of the difficulties in the compliance test of ADSs [12,13]. The safety threshold of traffic rules is an important component of the digitalization of ambiguous traffic rules. By analyzing the driving behaviors of human drivers in response to safety risk scenarios, such as emergency braking and lane changing during driving, the relationship between driving distance, speed, and safety risks can be determined, providing a basis for obtaining the safety threshold of ambiguous traffic rules.
The dominant analytical approach to safety thresholds is based on pre-designed kinematic models, such as the collision avoidance safety warning distance model [14,15,16,17,18]. It involves specific metrics like TTC and driver reaction time in different conditions. Based on data statistics of dangerous driving scenarios, rear-end collisions account for about 30% of all collision accidents [14], and emergency braking of the preceding vehicle is the main cause of such accidents. Therefore, most researchers focus on the high-risk scenario of emergency braking. The driver’s reaction time is directly related to the braking distance in the emergency braking scenario [15]. Based on the driver reaction model, the safety following distance is one of the safety thresholds that can be solved from the maximum braking distance [19]. However, the reaction of drivers is significantly correlated with driving experience, environmental complexity, and traffic density; thus, it is difficult to use the generic driving model to achieve the safety thresholds of traffic regulations.
Recently, some researchers have attempted to conduct driving behavior analysis studies based on natural driving data. Natural driving data form a dataset obtained by collecting all real-world driving data within a specified area [20], which can include various driving scenarios such as urban roads, rural roads, and highways. They have been widely used to study the impact of different elements of human–vehicle–road–environment on driving safety [21]. This includes extracting near-collision scenes from natural driving data through kinematic indicators, studying the relationship between different scene elements and collision accident causes, and considering the correlation between driving behavior and driving safety under different traffic flow influences [22,23]. Research to identify aggressive driving behavior is based on the analysis of acceleration indicators for car-following scenarios on highways [24]. By incorporating driving performance measures such as curve behavior, researchers can further refine the compliance thresholds, providing a more comprehensive framework for analyzing driver behaviors [16]. This includes studying the classification framework of driving behavior, proposing the utility of the abnormal driving index and its correlation with the headway, and using it to develop driver safety guidelines [25]. In summary, research based on natural driving data can obtain driving behavior characteristics under different operational conditions. Thus, these data are more suitable for the study of safety thresholds for ambiguous traffic rules, but related research work is still relatively scarce. This study uniquely contributes to the field by establishing these thresholds using large-scale, natural driving data, providing critical insights for both traffic regulation and autonomous vehicle compliance frameworks.
Considering the current state of research, the diversity and complexity of data, variations in driving behavior across different traffic flows, the challenges in quantifying emergency braking actions, the difficulties associated with processing large datasets, and the variability in traffic environments all contribute to the challenges of establishing a unified and flexible assessment standard. Especially in traffic congestion, drivers are more likely to engage in aggressive driving behaviors such as emergency brakes and cut-ins. Studies have shown that such aggressive driving behavior can lead to a six-fold increase in accident rates compared to normal conditions. In addition, traffic congestion causes large fluctuations in vehicle speed and frequent changes in following distance, as well as longer reaction times for drivers [26,27,28,29]. This study processes natural driving data of a congested highway to develop fuzzy compliance thresholds of slightly congested traffic conditions. By transforming ambiguous regulations into quantifiable parameters, this research not only advances traffic safety but also supports the functional safety certification of autonomous vehicles, making significant contributions to the development of next-generation driving standards.
2. Materials and Methods
2.1. Natural Driving Dataset
To investigate emergency braking behaviors of vehicles on high-speed roadways, this study utilizes data from the Aerial Dataset for China Congested Highway and Expressway (AD4CHE), published through a collaboration between DJI Automotive and Jilin University. This dataset was collected using drone image static target information acquisition technology, including 5.12 h aerial survey data from four different cities in China, with a total driving distance of 6540.7 km [29]. By incorporating geo-referenced data, the AD4CHE dataset provides an accurate spatial–temporal representation of traffic flow, making it highly representative of congestion scenarios typical of Chinese highways and expressways. It distinguishes between overlap and non-overlap cut-in scenarios, facilitating a detailed analysis of driver behaviors, including evasive maneuvers and preferred following distances in challenging traffic situations. These features make the AD4CHE dataset a valuable resource for understanding real-world traffic patterns and developing Traffic Jam Pilot (TJP) systems tailored to the unique characteristics of Chinese traffic conditions.
2.2. Natural Driving Data Filtering
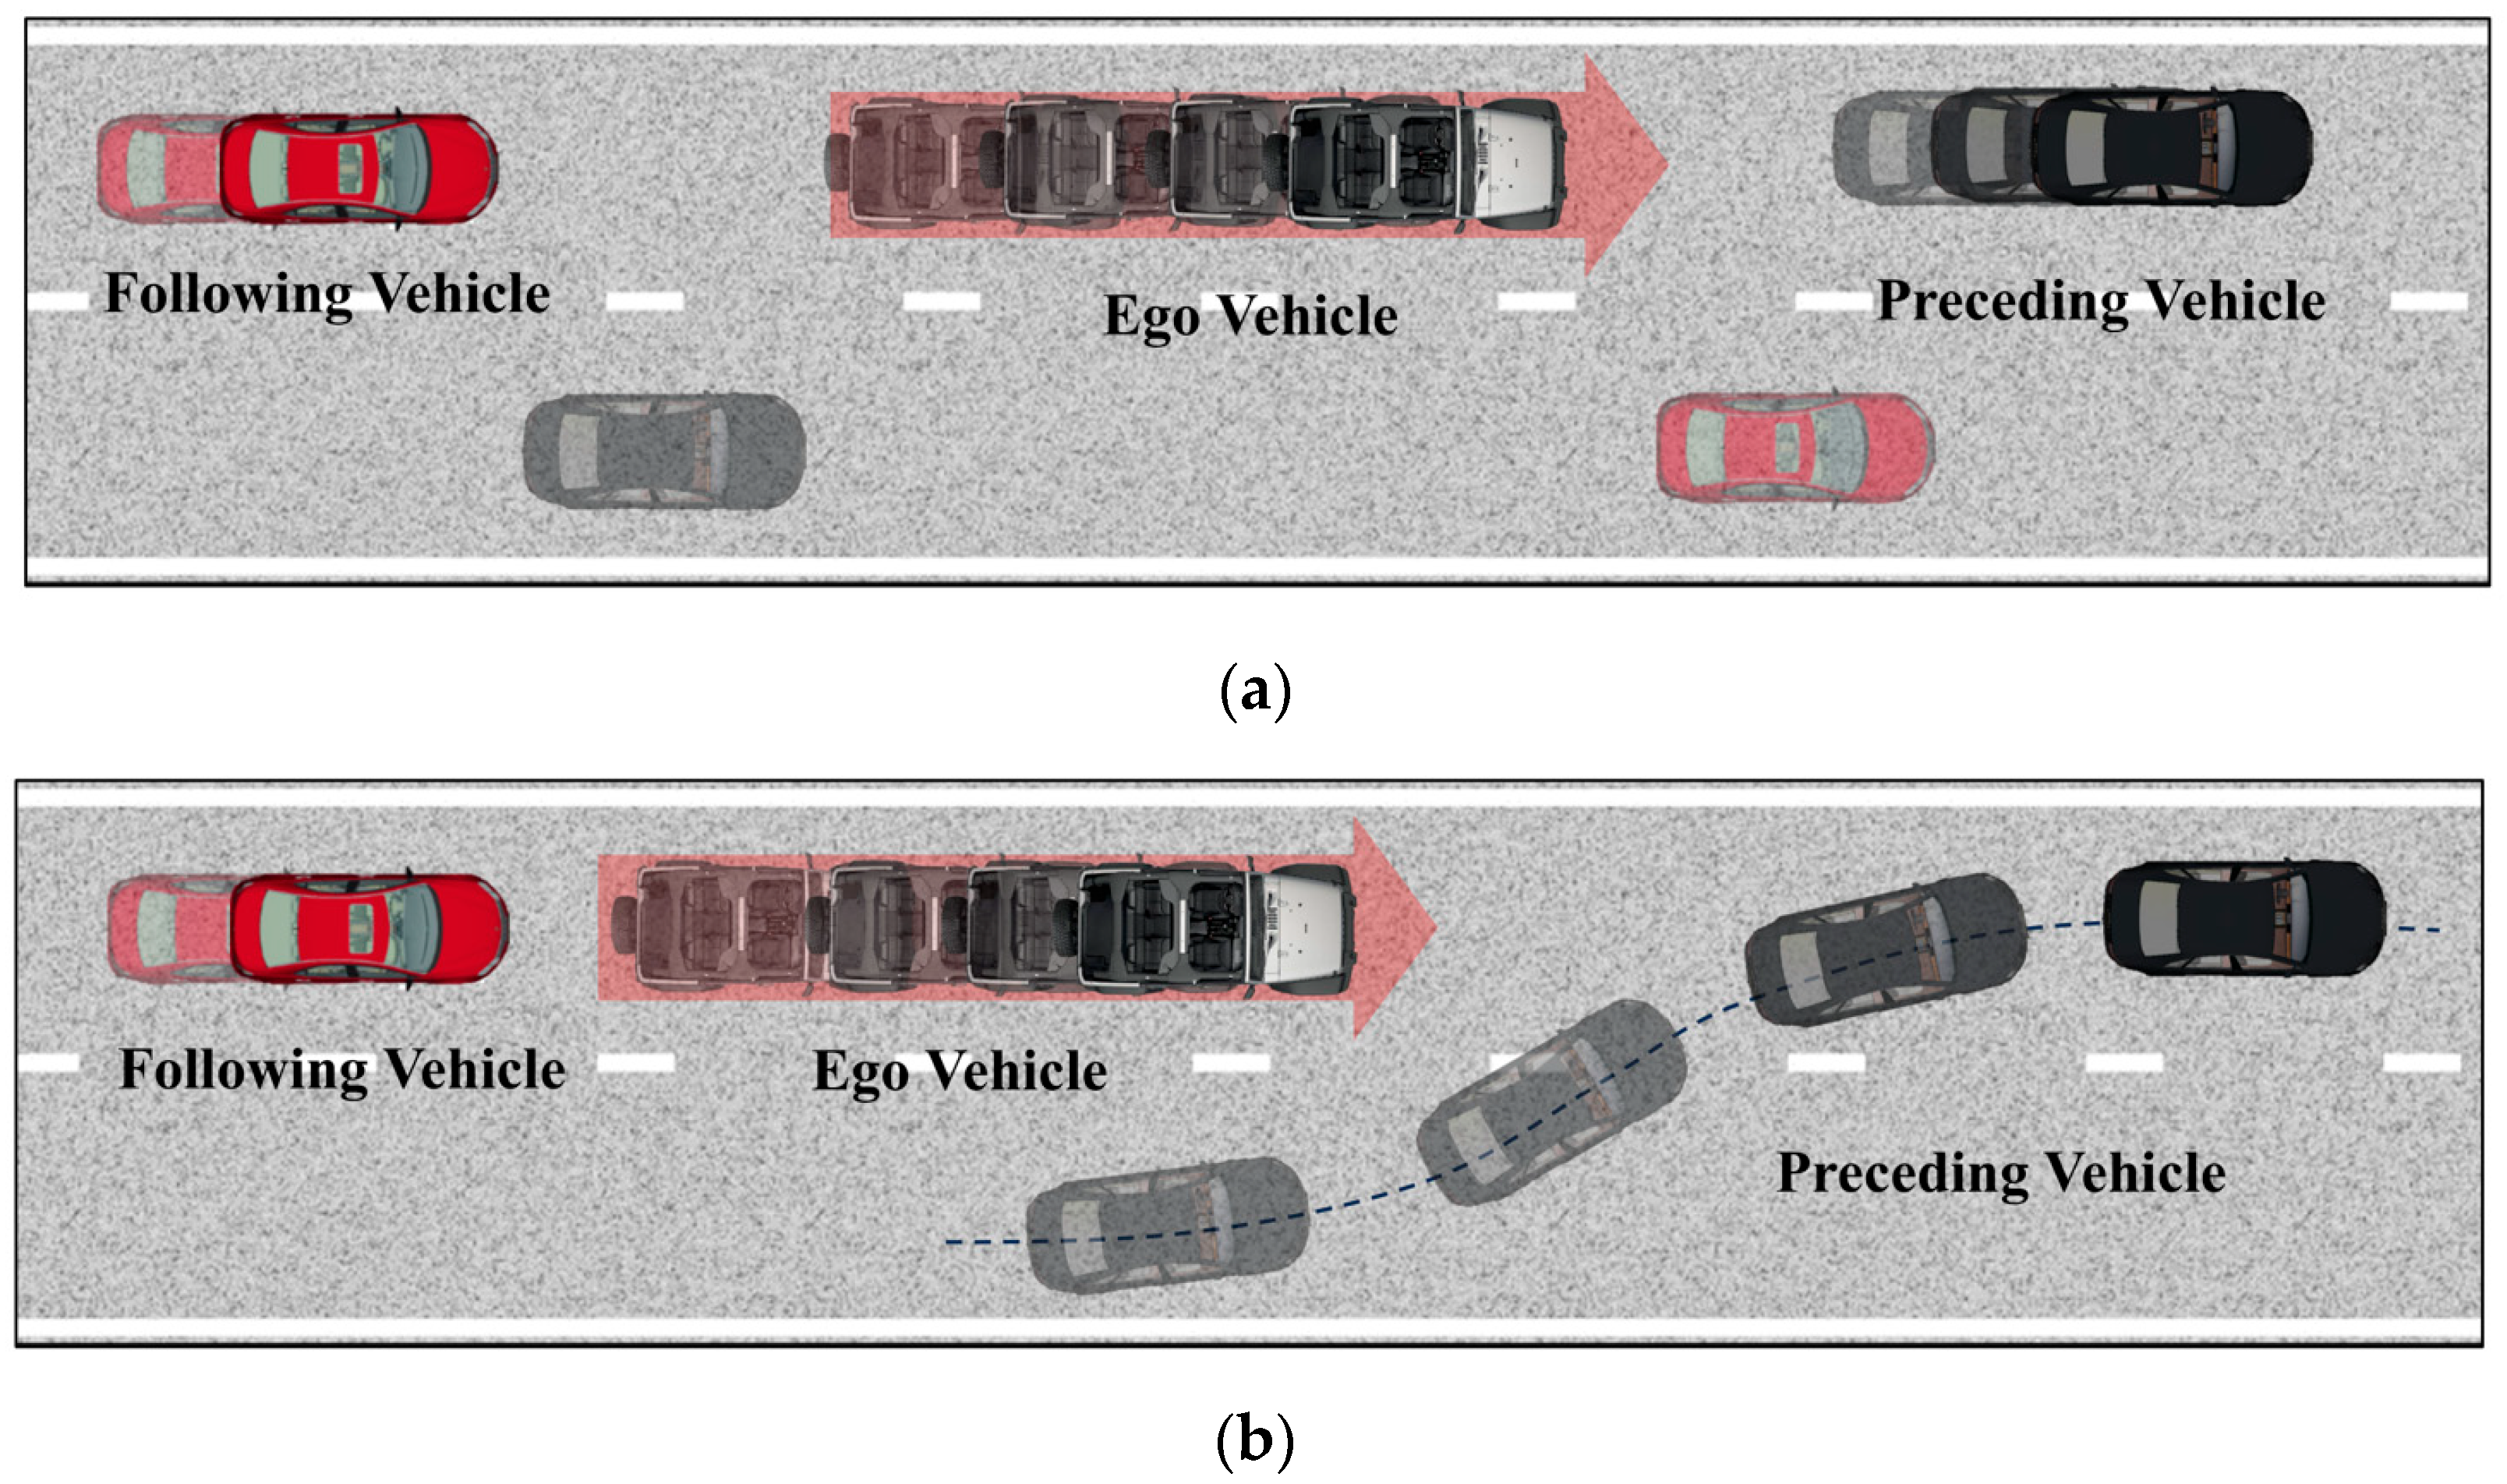
The study of emergency braking behavior in this paper primarily adopts the perspective of the ego vehicle (the vehicle executing the emergency stop). By acquiring positional data, speed, acceleration, and other information of the preceding and following vehicles in the same lane, this analysis investigates the behaviors of the preceding vehicle that lead to the ego vehicle’s emergency braking, as well as the impact of the ego vehicle’s emergency stop on the following vehicle, as illustrated in Figure 1.

Figure 1.
Schematic diagram of the driving relationships among the ego vehicle, preceding vehicle, and following vehicle. (a) Emergency braking scenarios of preceding vehicles. (b) Lane-changing scenarios of preceding vehicles.
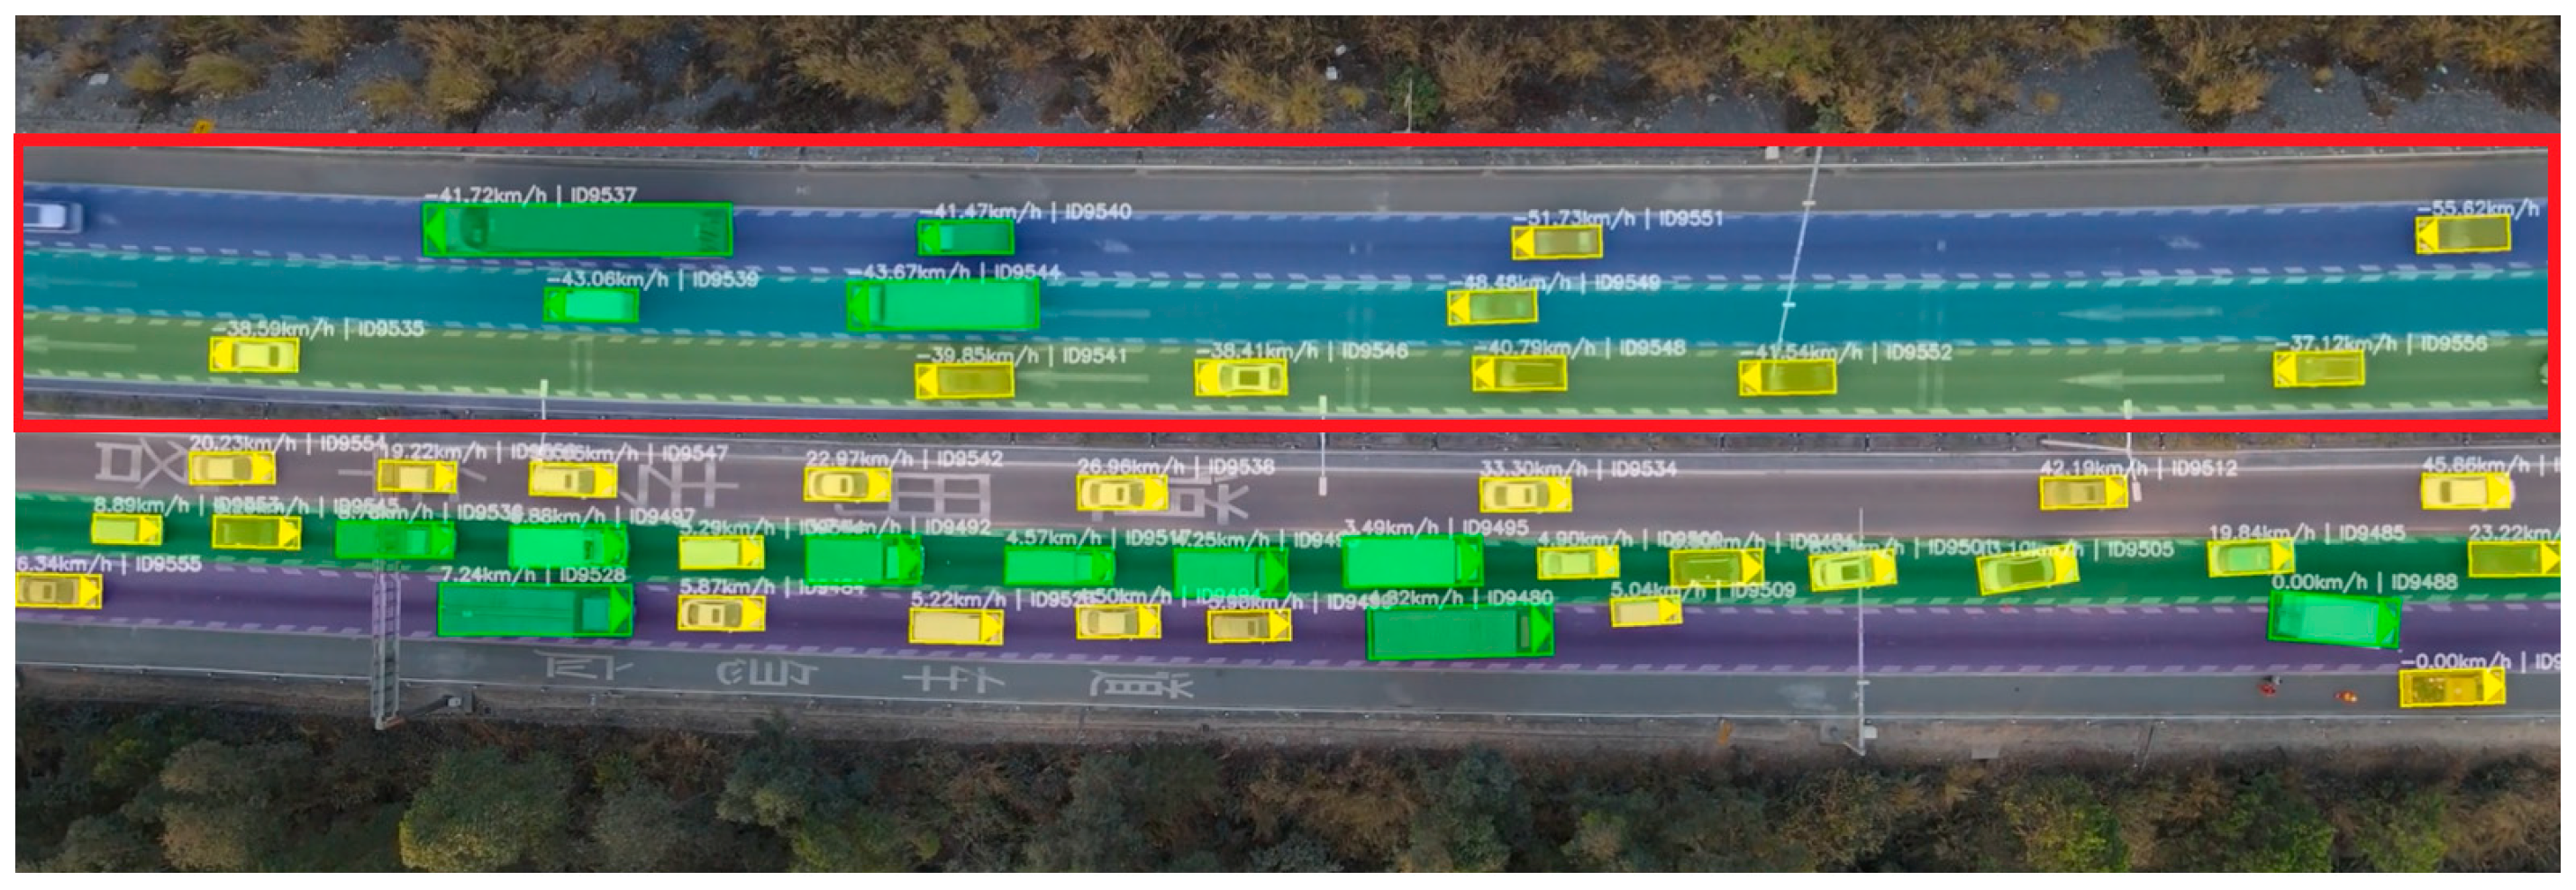
Before conducting the emergency braking analysis, certain conditions and thresholds must be established to reasonably clean the extensive natural driving dataset and filter out segments of emergency braking data that meet the specified criteria. The AD4CHE dataset is the congestion scenario dataset, which shows significant variability in the congestion level in different traffic flow directions (Figure 2). Considering the influence of traffic congestion on road safety and driving behavior characteristics, this paper selects the traffic flow data of slight congestion, which has the same direction of the traffic flow as the red box in Figure 2, as the basic research data. The traffic flow in slightly congested scenarios retains a certain level of dynamism and variability, providing a richer set of events for analyzing driving behavior characteristics. In contrast, driving behavior events such as emergency braking and cut-in occur significantly less frequently in heavy congestion scenarios, making it difficult to carry out further data processing and analysis. Therefore, the first step was to conduct an initial screening of the dataset, taking into account the congestion level. By analyzing the distribution of various data points in the dataset and combining them with historical.
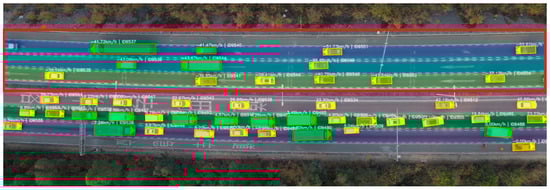
Figure 2.
Top view of the AD4CHE dataset.
Driving experience, the following extraction criteria for emergency braking operations were developed: (a) The initial longitudinal speed of the ego vehicle must exceed 5 m/s prior to emergency braking and must remain in motion throughout the entire process, reflecting typical speeds under slight congestion on high-speed roadways. (b) The deceleration of the ego vehicle must remain below −2 m/s2 for a continuous duration of 15 frames, indicating that the deceleration level must be sustained for at least 0.5 s (with a video frame rate of 30 frames/s). (c) The ego vehicle must be traveling in the main lanes, numbered from 1 to 9, while ignoring vehicles on ramps or auxiliary roads.
These criteria allow for the filtering of all emergency braking behavior segments of the ego vehicle in the natural driving dataset. However, these segments may not necessarily include data for preceding or following vehicles in the same lane. Therefore, additional conditions are required to ensure that the behaviors of the preceding and following vehicles can be effectively analyzed in the context of the ego vehicle’s emergency braking. This process clarifies the specific responses of the preceding and following vehicles under emergency braking conditions. The additional conditions are as follows: (a) The presence of a preceding vehicle ID. In the filtered emergency braking data segments, the preceding vehicle IDs (precedeIds) should not all be 0. If the preceding vehicle IDs are all 0, it indicates that there are no vehicles in front of the ego vehicle in the same lane during the emergency stop. (b) The presence of a following vehicle ID. In the filtered emergency braking data segments, the following vehicle IDs (followingIds) should not all be 0. If the following vehicle IDs are all 0, it indicates that there are no vehicles behind the ego vehicle in the same lane during the emergency stop.
These filtering conditions are designed to isolate pure emergency braking scenarios, which helps ensure that the data used for subsequent statistical analysis and summaries accurately reflects genuine braking behaviors under highway conditions. In addition, these two conditions do not need to be simultaneously satisfied; meeting either condition is sufficient for analyzing the behavior of preceding or following vehicles in the context of the ego vehicle’s emergency braking scenario. After applying these filtering conditions, a total of 3211 segments containing preceding vehicles and 222 segments containing following vehicles were identified from 53,761 trajectories. This represents a reduction of approximately 94.02% and 99.59% of the initial dataset for the preceding and following vehicle scenarios, respectively. This filtering result provided a critical data foundation for subsequent analysis.
3. Results and Discussion
3.1. Analysis of Preceding Vehicle Behavior
This subsection aims to quantitatively analyze the impact of preceding vehicle behavior on the emergency braking of the ego vehicle and to establish safe thresholds for avoiding emergency braking at different speeds. Unlike the theoretical thresholds provided by Mobileye’s RSS (Responsibility-Sensitive Safety) model [18], which are designed to ensure the most conservative safety margins, the thresholds proposed in this study are derived from naturalistic driving data and represent more practical, data-driven values. These values provide a balance between safety and real-world driving behavior, offering an alternative perspective to overly conservative models.
First, the reasons for the ego vehicle’s emergency braking were examined. Based on the 3211 data segments extracted in Section 2 that meet the criteria, the causes of emergency braking can be categorized into two types: (a) a significant reduction in the speed of the preceding vehicle within a short time frame and (b) sudden lane incursions by vehicles from adjacent lanes. The results are presented in Table 1.

Table 1.
Causes of emergency braking in the ego vehicle.
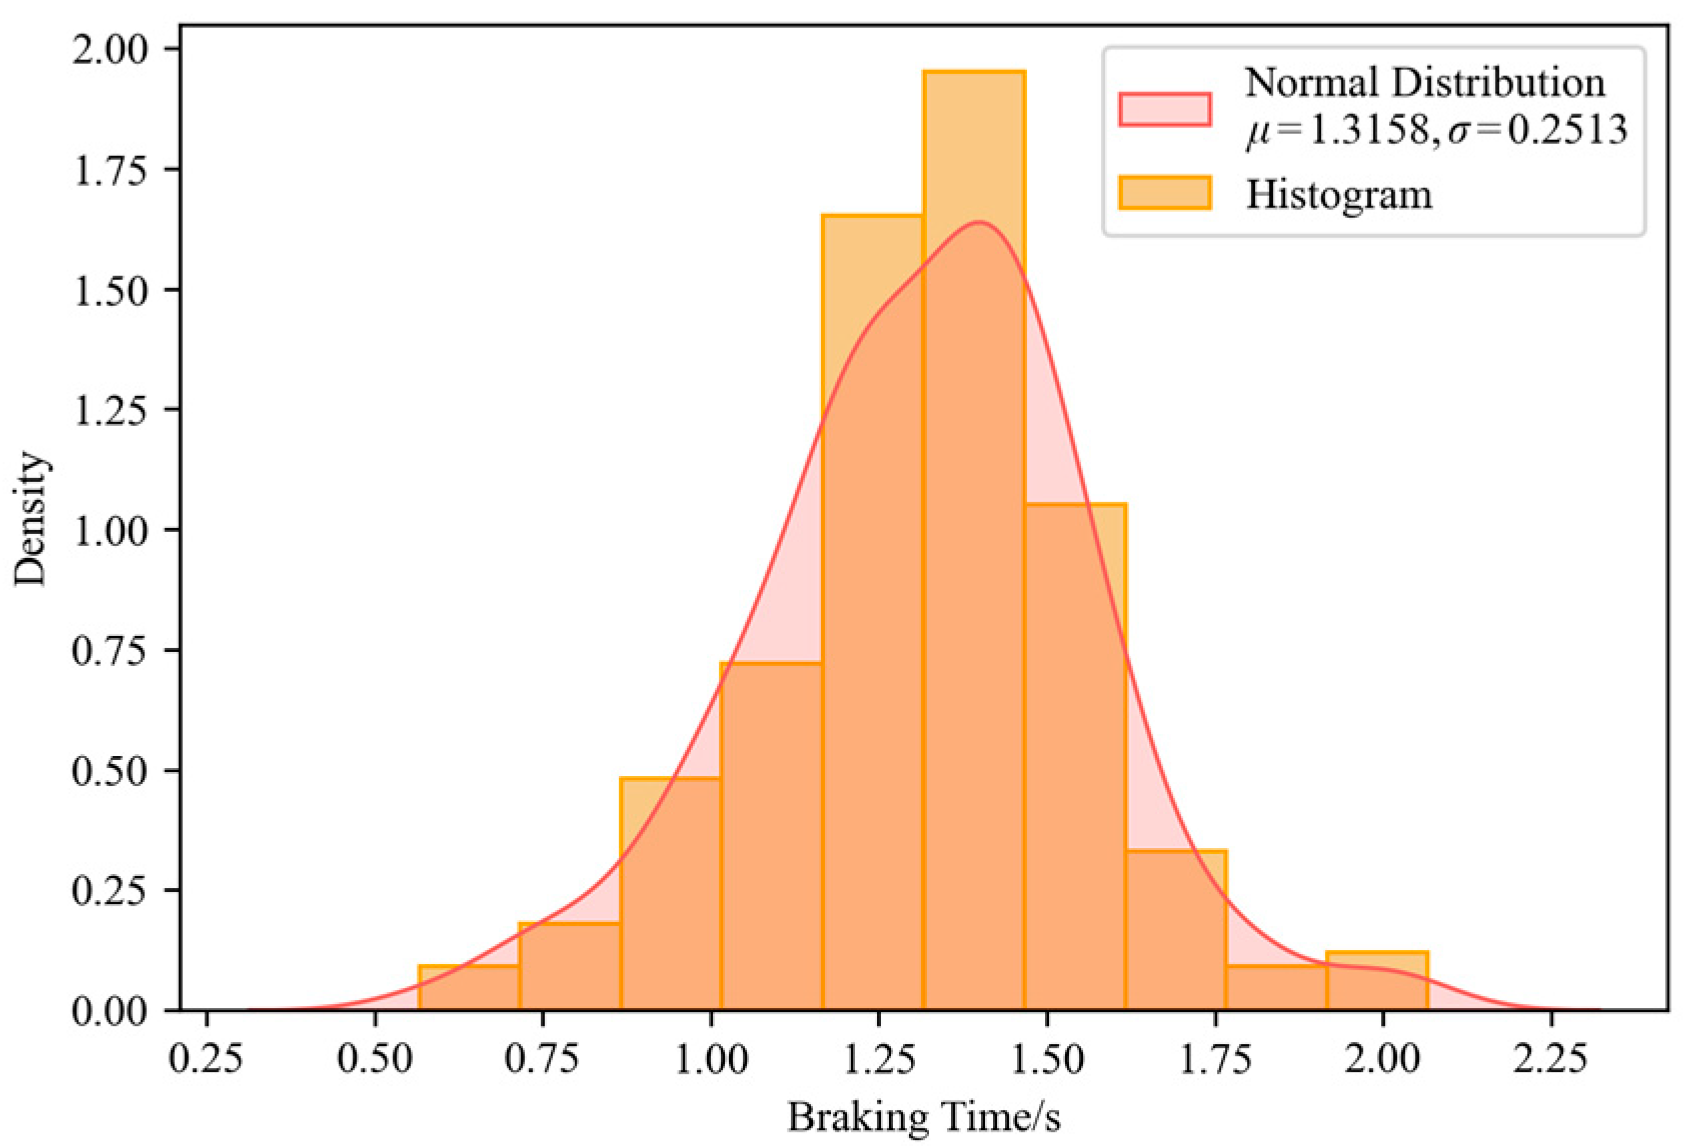
According to the data presented in the table, the brief reduction in the speed of the preceding vehicle is the primary cause of emergency braking in the ego vehicle, accounting for as much as 91.72%. The remaining 8.28% of the emergency braking scenarios are primarily triggered by lane changes of vehicles from adjacent lanes, indicating that drivers perceive potential collision risks to maintain a safe following distance, prompting them to execute emergency braking. During the emergency braking of the ego vehicle, the braking duration reflects the persistence of the hazardous situation. This study calculates the distribution of braking times based on the duration of each data segment, as illustrated in Figure 3.

Figure 3.
Distribution of emergency braking duration for the ego vehicle.
This graph illustrates the distribution of emergency braking times for the ego vehicle, showing that the distribution conforms to a normal distribution with a mean of 1.3158 s and a standard deviation of 0.2513 s, with a fitting correlation coefficient of 0.75. According to the 3 principle of the normal distribution, approximately 99.74% of drivers will not take longer than 2.06 s to execute an emergency stop on high-speed roadways, as indicated by the two dashed lines in the graph. This finding further indicates that emergencies typically resolve within 2 s, after which drivers no longer respond to their surroundings with significant deceleration.
The analysis thus far has primarily focused on qualitatively exploring the relationship between the driving state of the preceding vehicle and the emergency braking actions of the ego vehicle. However, quantifying the criteria for emergency braking is more critical in the study of natural driving data. Generally, drivers assess the level of danger by perceiving the relative motion between their vehicle and the preceding vehicle, which ultimately informs their decision to execute an emergency stop. In this context, TTC, a physical quantity that describes the relative speed and distance between the two vehicles, serves as an effective indicator for quantifying the moments triggering the emergency braking behavior of the ego vehicle. When TTC is positive, it means that there is no risk of collision between the ego vehicle and the preceding vehicle; on the contrary, when TTC is negative, it means that there is a risk of collision between the ego vehicle and the preceding vehicle.
In a following state, the TTC between the ego vehicle and the preceding vehicle approaches negative infinity, indicating relative safety. However, when the preceding vehicle begins to brake or decelerate, the TTC value gradually increases, signaling potential danger to the driver. In emergency situations, such as sudden braking by the preceding vehicle or lane incursions by adjacent vehicles, the TTC value rapidly increases and approaches zero, necessitating immediate action from the ego vehicle to avoid a collision. These quantifiable metrics enable a more effective understanding of the emergency braking responses of the ego vehicle under varying circumstances.
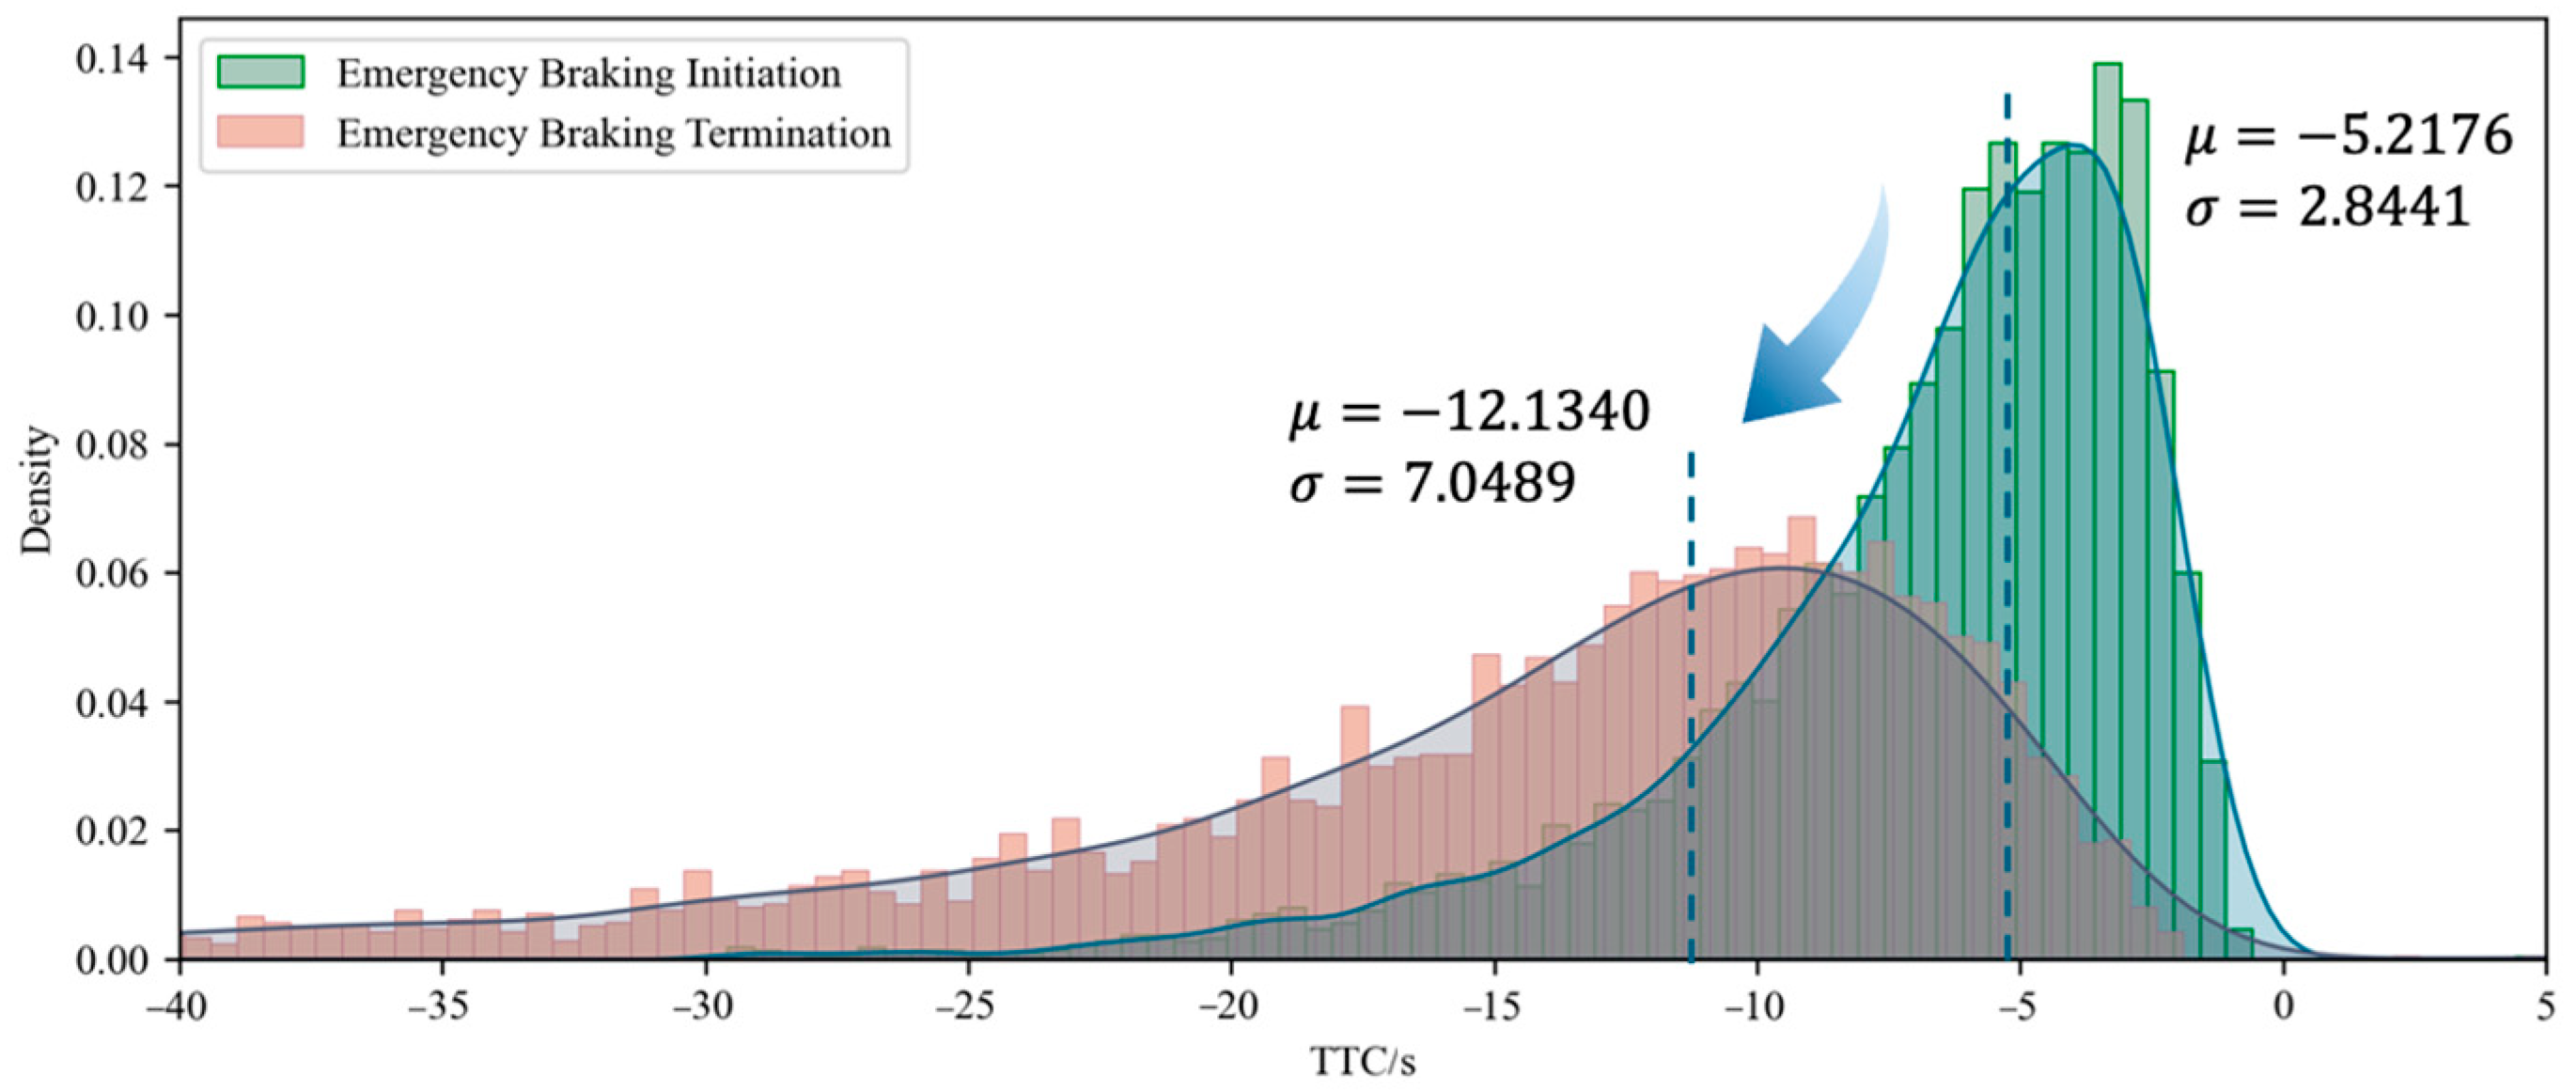
Building on the analysis above, this study calculated the TTC values of the ego vehicle relative to the preceding vehicle at both the start and end of each identified emergency braking scenario. To this end, six distribution types were selected for the K-S test, including the normal distribution, standard normal distribution, t-distribution, Laplace distribution, Gamma distribution, and Chi-square distribution. The results of the tests indicate that the log-normal distribution provides the best fit for the TTC distribution at both the start and end moments of emergency braking, with p-values significantly greater than 0.05. This suggests that there is over 95% confidence that both distributions follow a log-normal distribution, as illustrated in Figure 4.
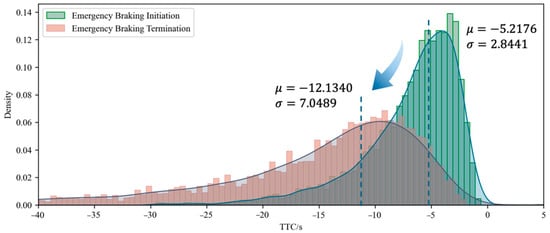
Figure 4.
Changes in the TTC distribution at the initiation and termination of emergency braking for the ego vehicle.
From the figure, it can be observed that the mean of the TTC distribution at the onset of emergency braking is −5.2176 s, with a standard deviation of 2.8441 s. This indicates that the TTC values are relatively concentrated, exhibiting a small standard deviation, which reflects a consistent braking response. This suggests that drivers promptly initiate braking measures upon perceiving potential collision risks. Conversely, the mean TTC distribution at the end of emergency braking is lower at −12.1340 s, with a standard deviation of 7.0489 s, implying that the vehicle is further away from a collision at the conclusion of the braking event compared to the start. The larger standard deviation in this instance may result from varying deceleration rates during the braking process and external influences, such as road conditions and the behavior of other vehicles. The shorter dashed line on the left represents the mean position of the TTC distribution at the end of the emergency braking, while the longer dashed line on the right indicates the mean position at the onset of the emergency braking. The arrow illustrates the trend in the TTC distribution’s evolution from the initiation to the conclusion of the emergency braking. Both TTC distributions display a certain degree of skewness, with the TTC distribution at the end of emergency braking being more dispersed, indicating a relatively lower collision risk after braking has concluded.
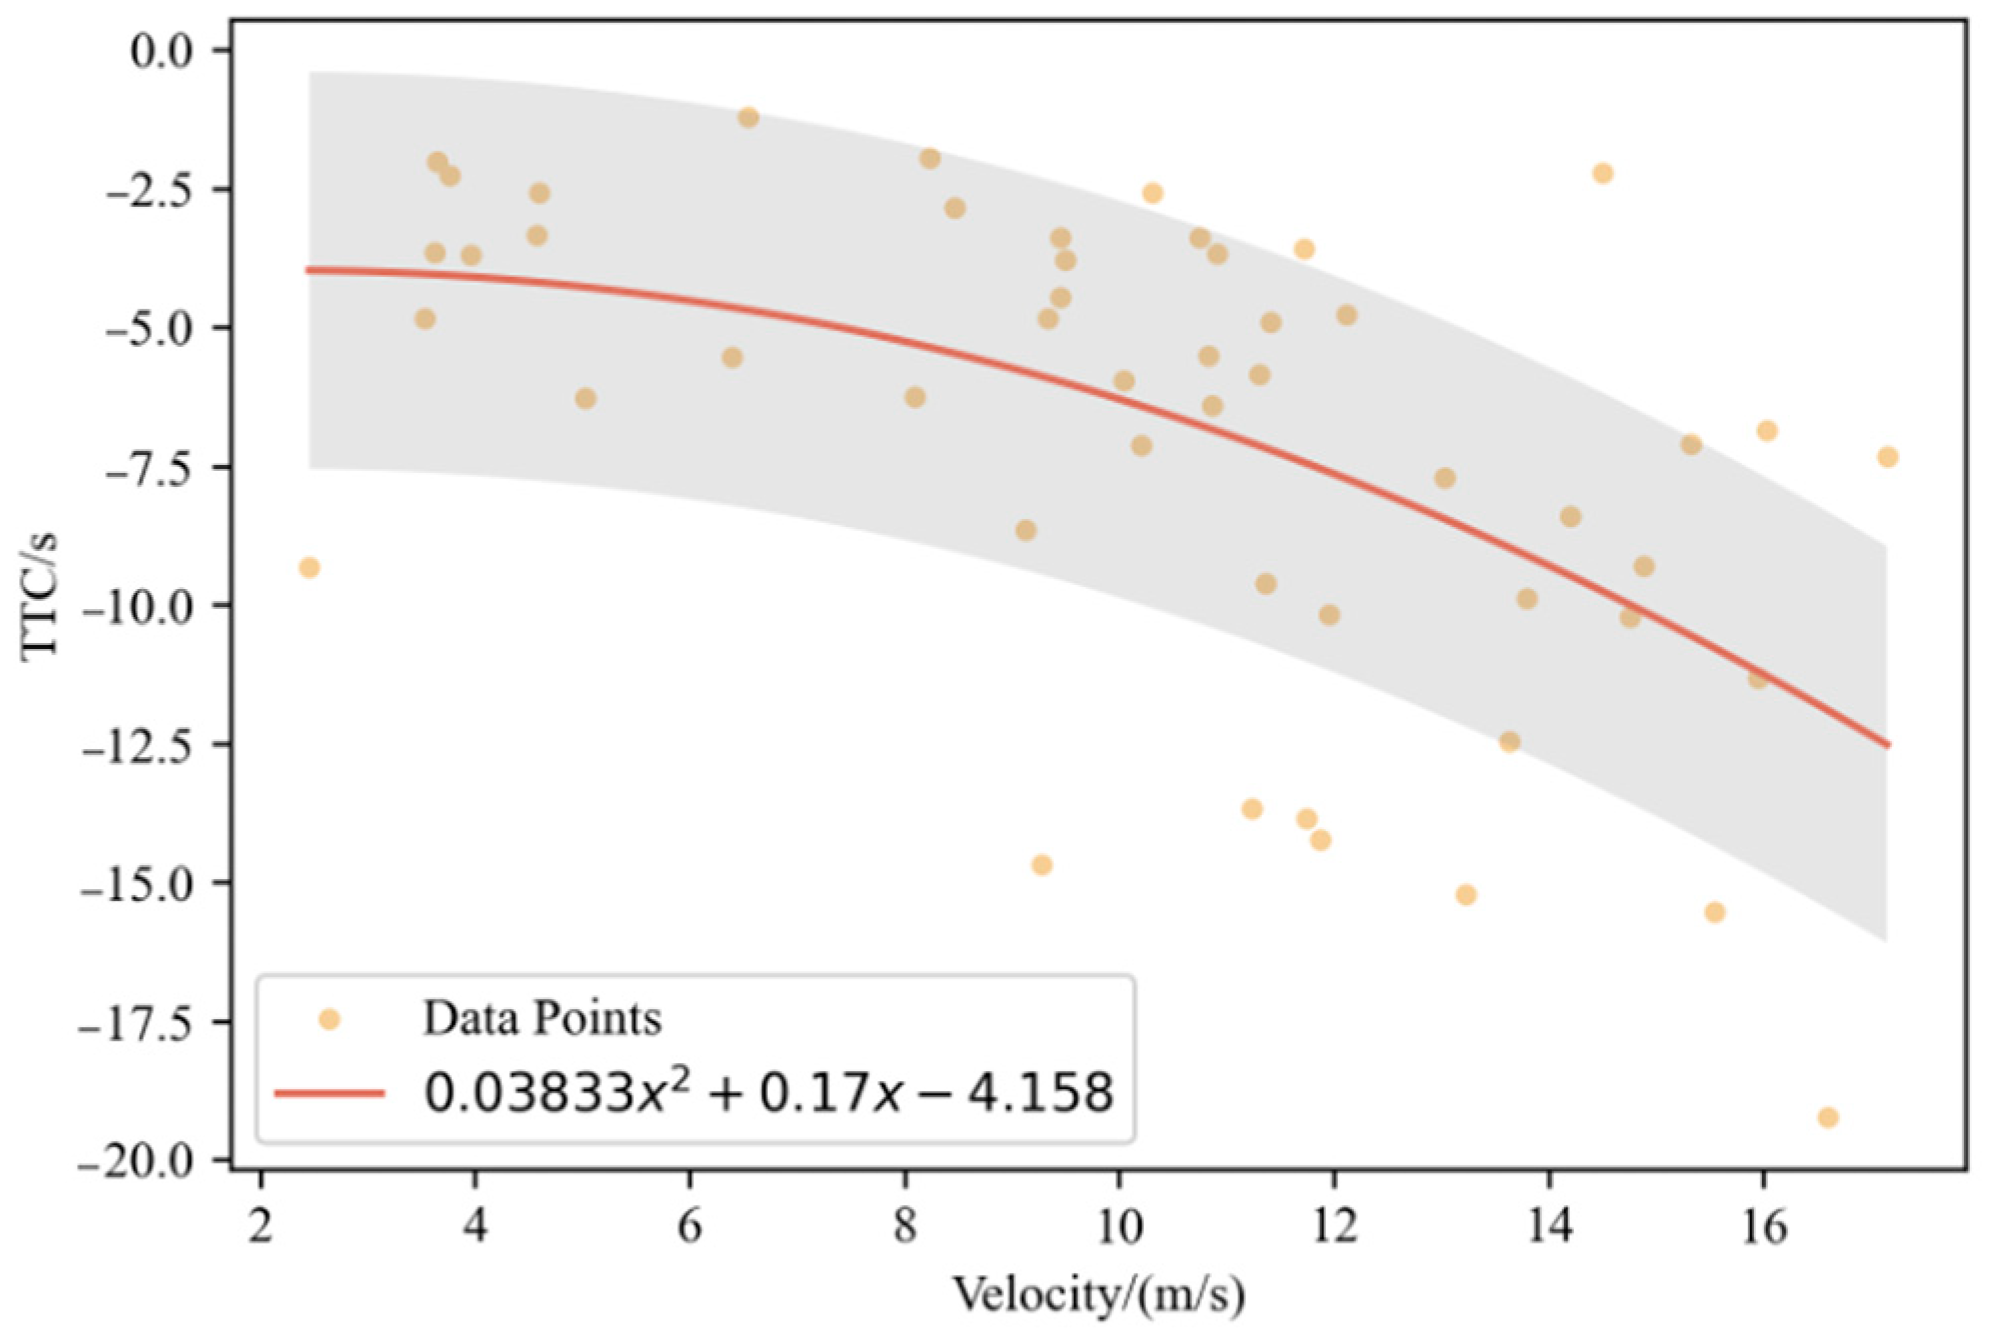
To further derive the TTC threshold for the ego vehicle’s initiation of emergency braking at different speeds from the extracted data, this study randomly sampled 50 data points and conducted polynomial curve fitting for the onset of emergency braking. This fitted curve is significant as it predicts the TTC threshold that triggers emergency braking at various speeds. The sampled points and the fitted polynomial curve are illustrated in Figure 5.
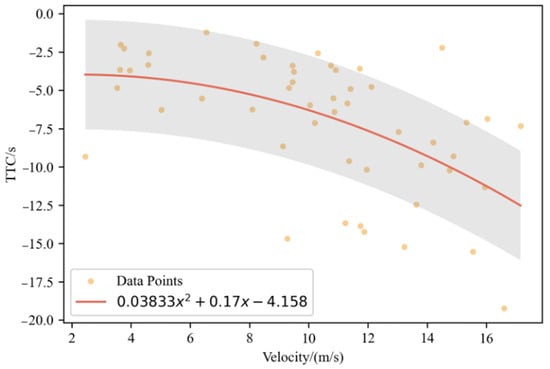
Figure 5.
TTC thresholds for drivers triggering emergency braking at different speeds.
The red curve in the figure represents the predictive curve obtained through regression of the yellow data points, expressed as:
where denotes the longitudinal speed of the ego vehicle. It can be observed from the figure that as speed increases, the TTC values gradually move away from zero, indicating that at higher speeds, the collision time is shorter, thereby increasing the risk. Consequently, the perceived need for a safe following distance from the preceding vehicle also rises. To ensure that the ego vehicle does not collide with the preceding vehicle, emergency braking must be initiated earlier at higher speeds compared to lower speeds. The grey band in the figure represents the range of acceptable results, determined based on the standard deviation of the residuals from the regression curve. This band provides a confidence region for the predictive curve, accounting for the variability in the data. Based on this curve, it is possible to predict TTC at different speeds under slightly congested conditions and infer the moment the vehicle begins to execute an emergency stop using the minimum TTC value. Thus, the TTC safety thresholds of traffic rules between the ego vehicle and the preceding vehicle at different speed intervals are obtained.
3.2. Analysis of Following Vehicle Behavior
This subsection primarily investigates the behavior of following vehicles in the same lane during the emergency braking of the ego vehicle, analyzing whether they are affected and identifying the thresholds that influence their behavior. Additionally, based on these thresholds, this study proposes the minimum following distance that a following vehicle must maintain while cruising at normal speed on high-speed roadways to avoid being impacted by the emergency braking of the ego vehicle.
Unlike the previous subsection, which utilized TTC as a quantitative metric to analyze the relationship between the ego vehicle and the preceding vehicle, this section employs relative speed and relative distance as the analytical basis. In contrast to the single-dimensional information provided by TTC, the two-dimensional data of relative distance and speed can reveal more underlying information, thereby offering a clearer depiction of the relative relationship between the two vehicles.
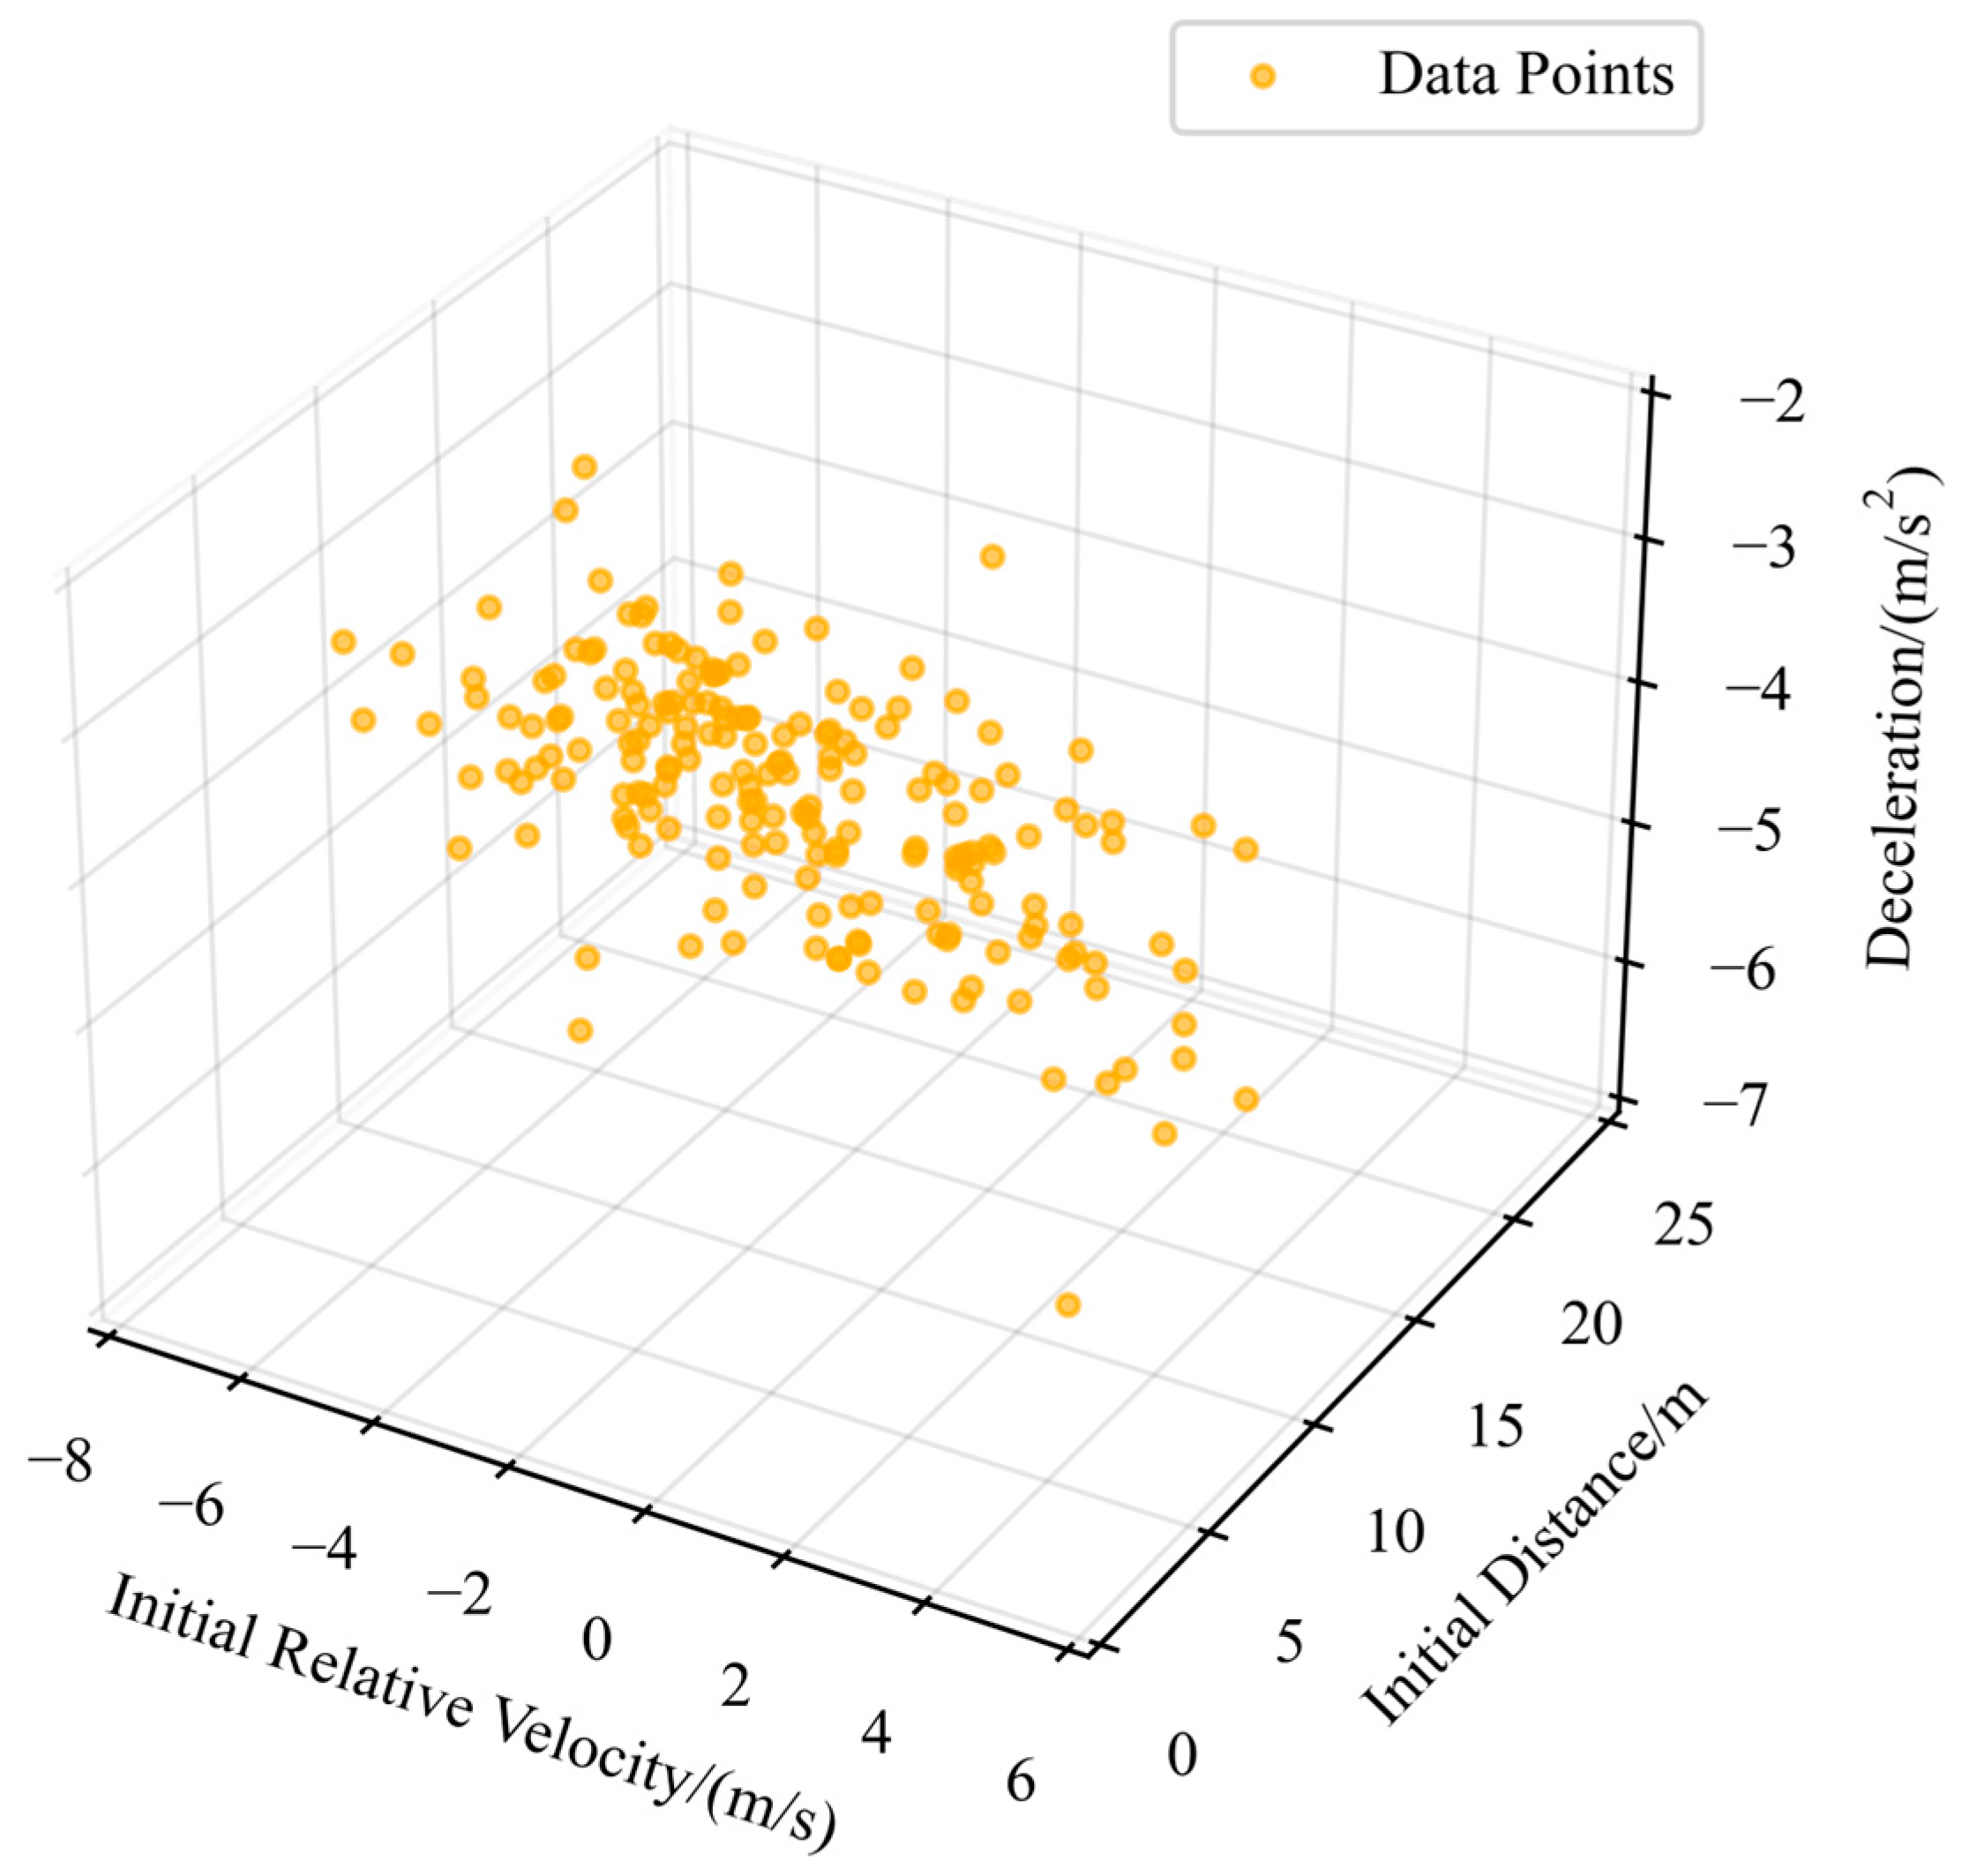
To explore this topic in depth, this study first visualized the selected emergency braking data segments that include following vehicles, presenting the distribution of their relative speed and relative distance at the onset of emergency braking, as shown in Figure 6.

Figure 6.
Visual distribution of emergency braking data segments with following vehicles based on initial relative speed and initial relative distance metrics.
From the scatter distribution, it can be observed that in slightly congested high-speed roadway scenarios, when the initial relative distance between the ego vehicle and the following vehicle exceeds 25 m or the initial relative speed exceeds 4 m/s, the emergency braking of the ego vehicle does not affect the following vehicle.
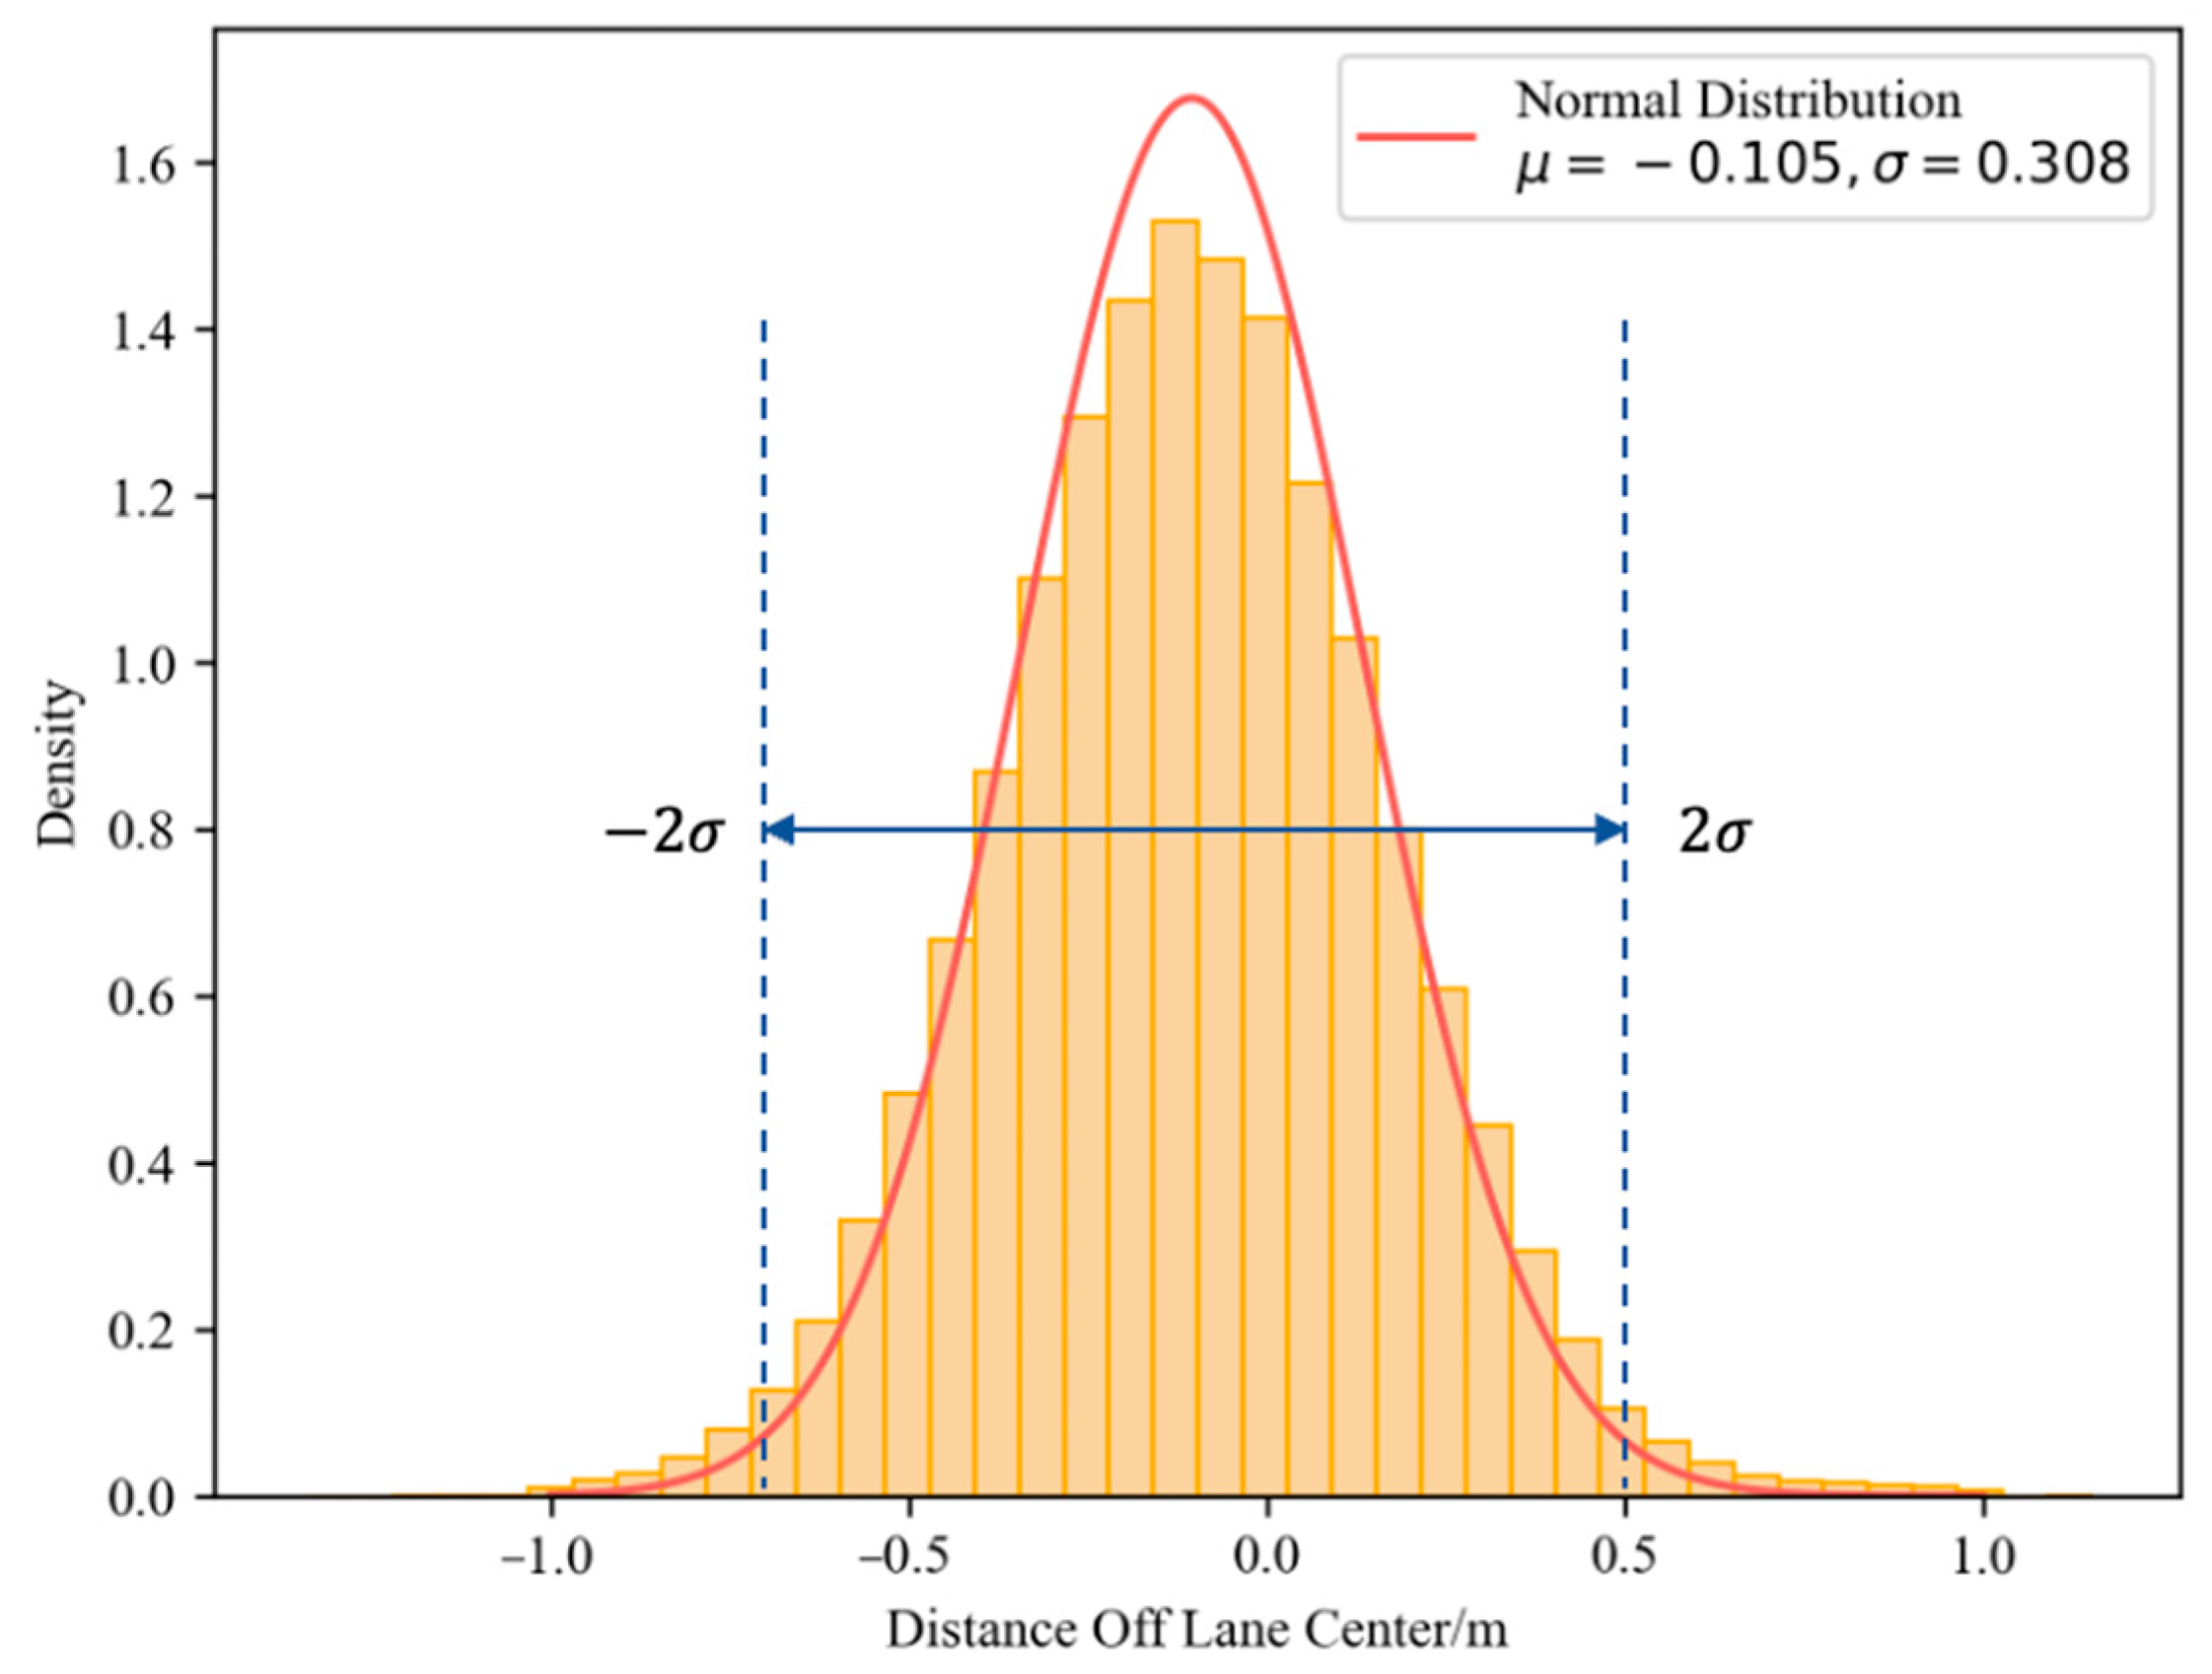
To more intuitively assess whether the emergency braking of the ego vehicle impacts the normal operation of the following vehicle, this study established three quantitative criteria, with the fulfillment of any one indicating a significant effect on the following vehicle: (a) If the longitudinal deceleration of the following vehicle is less than −1.25 m/s2, it indicates a notable impact. (b) If the lane ID of the following vehicle changes, suggesting that the following vehicle has opted to change lanes during the emergency braking of the ego vehicle, it indicates an interference with its normal operation. (c) If the lane ID remains unchanged but the following vehicle exhibits a significant deviation from the lane center, it is also considered to be affected by the ego vehicle.
As illustrated in Figure 7, most vehicles are positioned within the range of from the lane center, marked by the two dashed lines in the graph, which represent the range. Thus, following vehicles that exceed this offset can be considered as operating abnormally. The overall data exhibit a slight leftward bias from the zero point, primarily due to domestic traffic regulations that mandate right-side driving, which subconsciously encourages drivers to favor the right side of the lane.

Figure 7.
Distribution of distance off centerline while driving within the lane.
Based on the criteria, a total of 222 data segments involving following vehicles during the emergency braking of the ego vehicle were analyzed. Ultimately, 137 segments were identified in which the following vehicles were affected, while 85 segments were found where they were not affected. The distribution of behaviors exhibited by the affected following vehicles is presented in Table 2.
Table 2.
Distribution of factors affecting following vehicles.
From the data, it is evident that among the 137 affected following vehicles, 107 exhibited braking behavior, which included 17 instances where both braking and lane changing occurred, as well as 8 instances of both braking and deviation from the lane center. Additionally, there were 17 cases in which the following vehicles did not brake but chose to change lanes, and 13 instances where they did not brake but deviated from the lane center.
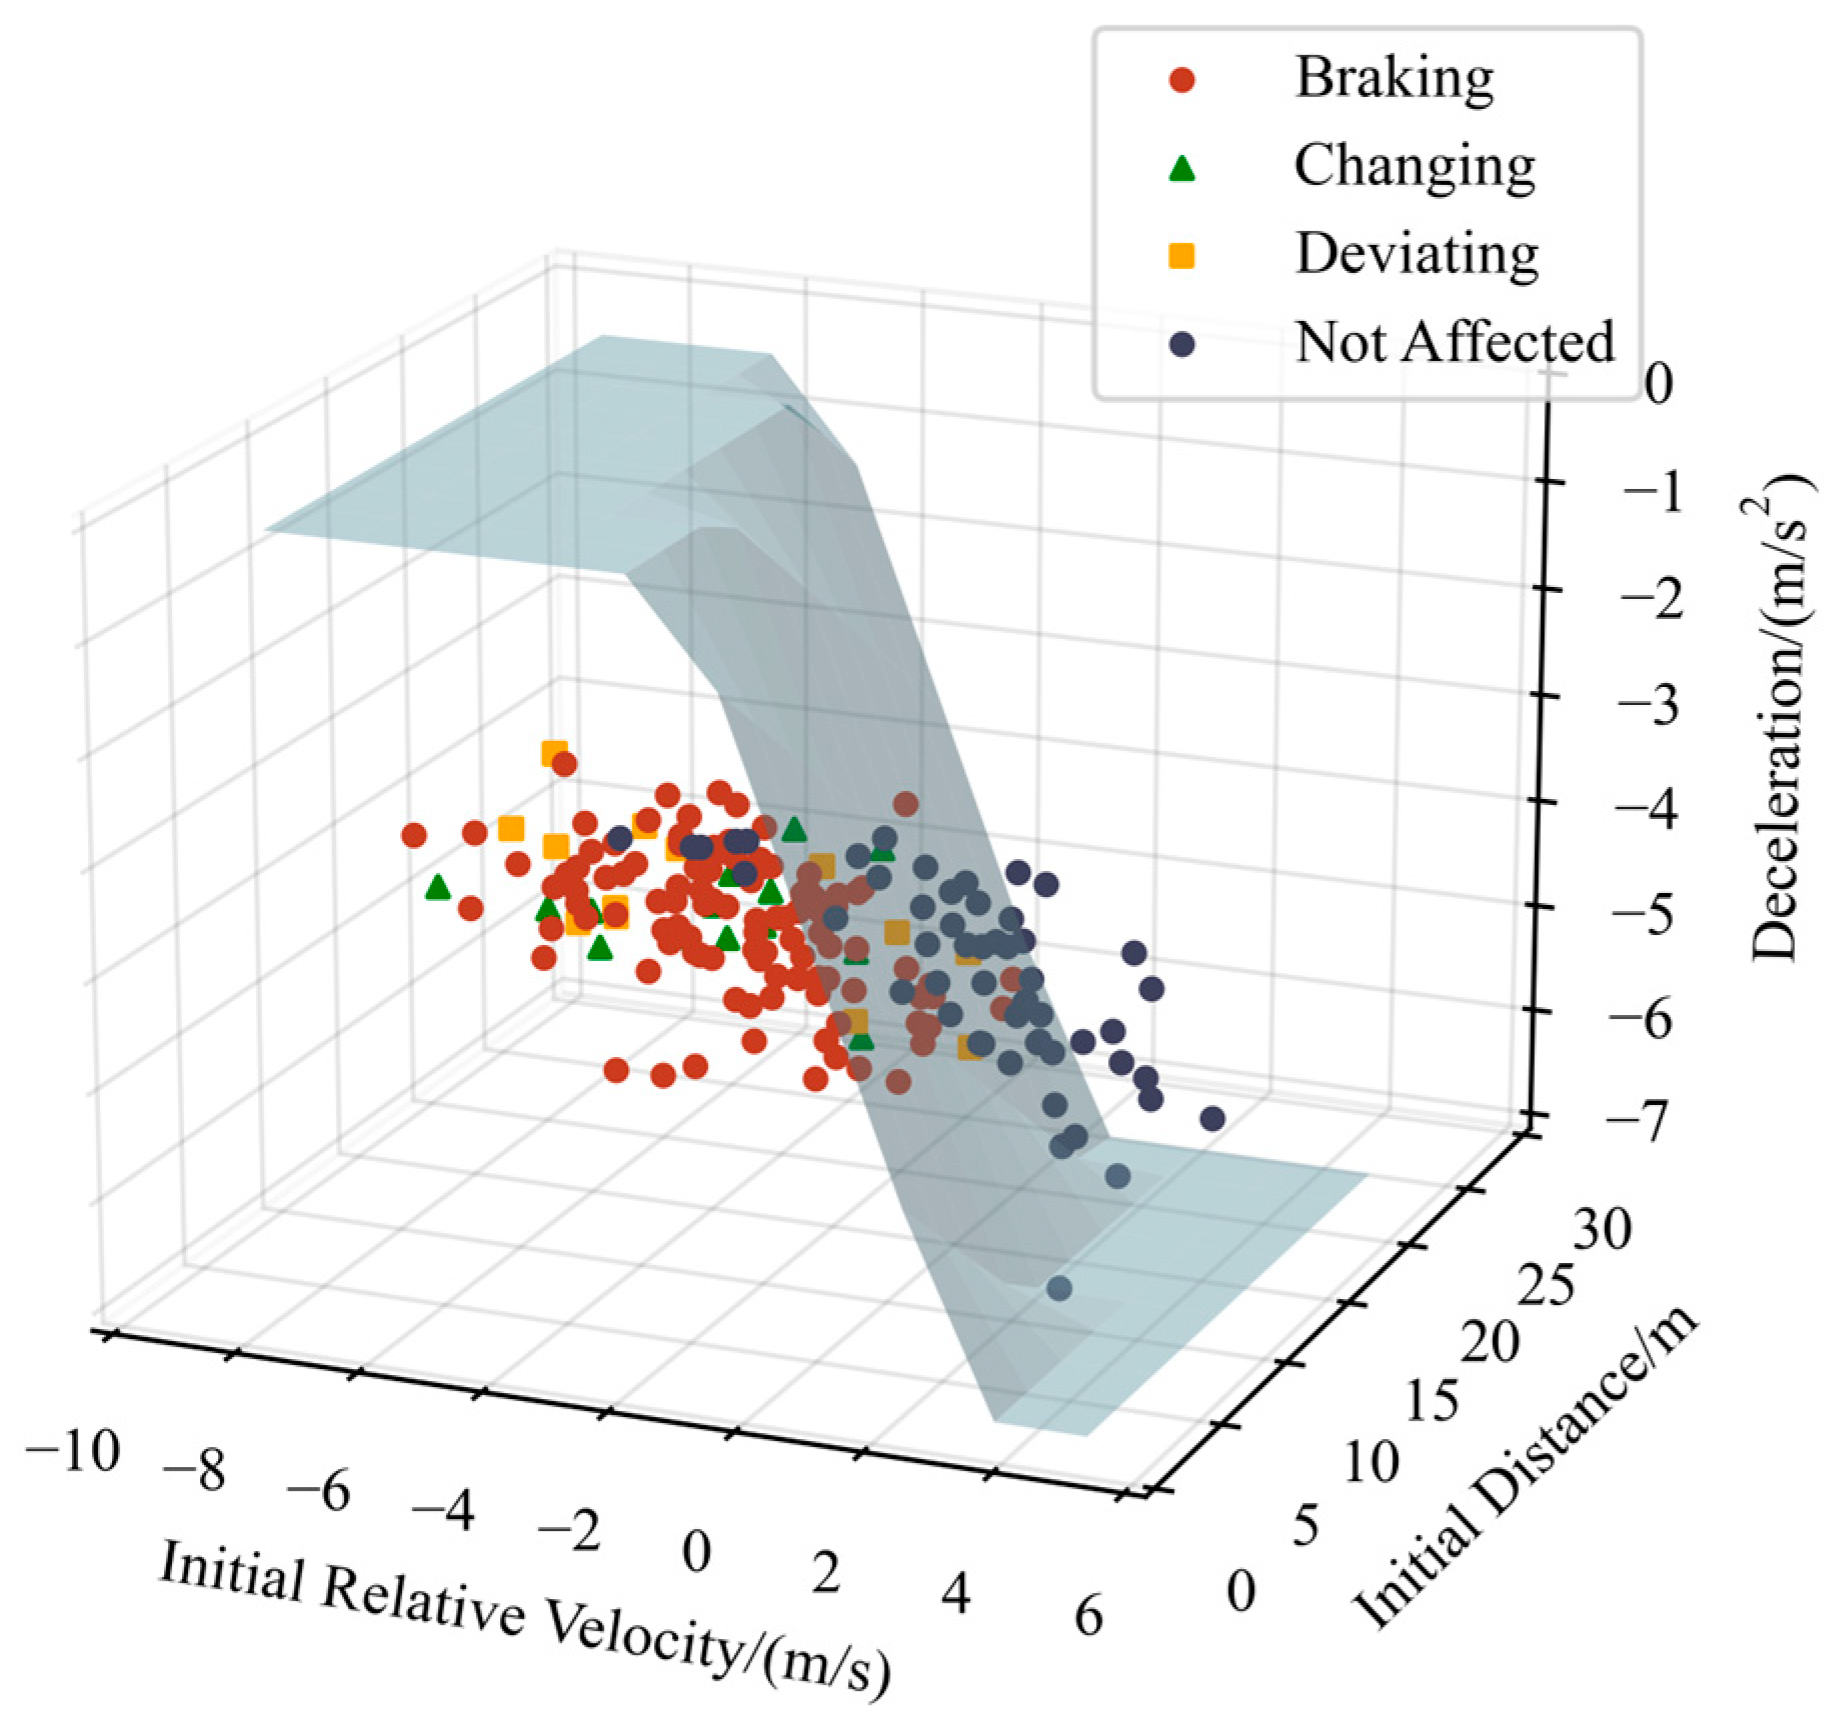
To determine the deceleration at which the ego vehicle can brake without affecting the normal operation of the following vehicle, considering their relative distance and relative speed, this study employed a Support Vector Machine (SVM) approach to calculate a distinguishing plane, as shown in Figure 8.

Figure 8.
Visualization of the impact on the following vehicle’s normal operation during emergency braking of the ego vehicle.
When the initial relative speed is greater than 0, indicating that the ego vehicle’s speed exceeds that of the following vehicle, or when the initial relative distance is substantial, the ego vehicle’s emergency braking will have minimal impact on the following vehicle’s normal operation. Conversely, the opposite scenario will significantly affect the following vehicle’s movement. The plane depicted in the figure serves to effectively separate the normal operating following vehicles from those that are affected, represented by the expression:
where represents the initial relative speed and signifies the initial relative distance. By substituting these two initial parameters into the formula, the deceleration threshold for the ego vehicle that will not disrupt the normal operation of the following vehicle can be obtained. Safety thresholds for deceleration under different operating conditions can be used to evaluate whether the braking behavior of the preceding vehicle complies with traffic rules.
4. Conclusions
This study analyzes the Natural Driving Dataset AD4CHE, extracting 3211 emergency braking data segments involving preceding vehicles and 222 segments involving following vehicles, thereby providing an in-depth examination of the driving behaviors of both vehicle types during emergency braking events. The TTC safety thresholds become larger as the speed increases, consistent with the TTC trend proposed by UN ECE R157 [30]. But if we define broader safety risk scenarios for traffic regulation quantification, the TTC safety thresholds obtained from the analysis will be larger. The results indicate that a sudden decrease in the speed of the preceding vehicle is the primary cause of emergency braking, with over 99% of such actions concluding within 2 s. Moreover, in slightly congested conditions on high-speed expressways, maintaining more than 25 m effectively mitigates the impact of emergency braking by the preceding vehicle.
Furthermore, the proposed TTC and deceleration thresholds offer valuable references for both enhancing the quantitative description of traffic rules and facilitating compliance analysis in slightly congested traffic conditions, contributing to a deeper understanding of emergency braking processes and their impacts on surrounding vehicles. These findings underscore the critical role of quantitative metrics, such as TTC and deceleration thresholds, in shaping broader frameworks for traffic safety and autonomous vehicle compliance. This study proposes a methodological framework for traffic rule safety threshold analysis based on natural driving datasets. According to traffic safety influencing factors such as traffic congestion, road characteristics, and vehicle types, different preprocessing methods are applied to the dataset. Based on the aforementioned methodological framework, the safety thresholds for traffic rules under various traffic scenarios can be analyzed. By establishing clear and actionable guidelines, this study contributes to the theoretical foundation for designing adaptive following distance algorithms in autonomous driving systems, enabling vehicles to dynamically adjust to diverse traffic scenarios.
In future studies, it is essential to expand the scope of analysis to include the influence of weather conditions, road characteristics, and traffic flow on emergency braking and obstacle avoidance. Based on the network fundamental diagram method of heterogeneous data fusion [31,32], complex traffic flow analysis will be carried out to further establish the correlation between different types of traffic conditions and traffic rule safety thresholds. This will provide a more comprehensive understanding of the dynamics of emergency braking and enhance the applicability of findings to real-world driving environments.
Author Contributions
Conceptualization, M.M.; data curation, M.M.; formal analysis, M.M.; funding acquisition, M.M. and T.W.; investigation, M.M.; methodology, W.W.; project administration, M.M. and T.W.; resources, T.W.; software, Z.M.; supervision, T.W.; validation, M.M.; visualization, M.M.; writing—original draft, M.M., W.W., Z.M., T.W. and G.Z.; writing—review and editing, T.W. and G.Z. All authors have read and agreed to the published version of the manuscript.
Funding
This study was supported by the Technology Research Program of MPS of China (2022JSZ16), the National Natural Science Foundation of China (No. 72474038, No. 72074034, No. 72134002, No. T2261129477), the National Key R&D Program of China (2022YFB2503005), the Key Projects of Philosophy and Social Sciences Research, Ministry of Education of China (No. 21JZD029), the Key Projects of Social Sciences and Planning Research of Chongqing (No. 2024CXZD23), the Chongqing Talents Program (No. CQYC202105082), and the Fundamental Research Funds for the Central Universities of China (No. 2024CDJSKPT02, No. 2022CDJSKPT31-01).
Data Availability Statement
Some or all data, models, or codes that support the findings of this study are available from the corresponding author upon reasonable request.
Acknowledgments
The authors are grateful to the editors and the anonymous reviewers for their insightful comments and suggestions.
Conflicts of Interest
The authors declare no conflicts of interest.
References
- WHO. Global Status Report on Road Safety 2023; WHO: Geneva, Switzerland, 2023. [Google Scholar]
- Wang, X.; Meng, L.-M.; Zhang, B.; Lu, J.; Du, K.-L. A Video-Based Traffic Violation Detection System. In Proceedings of the 2013 International Conference on Mechatronic Sciences, Electric Engineering and Computer (MEC), Shengyang, China, 20–22 December 2013; pp. 1191–1194. [Google Scholar]
- Şentaş, A.; Kul, S.; Sayar, A. Real-Time Traffic Rules Infringing Determination Over the Video Stream: Wrong Way and Clearway Violation Detection. In Proceedings of the 2019 International Artificial Intelligence and Data Processing Symposium (IDAP), Malatya, Turkey, 21–22 September 2019; pp. 1–4. [Google Scholar]
- Zubair, S.; Rothman, L.; Kuimi, B.B.; Macpherson, A.; Cloutier, M.-S.; Howard, A. 129 Effectiveness of Automated Speed Enforcement in Reducing Vehicle Speeds within School Community Safety Zones in Toronto, Canada. Inj. Prev. 2024, 30, A21. [Google Scholar] [CrossRef]
- Beijing Intelligent Vehicle Association Industry Innovation Center Road Test Report of Self-Driving Vehicles in Beijing. 2023. Available online: http://www.mzone.site/index.php/index/index/cid/2/sid/21.html (accessed on 30 October 2024).
- Shanghai Municipal Transportation Commission Report on the Development of Intelligent Connected Vehicles in Shanghai. 2023. Available online: https://jtw.sh.gov.cn/zxzfxx/20240205/7aa0c16cc00e42cb9b3311b564dc8ffe.html (accessed on 30 October 2024).
- Buechel, M.; Hinz, G.; Ruehl, F.; Schroth, H.; Gyoeri, C.; Knoll, A. Ontology-Based Traffic Scene Modeling, Traffic Regulations Dependent Situational Awareness and Decision-Making for Automated Vehicles. In Proceedings of the 2017 IEEE Intelligent Vehicles Symposium (IV), Los Angeles, CA, USA, 11–14 June 2017; pp. 1471–1476. [Google Scholar]
- Rizaldi, A.; Immler, F.; Althoff, M. A Formally Verified Checker of the Safe Distance Traffic Rules for Autonomous Vehicles. In Proceedings of the NASA Formal Methods; Rayadurgam, S., Tkachuk, O., Eds.; Springer International Publishing: Cham, Switzerland, 2016; pp. 175–190. [Google Scholar]
- Maierhofer, S.; Moosbrugger, P.; Althoff, M. Formalization of Intersection Traffic Rules in Temporal Logic. In Proceedings of the 2022 IEEE Intelligent Vehicles Symposium (IV), Aachen, Germany, 4–9 June 2022; pp. 1135–1144. [Google Scholar]
- Krasowski, H.; Althoff, M. Temporal Logic Formalization of Marine Traffic Rules. In Proceedings of the 2021 IEEE Intelligent Vehicles Symposium (IV), Nagoya, Japan, 11–17 July 2021; pp. 186–192. [Google Scholar]
- Wan, L.; Wang, C.; Luo, D.; Liu, H.; Ma, S.; Hu, W. Semantic Consistency and Correctness Verification of Digital Traffic Rules. Engineering 2024, 33, 47–62. [Google Scholar] [CrossRef]
- Xu, L.; He, B.; Zhou, H.; He, J. Impact and Revolution on Law on Road Traffic Safety by Autonomous Driving Technology in China. Comput. Law Secur. Rev. 2023, 51, 105906. [Google Scholar] [CrossRef]
- Tengilimoglu, O.; Carsten, O.; Wadud, Z. Are Current Roads Ready for Highly Automated Driving? A Conceptual Model for Road Readiness for AVs Applied to the UK City of Leeds. Transp. Res. Part A Policy Pract. 2024, 186, 104148. [Google Scholar] [CrossRef]
- Wang, X.; Zhu, M.; Chen, M.; Tremont, P. Drivers’ Rear End Collision Avoidance Behaviors under Different Levels of Situational Urgency. Transp. Res. Part C Emerg. Technol. 2016, 71, 419–433. [Google Scholar] [CrossRef]
- Yang, H.; Zhao, X.; Luan, S.; Chai, S. A Traffic Dynamic Operation Risk Assessment Method Using Driving Behaviors and Traffic Flow Data: An Empirical Analysis. Expert Syst. Appl. 2024, 249, 123619. [Google Scholar] [CrossRef]
- Li, L.; He, J.; Liu, W. Threat Assessment Algorithm Based on Characteristics of Driver Emergency Braking Behavior. J. Tongji Univ. (Nat. Sci.) 2014, 42, 109–114. [Google Scholar]
- Pek, C.; Zahn, P.; Althoff, M. Verifying the Safety of Lane Change Maneuvers of Self-Driving Vehicles Based on Formalized Traffic Rules. In Proceedings of the 2017 IEEE Intelligent Vehicles Symposium (IV), Los Angeles, CA, USA, 11–14 June 2017; pp. 1477–1483. [Google Scholar]
- Shalev-Shwartz, S.; Shammah, S.; Shashua, A. On a Formal Model of Safe and Scalable Self-Driving Cars. arXiv 2018, arXiv:1708.06374. [Google Scholar]
- Su, S.; Ge, Y.; Hou, P.; Wang, X.; Wang, Y.; Lyu, T.; Luo, W.; Lai, Y.; Ge, Y.; Lyu, L. China VI Heavy-Duty Moving Average Window (MAW) Method: Quantitative Analysis of the Problem, Causes, and Impacts Based on the Real Driving Data. Energy 2021, 225, 120295. [Google Scholar] [CrossRef]
- Bhavsar, Y.M.; Zaveri, M.S.; Raval, M.S.; Zaveri, S.B. Vision-Based Investigation of Road Traffic and Violations at Urban Roundabout in India Using UAV Video: A Case Study. Transp. Eng. 2023, 14, 100207. [Google Scholar] [CrossRef]
- Chen, Q.; Huang, H.; Li, Y.; Lee, J.; Long, K.; Gu, R.; Zhai, X. Modeling Accident Risks in Different Lane-Changing Behavioral Patterns. Anal. Methods Accid. Res. 2021, 30, 100159. [Google Scholar] [CrossRef]
- Wang, X.; Liu, Q.; Guo, F.; Fang, S.; Xu, X.; Chen, X. Causation Analysis of Crashes and near Crashes Using Naturalistic Driving Data. Accid. Anal. Prev. 2022, 177, 106821. [Google Scholar] [CrossRef] [PubMed]
- Esenturk, E.; Turley, D.; Wallace, A.; Khastgir, S.; Jennings, P. A Data Mining Approach for Traffic Accidents, Pattern Extraction and Test Scenario Generation for Autonomous Vehicles. Int. J. Transp. Sci. Technol. 2023, 12, 955–972. [Google Scholar] [CrossRef]
- Kovaceva, J.; Isaksson-Hellman, I.; Murgovski, N. Identification of Aggressive Driving from Naturalistic Data in Car-Following Situations. J. Saf. Res. 2020, 73, 225–234. [Google Scholar] [CrossRef]
- Lee, J.; Jang, K. Characterizing Driver Behavior Using Naturalistic Driving Data. Accid. Anal. Prev. 2024, 208, 107779. [Google Scholar] [CrossRef]
- Li, H.; Li, Y.; Chen, K.; Zhao, X. Driving Behavior of L3 Autonomous Vehicle Drivers in Fog Zones under Different Traffic Flow Conditions. Measurement 2023, 207, 112300. [Google Scholar] [CrossRef]
- Li, G.; Lai, W.; Sui, X.; Li, X.; Qu, X.; Zhang, T.; Li, Y. Influence of Traffic Congestion on Driver Behavior in Post-Congestion Driving. Accid. Anal. Prev. 2020, 141, 105508. [Google Scholar] [CrossRef]
- Zhao, S.; Qi, G.; Li, P.; Guan, W. The Aggressive Driving Performance Caused by Congestion Based on Behavior and EEG Analysis. J. Saf. Res. 2024, 91, 381–392. [Google Scholar] [CrossRef]
- Zhang, Y.; Wang, C.; Yu, R.; Wang, L.; Quan, W.; Gao, Y.; Li, P. The AD4CHE Dataset and Its Application in Typical Congestion Scenarios of Traffic Jam Pilot Systems. IEEE Trans. Intell. Veh. 2023, 8, 3312–3323. [Google Scholar] [CrossRef]
- (GRVA) Proposal for the 01 Series of Amendments to UN Regulation No. 157 (Automated Lane Keeping Systems) | UNECE. Available online: https://unece.org/transport/documents/2022/04/working-documents/grva-proposal-01-series-amendments-un-regulation-no (accessed on 3 December 2024).
- Alonso, B.; Musolino, G.; Rindone, C.; Vitetta, A. Estimation of a Fundamental Diagram with Heterogeneous Data Sources: Experimentation in the City of Santander. ISPRS Int. J. Geo-Inf. 2023, 12, 418. [Google Scholar] [CrossRef]
- Alonso, B.; Pòrtilla, Á.I.; Musolino, G.; Rindone, C.; Vitetta, A. Network Fundamental Diagram (NFD) and Traffic Signal Control: First Empirical Evidences from the City of Santander. Transp. Res. Procedia 2017, 27, 27–34. [Google Scholar] [CrossRef]
Disclaimer/Publisher’s Note: The statements, opinions and data contained in all publications are solely those of the individual author(s) and contributor(s) and not of MDPI and/or the editor(s). MDPI and/or the editor(s) disclaim responsibility for any injury to people or property resulting from any ideas, methods, instructions or products referred to in the content. |
© 2024 by the authors. Licensee MDPI, Basel, Switzerland. This article is an open access article distributed under the terms and conditions of the Creative Commons Attribution (CC BY) license (https://creativecommons.org/licenses/by/4.0/).