
Navigating Resource Challenges in Health Emergencies: The Role of Information Diffusion and Virus Spread in Demand Dynamics


Abstract
1. Introduction
2. Literature Review
2.1. The Fluctuation of Resources in Supply Chain Management
2.2. The Information Diffusion in Epidemics
2.3. The Virus Control Behaviors in Epidemics
2.4. Classical Propagation Models and Network Propagation Models
2.5. Summary
3. Mathematical Models
3.1. Parameters and Notations Definition
- Information Diffusion Rate: the diffusion rate of normal information about the epidemic, such as the existence of the virus and the international public health alert of the virus. Media exposure plays a significant role in determining the speed and extent of information diffusion.
- Information Forgetting Rate: the forgetting rate of normal information about the epidemic. Individuals may forget or lose interest in certain information over time.
- Inaccurate Information Diffusion Rate: the diffusion rate of false or misleading representations and information about the epidemic. Media exposure and consistency of public opinion can drive the diffusion of inaccurate or false information.
- Inaccurate Information Forgetting Rate: the forgetting rate of inaccurate information. Similar to normal information, inaccurate information can be forgotten over time, and it can be influenced by the consistency of public opinion.
- Short Move Probability: the likelihood that individuals will engage in short-range movements within their local environment, such as hanging out in their neighborhood or going to a nearby grocery, which can be influenced by the self-protection level of individuals.
- Long Travel Probability: the likelihood of individuals engaging in long-distance movements, such as traveling to different regions or countries, which can also be influenced by the self-protection level of individuals.
- Short Move Distance: the average distance individuals move during short-range movements, which can be influenced by the level of restrictive protection measures implemented by regional or national authorities.
- Long Travel Distance: the average distance individuals travel during long-distance movements, which can also be influenced by the level of restrictive protection.
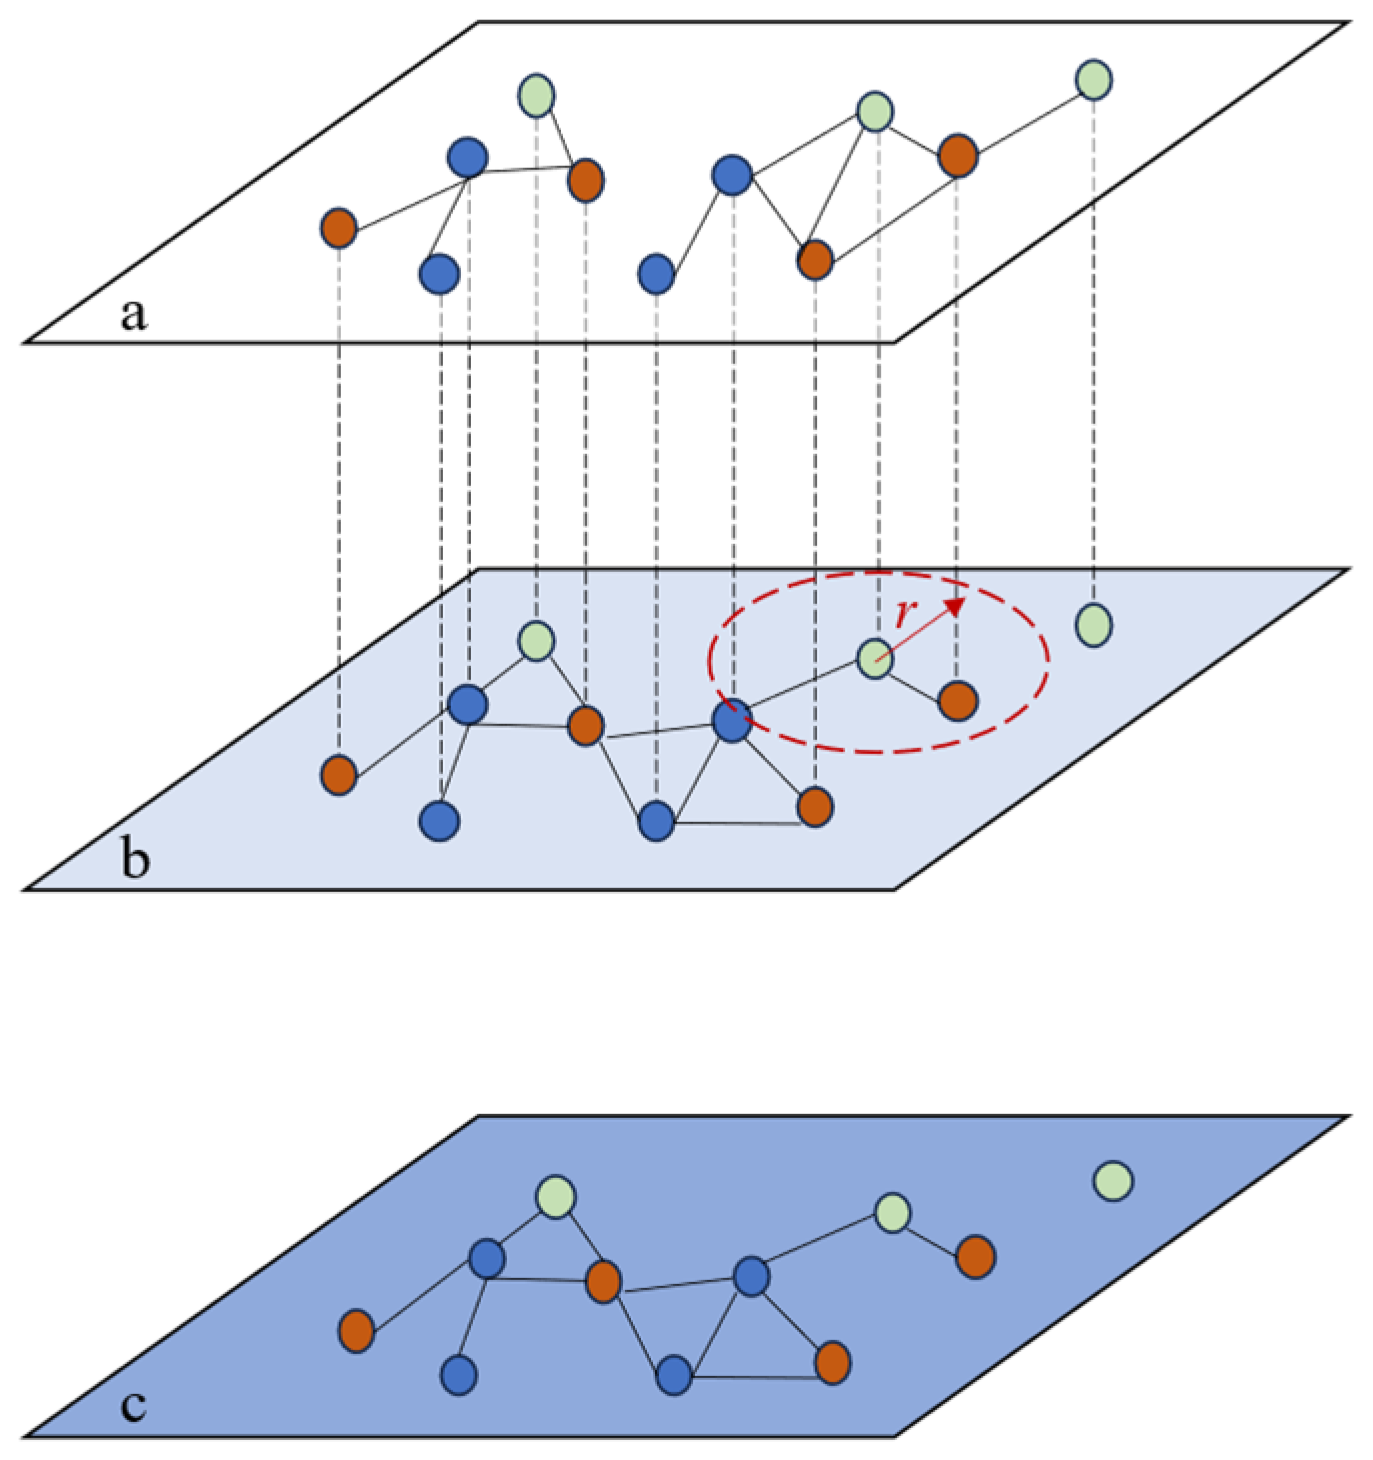
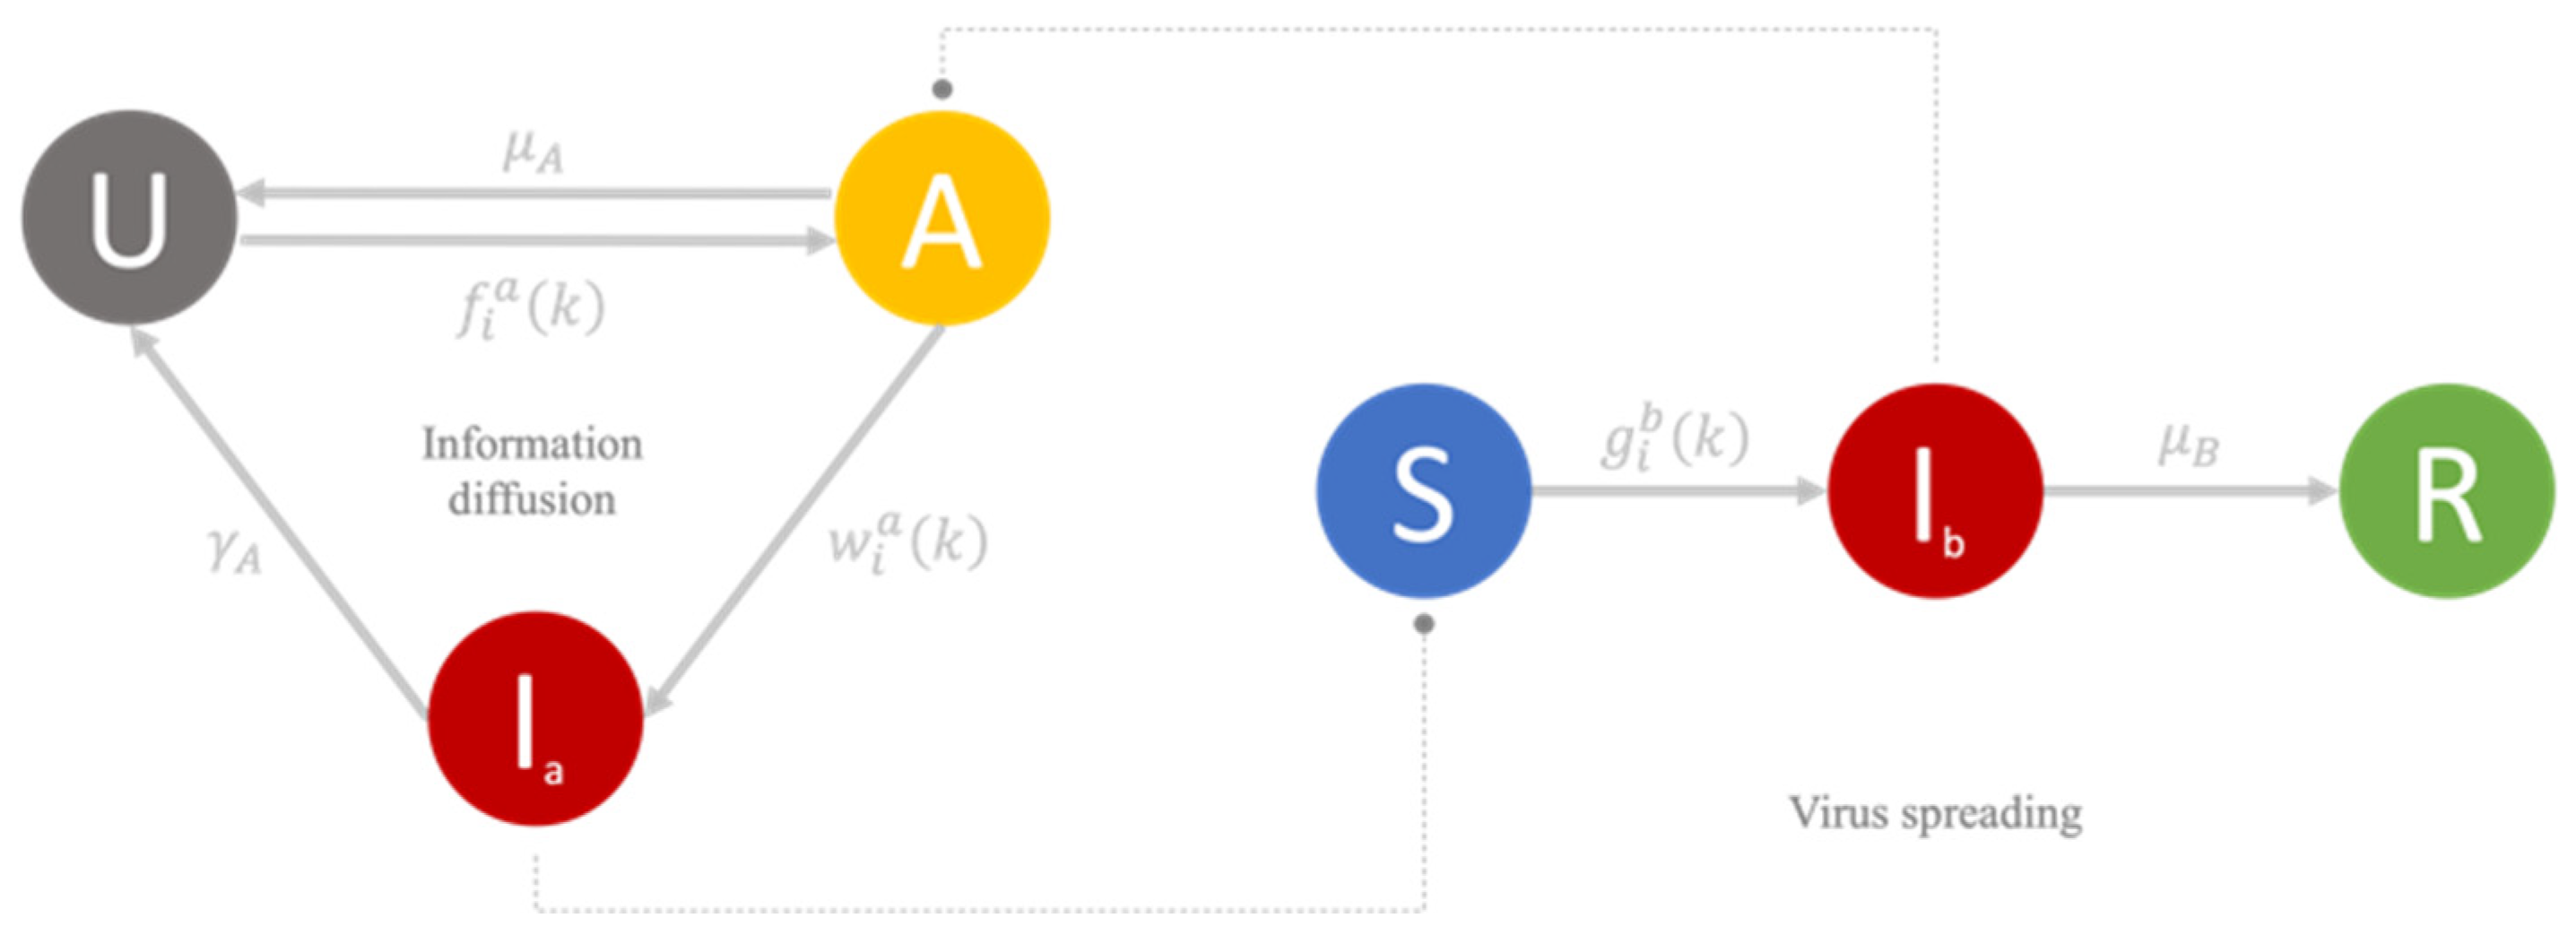
3.2. Information–Epidemic Two-Layer Model
3.3. The Resource Layer
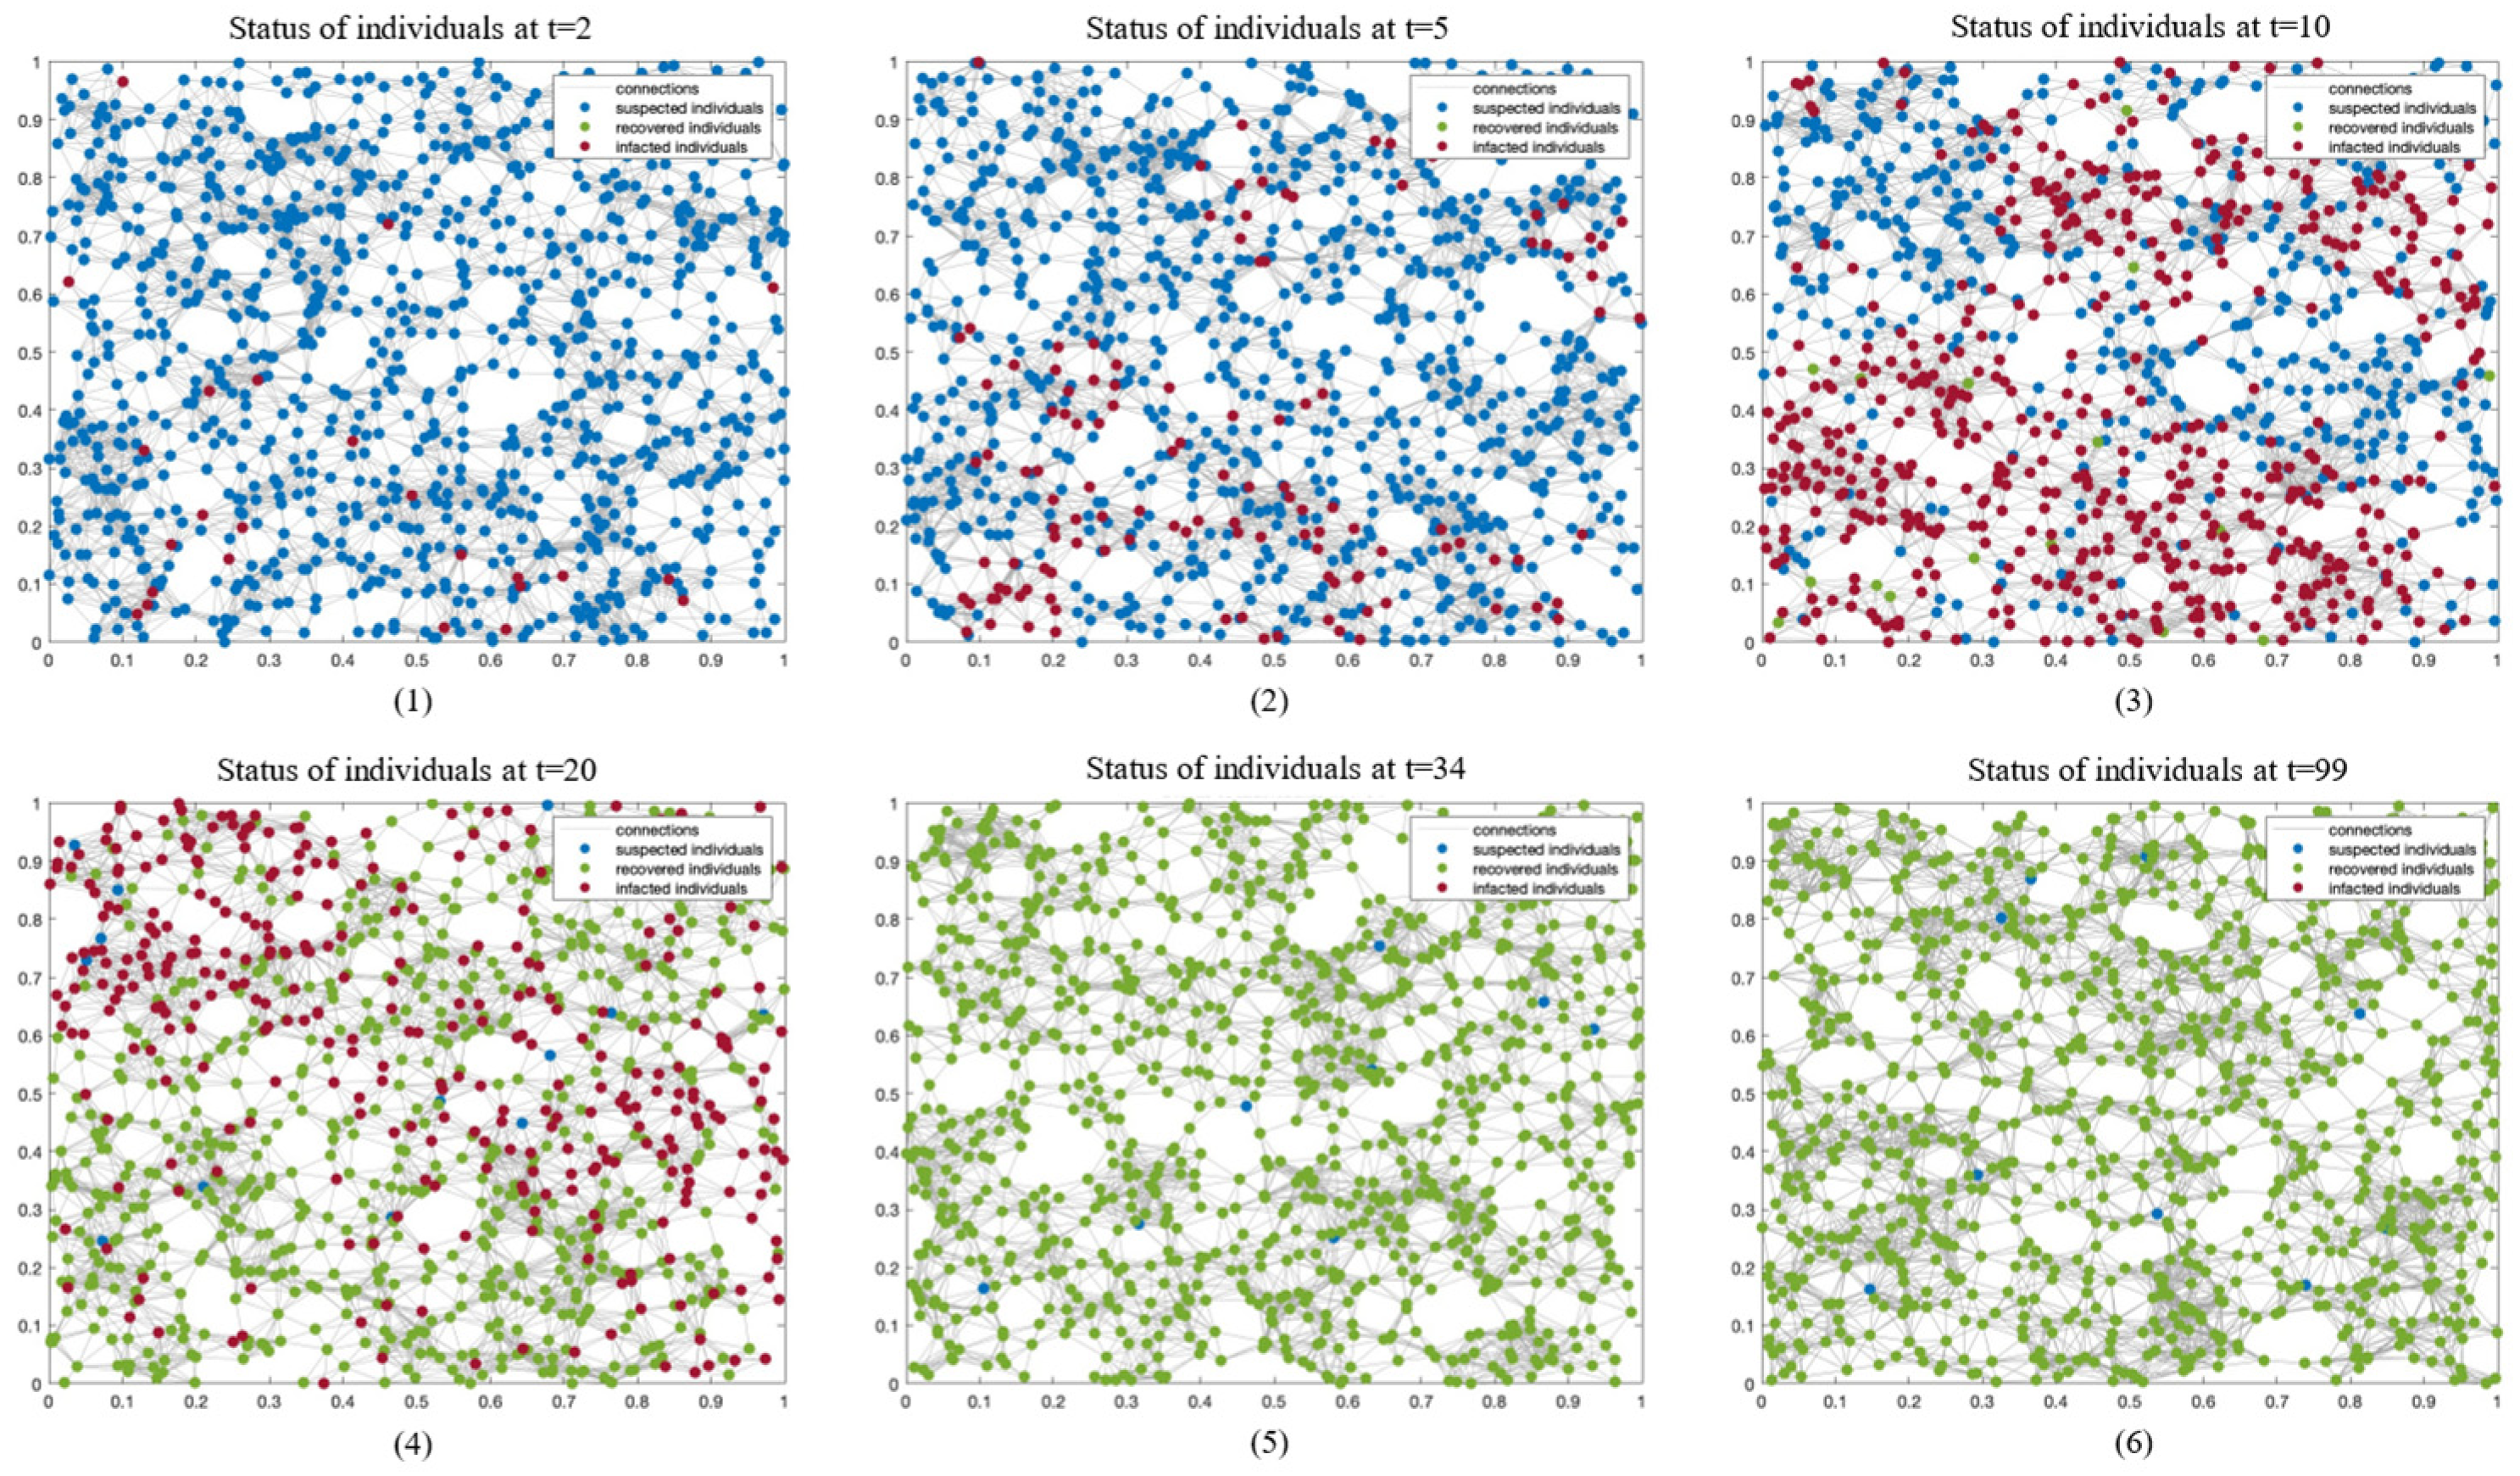
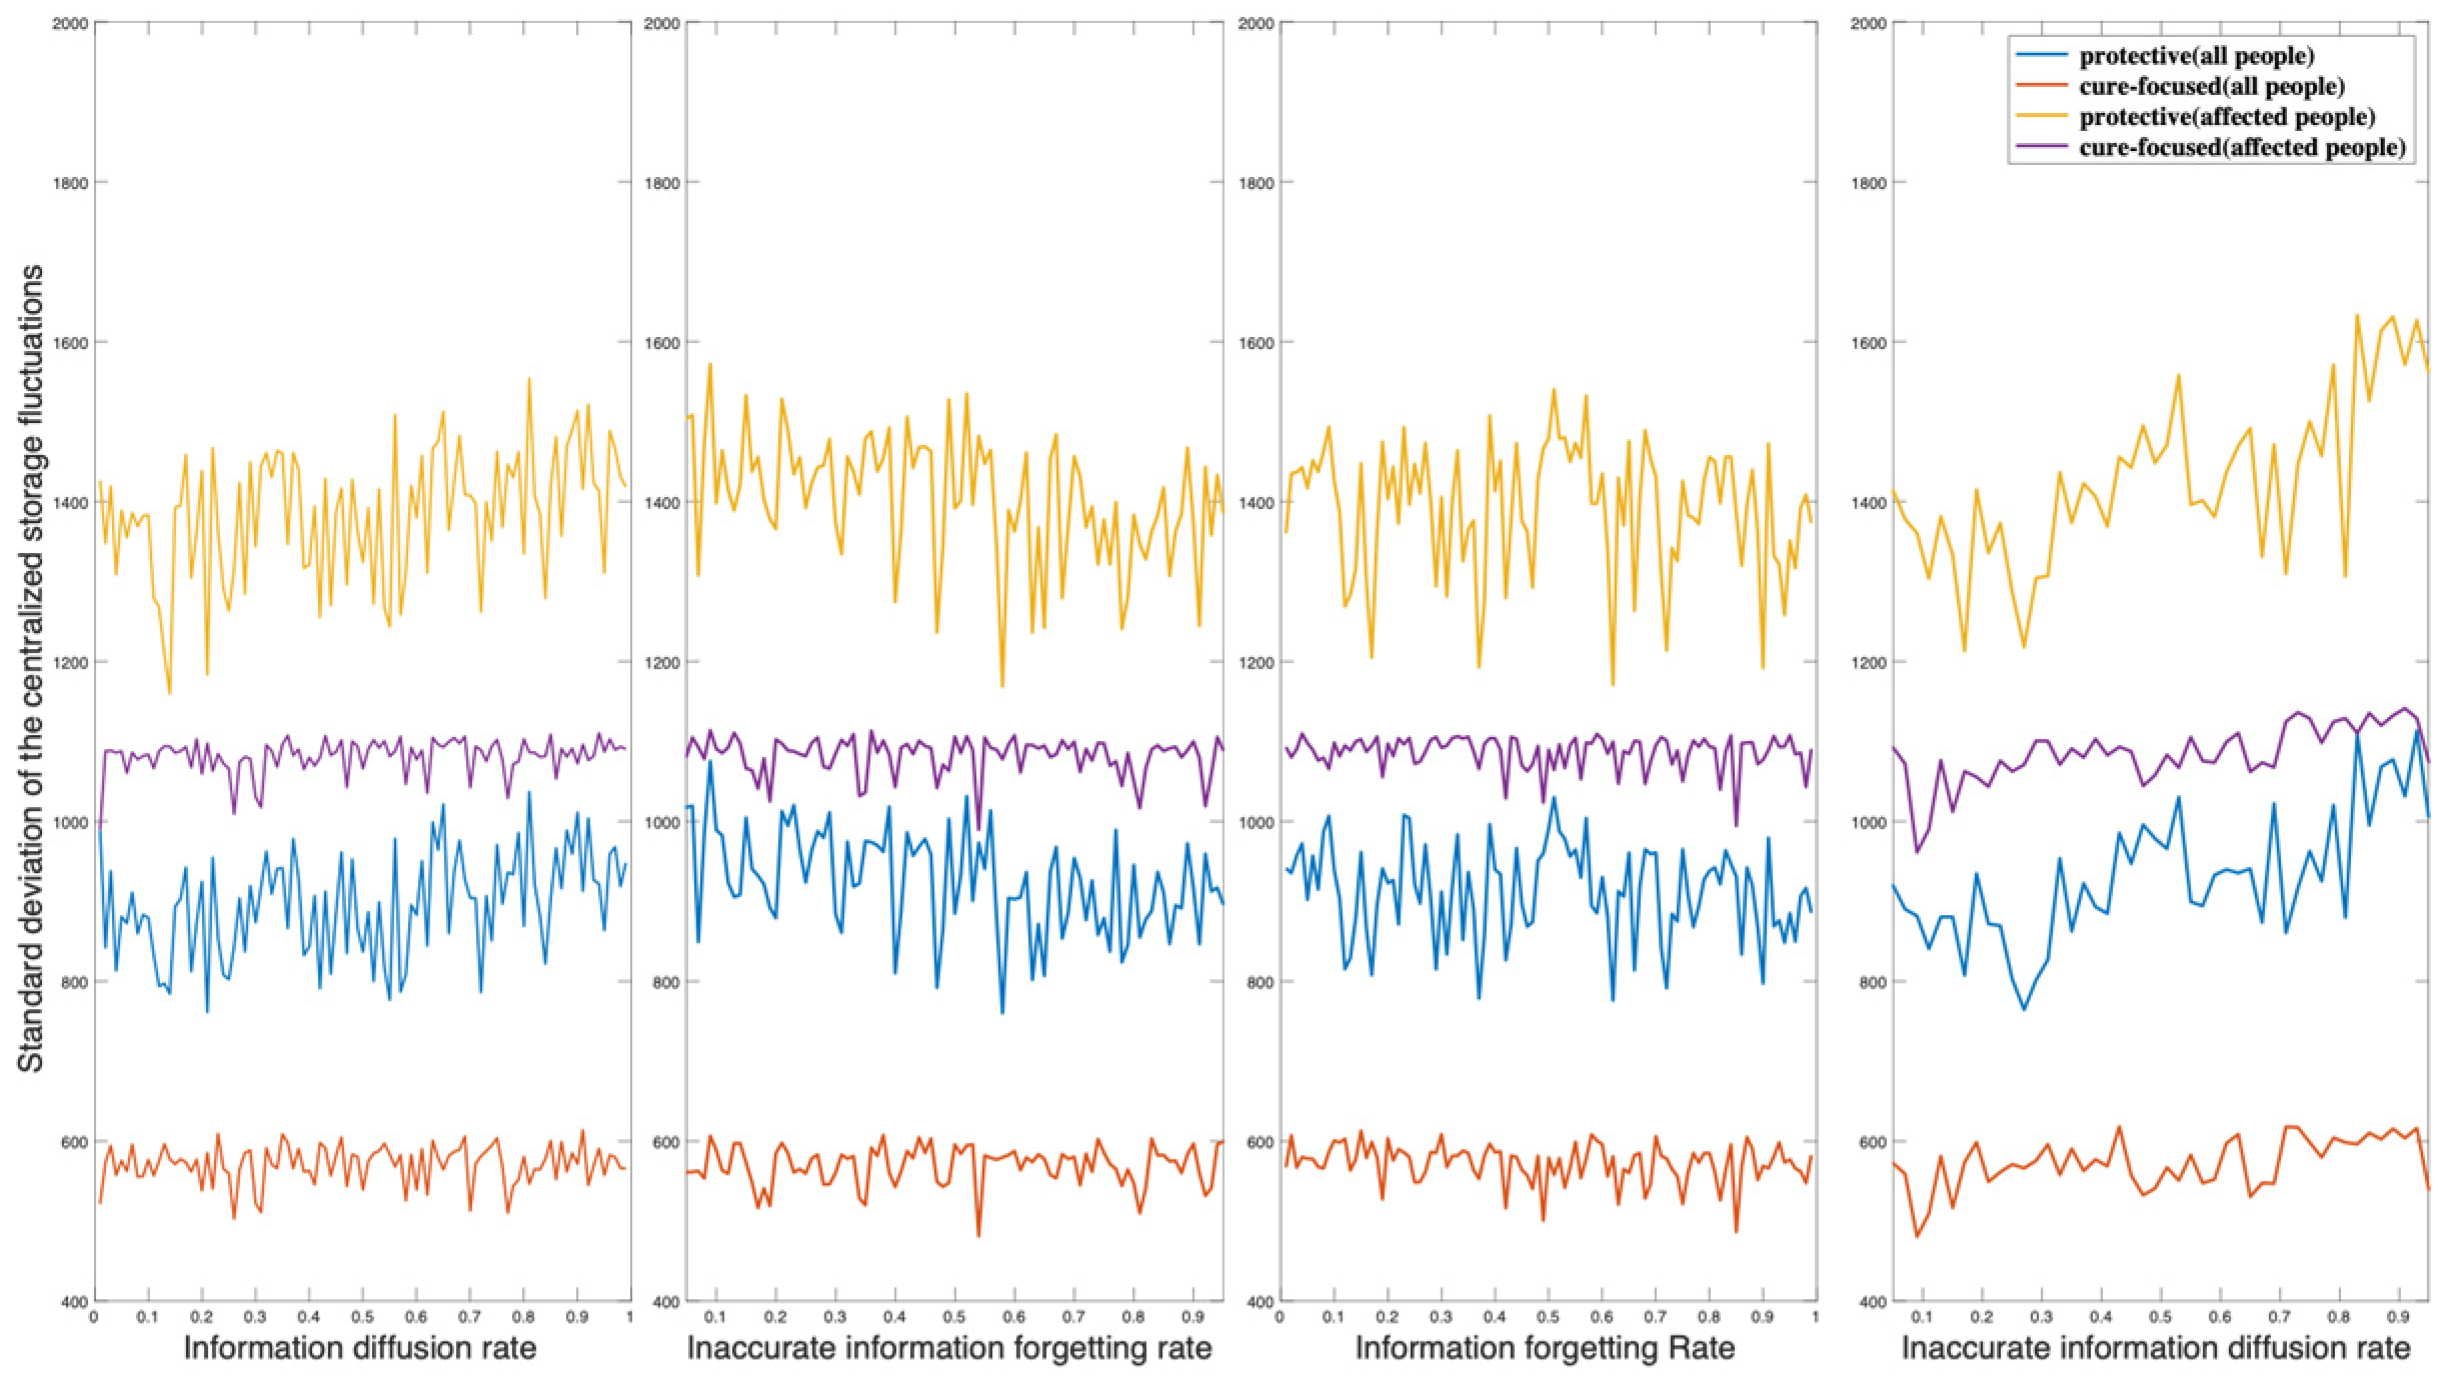
4. Simulation and Results
4.1. Explanations
4.2. Hypotheses and Simulations
4.3. Scenarios Analysis
4.4. Discussion
5. Conclusions
Author Contributions
Funding
Data Availability Statement
Conflicts of Interest
Appendix A


| Algorithm A1. The movement of nodes in the epidemic layer at each time step |
| Input: the position matrix P, the state matrixes Sa, the parameters r1, r2, p1, p2, t |
| Output: the new position matrix P_new |
| T = t; |
| n = length (P); |
| % Randomly select nodes to move |
| move1 = rand(n,1) < p1;%0–1 |
| move2 = rand(n,1) < p2 & ~move1; |
| % Move nodes that are selected to move |
| move1_inds = find(move1); |
| move2_inds = find(move2); |
| for i = 1:length(move1_inds) |
| idx = move1_inds(i); |
| P_new = P(idx,:) + rand(1,2) * r1—r1/2; |
| if all(P_new >= 0) && all(P_new < = 1) |
| P(idx,:) = P_new; |
| end |
| end |
| for i = 1:length(move2_inds) |
| idx = move2_inds(i); |
| if Sa(idx) = 1 |
| P_new = P(idx,:) + rand(1,2) * r1 − r1/2; |
| else |
| P_new = P(idx,:) + rand(1,2) * r2 − r2/2; |
| end |
| if all(P_new >= 0) && all(P_new < = 1) |
| P(idx,:) = P_new; |
| end |
| end |

| Nodes = 1000, T = 100 | ||
|---|---|---|
| Information Layer | Epidemic Layer | Resource Layer |
| = 0.6 | =0.1 | = 0.2 |
| = 0.4 | r = 0.07 | = 0.9 |
| = 0.75 | = 7 | = 0.01 |
| = 0.09 | r1 = 0.1 | rc = 1 |
| r2 = 0.5 | ||
| p2 = 0.1 |
| Parameters | Scenario 1 | Scenario 2 | Scenario 3 | Scenario 4 |
|---|---|---|---|---|
| nodes | 2488 | 1245 | 365 | 57 |
| T | 200 | 200 | 200 | 200 |
| 0.60 | 0.60 | 0.40 | 0.40 | |
| 0.4 | 0.4 | 0.4 | 0.4 | |
| 0.9 | 0.9 | 0.7 | 0.7 | |
| 0.06 | 0.06 | 0.03 | 0.03 | |
| 0.2 | 0.2 | 0.8 | 0.8 | |
| 0.03 | 0.08 | 0.03 | 0.07 | |
| 7 | 7 | 7 | 7 | |
| 0.1 | 0.18 | 0.1 | 0.18 | |
| 0.6 | 0.6 | 0.9 | 0.9 | |
| 0.8 | 0.8 | 0.5 | 0.5 | |
| 0.05 | 0.05 | 0.2 | 0.2 | |
| 0.1/0.9 | 0.1/0.9 | 0.1/0.9 | 0.1/0.9 | |
| 0.1/0.9 | 0.1/0.9 | 0.1/0.9 | 0.1/0.9 | |
| 0.01 | 0.01 | 0.01 | 0.005 | |
| 1 | 1 | 1 | 1 | |
| 124,410 | 62,240 | 7290 | 569.352 |
| Scales | Shanghai | Wuhan | Berlin | Bremen | Data Source |
|---|---|---|---|---|---|
| Population size | 29,210,808 | 8,718,250 | 3,573,938 | 567,802 | World Population Review |
| Area city (square km) | 6341 | 8494 | 891 | 318 | Wikipedia |
| Population density | 4200 | 1026 | 4126 | 1700 | Wikipedia |
| Internet user size (million) | 1050 (in China) | 77.53 (in Germany) | DataReportal | ||
| Number of supermarkets | 2714 | 179 | 973 | 78 | Smartscrapers; CEIC; Google Map |
| Track length of metro (km) | 826 | 463 | 155.64 | no metro | Wikipedia |
| Lifting of COVID-19 travel restrictions | 29.04.2023 (for entry into China) | 11.06.2022 (for entry into Germany) | TRAVEL BANS | ||
| Crime rate and statistics | 0.5 (in China) | 0.94 (in Germany) | macrotrends | ||
| Opinion on fake news | 0.604 (in China) 1 | 47% (in Germany) 2 | [69]; statista | ||
| Number of medical devices companies | 32,632 (in China) | 10,679 (in Germany) | statista; BoldData | ||
Appendix B

| Topology | Average Variance of Individual Holdings |
|---|---|
| Barabási–Albert (BA)-random-random | 0.240892879185805 |
| Watts–Strogatz (WS)-random-random | 0.252602085078648 |
| Erdős–Rényi (ER)-random-random | 0.286417945011199 |
Appendix C


References
- Ezeaku, H.C.; Asongu, S.A.; Nnanna, J. Volatility of international commodity prices in times of COVID-19: Effects of oil supply and global demand shocks. Extr. Ind. Soc. 2021, 8, 257–270. [Google Scholar] [CrossRef]
- Ahmed, M.Y.; Sarkodie, S.A. COVID-19 pandemic and economic policy uncertainty regimes affect commodity market volatility. Resour. Policy 2021, 74, 102303. [Google Scholar] [CrossRef]
- Global Times. Banlangen Popularity Soars after Expert ‘Backs’ Use against COVID-19. Global Times. 2020. Available online: https://www.globaltimes.cn/content/1203974.shtml (accessed on 19 October 2020).
- Van Oorschot, K.E.; Jahre, M.; Van Wassenhove, L.N. Collaboration–competition dilemma in flattening the COVID-19 curve. Prod. Oper. Manag. 2023, 32, 1345–1361. [Google Scholar] [CrossRef]
- Ahlqvist, V.; Dube, N.; Jahre, M.; Lee, J.S.; Moe, A.F.; Olivier, M.; Aardal, C.; Melaku, T.; Selviaridis, K.; Viana, J. Supply chain risk management strategies in normal and abnormal times: Policymakers’ role in reducing generic medicine shortages. Int. J. Phys. Distrib. Logist. Manag. 2023, 53, 206–230. [Google Scholar] [CrossRef]
- Smith, T.P.; Flaxman, S.; Gallinat, A.S.; Kinosian, S.P.; Stemkovski, M.; Unwin, H.J.T.; Watson, O.J.; Whittaker, C.; Cattarino, L.; Dorigatti, I.; et al. Temperature and population density influence SARS-CoV-2 transmission in the absence of non-pharmaceutical interventions. Proc. Natl. Acad. Sci. USA 2021, 118, e2019284118. [Google Scholar] [CrossRef] [PubMed]
- Sagan, A.; Bryndova, L.; Kowalska-Bobko, I.; Smatana, M.; Spranger, A.; Szerencses, V.; Webb, E.; Gaal, P. A reversal of fortune: Comparison of health system responses to COVID-19 in the Visegrad group during the early phases of the pandemic. Health Policy 2022, 126, 446–455. [Google Scholar] [CrossRef] [PubMed]
- Elhadi, M.; Msherghi, A.; Alkeelani, M.; Zorgani, A.; Zaid, A.; Alsuyihili, A.; Buzreg, A.; Ahmed, H.; Elhadi, A.; Khaled, A.; et al. Assessment of Healthcare Workers’ Levels of Preparedness and Awareness Regarding COVID-19 Infection in Low-Resource Settings. Am. J. Trop. Med. Hyg. 2020, 103, 828–833. [Google Scholar] [CrossRef] [PubMed]
- Haegdorens, F.; Franck, E.; Smith, P.; Bruyneel, A.; Monsieurs, K.G.; Van Bogaert, P. Sufficient personal protective equipment training can reduce COVID-19 related symptoms in healthcare workers: A prospective cohort study. Int. J. Nurs. Stud. 2021, 126, 104132. [Google Scholar] [CrossRef]
- WHO. Responding to Community Spread of COVID-19: Interim Guidance, 7 March 2020 (No. WHO/COVID-19/Community_Transmission/2020.1). World Health Organization. 2020. Available online: https://www.who.int/publications/i/item/responding-to-community-spread-of-covid-19 (accessed on 7 March 2020).
- Wincewicz-Bosy, M.; Sadowski, A.; Wąsowska, K.; Galar, Z.; Dymyt, M. Military Food Supply Chain during the COVID-19 Pandemic. Sustainability 2022, 14, 2464. [Google Scholar] [CrossRef]
- Chowdhury, P.; Paul, S.K.; Kaisar, S.; Moktadir, M.A. COVID-19 pandemic related supply chain studies: A systematic review. Transp. Res. Part E Logist. Transp. Rev. 2021, 148, 102271. [Google Scholar] [CrossRef]
- Shao, J.; Liang, C.; Liu, Y.; Xu, J.; Zhao, S. Relief demand forecasting based on intuitionistic fuzzy case-based reasoning. Socio-Econ. Plan. Sci. 2021, 74, 100932. [Google Scholar] [CrossRef]
- Li, T. Trans-Regional Medical Support in Public Health Emergencies: A Case Study of Wuhan in the Early COVID-19 Pandemic in China. Risk Manag. Healthc. Policy 2022, 15, 677–683. [Google Scholar] [CrossRef]
- Shao, H.; Jin, C.; Xu, J.; Zhong, Y.; Xu, B. Supply-demand matching of medical services at a city level under the background of hierarchical diagnosis and treatment—Based on Didi Chuxing Data in Haikou, China. BMC Health Serv. Res. 2022, 22, 1–12. [Google Scholar] [CrossRef]
- Cai, M.; Luo, J. Influence of COVID-19 on Manufacturing Industry and Corresponding Countermeasures from Supply Chain Perspective. J. Shanghai Jiaotong Univ. 2020, 25, 409–416. [Google Scholar] [CrossRef]
- Xie, K.; Zhu, S.; Gui, P.; Chen, Y. Coordinating an emergency medical material supply chain with CVaR under the pandemic considering corporate social responsibility. Comput. Ind. Eng. 2023, 176, 108989. [Google Scholar] [CrossRef]
- Brijball Parumasur, S.; Oodith, P.D.; Oodith, D. A Cursory Review of The Impact of COVID-19 On Panic-Buying. J. Posit. Sch. Psychol. 2023, 7, 1199–1218. Available online: https://journalppw.com/index.php/jpsp/article/view/15891 (accessed on 2 March 2023).
- Alla, L.; Bentalha, B.; Bouhtati, N. Assessing Supply Chain Performance in the COVID-19 Context: A Prospective Model. In Proceedings of the 2022 14th International Colloquium of Logistics and Supply Chain Management (LOGISTIQUA), El Jadida, Morocco, 25–27 May 2022; pp. 1–6. [Google Scholar]
- Michna, Z.; Disney, S.M.; Nielsen, P. The impact of stochastic lead times on the bullwhip effect under correlated demand and moving average forecasts. Omega 2020, 93, 102033. [Google Scholar] [CrossRef]
- Trapero, J.R.; Pedregal, D.J. A novel time-varying bullwhip effect metric: An application to promotional sales. Int. J. Prod. Econ. 2016, 182, 465–471. [Google Scholar] [CrossRef]
- Heymann, D.L.; Shindo, N. COVID-19: What is next for public health? Lancet 2020, 395, 542–545. [Google Scholar] [CrossRef]
- Wilson, N.M.; Norton, A.; Young, F.P.; Collins, D.W. Airborne transmission of severe acute respiratory syndrome coronavirus-2 to healthcare workers: A narrative review. Anaesthesia 2020, 75, 1086–1095. [Google Scholar] [CrossRef]
- Yuqian, Z.; Tailei, Z.; Wenshan, H.; Xueli, S. A delayed SIQR epidemic model with media effect and tracking quarantine. J. Zhejiang Univ. 2022, 49, 159–169. (In Chinese) [Google Scholar] [CrossRef]
- Laato, S.; Islam, A.K.M.N.; Islam, M.N.; Whelan, E. What drives unverified information sharing and cyberchondria during the COVID-19 pandemic? Eur. J. Inf. Syst. 2020, 29, 288–305. [Google Scholar] [CrossRef]
- Naeem, M. Do social media platforms develop consumer panic buying during the fear of COVID-19 pandemic. J. Retail. Consum. Serv. 2020, 58, 102226. [Google Scholar] [CrossRef]
- Sheth, J. Impact of COVID-19 on consumer behavior: Will the old habits return or die? J. Bus. Res. 2020, 117, 280–283. [Google Scholar] [CrossRef]
- Yuen, K.F.; Wang, X.; Ma, F.; Li, K.X. The Psychological Causes of Panic Buying Following a Health Crisis. Int. J. Environ. Res. Public Health 2020, 17, 3513. [Google Scholar] [CrossRef]
- Zhang, X.; Zhang, Z.-K.; Wang, W.; Hou, D.; Xu, J.; Ye, X.; Li, S. Multiplex network reconstruction for the coupled spatial diffusion of infodemic and pandemic of COVID-19. Int. J. Digit. Earth 2021, 14, 401–423. [Google Scholar] [CrossRef]
- Winkielman, P.; Nowak, A. Beyond the features: The role of consistency in impressions of trust. Soc. Psychol. Bull. 2022, 17, 1–20. [Google Scholar] [CrossRef]
- Thagard, P.; Verbeurgt, K. Coherence as Constraint Satisfaction. Cogn. Sci. 1998, 22, 1–24. [Google Scholar] [CrossRef]
- Pennington, N.; Hastie, R. Explaining the evidence: Tests of the Story Model for juror decision making. J. Pers. Soc. Psychol. 1992, 62, 189–206. [Google Scholar] [CrossRef]
- Plazas, A.; Malvestio, I.; Starnini, M.; Díaz-Guilera, A. Modeling partial lockdowns in multiplex networks using partition strategies. Appl. Netw. Sci. 2021, 6, 1–15. [Google Scholar] [CrossRef] [PubMed]
- Prem, K.; Liu, Y.; Russell, T.W.; Kucharski, A.J.; Eggo, R.M.; Davies, N.; Jit, M.; Klepac, P.; Flasche, S.; Clifford, S.; et al. The Effect of Control Strategies to Reduce Social Mixing on Outcomes of the COVID-19 Epidemic in Wuhan, China: A Modelling Study. Lancet Public Health 2020, 5, e261–e270. [Google Scholar] [CrossRef]
- Mogi, R.; Spijker, J. The influence of social and economic ties to the spread of COVID-19 in Europe. J. Popul. Res. 2022, 39, 495–511. [Google Scholar] [CrossRef]
- Fedorova, E.; Ledyaeva, S.; Kulikova, O.; Nevredinov, A. Governmental anti-pandemic policies, vaccination, population mobility, Twitter narratives, and the spread of COVID-19: Evidence from the European Union countries. Risk Anal. 2023, 43, 1975–2003. [Google Scholar] [CrossRef]
- Ding, L.; Hu, P.; Guan, Z.-H.; Li, T. An Efficient Hybrid Control Strategy for Restraining Rumor Spreading. IEEE Trans. Syst. Man Cybern. Syst. 2021, 51, 6779–6791. [Google Scholar] [CrossRef]
- Xian, J.; Yang, D.; Pan, L.; Liu, M.; Wang, W. Containing rumors spreading on correlated multiplex networks. J. Stat. Mech. Theory Exp. 2020, 2020, 023402. [Google Scholar] [CrossRef]
- Dhar, J.; Jain, A.; Gupta, V.K. A mathematical model of news propagation on online social network and a control strategy for rumor spreading. Soc. Netw. Anal. Min. 2016, 6, 57. [Google Scholar] [CrossRef]
- Jain, A.; Dhar, J.; Gupta, V. Rumor model on homogeneous social network incorporating delay in expert intervention and government action. Commun. Nonlinear Sci. Numer. Simul. 2020, 84, 105189. [Google Scholar] [CrossRef]
- Peng, B.; Ge, J.; Wei, G.; Wan, A. Research on identification of key brittleness factors in emergency medical resources support system based on complex network. Artif. Intell. Med. 2022, 131, 102350. [Google Scholar] [CrossRef]
- Zhang, M.; Qin, S.; Zhu, X. Information diffusion under public crisis in BA scale-free network based on SEIR model—Taking COVID-19 as an example. Phys. A Stat. Mech. Appl. 2021, 571, 125848. [Google Scholar] [CrossRef]
- Jiang, J.; Zhou, T. Resource control of epidemic spreading through a multilayer network. Sci. Rep. 2018, 8, 1629. [Google Scholar] [CrossRef]
- Sun, Q.; Wang, Z.; Zhao, D.; Xia, C.; Perc, M. Diffusion of resources and their impact on epidemic spreading in multilayer networks with simplicial complexes. Chaos Solitons Fractals 2022, 164, 112734. [Google Scholar] [CrossRef]
- Wang, X.; Zhu, X.; Tao, X.; Xiao, J.; Wang, W.; Lai, Y.-C. Anomalous role of information diffusion in epidemic spreading. Phys. Rev. Res. 2021, 3, 013157. [Google Scholar] [CrossRef]
- Scabini, L.F.; Ribas, L.C.; Neiva, M.B.; Junior, A.G.; Farfán, A.J.; Bruno, O.M. Social interaction layers in complex networks for the dynamical epidemic modeling of COVID-19 in Brazil. Phys. A Stat. Mech. Appl. 2020, 564, 125498. [Google Scholar] [CrossRef]
- Li, C.; Zhang, Y.; Li, X. Epidemic Threshold in Temporal Multiplex Networks with Individual Layer Preference. IEEE Trans. Netw. Sci. Eng. 2021, 8, 814–824. [Google Scholar] [CrossRef]
- Sahneh, F.D.; Scoglio, C. Competitive epidemic spreading over arbitrary multilayer networks. Phys. Rev. E 2014, 89, 062817. [Google Scholar] [CrossRef]
- Wu, D.; Tang, M.; Liu, Z.; Lai, Y.-C. Impact of inter-layer hopping on epidemic spreading in a multilayer network. Commun. Nonlinear Sci. Numer. Simul. 2020, 90, 105403. [Google Scholar] [CrossRef]
- Huang, H.; Chen, Y.; Ma, Y. Modeling the competitive diffusions of rumor and knowledge and the impacts on epidemic spreading. Appl. Math. Comput. 2021, 388, 125536. [Google Scholar] [CrossRef]
- Li, M.; Liu, R.-R.; Peng, D.; Jia, C.-X.; Wang, B.-H. Roles of the spreading scope and effectiveness in spreading dynamics on multiplex networks. Phys. A Stat. Mech. Appl. 2018, 492, 1239–1246. [Google Scholar] [CrossRef]
- da Silva, P.C.V.; Velásquez-Rojas, F.; Connaughton, C.; Vazquez, F.; Moreno, Y.; Rodrigues, F.A. Epidemic spreading with awareness and different timescales in multiplex networks. Phys. Rev. E 2019, 100, 032313. [Google Scholar] [CrossRef]
- Fan, C.-J.; Jin, Y.; Huo, L.-A.; Liu, C.; Yang, Y.-P.; Wang, Y.-Q. Effect of individual behavior on the interplay between awareness and disease spreading in multiplex networks. Phys. A Stat. Mech. Appl. 2016, 461, 523–530. [Google Scholar] [CrossRef]
- Peng, K.; Lu, Z.; Lin, V.; Lindstrom, M.R.; Parkinson, C.; Wang, C.; Bertozzi, A.L.; Porter, M.A. A multilayer network model of the coevolution of the spread of a disease and competing opinions. Math. Model. Methods Appl. Sci. 2021, 31, 2455–2494. [Google Scholar] [CrossRef]
- Fan, J.; Yin, Q.; Xia, C.; Perc, M. Epidemics on multilayer simplicial complexes. Proc. R. Soc. A 2022, 478, 20220059. [Google Scholar] [CrossRef]
- Zhang, H.; Liu, Y.; Chen, X. Research on the information dissemination mechanisms of weibo in scale-free networks. Phys. A Stat. Mech. Appl. 2019, 532, 121877. [Google Scholar] [CrossRef]
- Zhu, L.; Liu, W.; Zhang, Z. Interplay between epidemic and information spreading on multiplex networks. Math. Comput. Simul. 2021, 188, 268–279. [Google Scholar] [CrossRef]
- Yin, Q.; Wang, Z.; Xia, C. Information-epidemic co-evolution propagation under policy intervention in multiplex networks. Nonlinear Dyn. 2023, 111, 14583–14595. [Google Scholar] [CrossRef]
- You, X.; Zhang, M.; Ma, Y.; Tan, J.; Liu, Z. Impact of higher-order interactions and individual emotional heterogeneity on information-disease coupled dynamics in multiplex networks. Chaos Solitons Fractals 2023, 177, 114186. [Google Scholar] [CrossRef]
- Yin, Q.; Wang, Z.; Xia, C.; Bauch, C.T. Impact of co-evolution of negative vaccine-related information, vaccination behavior and epidemic spreading in multilayer networks. Commun. Nonlinear Sci. Numer. Simul. 2022, 109, 106312. [Google Scholar] [CrossRef]
- Cui, S.; Liu, F.; Jardón-Kojakhmetov, H.; Cao, M. Discrete-time layered-network epidemics model with time-varying transition rates and multiple resources. Automatica 2024, 159, 111303. [Google Scholar] [CrossRef]
- Kar, A.K.; Tripathi, S.N.; Malik, N.; Gupta, S.; Sivarajah, U. How Does Misinformation and Capricious Opinions Impact the Supply Chain—A Study on the Impacts During the Pandemic. Ann. Oper. Res. 2022, 327, 713–734. [Google Scholar] [CrossRef] [PubMed]
- Wang, Y.; Qing, F.; Wang, L. Rumor Dynamic Model considering Intentional Spreaders in Social Network. Discret. Dyn. Nat. Soc. 2022, 2022, 125848. [Google Scholar] [CrossRef]
- Xiuzhen, X.; Zheng, W.; Umair, M. Testing the fluctuations of oil resource price volatility: A hurdle for economic recovery. Resour. Policy 2022, 79, 102982. [Google Scholar] [CrossRef]
- Kumar, D. Renewable Energy Scenarios in Future Indian Smart Cities: A Geospatial Technology Perspective; Springer: Dordrecht, The Netherlands, 2023. [Google Scholar] [CrossRef]
- Mathieu, E.; Ritchie, H.; Rodés-Guirao, L.; Appel, C.; Giattino, C.; Hasell, J.; Macdonald, B.; Dattani, S.; Beltekian, D.; Ortiz-Ospina, E.; et al. Coronavirus Pandemic (COVID-19), OurWorldInData.org. 2020. Available online: https://ourworldindata.org/coronavirus (accessed on 2 January 2024).
- Cosgrove, E. Fastenal Raced to Increase Mask Inventory. Now It Has an “Oversupply”. Supply Chain Dive. 2020. Available online: https://www.supplychaindive.com/news/mask-supply-fastenal-margins/586985/ (accessed on 14 October 2020).
- Guo, S.; Jian, Z. The National Medical Products Administration and the National Intellectual Property Administration of China Jointly Issued ‘Ten Measures to Support the Resumption of Work and Production in Enterprises’. No 30. 2020. Available online: https://www.gov.cn/zhengce/zhengceku/2020-02/15/content_5479457.htm (accessed on 15 February 2020).
- Tang, S.; Willnat, L.; Zhang, H. Fake news, information overload, and the third-person effect in China. Glob. Media China 2021, 6, 492–507. [Google Scholar] [CrossRef]


| The Number of Layers | Pattern | Reference |
|---|---|---|
| Two layers | Virus layer 1 + Virus layer 2 | [43,48,49] |
| Information layer + Virus layer | [50,51,52,53,54,55,56,57,58,59] | |
| Virus layer + Resource layer | [44] | |
| Three layers | Information layer + Virus layer + Resource layer | [45,60] |
| Anti-virus layer + Virus layer 1 + Virus layer 2 | [61] | |
| More than three layers | Virus layer 1 + Virus layer 2 + … + Virus layer 6 | [46] |
| Information layer + Virus layer 1 + … + Virus layer D | [47] |
| Notations | Definitions | Value Range |
|---|---|---|
| T | Iteration Duration | N+ |
| Information diffusion rate | (0, 1) | |
| Information forgetting rate | (0, 1) | |
| Inaccurate information diffusion rate | (0, 1) | |
| Inaccurate information forgetting rate | (0, 1) | |
| Virus spread rate | (0, 1) | |
| Connection distance | (0, 1) | |
| Duration of infection | N+ | |
| Short move distance | (0, 1) | |
| Short move probability | (0, 1) | |
| Long travel distance | (0, 1) | |
| Long travel probability | (0, 1) | |
| Resource Efficacy: protective or cure-focused | (0, 1) | |
| Resource Efficiency: the dependence of recovery on medical resources | (0, 1) | |
| Automatic replenishment rate of centralized materials | (0, 1) | |
| Initial value of individual holdings per person | N+ | |
| Initial value of centralized material storage | N+ | |
| or | Current time step | N+, [1, T] |
| Actual information diffusion rate | (0, 1) | |
| Actual inaccurate information diffusion rate | (0, 1) | |
| Actual virus spread rate | (0, 1) | |
| The adjacency matrix in the information layer | ||
| The adjacency matrix in the epidemic layer | ||
| n | The number of nodes | N+ |
| Information Diffusion Rate | Information Forgetting Rate | Inaccurate Information Diffusion Rate | Inaccurate Information Forgetting Rate | ||||||
| Resource Type | TL | p-Value | TL | p-Value | TL | p-Value | TL | p-Value | |
| Individual holdings fluctuations | Protective (all people) | −0.0113 ** | 0.0058 | −0.0058 | 0.1338 | 0.0203 *** | 0.0000 | −0.014 *** | 0.0008 |
| Cure-focus (all people) | −0.0043 * | 0.0192 | 0.0011 | 0.5056 | 0.0063 ** | 0.0069 | 0.0005 | 0.7893 | |
| Protective (affected people) | −0.584 *** | 0.0000 | −0.0233 | 0.786 | −0.0443 | 0.6569 | −0.7174 *** | 0.0000 | |
| Cure-focus (affected people) | −0.203 *** | 0.0000 | −0.0184 | 0.147 | −0.0856 ** | 0.0095 | −0.0688 *** | 0.0000 | |
| Centralized storage fluctuations | Protective (all stage) | 82.0707 *** | 0.0002 | −27.0554 | 0.1742 | 219.8313 *** | 0.0000 | −101.8142 *** | 0.0008 |
| Cure-focus (all stage) | 6.3044 | 0.4521 | −17.0604 * | 0.0392 | 51.7569 *** | 0.0000 | 1.5159 | 0.7893 | |
| Protective (during the epidemic) | 97.1633 *** | 0.0004 | −27.9038 | 0.3158 | 297.4283 *** | 0.0000 | −101.0463 *** | 0.0001 | |
| Cure-focus (during the epidemic) | 16.02 * | 0.0354 | −9.0894 | 0.2126 | 92.7855 *** | 0.0000 | −7.0144 | 0.3815 | |
| Short Move Probability | Long Travel Probability | Short Move Distance | Long Travel Distance | ||||||
| Resource Type | TL | p-Value | TL | p-Value | TL | p-Value | TL | p-Value | |
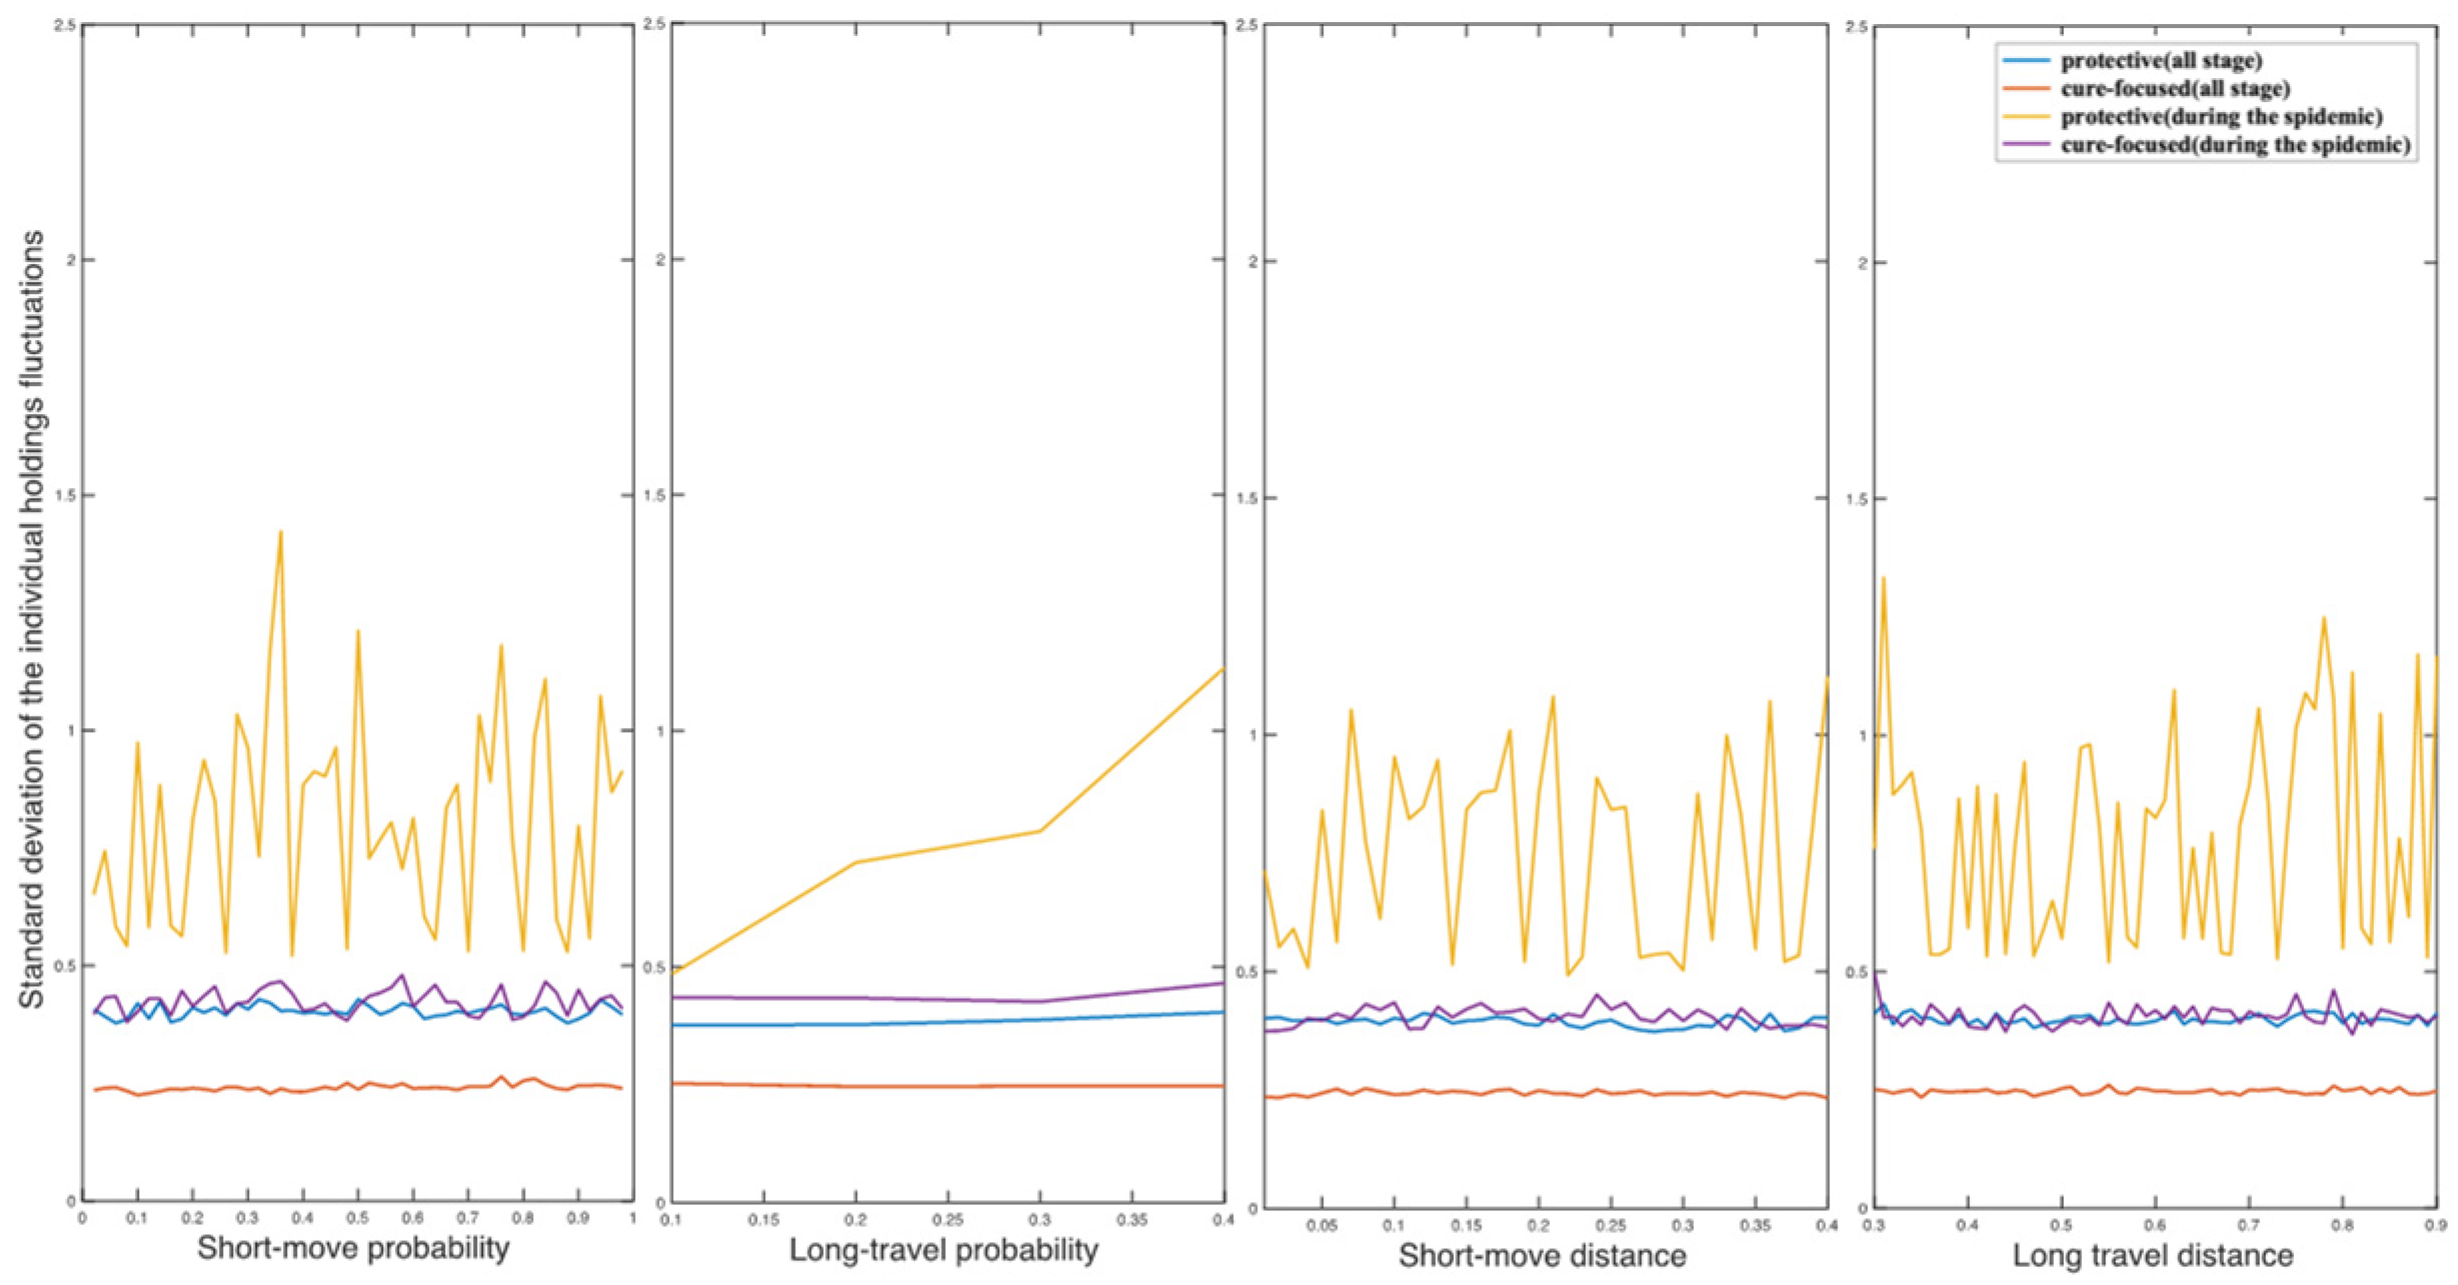
| Individual holdings fluctuations | Protective (all people) | 0.0032 | 0.4705 | 0.0924 | 0.0645 | −0.0318* | 0.0329 | −0.0001 | 0.9831 |
| Cure-focus (all people) | 0.0112 *** | 0.0000 | −0.0181 | 0.2896 | −0.0064 | 0.3796 | 0.0006 | 0.8489 | |
| Protective (affected people) | 0.0965 | 0.1869 | 2.0135 * | 0.0311 | 0.0772 | 0.7835 | 0.0278 | 0.8344 | |
| Cure-focus (affected people) | 0.0041 | 0.6844 | 0.0836 | 0.3743 | −0.0114 | 0.6752 | 0.0013 | 0.9228 | |
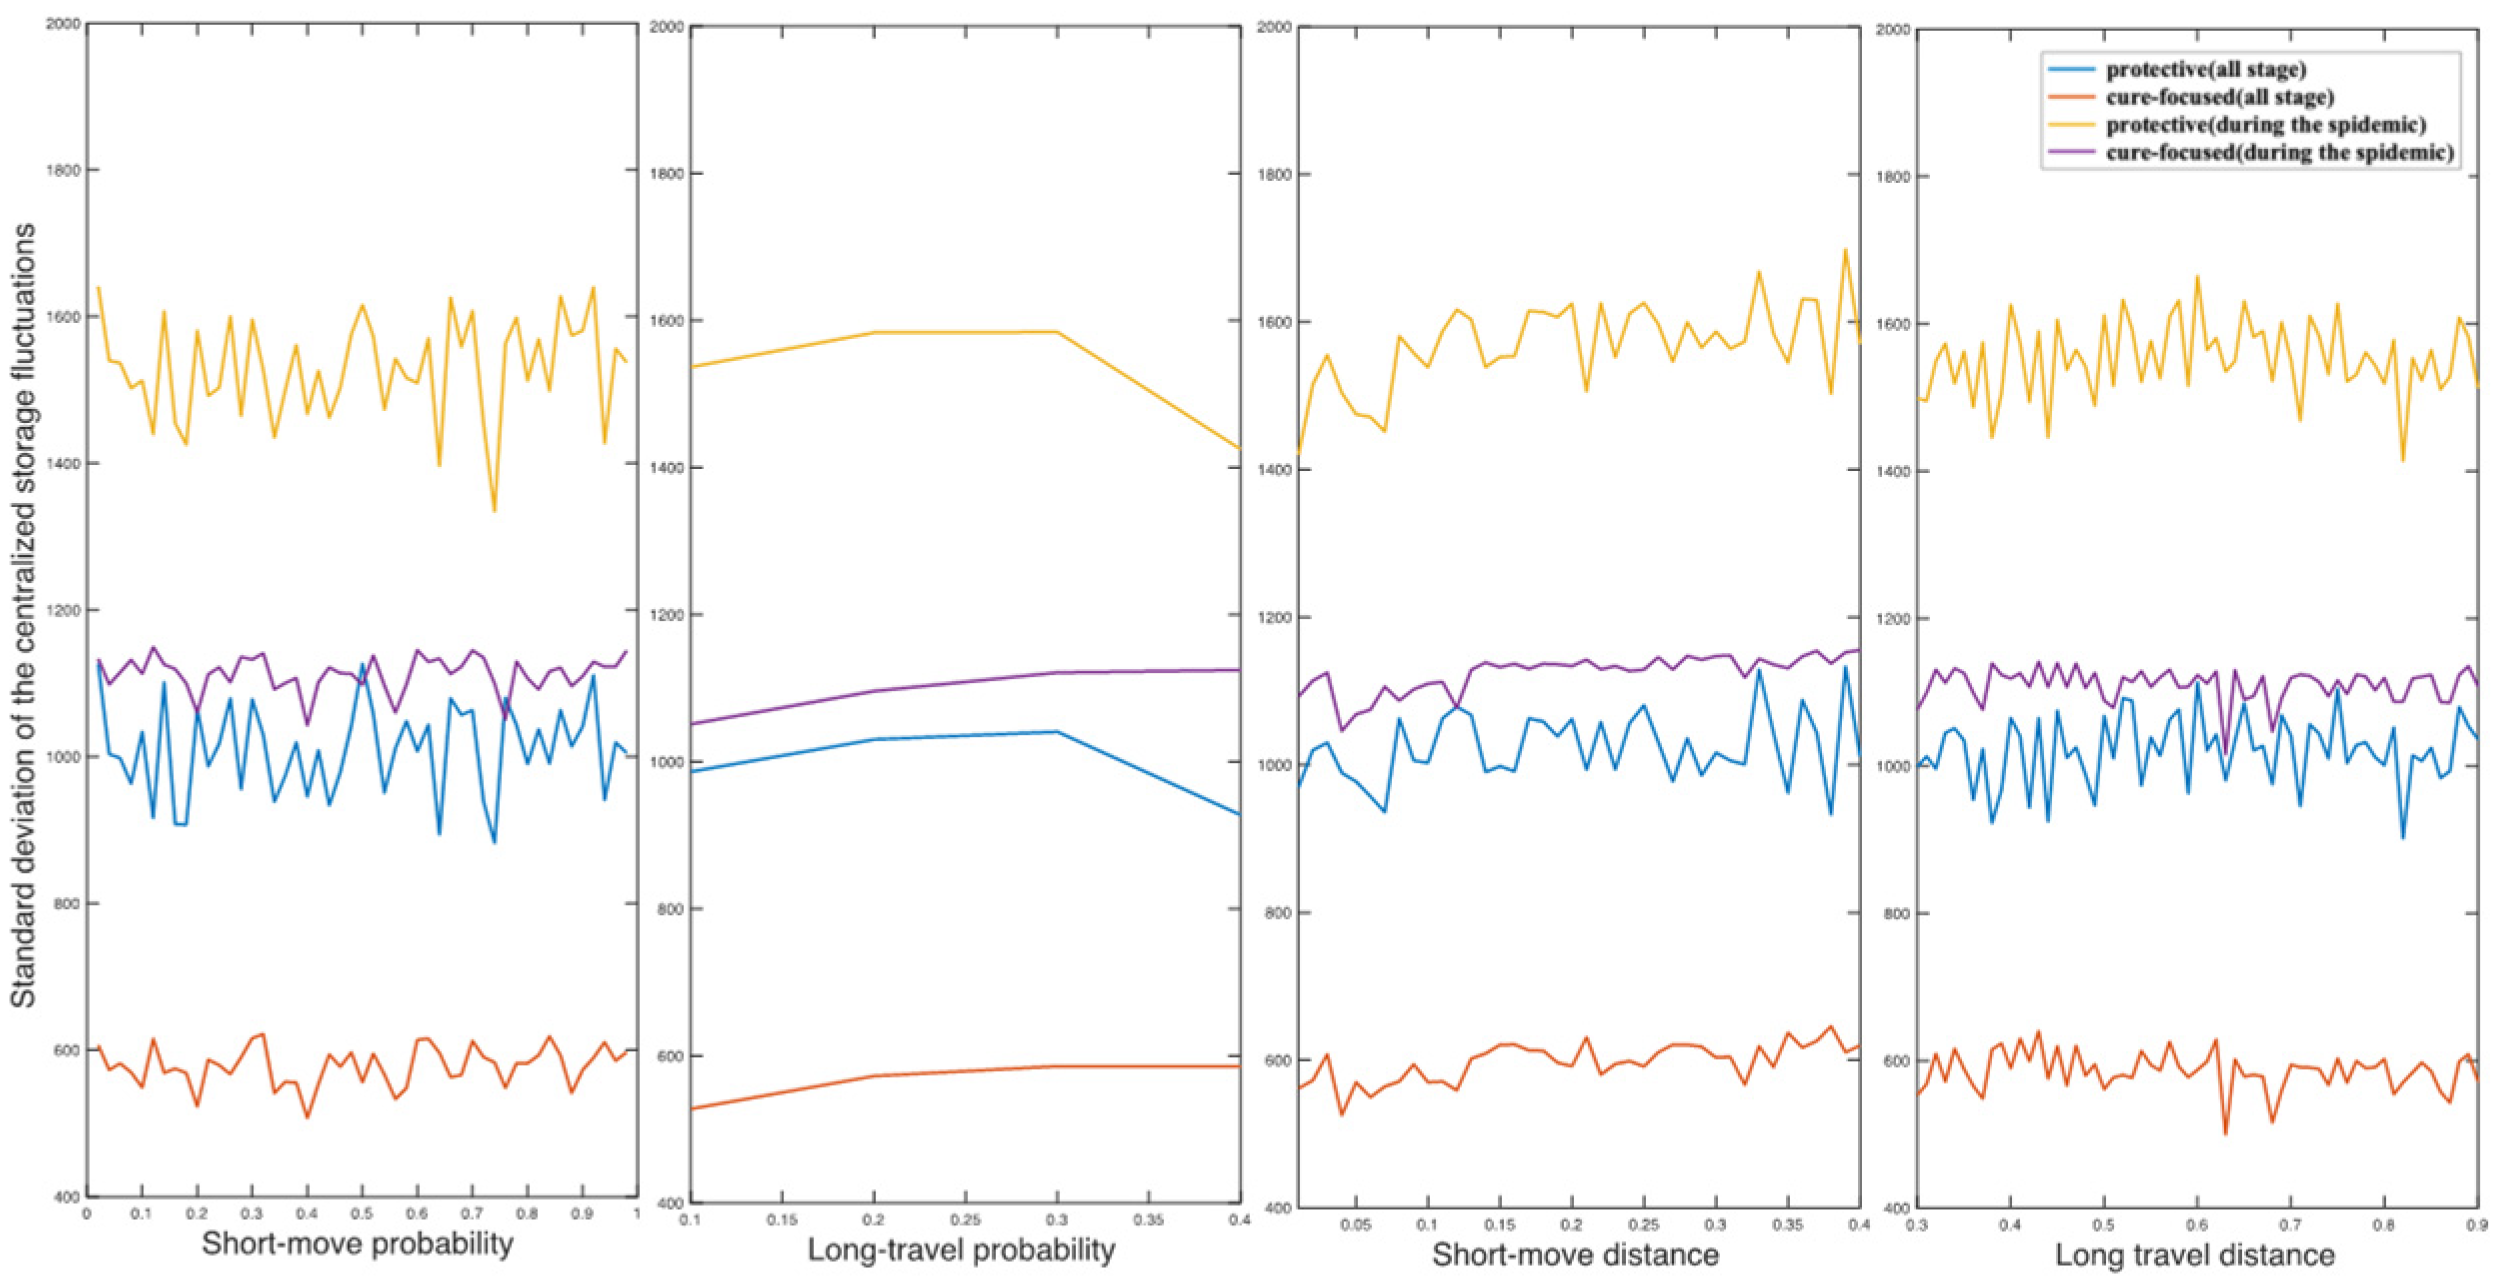
| Centralized storage fluctuations | Protective (all stage) | 32.6361 | 0.1182 | −166.3182 | 0.5824 | 93.0911 | 0.1522 | 6.4858 | 0.8186 |
| Cure-focus (all stage) | 18.6066 | 0.0506 | 187.9401 | 0.1199 | 147.9141 *** | 0.0000 | −10.9779 | 0.4638 | |
| Protective (during the epidemic) | 46.4884 | 0.0593 | −334.4764 | 0.4241 | 266.6032 *** | 0.0003 | −4.4905 | 0.8829 | |
| Cure-focus (during the epidemic) | 14.0995 | 0.1459 | 245.3338 | 0.0641 | 162.2711 *** | 0.0000 | 3.452 | 0.7927 | |
| Hypothesis | Validity | Summary |
|---|---|---|
| Hypothesis 1 | Partially verified | Findings 1 The larger the media exposure for normal information of the epidemic, the lower the fluctuation in individual material holdings (for both protective and cure-focused resources), but higher fluctuations in centralized material storage (for only protective resources). |
| Hypothesis 2 | Partially verified | Findings 2 The higher the consistency of public opinion for inaccurate information about the epidemic, the lower the fluctuation in individual material holdings (for both protective and cure-focused resources), and in centralized material storage (for only protective resources). |
| Hypothesis 3 | Verified | Findings 3 The lower the self-protection level, the higher the fluctuation in individual material holdings (for only cure-focused resources), and the centralized material storage does not fluctuate significantly. |
| Hypothesis 4 | Verified | Findings 4 The lower the restrictive protection level, the higher the fluctuation in centralized material storage (for both protective and cure-focused resources), and the individual material holding does not fluctuate significantly. |
| The Name of City Scenarios | Population Density | Media Exposure Level | Consistency of Public Opinion | Self-Protection Level | Restrictive Protection Level | Production Capacity |
|---|---|---|---|---|---|---|
| SH | Very High | High | High | High | High | Concentrated to be utilized with higher capacity conversion efficiency |
| WH | High | High | High | High | High | Concentrated to be utilized with higher capacity conversion efficiency |
| BE | High | Low | Low | Low | Low | Decentralized to be utilized with higher capacity conversion efficiency |
| BR | Low | Low | Low | Low | Low | Decentralized to be utilized with lower capacity conversion efficiency |
Disclaimer/Publisher’s Note: The statements, opinions and data contained in all publications are solely those of the individual author(s) and contributor(s) and not of MDPI and/or the editor(s). MDPI and/or the editor(s) disclaim responsibility for any injury to people or property resulting from any ideas, methods, instructions or products referred to in the content. |
© 2024 by the authors. Licensee MDPI, Basel, Switzerland. This article is an open access article distributed under the terms and conditions of the Creative Commons Attribution (CC BY) license (https://creativecommons.org/licenses/by/4.0/).
Share and Cite
Zhou, Y.; Zhang, J.; Yang, Y. Navigating Resource Challenges in Health Emergencies: The Role of Information Diffusion and Virus Spread in Demand Dynamics. Systems 2024, 12, 95. https://doi.org/10.3390/systems12030095
Zhou Y, Zhang J, Yang Y. Navigating Resource Challenges in Health Emergencies: The Role of Information Diffusion and Virus Spread in Demand Dynamics. Systems. 2024; 12(3):95. https://doi.org/10.3390/systems12030095
Chicago/Turabian StyleZhou, Yizhuo, Jianjun Zhang, and Yundan Yang. 2024. "Navigating Resource Challenges in Health Emergencies: The Role of Information Diffusion and Virus Spread in Demand Dynamics" Systems 12, no. 3: 95. https://doi.org/10.3390/systems12030095
APA StyleZhou, Y., Zhang, J., & Yang, Y. (2024). Navigating Resource Challenges in Health Emergencies: The Role of Information Diffusion and Virus Spread in Demand Dynamics. Systems, 12(3), 95. https://doi.org/10.3390/systems12030095