Article

On Shared Leadership Modeling: Contrasting Network and Dyadic Approaches

by
Giuliani Coluccio
1,* and
Sebastián Muñoz-Herrera
2
1
Faculty of Engineering, Universidad de Tarapacá, Arica 1000000, Chile
2
Faculty of Engineering, Universidad del Desarrollo, Concepción 4030000, Chile
*
Author to whom correspondence should be addressed.
Systems 2024, 12(7), 265; https://doi.org/10.3390/systems12070265
Submission received: 4 June 2024 / Revised: 12 July 2024 / Accepted: 17 July 2024 / Published: 22 July 2024

Abstract

:
Shared leadership is a dynamic phenomenon that has gained attention in behavioral science and management research over the last two decades. Network modeling is frequently employed to study this phenomenon, with the recent literature favoring a node-based approach over the traditional dyad-based approach. In this study, we investigate the differential impact of these approaches on shared leadership dynamics in student teams, specifically examining their effects on team task cohesion, team social cohesion, and team performance. We utilized multilevel structural equation modeling to compare node-based and dyad-based approaches in modeling shared leadership networks. Our findings indicate that increased leadership interactions positively influenced team performance and cohesion across both approaches. The dyad-based approach demonstrated a greater effect of leadership interactions on team performance, while leadership centrality significantly impacted performance exclusively in the node-based approach. This research contributes to the field by elucidating the differential impacts of node-based and dyad-based approaches, highlighting their strengths in capturing shared leadership dynamics and centrality effects. Our results underscore the critical importance of aligning theoretical foundations and research objectives with methodological choices in shared leadership studies. These insights enhance our understanding of shared leadership measurement and its implications for team outcomes, offering valuable guidance for future empirical investigations in this domain.

1. Introduction

Network science has helped to study different social, biological, and economic phenomena, among others [1,2,3]. Specifically, in recent years, it has taken on particular relevance in the social sciences, specifically in the study of teams [4,5,6,7]. Therefore, researchers have moved to more complex models to study team processes, antecedents, and outcomes using a network perspective as it more accurately reflects the nature and patterns of ties and information transfer between team members [5,7,8,9].
Leadership is one of the team phenomena most intensely involved in network analysis. The study of leadership has moved from conceptualizing a designated leader and his relationship with his subordinates to a collective conceptualization, where different members can assume the leader and follower roles [10,11]. In this new view, team members recurrently share information and have interconnected tasks, responsibilities, and common goals [12,13]. All researchers have used the above to study how the relationships between team members form leadership structures through two network measures: density and centrality [14,15,16].
Shared leadership is one of the most important collective leadership theories. Shared leadership is defined as a “simultaneous, ongoing, mutual influence process within a team that is characterized by ‘serial emergence’ of official as well as unofficial leaders” [17]. In the presence of shared leadership, team members jointly exert leadership influence, participate in the decision-making process, fulfill tasks that are traditionally delegated to a hierarchical leader, and, when appropriate, offer guidance to fellow members in order to facilitate the achievement of group objectives [18]. The concept of shared leadership theory highlights the idea that a leader’s nomination is more valuable and meaningful if it is bestowed upon them by their teammates, underscoring the significance of their endorsement. Scholars operationalize shared leadership using network measures like density and centrality. In this way, shared leadership has been recurrently associated with denser and decentralized leadership structures in the team, positively relating to different positive team outcomes, such as performance and trust, among others [19,20,21,22,23]. These findings are aligned with the perspectives of Wasserman and Faust [24], who argue that social network measures offer a more comprehensive understanding of team dynamics, encompassing the intricate patterns of relationships and information diffusion within it.
However, although the theory developed is consistent with some results, the operationalization used to calculate network measures may not strictly reflect the shared leadership construct. This is because the developed theory of this phenomenon focuses on the relationship between team members (dyad), while the developed methods focus on each team member (node). These different points of understanding shared leadership are critical in order to calculate network measures, given different results depending on how the network is built and, in conclusion, being able to provide findings different from those expected. Therefore, this article will focus on studying and comparing two different ways of operationalizing shared leadership using network analysis: a node approach and a dyad approach. These two ways of constructing network measures, although similar, can provide different results that, depending on the research question, must be carefully analyzed.

2. Literature Review

Leadership is a complex phenomenon within the study of organizations that have evolved. Traditionally, researchers have studied this phenomenon by focusing on the formal relationship and authority that a hierarchical leader has with their followers [10,25,26]. However, organizations are increasingly implementing structures based on teams, where there is no hierarchical leader, and even if there is a designated leader, participative processes in these teams imply that different team members can perform leadership roles. In this sense, various authors have moved to understand leadership as a team phenomenon, where different members can be seen as leaders, even if they do not have the character of formally designated leaders [27,28]. This perspective on leadership has facilitated the comprehension of team dynamics, such as situations where supervisors are not perceived as leaders or in self-managed teams without hierarchical structures [16]. This new way of conceptualizing leadership in teams as a collective process, where there is no obligation of a hierarchical leader, has generated a challenge in conceptualizing and modeling this phenomenon.
To conceptualize leadership as a collective phenomenon, it is necessary to understand how it is modeled and constructed at different levels of analysis. To conceptualize leadership in a team, various authors emphasize the importance of understanding and studying the interaction between team members [4,29]. Individuals within a team interact with each other in a leadership process; these interactions between each pair of team members build the dyadic level [30]. When aggregated to the team level, these interactions form leadership structures ranging from teams with no interactions to teams in which all team members take leadership [4].
Considering the different leadership configurations in teams, researchers have proposed various ways to measure this phenomenon. Initially, researchers occupied a theoretical distinction based on aggregation [31,32]. In aggregation, researchers aim to capture each team member’s perception regarding the team’s leadership. They calculate leadership value at the team level using each member’s individual-level leadership perception values. Subsequently, researchers have moved to model the phenomenon of leadership in teams through leadership structures using social network analysis [33]. To do this, first identify the different members of the team (node) and then quantify the leadership exercised by each member (in-degree). Considering the interactions between team members, researchers have focused on two network (team) measures, density and centralization, to study the phenomenon of leadership in teams [19,22,23,34].
The density of the leadership network (Equation (1)) reflects the “amount of leadership” in the team [35]. Let m be the number of leadership interactions between the n team members, so the density of team leadership is given by Equation (1). In this context, the number of leadership interactions is distinctly considered in the leadership exercised from member A to member B, with the leadership exercised by member B to A.
D t e a m = m n n 1
Note that the number of expected leadership connections between the team members is n(n − 1), a scenario in which all the team members exercise leadership over each other. The density values are between 0 and 1, where larger values indicate teams with more leadership.
Regarding the centralization of the network, the measure seeks to measure the variability of the leadership interactions between team members, so its purpose is to determine how centralized the leadership is in the network [35]. Consider C ^ the highest in-degree centrality (i.e., the centrality value of the member(s) perceived by all other team members as highly influential) and C i the in-degree centrality of each of the other team members. More specifically, to calculate the centralization, we thus sum the difference between each node’s in-degree centrality and the in-degree centrality of the most central node (i.e., the leader). The sum is compared with the team leadership structure in which the centrality is maximized (i.e., all members perceive only one member as the leader—known as the star/wheel structure). In this structure, the centrality of all non-leader members is zero. Then, the centrality of the graph is maximized. H represents the value of i = 1 n C ^ C i in this specific case. Therefore, the centrality of team leadership is given by Equation (2).
C t e a m = i = 1 n C ^ C i H
Centralization also has values between 0 and 1 as its domain. Smaller values reflect teams where leadership is more distributed among team members, while values closer to 1 indicate teams where leadership is concentrated in a few individuals. Figure 1 shows an example of calculating density and centrality measures for a specific team configuration.
Considering these two network measures, researchers have conceptualized different forms of leadership in teams. Shared leadership is a leadership model that has generated great attention and a relevant number of published articles [11,12]. Shared leadership is defined as a dynamic, interactive influence process among individuals in groups for which the objective is to lead one another to the achievement of group or organizational goals or both [12], and researchers have related it to denser and more decentralized leadership structures at the team level [17,33,36,37,38,39,40]. Considering this, researchers have found a relationship between the density and decentralization of leadership at the team level and various organizational outcomes, including team performance [19,20,21,22,23,28,41]. Thus, the literature on shared leadership seeks to expand the knowledge of this framework regarding its antecedents, processes, and outcomes due to its multiple benefits for teams. However, the recent literature shows that there could be a discordance between the theory and the actual conceptualization and measurement of shared leadership.
When modeled as a collective phenomenon, leadership in teams has its most basic origin in the interaction between two team members forming a dyad. The interaction between each dyad of the team builds the relational level, where these individuals seek to fit into a leadership process according to the team’s needs [4,30,42]. These interactions between team members are the basis of the process of leadership emergence at the team level, which is defined as the result of bottom-up processes whereby phenomena and constructs that originate at a lower level of analysis, through social interaction and exchange, combine, coalesce, and manifest at a higher collective level of analysis [43]. However, researchers have consistently measured team leadership by combining individual values at the team level (density and centralization) instead of building results from the dyadic level.
This way of constructing leadership in teams as a process of emergence from the dyadic level to the team level is critical to the study of shared leadership. Shared leadership is based on different team members being able to take leadership according to the team’s needs [4,11,12]. Taking this to the dyadic level, shared leadership is conceptualized as the leadership process between team members, where the roles of leader and follower are shared between individuals [4,16,44]. This process of dynamic leadership exchange in dyads (double interact), in a context of shared leadership, when added at the team level, builds higher team leadership values with less variability over time [30].
However, the theory developed presents a misalignment with the operationalization of shared leadership. This is because, as noted above, the operationalization of shared leadership builds network density and centralization measures from the values of each node in isolation rather than from the dyad as a unit of measurement. Thus, the density of leadership emergence in the team and the node’s centrality is captured if you take a node approach. To illustrate this, we present Figure 2 to provide a clearer view of this problem. The different sociograms represent four teams of four members each (A, B, C, D); for example, in team 1, individual A exercises leadership over individuals B, C, and D; individual B exercises leadership over individual C; individual C exercises leadership on individual D; individual D exercises leadership on individual C. By calculating the measures of network density and centralization classically using t, the nodes, we can see that the network density in this example is 0.5, and the centrality is 0.67, representing medium levels of shared leadership; however, if we adjust to the theory, only one dyad reflects double interaction, so shared leadership in this team would be low. This is more critical if we see team 4; in this team, the density using a node approach is 0.33, and the leadership is fully distributed (centrality = 0), but if we use a dyadic approach in this team, shared leadership does not exist because the interactions between individuals are in only one way. This simple example shows us that the operationalization of shared leadership occupying the network’s density and centrality is inconsistent with the literature.
Understanding this problem, DeRue [16] proposed an alternative approach to measuring shared leadership that is more aligned with the theory. The proposed operationalization transforms the network based on leader emergence (directed graph) into a network based on double interactions (undirected graph). This transformation implies that when no one or only one team member emerges as a leader, both nodes give the 0 value in the dyad. This way, we explain the steps to transform the network using a dyadic approach.
  • Assess the amount of leadership perceived by each team member concerning each team member. Thus, we denote leadership evaluation from individual A towards individual B as X A B .
  • Determine the value of the double interaction in each dyad using Equation (3), which shows, as an example, the dyad formed between individual A and team member B.
D o u b l e   i n t e r a c t = D z = 0 ,   i f   X A B   o r   X B A = 0   1 , o t h e r w i s e
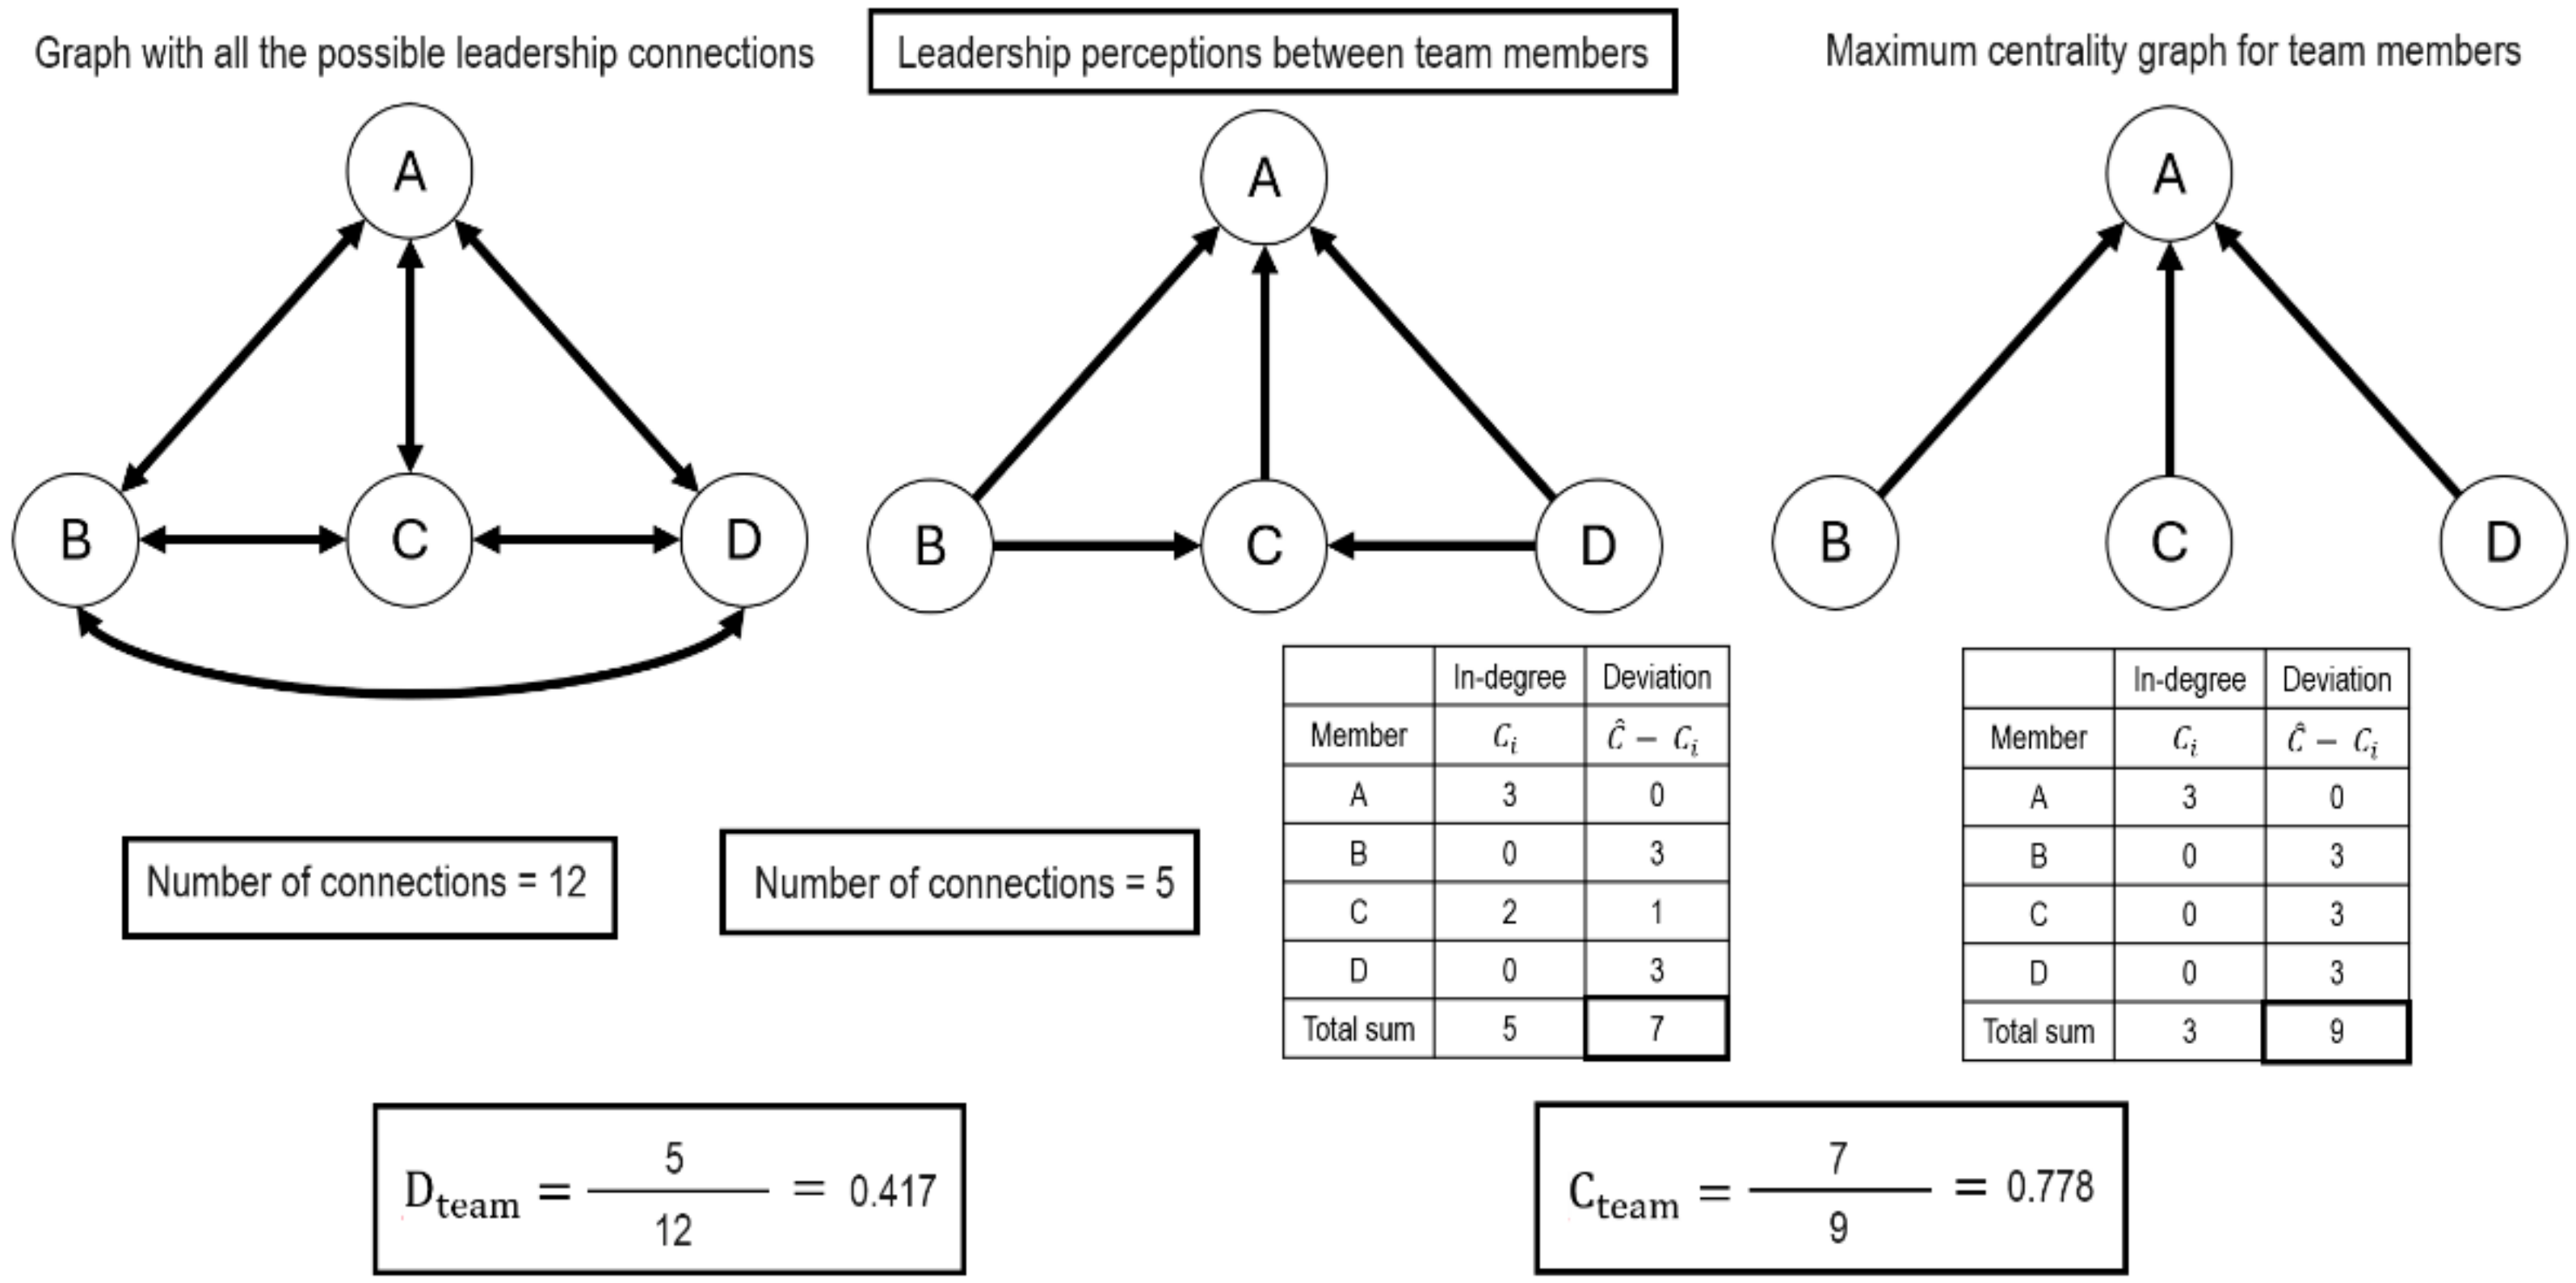
  • To calculate the network’s density, we aggregate the values of the dyads’ double interactions using a simple average, equivalent to the formula proposed by DeRue. When d is the number of dyads in the network.
L e a d e r s h i p   d e n s i t y = i = D d D z d
  • DeRue [16] proposes using a centralization measure using the node value but considering the double interactions between team members to determine the variability of shared leadership in the network. Thus, the value of node a (Ca) equals the sum of all the double interactions that this team member has. This value is compared with the maximum value of the network to determine the centralization value, as we see in Equation (5). Lower values of centralization indicate more shared leadership in the team.
D e g r e e   o f   l e a d e r s h i p   c e n t r a l i z a t i o n = i = 1 n C ^ C i ˇ n 1 n 2
Using an undirected graph would be more aligned with the developed literature, but researchers generally have not employed this operationalization in the study of shared leadership. In this way, below, we propose a study that compares the effect of shared leadership using a directed graph and then occupying an undirected one.
To compare the different ways of operationalizing shared leadership, we carried out a study relating to this construct as a predictor of team social cohesion, task cohesion, and team performance. The literature has previously studied these relationships [19,21,30,36,45].
Team performance is enhanced by shared leadership through encouraging collaboration, boosting engagement, and utilizing diverse skills and perspectives, ultimately leading to better performance outcomes. Research suggests that shared leadership fosters better team dynamics by promoting open communication and mutual support among team members [18]. Increased innovation and problem-solving capabilities are a result of the collaborative approach, as it effectively utilizes diverse viewpoints and expertise [31]. As a result, teams that practice shared leadership are more prepared to handle and overcome obstacles, allowing them to successfully reach their objectives and ultimately outperform organizations with traditional, hierarchical leadership structures.
Higher levels of shared leadership are related to higher levels of team social cohesion, as shared leadership fosters an environment of collaboration, mutual support, and shared responsibility, which strengthens interpersonal relationships and unifies the team. Research indicates that when leadership responsibilities are distributed among team members, it enhances open communication and builds trust and mutual respect [18]. This inclusive leadership style promotes social cohesion by making team members feel more connected and committed to one another and to the team’s collective goals [31]. Furthermore, shared leadership has been shown to reduce conflicts and improve interpersonal dynamics, as responsibilities and recognition are more evenly distributed [22]. Consequently, teams that practice higher levels of shared leadership are more likely to experience increased social cohesion, creating a supportive and cohesive team environment.
Higher levels of shared leadership are related to higher levels of team task cohesion, as shared leadership encourages greater ownership and accountability among team members, resulting in more coordinated and committed efforts toward achieving team goals. Research shows that when leadership roles are distributed, team members are more likely to take initiative and actively contribute to the planning and execution of tasks [46]. This distribution of leadership responsibilities enhances individual investment in team outcomes, fostering a sense of shared purpose and unity in pursuing objectives [47]. Additionally, shared leadership reduces dependency on a single leader, allowing for more adaptive and flexible responses to task demands, which further strengthens task cohesion [48]. As a result, teams practicing higher levels of shared leadership demonstrate increased task cohesion, improving their effectiveness and efficiency in accomplishing goals. In summary, we have three hypotheses in this study:
H1. 
Higher levels of shared leadership, i.e., a denser and more decentralized network, is related to higher levels of team performance.
H2. 
Higher levels of shared leadership, i.e., a denser and more decentralized network, is related to higher levels of team social cohesion.
H3. 
Higher levels of shared leadership, i.e., a denser and more decentralized network, is related to higher levels of team task cohesion.

3. Materials and Methods

3.1. Procedure

This study encompassed the entire cohort of first-year industrial engineering students at the Universidad de Tarapacá (Chile) matriculating in 2023. The research design employed a comprehensive population survey with no exclusion criteria, yielding a study population of 177 participants. Given the subjects’ status as novice undergraduates, it was postulated that they possessed minimal prior collaborative experience, thus mitigating the likelihood of pre-established leadership dynamics. A randomized team allocation protocol was implemented to control further potential confounding variables related to prior interpersonal relationships, stratifying participants into groups of three to four individuals. This methodological approach minimized the probability of pre-existing collaborative associations among team members. Table 1 delineates the descriptive statistics pertinent to the team’s data collection process, providing a quantitative preliminary overview of the population.
Upon team formation, participants engaged in collaborative tasks designed to foster interpersonal communication and teamwork over three weeks. This methodological approach emphasized the role of shared leadership in completing a multifaceted project comprising a comprehensive report on an industrial engineering-related problem, an Ishikawa diagram elucidating the problem’s primary causal factors, and a proposed solution to the identified issue.
Following ethical research practices, participants provided informed consent at the commencement of the course, acknowledging their understanding of the study’s objectives. Subsequently, a questionnaire was administered following the submission of the final report. This instrument required each team member to assess their perceptions of social and task cohesion within their respective teams. Additionally, employing a round-robin methodology, each participant evaluated their teammates’ leadership behaviors during the task execution.
The questionnaire was administered before disseminating academic grades to mitigate potential response biases. Notably, the study achieved full participation, with all enrolled students consenting to participate and a 100% response rate for the questionnaire.
To mitigate Common Method Bias (CMB), we implemented a key procedural remedy outlined by Podsakoff et al. [49,50]. Our approach focused on protecting respondent anonymity and reducing evaluation apprehension. We assured participants of complete confidentiality and emphasized that there were no right or wrong answers. Participants were informed that their responses would be aggregated, ensuring no individual data would be identifiable. To further reinforce anonymity, we employed anonymous identification codes. Moreover, we explicitly stated that the results would be used solely for research purposes rather than individual assessment, thus reducing evaluation apprehension. These measures were strategically implemented to encourage honest responses and minimize social desirability bias. Additionally, we utilized a validated questionnaire [51] that has been demonstrated to address inherent issues of bias. This comprehensive approach to data collection aligns with best practices in mitigating CMB and enhancing the validity of self-reported measures in organizational research.

3.2. Measures

Shared Leadership. The participants received the following definition of leadership: “Leadership is the process of influencing others to understand and agree about what needs to be done and how to do it, and the process of facilitating individual and collective efforts to accomplish shared objectives” [52]. Having this definition and following Carson et al. [18], each student answered if they perceived leadership from each teammate during the task developed. If the students answer yes to this question, it is coded as one; otherwise, it is coded as zero. We used each node’s measurement to calculate the density and centrality measures according to the node and dyad approach of shared leadership.
Team Social Cohesion. We measured social cohesion using five items derived from the Group Environment Questionnaire in the dimension of social cohesion [51] (Cronbach alpha: 0.868). We asked participants to indicate their level of agreement with each statement on a 5-point scale (1 = strongly disagree, 5 = strongly agree). One such statement was: “Our team likes to spend time together after work”.
Team Task Cohesion. We measured task cohesion using four items derived from the Group Environment Questionnaire in the dimension of task cohesion [51] (Cronbach alpha: 0.855). We asked participants to indicate their level of agreement with each statement on a 5-point scale (1 = strongly disagree, 5 = strongly agree). One such statement was: “Our crew is united in trying to reach its performance goals”.
Team Performance. A committee of two professors independently evaluated the work that the teams developed on a scale from 1.0 to 7.0. Each professor evaluates the different sections of the written report (problem definition, study of causes and effects, potential solution). The average of the two teachers’ grades is team performance.
In our analysis, we utilize the shared leadership and team performance measures as observed variables due to their single-item nature. We operationalize the variables of team social cohesion and team task cohesion as latent variables by utilizing the measures from the questionnaires (five measures for team social cohesion and four measures for team task cohesion).

4. Results

Before comparing the two operationalizations of shared leadership, we compared the match between densities using a node approach and a dyadic approach. Table 2 shows that only ten teams match the node density approach with the dyad density approach (22.2%) (this result excludes teams with a density equal to 1). This result suggests that the choice of the operationalization of shared leadership is not trivial and could influence the proposed relationships.
We calculate the descriptive statistics of the different variables at the team level (mean, standard deviation, and bivariate correlation). To determine the value of team social cohesion and team task cohesion, we first calculate the individual value as the average of the items measured. After calculating everyone’s value, we calculate the team value by taking the average of all team members. The descriptive statistics are in Table 3.
To test the difference between the node approach and the dyad approach operationalization, we run two multilevel structural equation models (MSEMs). Using a node approach, the first MSEM tests the relationship between density and centralization with team social cohesion, task cohesion, and performance. The second MSEM tests the same relationships but using a dyad approach. Both models use task and social cohesion as control variables. At the team level, we tested the relationship previously described between shared leadership, team cohesion, and team performance.
As a prior step to the multilevel analysis, we performed a confirmatory factor analysis (CFA) at the individual level, including social and task cohesion. We present the results of the CFA in Table 4. Regarding the convergent and discriminant validity of these constructs, we can point out that both task cohesion (AVE = 0.601; CR = 0.857) and social cohesion (AVE = 0.572; CR = 0.869) are higher than the cut-off points specified by the literature (CR > 0.7; AVE > 0.5) [53]. Regarding the fit indicators, the values obtained of CFI = 0.988, TLI = 0.983, RMSEA = 0.044, and SRMR = 0.036 show a good fit of the model according to the cut-off points specified by the literature (CFI > 0.9; TLI > 0.8; RMSEA and SRMR < 0.08) [54,55,56]. Figure 3 presents the summary of a CFA at the individual level.
In order to clear the distinction that exists between individual-level variance and team-level variance, we calculated the Intra-Class Correlation (ICC) of the observed variables. In this way, all ICC values in both models are greater than 0.05, so the multilevel analysis is justified [57]. Table 5 shows the ICC values.
After having justified the multilevel modeling, we compare the two approaches. In Model 1, we operationalized shared leadership using a node approach. In this approach, the model fit indices show a good fit, considering the cut-off points indicated in the literature (CFI = 0.998; TLI = 0.997; RMSEA = 0.011; SRMRwithin = 0.052; SRMRbetween = 0.064) [54,57]. In Table 6, we can see the results of the operationalization of shared leadership using a node approach. When analyzing density using a node approach, our results show that density was strongly and positively associated with team task cohesion (β = 0.469; p < 0.01) and team performance (β = 0.268; p < 0.05). However, no relationship was found with team social cohesion. Regarding centrality, we only found a negative relationship with team performance (β = −0.346; p < 0.05).
In Model 2, we operationalized shared leadership using a dyad approach. In this approach, the fit index was also good (CFI = 0.992; TLI = 0.989; RMSEA = 0.022; SRMRwithin = 0.053; SRMRbetween = 0.062) [54,57]. Table 7 shows the results of the operationalization of shared leadership using a dyad approach. When analyzing density using a node approach, our results show that density was strongly and positively associated with team task cohesion (β = 0.453; p < 0.05), team social cohesion (β = 0.402; p < 0.05), and team performance (β = 0.685; p < 0.01). Regarding centrality, we do not find any relation between the different outcomes.
In summary, comparing these results, we can see that the effect size of the dyad approach is more than twice that of the node approach in the relationship between density and team performance. This suggests that teams with more double leadership interactions in the network explain team performance with greater power than the aggregate emergence of leadership in the network. When analyzing the connection between centrality and team performance, our findings show that teams with a higher decentralization in leadership emergence are associated with higher levels of team performance. Nevertheless, this relation disappears when we represent the network as an undirected graph.
When we studied the relationship between shared leadership and team cohesion, our results showed that the dyad density approach positively correlated with team tasks and social cohesion. However, the node density approach only relates to team task cohesion. These results suggest that using an undirected graph for quantifying leadership quantity yields a more adequate representation of team cohesion variability than a directed graph.

5. Discussion

Within the study of shared leadership, various methods have been employed to measure it, with network analysis being the most prevalent. Network measures, specifically density and centrality, are typically used to operationalize shared leadership. Traditionally, researchers have modeled the network as a directed graph to calculate density and centrality [18,37]. However, recent studies suggest that shared leadership is based on double leadership interactions between team members, implying the need to model the network as an undirected graph [4,10]. This perspective significantly impacts the calculation of density and centrality measures.
One of our principal findings is the effectiveness of the dyad approach in capturing shared leadership dynamics. Consistent with previous studies, we found a robust and positive relation between leadership network density and team performance [18,19,22,23,37]. The dyad approach outperformed in capturing the intricate dynamics of shared leadership within teams. The substantial increase in effect size found in the correlation between dyadic density and team performance further supports the concept that analyzing double leadership interactions offers more profound insights into how shared leadership influences team effectiveness.
Network centralization, another characteristic of shared leadership, is commonly associated with team performance. Our findings align with previous research emphasizing the positive impact of decentralized leadership structures on team performance [39,46]. However, our research suggests that the chosen operationalization is noteworthy. The node approach was the only one to show significance in the relationship between centrality and team performance. In contrast, the density examination revealed that both approaches influenced the team’s performance. The dyad approach falls short in capturing the essence of shared leadership concerning centrality because it fails to account for nodes that exhibit leadership without explicitly acknowledging it.
Our study reinforces the significance of methodological decisions in operationalizing shared leadership constructs, particularly in their impact on the team environment. Previous studies have consistently highlighted the crucial role of shared leadership in creating cohesive teams [31,39]. Our findings align with this research, demonstrating a positive relationship between the dyad density approach and team task and social cohesion. However, the limited relationship between the node density approach and team cohesion underscores the need for more nuanced measurement approaches that capture the full spectrum of shared leadership dynamics within teams.
Furthermore, our research found no significant relationship between centrality and team cohesion. This suggests that while network centrality may indicate the relative importance of certain team members, it may not fully capture the complex nature of interactions contributing to team cohesion in this sample. Our results also showed a high effect size of density on team cohesion, indicating that the number of leadership interactions within the team can significantly impact social cohesion. This effect of density may exert a stronger influence on predicting team cohesion, potentially overshadowing the contribution of centrality in this context. These findings highlight the importance of considering the intricacy of team dynamics and indicate that the choice of the measure of network structure can influence the results obtained.

6. Limitations and Future Studies

Our study has several limitations that should be addressed in future research. First, the generalizability of our findings is limited by the specific context. Future studies should examine a wider range of team settings to generalize our results. Additionally, our study relied on self-reported measures of leadership interactions, which may be subject to bias. Incorporating objective measures or third-party observations could enhance the validity of the findings.
Future research should further explore the choice between the node and dyad approaches in studying shared leadership in teams. Given the complexity of team dynamics and the multifaceted nature of shared leadership, it is crucial to investigate how each approach provides a more comprehensive understanding of shared leadership in the context of teamwork. It is essential to examine how the choice of approach relates to the research question and study objectives. For example, if the aim is to understand how leadership interactions among peers emerge and develop within the team, a dyad approach may be more relevant. Conversely, if the goal is to analyze the relative position of specific individuals in the leadership network, a node approach might be more suitable. Furthermore, it would be beneficial to investigate how other factors, such as network structure and the quality of leadership interactions, interact with the chosen methodological approach to influence the understanding of shared leadership in work teams.

7. Conclusions

Our study highlights the critical role of methodological choices in understanding shared leadership and its impact on team outcomes. The dyad approach proved effective in capturing shared leadership dynamics and their influence on team performance and cohesion. While useful for examining centrality, the node approach may not fully capture the essence of shared leadership interactions. These findings underscore the importance of aligning methodological decisions with specific research questions and objectives to comprehensively understand shared leadership within teams. Future research should continue to explore the nuanced dynamics of shared leadership and refine measurement approaches to better capture the complexity of leadership interactions in various team contexts.
In this study, network analysis analyzes two different ways of operationalizing shared leadership. Considering the literature developed and our results, we can conclude that, to study shared leadership, the operationalization of this construct depends on the research question. In this way, if the research question seeks to understand the effect of the amount of team leadership, the most appropriate operationalization would use undirected graphs. If the research question focuses on the distribution of leadership, the operationalization will use directed graphs. Thus, to have greater clarity in the operationalization of shared leadership, studies should advance in two main directions. First, to clarify any proposed unsupported relationships, such as the relationship between personality dimensions and shared leadership [58,59,60], and second, to develop and test an indicator that integrates both the quantity and distribution of leadership simultaneously, as some recent studies propose [61]. In summary, it is important to acknowledge that the choice between the node and dyad approach may have implications for the results and their interpretation. Thus, carefully considering the theoretical and methodological underpinnings behind such a choice is recommended.

Author Contributions

Conceptualization, G.C. and S.M.-H.; methodology, G.C.; software, G.C.; validation, G.C. and S.M.-H.; formal analysis, G.C. and S.M.-H.; investigation, G.C. and S.M.-H.; resources, G.C.; data curation, G.C.; writing—original draft preparation, G.C. and S.M.-H.; writing—review and editing, G.C. and S.M.-H.; visualization, S.M.-H.; funding acquisition, G.C. All authors have read and agreed to the published version of the manuscript.

Funding

This research was funded by the University of Tarapacá, grant number UTAmayor N°34-2022, and the APC was funded by the University of Tarapacá.

Data Availability Statement

The original contributions presented in the study are included in the article, further inquiries can be directed to the corresponding author.

Conflicts of Interest

The authors declare no conflicts of interest. The funders had no role in the design of the study; in the collection, analyses, or interpretation of data; in the writing of the manuscript; or in the decision to publish the results.

References

  1. Perry-Smith, J.E.; Shalley, C.E. The social side of creativity: A static and dynamic social network perspective. Acad. Manag. Rev. 2003, 28, 89–106. [Google Scholar] [CrossRef]
  2. Yousefi Nooraie, R.; Sale, J.E.M.; Marin, A.; Ross, L.E. Social Network Analysis: An Example of Fusion Between Quantitative and Qualitative Methods. J. Mix. Methods Res. 2020, 14, 110–124. [Google Scholar] [CrossRef]
  3. Zhang, L.; Qiu, H.; Chen, J.; Zhou, W.; Li, H. How Do Heterogeneous Networks Affect a Firm’s Innovation Performance? A Research Analysis Based on Clustering and Classification. Entropy 2023, 25, 1560. [Google Scholar] [CrossRef] [PubMed]
  4. DeRue, D.S. Adaptive leadership theory: Leading and following as a complex adaptive process. Res. Organ. Behav. 2011, 31, 125–150. [Google Scholar] [CrossRef]
  5. Friedrich, T.L.; Griffith, J.A.; Mumford, M.D. Collective leadership behaviors: Evaluating the leader, team network, and problem situation characteristics that influence their use. Leadersh. Q. 2016, 27, 312–333. [Google Scholar] [CrossRef]
  6. Gilbert, F.; Simonetto, P.; Zaidi, F.; Jourdan, F.; Bourqui, R. Communities and hierarchical structures in dynamic social networks: Analysis and visualization. Soc. Netw. Anal. Min. 2011, 1, 83–95. [Google Scholar] [CrossRef]
  7. Sparrowe, R.T.; Liden, R.C.; Wayne, S.J.; Kraimer, M. Social Networks and the Performance of Individuals and Groups. Acad. Manag. J. 2001, 44, 316–325. [Google Scholar] [CrossRef]
  8. Carter, D.R.; DeChurch, L.A.; Braun, M.T.; Contractor, N.S. Social network approaches to leadership: An integrative conceptual review. J. Appl. Psychol. 2015, 100, 597–622. [Google Scholar] [CrossRef] [PubMed]
  9. O’Malley, A.J.; Marsden, P.V. The analysis of social networks. Health Serv. Outcomes Res. Methodol. 2008, 8, 222–269. [Google Scholar] [CrossRef]
  10. Adriasola, E.; Lord, R.G. From a leader and a follower to shared leadership: An identity-based structural model for shared leadership emergence. In The Connecting Leader: Serving Concurrently as. Leader and a Follower; Jaser, Z., Ed.; Information Age: Charlotte, NC, USA, 2020. [Google Scholar]
  11. Yammarino, F.J.; Salas, E.; Serban, A.; Shirreffs, K.; Shuffler, M.L. Collectivistic Leadership Approaches: Putting the “We” in Leadership Science and Practice. Ind. Organ. Psychol. 2012, 5, 382–402. [Google Scholar] [CrossRef]
  12. Pearce, C.L.; Conger, J.A. (Eds.) Shared Leadership: Reframing the Hows and Whys of Leadership; SAGE Publications, Inc.: New York, NY, USA, 2003. [Google Scholar] [CrossRef]
  13. Pearce, C.L.; Manz, C.C.; Akanno, S. Searching for the holy grail of management development and sustainability: Is shared leadership development the answer? J. Manag. Dev. 2013, 32, 247–257. [Google Scholar] [CrossRef]
  14. Balkundi, P.; Kilduff, M. The ties that lead: A social network approach to leadership. Leadersh. Q. 2006, 17, 419–439. [Google Scholar] [CrossRef]
  15. Cullen-Lester, K.L.; Maupin, C.K.; Carter, D.R. Incorporating social networks into leadership development: A conceptual model and evaluation of research and practice. In Leadership Quarterly; Elsevier Inc.: Amsterdam, The Netherlands, 2017; Volume 28, pp. 130–152. [Google Scholar] [CrossRef]
  16. DeRue, D.S.; Nahrgang, J.D.; Ashford, S.J. Interpersonal perceptions and the emergence of leadership structures in groups: A network perspective. Organ. Sci. 2015, 26, 1192–1209. [Google Scholar] [CrossRef]
  17. Pearce, C.L. The future of leadership: Combining vertical and shared leadership to transform knowledge work. In Academy of Management Perspectives; Academy of Management: Briarcliff Manor, NY, USA, 2004. [Google Scholar] [CrossRef]
  18. Carson, J.B.; Tesluk, P.E.; Marrone, J.A. Shared leadership in teams: An investigation of antecedent conditions and performance. Acad. Manag. J. 2007, 50, 1217–1234. [Google Scholar] [CrossRef]
  19. D’Innocenzo, L.; Mathieu, J.E.; Kukenberger, M.R. A Meta-Analysis of Different Forms of Shared Leadership–Team Performance Relations. J. Manag. 2016, 42, 1964–1991. [Google Scholar] [CrossRef]
  20. Drescher, M.A.; Korsgaard, M.A.; Welpe, I.M.; Picot, A.; Wigand, R.T. The dynamics of shared leadership: Building trust and enhancing performance. J. Appl. Psychol. 2014, 99, 771–783. [Google Scholar] [CrossRef] [PubMed]
  21. Nicolaides, V.C.; LaPort, K.A.; Chen, T.R.; Tomassetti, A.J.; Weis, E.J.; Zaccaro, S.J.; Cortina, J.M. The shared leadership of teams: A meta-analysis of proximal, distal, and moderating relationships. Leadersh. Q. 2014, 25, 923–942. [Google Scholar] [CrossRef]
  22. Wang, D.; Waldman, D.A.; Zhang, Z. A meta-analysis of shared leadership and team effectiveness. J. Appl. Psychol. 2014, 99, 181–198. [Google Scholar] [CrossRef] [PubMed]
  23. Wu, Q.; Cormican, K.; Chen, G. A Meta-Analysis of Shared Leadership: Antecedents, Consequences, and Moderators. J. Leadersh. Organ. Stud. 2020, 27, 49–64. [Google Scholar] [CrossRef]
  24. Wasserman, S.; Faust, K. Social Network Analysis; Cambridge University Press: Cambridge, UK, 25 November 1994. [Google Scholar] [CrossRef]
  25. Wang, Y.; Jin, X. Exploring the Role of Shared Leadership on Job Performance in IT Industries: Testing the Moderated Mediation Model. Sustainability 2023, 15, 16767. [Google Scholar] [CrossRef]
  26. Hoch, J.E.; Kozlowski, S.W.J. Leading virtual teams: Hierarchical leadership, structural supports, and shared team leadership. J. Appl. Psychol. 2014, 99, 390–403. [Google Scholar] [CrossRef] [PubMed]
  27. Han, S.J.; Lee, Y.; Beyerlein, M.; Kolb, J. Shared leadership in teams. Team Perform. Manag. Int. J. 2018, 24, 150–168. [Google Scholar] [CrossRef]
  28. Lorinkova, N.M.; Bartol, K.M. Shared Leadership Development and Team Performance: A New Look at the Dynamics of Shared Leadership. Pers. Psychol. 2021, 74, 77–107. [Google Scholar] [CrossRef]
  29. Paunova, M. The emergence of individual and collective leadership in task groups: A matter of achievement and ascription. Leadersh. Q. 2015, 26, 935–957. [Google Scholar] [CrossRef]
  30. Beenen, G.; Todorova, G.; Pichler, S.; Riggio, R.E. Reconceptualizing Multilevel Leader-Follower Shared Outcomes. J. Leadersh. Organ. Stud. 2022, 29, 289–305. [Google Scholar] [CrossRef]
  31. Ensley, M.D.; Hmieleski, K.M.; Pearce, C.L. The importance of vertical and shared leadership within new venture top management teams: Implications for the performance of startups. Leadersh. Q. 2006, 17, 217–231. [Google Scholar] [CrossRef]
  32. Gupta, V.K.; Huang, R.; Niranjan, S. A Longitudinal Examination of the Relationship Between Team Leadership and Performance. J. Leadersh. Organ. Stud. 2010, 17, 335–350. [Google Scholar] [CrossRef]
  33. Mayo, M.; Meindl, J.R.; Pastor, J.C. Shared Leadership in Work Teams: A Social Network Approach. In Shared Leadership: Reframing the Hows and Whys of Leadership; Pearce, C.L., Conger, J.A., Eds.; Sage: Newcastle upon Tyne, UK, 2003; pp. 193–214. [Google Scholar]
  34. Coluccio, G.; Muñoz-Pareja, M. Estudio del desempeño y liderazgo de estudiantes de ingeniería industrial usando análisis de redes sociales. Ingeniare. Rev. Chil. Ing. 2021, 29, 735–742. [Google Scholar] [CrossRef]
  35. Gockel, C.; Werth, L. Measuring and modeling shared leadership: Traditional approaches and new ideas. J. Pers. Psychol. 2011, 9, 172–180. [Google Scholar] [CrossRef]
  36. Mathieu, J.E.; Kukenberger, M.R.; D’Innocenzo, L.; Reilly, G. Modeling reciprocal team cohesion–performance relationships, as impacted by shared leadership and members’ competence. J. Appl. Psychol. 2015, 100, 713–734. [Google Scholar] [CrossRef] [PubMed]
  37. Mehra, A.; Smith, B.; Dixon, A.L.; Robertson, B. Distributed leadership in teams: The network of leadership perceptions and team performance. Leadersh. Q. 2006, 17, 232–245. [Google Scholar] [CrossRef]
  38. Serban, A.; Roberts, A.J.B. Exploring antecedents and outcomes of shared leadership in a creative context: A mixed-methods approach. Leadersh. Q. 2016, 27, 181–199. [Google Scholar] [CrossRef]
  39. Small, E.E.; Rentsch, J.R. Shared Leadership: A Social Network Analysis. Ph.D. Thesis, University of Tennessee, Knoxville, TN, USA, 2007. [Google Scholar]
  40. Sullivan, S.D.; Lungeanu, A.; Dechurch, L.A.; Contractor, N.S. Space, time, and the development of shared leadership networks in multiteam systems. Netw. Sci. 2015, 3, 124–155. [Google Scholar] [CrossRef]
  41. Barnett, R.C.; Weidenfeller, N.K. Shared Leadership and Team Performance. Adv. Dev. Hum. Resour. 2016, 18, 334–351. [Google Scholar] [CrossRef]
  42. Kim, J.; Yammarino, F.J.; Dionne, S.D.; Eckardt, R.; Cheong, M.; Tsai, C.-Y.; Guo, J.; Park, J.W. State-of-the-science review of leader-follower dyads research. Leadersh. Q. 2020, 31, 101306. [Google Scholar] [CrossRef]
  43. Kozlowski, S.W.J.; Chao, G.T. The dynamics of emergence: Cognition and cohesion in work teams. Manag. Decis. Econ. 2012, 33, 335–354. [Google Scholar] [CrossRef]
  44. DeRue, D.S.; Ashford, S.J. Who will lead, and who will follow? A social process of leadership identity construction in organizations. Acad. Manag. Rev. 2010, 35, 627–647. [Google Scholar] [CrossRef]
  45. Daspit, J.; Tillman, C.J.; Boyd, N.G.; Mckee, V. Cross-functional team effectiveness: An examination of internal team environment, shared leadership, and cohesion influences. Team Perform. Manag. 2013, 19, 34–56. [Google Scholar] [CrossRef]
  46. Avolio, B.J.; Walumbwa, F.O.; Weber, T.J. Leadership: Current Theories, Research, and Future Directions. In Annual Review of Psychology; Annual Reviews: San Mateo, CA, USA, 1 January 2009. [Google Scholar] [CrossRef]
  47. Pearce, C.L.; Sims, H.P. Vertical versus shared leadership as predictors of the effectiveness of change management teams: An examination of aversive, directive, transactional, transformational, and empowering leader behaviors. Group Dyn. Theory Res. Pract. 2002, 6, 172–197. [Google Scholar] [CrossRef]
  48. Bergman, J.Z.; Rentsch, J.R.; Small, E.E.; Davenport, S.W.; Bergman, S.M. The Shared Leadership Process in Decision-Making Teams. J. Soc. Psychol. 2012, 152, 17–42. [Google Scholar] [CrossRef]
  49. Podsakoff, P.M.; MacKenzie, S.B.; Lee, J.-Y.; Podsakoff, N.P. Common method biases in behavioral research: A critical review of the literature and recommended remedies. J. Appl. Psychol. 2003, 88, 879–903. [Google Scholar] [CrossRef] [PubMed]
  50. Podsakoff, P.M.; Podsakoff, N.P.; Williams, L.J.; Huang, C.; Yang, J. Common Method Bias: It’s Bad, It’s Complex, It’s Widespread, and It’s Not Easy to Fix. In Annual Review of Organizational Psychology and Organizational Behavior; Annual Reviews: San Mateo, CA, USA, 22 January 2024. [Google Scholar] [CrossRef]
  51. Carron, A.V.; Widmeyer, W.N.; Brawley, L.R. The Development of an Instrument to Assess Cohesion in Sport Teams: The Group Environment Questionnaire. J. Sport Psychol. 1985, 7, 244–266. [Google Scholar] [CrossRef]
  52. Yukl, G. Leadership in Organizations, 6th ed.; Pearson/Prentice Hall: Hoboken, NJ, USA, 2006. [Google Scholar]
  53. Hair, J.; Black, W.; Babin, B.; Anderson, R. Multivariate Data Analysis; Pearson: London, UK, 2009; Volume 7. [Google Scholar]
  54. Hu, L.; Bentler, P.M. Cutoff criteria for fit indexes in covariance structure analysis: Conventional criteria versus new alternatives. Struct. Equ. Model. A Multidiscip. J. 1999, 6, 1–55. [Google Scholar] [CrossRef]
  55. Iacobucci, D. Structural equations modeling: Fit Indices, sample size, and advanced topics. J. Consum. Psychol. 2010, 20, 90–98. [Google Scholar] [CrossRef]
  56. Maydeu-Olivares, A.; Shi, D.; Rosseel, Y. Assessing Fit in Structural Equation Models: A Monte-Carlo Evaluation of RMSEA Versus SRMR Confidence Intervals and Tests of Close Fit. Struct. Equ. Model. 2018, 25, 389–402. [Google Scholar] [CrossRef]
  57. Snijders, T.; Bosker, R. Multilevel Analysis: An Introduction to Basic and Advanced Multilevel Modeling, 2nd ed.; Sage: Newcastle upon Tyne, UK, 2012. [Google Scholar]
  58. Chen, T. Team Composition, Emergent States, and Shared Leadership Emergence on Project Teams: A Longitudinal Study; George Mason University: Fairfax, VA, USA, 2014. [Google Scholar]
  59. Wild, N. Antecedent Conditions of Shared Leadership: An Examination of Team Personality Compisition, Shared Leadership, and Team Effectiveness. Master’s Thesis, The University of Tennessee at Chattanooga, Chattanooga, TN, USA, 2015. [Google Scholar]
  60. Zhou, W. Shared Leadership in Teams: An Empirical Study of Dispositional Antecedents. Acad. Manag. Proc. 2013, 2013, 11763. [Google Scholar] [CrossRef]
  61. Lemoine, G.J.; Koseoglu, G.; Ghahremani, H.; Blum, T.C. Importance-Weighted Density: A Shared Leadership Illustration of the Case for Moving Beyond Density and Decentralization in Particularistic Resource Networks. Organ. Res. Methods 2020, 23, 432–456. [Google Scholar] [CrossRef]
Figure 1. Example of density and centrality measures for team members’ perceptions regarding the team’s leadership.
Systems 12 00265 g001
Figure 2. Example of different team configurations in leadership emergence using graphs.
Systems 12 00265 g002
Figure 3. Confirmatory factor analysis at the individual level.
Systems 12 00265 g003
Table 1. Descriptive statistics—data collection.
StudentsTeamsDyadsAverage
Team Size
S.D.
Team Size
MaleFemaleAverage AgeS.D.
Age
177492103.610.611136418.050.84
Table 2. Difference between shared leadership operationalization.
TeamDensity
(Node) (A)
Density
(Dyad) (B)
A–BTeamDensity
(Node) (A)
Density
(Dyad) (B)
A–B
10.7500.5000.250260.5830.1670.417
20.8330.8330.000270.6670.3330.333
30.9170.8330.083280.3330.3330.000
40.6670.6670.000290.6670.3330.333
50.8330.8330.000300.6670.6670.000
60.8330.6670.167310.5000.2000.300
70.6670.3330.333320.6670.6670.000
80.5000.0000.500330.8330.8330.000
90.6670.3330.333340.5000.0000.500
100.6670.3330.333350.3330.1670.167
110.6670.3330.333360.5000.1670.333
120.8330.6670.167370.8330.6670.167
131.0001.0000.000380.8330.6670.167
140.7500.5000.250391.0001.0000.000
150.8330.8330.000400.8000.7000.100
160.5830.5000.083410.6670.3330.333
170.9170.8330.083420.6670.3330.333
180.7500.5000.250430.6670.6670.000
190.8330.6670.167440.5830.3330.250
200.6670.6670.000450.8000.6000.200
211.0001.0000.000460.8330.6670.167
220.6670.3330.333470.6670.3330.333
231.0001.0000.000480.5000.0000.500
240.3330.0000.333490.5000.3330.167
250.6670.3330.333
Table 3. Descriptive statistics—team level: mean, standard deviation, and bivariate correlation.
MeanS.D.(1)(2)(3)(4)(5)(6)(7)
(1) Density (Node)0.730.211.000−0.308 *0.756 **−0.0170.356 *0.2330.380 **
(2) Centrality (Node)0.290.23−0.308 *1.00−0.384 **0.092−0.451 **−0.282 *−0.417 **
(3) Density (Dyad)0.520.310.756 **−0.384 **1.000−0.1350.346 *0.445 **0.644 **
(4) Centralization (Dyad)0.500.33−0.0170.092−0.1351.000−0.137−0.085−0.031
(5) Team Task Cohesion3.360.270.356 *−0.451 **0.261−0.1371.0000.2650.519 **
(6) Team Social Cohesion3.370.360.233−0.282 *0.445 **−0.0850.2651.0000.393 **
(7) Team Performance5.680.540.380 *−0.417 **0.624 **−0.0310.519 **0.393 **1.000
* p-value < 0.05; ** p-value < 0.01.
Table 4. Unstandardized factor loadings of CFA.
EstimateS.E.Est./S.E.p-Value
Task Cohesion byTC10.7900.0382.8390.000
TC20.7810.0392.0780.000
TC30.7700.03919.6500.000
TC40.7580.04018.7160.000
Social Cohesion bySC10.8070.03423.7850.000
SC20.7900.03622.1170.000
SC30.7650.0382.0620.000
SC40.7320.04117.7000.000
SC50.6810.04614.6450.000
CorrelationTask Cohesion–
Social Cohesion
0.5460.0658.3770.000
Table 5. Intra-Class Correlation values.
VariableIntra-Class Correlation
Node ApproachDyad Approach
TC10.3890.387
TC20.4220.425
TC30.3350.333
TC40.3920.392
SC10.4170.419
SC20.3680.370
SC30.3310.334
SC40.4100.410
SC50.3320.330
Table 6. Model results for node approach operationalization of shared leadership.
Within Level (Individual) EstimateS.E.Est./S.E.p-Value
Task Cohesion ByTC10.6170.1294.7740.000
TC20.5760.0936.1750.000
TC30.6790.0967.1050.000
TC40.5690.1154.9570.000
Social Cohesion BySC10.6410.0768.4420.000
SC20.6640.0709.5290.000
SC30.6250.0748.4450.000
SC40.4750.0647.4330.000
SC50.4730.0905.2610.000
CorrelationTask Coh.–Social Coh.0.2070.1181.7550.079
Between Level (Team)
Team Task Cohesion byTTC10.9940.04521.8900.000
TTC20.9970.0492.2790.000
TTC30.9950.08012.4420.000
TTC40.9970.05518.2800.000
Team Social Cohesion byTSC10.9960.03727.0310.000
TSC20.9860.05717.1610.000
TSC30.9980.07812.7470.000
TSC40.9950.04721.3840.000
TSC50.9970.07712.9860.000
Team Task Cohesion onDensity (Node)0.4690.1513.1050.002
Centrality (Node)0.1450.2500.5810.561
Team Social Cohesion onDensity (Node)0.3060.2391.2800.201
Centrality (Node)0.0000.256−0.0010.999
Team Performance onDensity (Node)0.2680.1162.3040.021
Centrality (Node)−0.3460.161−2.1430.032
CorrelationT.Task Coh.–T.Social Coh.
T. Perf.–T. Task Coh.
0.721
0.675
0.138
0.127
5.232
5.307
0.000
0.000
T. Perf.–T. Social Coh.0.7010.1036.7770.000
Table 7. Model results for dyad approach operationalization of shared leadership.
Within Level (Individual) EstimateS.E.Est./S.E.p-Value
Task Cohesion ByTC10.6150.1294.7870.000
TC20.5730.0916.3220.000
TC30.6760.0967.0370.000
TC40.5810.1155.0380.000
Social Cohesion BySC10.6400.0758.5330.000
SC20.6620.0699.6420.000
SC30.6270.0738.5290.000
SC40.4740.0627.6570.000
SC50.4730.0905.2350.000
CorrelationTask Coh.–Social Coh.0.1990.1191.6810.093
Between Level (Team)
Team Task Cohesion byTTC10.9950.04522.1950.000
TTC20.9970.0492.1900.000
TTC30.9950.07912.5460.000
TTC40.9960.05717.6200.000
Team Social Cohesion byTSC10.9960.03726.6860.000
TSC20.9860.05717.3360.000
TSC30.9980.07812.8460.000
TSC40.9950.04522.1140.000
TSC50.9970.07513.2710.000
Team Task Cohesion onDensity (Node)0.4530.1812.4990.012
Centrality (Node)−0.2730.145−1.8810.363
Team Social Cohesion onDensity (Node)0.4020.1612.5020.012
Centrality (Node)−0.1370.148−0.9100.363
Team Performance onDensity (Node)0.6850.0867.9420.000
Centrality (Node)−0.1370.120−1.1450.252
CorrelationT.Task Coh.–T.Social Coh.
T. Perf.–T. Task Coh.
0.703
0.573
0.156
0.138
4.517
4.138
0.000
0.000
T. Perf.–T. Social Coh.0.6450.1225.2670.000
Disclaimer/Publisher’s Note: The statements, opinions and data contained in all publications are solely those of the individual author(s) and contributor(s) and not of MDPI and/or the editor(s). MDPI and/or the editor(s) disclaim responsibility for any injury to people or property resulting from any ideas, methods, instructions or products referred to in the content.

